- 1State Key Laboratory of HVDC (Electric Power Research Institute), China Southern Power Grid Co., Ltd., Guangzhou, Guangdong, China
- 2School of Electric Power, South China University of Technology, Guangzhou, Guangdong, China
Energy storage systems (ESSs) installed in distribution networks have been widely adopted for frequency regulation services due to their rapid response and flexibility. Unlike existing ESS design methods which focus on control strategies, this paper proposes a new method based on an ESS equivalent aggregated model (EAM) for calculating the capacity and the droop of an ESS to maintain the system frequency nadir and quasi-steady state frequency using low-order functions. The proposed method 1) uses first-order functions to describe the frequency response (FR) of synchronous generators (SGs); 2) ignores the control strategies of SGs, making the method systematic and allowing it to avoid analyzing complex high-order functions; and 3) is suitable for low inertia systems. The applicability and accuracy of the method is demonstrated using a modified four-generator two-area (4G2A) system.
1 Introduction
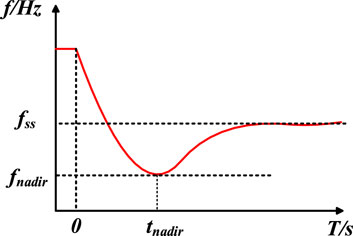
Frequency is a crucial index for measuring power quality, representing the balance of active power in power systems (He and Wen, 2021). With the increasing penetration of renewable energy sources, the inertia of power systems is decreasing and the effective maintenance of the frequency nadir (fnadir) and quasi-steady state frequency (fss) consequently becomes challenging, posing a threat to system stability.
Therefore, system operators all over the world are focused on setting a series of frequency response (FR) services. Among FR energy sources, energy storage systems (ESSs) installed in distribution networks have been widely used (GB/T 30370-2013, 2013; Rana et al., 2023). The National Grid in Britain has set various dynamic frequency control products (AEMO, 2023), the Australian Energy Market Operator (AEMO) has proposed a Contingency Frequency Control Ancillary Service (FCAS) and a Regulation FCAS (National Grid ESO, 2019), and in Guangdong, China, a LiFePO4 (LFP) battery is also used as a frequency control product (Wang et al., 2023). However, the design of the aforementioned ESSs relies entirely on simulation analysis. Systematic methods for system operators to evaluate the frequency support ability of an ESS and calculate the main parameters of an ESS have not been proposed.
ESSs can function both as generators and loads. Existing research mainly focuses on the construction of the ESS FR model. In these studies, the classical FR model proposed by Anderson and Mirheydar (1990) has been widely used. Based on the classical model, researchers have developed an ESS transfer function model (Aik, 2006; Yang et al., 2022). In Chen et al. (2016), the penetration rate of an ESS is considered to improve the FR model. However, ESS FR models based on the classical FR model only consider the reheat turbines of synchronous generators (SGs); thus, they are not suitable for systems with other types of gas/hydraulic turbines. To avoid this limitation, generic FR models have been proposed by Gao et al. (2021), Ju et al. (2021), and Zhang et al. (2021). In Ju et al. (2021) and Gao et al. (2021), the FR of an SG is described as an nth-order function, and in Zhang et al. (2021), all generation sources are presented as lead-lag functions, and the FR of the system can be described as the classical FR model. Nevertheless, generic FR models present the system frequency characteristics in an aggregated manner, making it difficult to distinguish the FR of an ESS.
To precisely evaluate the frequency support ability of an ESS, many ESS control strategies have been proposed. An ESS management strategy was proposed by Ben Elghali et al. (2019) to determine the optimal capacity of an ESS based on system frequency, and an ESS shaping strategy was introduced by Jiang et al. (2021) to maintain the fnadir with the optimal cost of an ESS (Mustafa and Altinoluk H, 2023) and aging minimization (Wang et al., 2020). In Xiong et al. (2021), first-order functions were used to size an ESS based on the rate of change of frequency (RoCoF) to avoid dealing with high-order transfer functions. Recently, ESS control schemes employing robust control (Xiong et al., 2020), grid-tied inverter design (Xiong et al., 2016), self-adaptive control (Wu et al., 2020), predictive models based on the uncertainty of renewable sources (Zarei and Ghaffarzadeh, 2024), and ESS generation (Baker et al., 2017; Zarei and Ghaffarzadeh, 2024) have been used to design ESSs. However, these methods are only suitable for specific power grids, limiting their broader applicability. Moreover, the control strategies always ignore the capacity limit and droop limit of an ESS and regard the frequency response output of an ESS as a step change, resulting in significant errors in evaluating the frequency support ability of an ESS.
In this paper, an ESS equivalent aggregated model (EAM) is introduced and a new method named the Energy Storage Designing Method (ESDM) based on an EAM is proposed. An EAM consists of a multistep model named FM to maintain the fnadir and a model named QM to maintain the fss. For both FM and QM, which include a first-order system FR model and a first-order ESS FR model, it is convenient for system operators to evaluate and analyze the frequency support ability of an ESS and lay the foundation of ESS sizing. Since renewable sources such as wind farms and photovoltaic (PV) panels always work in Maximum Power Point Tracking (MPPT) mode (Bai et al., 2015; Mohanty et al., 2016) and are strongly related to the weather, and the participation of renewable sources in frequency modulation is not mandatory at present (Guangfu, 2020; Guangfu, 2022), SGs and ESSs are still the main resources for frequency regulation. Therefore, the proposed ESDM can effectively calculate the capacity and the droop of an ESS based on a historical event and therefore accurately maintain the fnadir and fss of the power system.
2 System equivalent frequency response model
When there is an imbalance in the active power of the power system, the system’s primary frequency response (PFR) can be described in Figure 1, and it can also be described by the classical swing equation as shown in (Eq. 1).
where H [s] is the inertia constant, D [p.u.] is the equivalent damping factor, ΔPm [p.u.] is the mechanical power deviation from generators, and ΔPd [p.u.] is the power disturbance. During a frequency event, the system frequency must have a nadir. Due to the monotone decreasing and converging of the step response of the first-order system, if only the fnadir is considered, there must be a first-order power function with a minimum value that is equal to the fnadir as shown in Figure 2A. Similar to the fnadir, the fss can also be described as a first-order function as shown in Figure 2B.
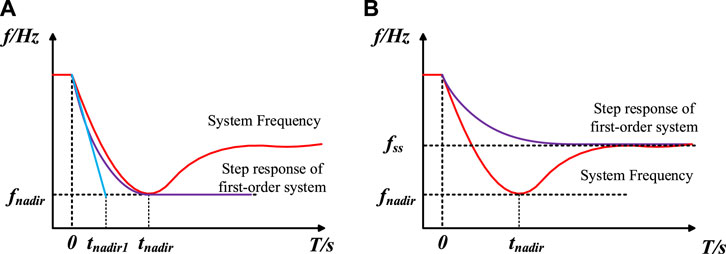
Figure 2. (A) Representation of fnadir using the step response of the first-order system, and (B) Representation of fss using the step response of the first-order system.
In Figure 2, tnadir1 is the time at which the system reaches the frequency nadir at the maximum rate of the change of frequency (RoCoFmax), while tnadir is the time at which the system reaches the fnadir.
Therefore, the system equivalent FR (SEFR) model is depicted in Figure 3. If K = K1, SEFR can be used to predict the fnadir after a frequency event, with ∆f = ∆fnadir at t = ∞. Similarly, when K = K2, SEFR is used to forecast the fss with ∆f = fss at t = ∞. According to Figure 3, the SEFR model can be shown as follows:
Assuming that the load disturbance during a frequency event undergoes a step change, with an amplitude of ΔPd, the time-domain expression of the system frequency can be obtained by solving (Eq. 3).
Δf*(t) is the per unit system frequency. It is clear from (Eq. 3) that Δf*(t) is an increasing function, so its maximum value can be calculated as shown in (Eq. 4).
For a historical frequency event, the fnadir and fss can be acquired from system operators so that K1 and K2 can be easily calculated.
where fN is the base of system frequency (i.e., 50 Hz or 60 Hz).
As for the fss, if only PFR is considered, SEFR can accurately symbolize the fss because both the actual value and SEFR value are calculated when the time approaches infinity, i.e., t = ∞. To analyze the accuracy of the SEFR in representing the fnadir, a parameter named E is introduced to symbolize the error between the actual fnadir and the SEFR value at tnadir. E can be shown as
According to (1), RoCoFmax can be described as (7), and if frequency continues to fall at RoCoFmax, tnadir1 can be calculated as follows:
A parameter named φ is proposed to describe the relationship between tnadir1 and tnadir, so that E can be described as
where φ is a constant and φ ≤ 1.
According to Gao et al. (2021), tnadir usually falls in 8.5 s–10 s, and in many areas, RoCoFmax can be very large (Xiong et al., 2021); thus, φ can be very large so that E can be very small.
3 The proposed EAM
The parameters of an ESS are always designed based on the maximum power disturbance (ΔPdmax), which means the utilization ratio of an ESS will be quite low, and an ESS with a large droop and capacity is not energy-efficient. Since ΔPdmax is a small probability event, an ESS designed based on ΔPdmax is not flexible in dealing with normal ΔPd.
3.1 The proposed FM
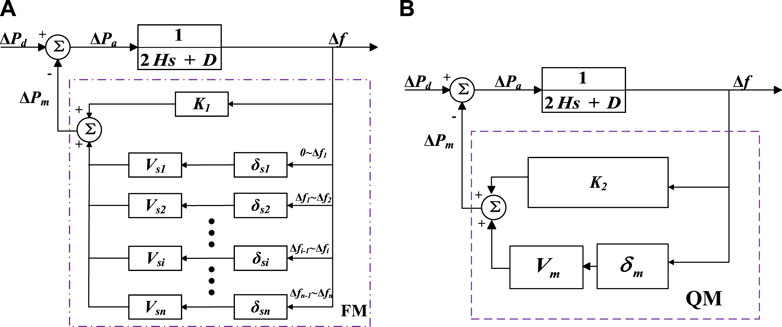
A new model named FM is proposed to calculate the parameters of an ESS based on different levels of ΔPd and different required frequency deviations as shown in Figure 4A.
Vsi and δsi, respectively, represent the equivalent capacity and droop of an ESS for addressing frequency events with a power disturbance level ΔPdi, and Δfi is the system-required frequency maximum deviation at ΔPdi.
The principle of the ESS FM model is that different levels of power disturbances have different occurrence probabilities. For example, a% of disturbance lies in 0 to ΔPd1, b% of disturbance lies in ΔPd1 to ΔPd2, and others lie in ΔPd2 to ΔPdmax. Therefore, according to the range of power disturbances that need to be addressed, system operators can design the Vsi and δsi of an ESS using the FM model, as depicted in Figure 5, and choose the appropriate combinations of Vsi and δsi based on their economic or technical needs.
The Δfmax shown in Figure 5 can be selected as load-shedding frequency deviation to deal with ΔPdmax of the power system, and the frequency response characteristic of an ESS at ΔPdi should be divided into three parts to deal with different disturbance levels according to FM. The product of Vsi and δsi can be described as (10).
where Δfi is the knee point of FR of an ESS and can also be illustrated as the system-required frequency maximum deviation at ΔPdi which can be selected by system operators. Δfnadiri symbolizes the frequency deviation at ΔPdi from a historical frequency event which can be easily acquired from system operators. In applications, system operators can select the Δfi based on their economic or technical needs of an ESS and the stability of the power grid.
3.2 The proposed QM
As the proposed FM model does not consider detailed governor-turbine dynamics, it cannot be used to represent frequency dynamics after the nadir. To address this limitation, the QM model is proposed to characterize the fss, as illustrated in Figure 4B.
The product of an ESS’s capacity, Vm, and droop, δm, can be calculated as
System operators always set up a rigorous limitation of fss deviation (Δfss), so the calculation of Vm and δm can be based on the ΔPdmax, where the Δfssmax is the required maximum Δfss.
3.3 The proposed EAM
The EAM includes the FM model and the QM model to deal with the fnadir and fss, as mentioned above. The timing of switching between FM and QM depends on ξ and the time tnadir. The tnadir can be acquired from system operators and is smaller when an ESS takes part in FR; thus, it is suitable that the moment of switching should be greater than tnadir. ξ is introduced to measure the fss without the QM mode’s participation.
3.4 Constraint condition in the ESDM
This section compares the energy efficiency of ESS designs based on different levels of ΔPd and ΔPdmax to establish the constraint conditions of the ESDM. If a power system experiences a disturbance ΔPdm, according to the ESDM, the capacity and droop of an ESS are Vsm and δsm, respectively. The output power of an ESS, Pm1, is given by (Eq. 13).
If Vsmδsm < Vsmaxδsmas (the product of Vsm and δsm is based on ΔPdm), an ESS designed through the ESDM is more energy-saving.
4 Simulation results
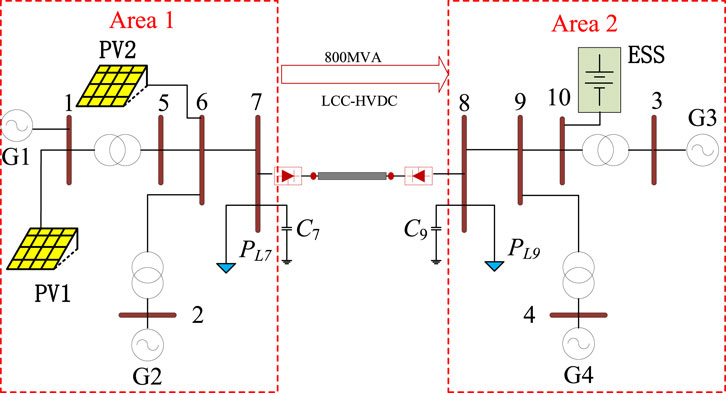
The modified four-generator two-area (4G2A) system with PV penetration and an line commutated converter based High Voltage Direct Current (LCC-HVDC) connection is used for simulation in this section, as shown in Figure 6.
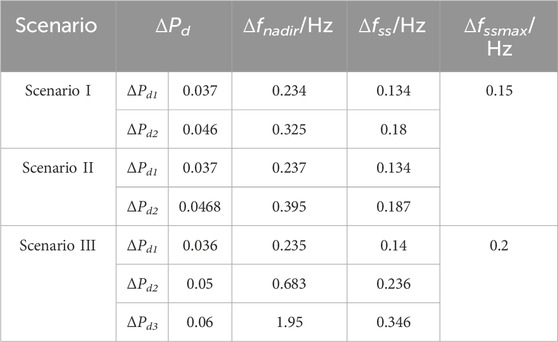
G1–G4 represent synchronous generators; PL7 and PL8 are the equivalent loads at bus 7 and bus 9, respectively; and C7 and C8 represent reactive compensations. A grid-connected ESS is connected to bus 10. Grid-connected PVs, named PV1 and PV2, are connected to bus 1 and 6. The power rating of each synchronous generator is 900 MVA, and the capacity of LCC-HVDC is 800 MVA, resulting in the power rating of the receiving system (Area 2) being 2600 MVA. The parameters of the simulation system are from Kundur (1994). The mechanical power gain factor is 1 p.u., the power generated by the high-pressure turbine is 0.4 p.u., the reheat time constant is 8 s, and the equivalent damping factor is 0. The system frequency characteristics are listed in Table 1.
4.1 Installed PV capacity of 33.3%
In scenario I, the power ratings of PV1 and PV2 are both 450 MVA. Furthermore, 90% of ΔPd is below 0.037 p.u., and the system’s ΔPdmax is 0.046 p.u.
According to (10), if Δf1 is selected as 0.2 Hz, and Δfmax is 0.3 Hz, Vsi, δsi should satisfy Vs1δs1 ≥ 1.613 and Vs2δs2 ≥ 0.708. According to (12), ξ = 0.172 Hz, and according to (11), Vmδm ≥ 3.067. The simulation results are shown in Figure 7.
It can be seen in Figure 7 that FM and QM can accurately describe the fnadir and fss, respectively. The orange curve in Figure 7 shows that the ESDM effectively maintains fnadir and fss. Considering that Δfss is smaller than Δfssmax when ΔPd = 0.037, the ESS will not switch to fss maintaining mode.
4.2 Installed PV capacity of 66.7%
In scenarios II and III, G1 is replaced with PV1 and PV2, both with capacities of 900 MVA.
4.2.1 Scenario II
In scenario II, 90% of ΔPd is below 0.037 p.u., and the system’s ΔPdmax is 0.0468 p.u.
According to (10), if Δf1 is selected as 0.2 Hz, and Δfmax is 0.3 Hz, Vsi, δsi should satisfy Vs1δs1 ≥ 1.733 and Vs2δs2 ≥ 2.251. According to (12), ξ = 0.167 Hz, and according to (11), Vmδm ≥ 3.704. Taking ΔPdmax as an example, simulation results are shown in Figure 8.

Figure 8. (A) FR of Scenario II at Switching moment = 10 s, and (B) FR of Scenario II at Switching moment = 7 s.
Figure 8 shows different switching times and combinations of capacity and droop of an ESS. It can be seen that FM and QM can accurately describe the fnadir and fss, respectively. Additionally, the orange curve in Figure 8 shows that the ESDM effectively evaluates the frequency support ability of an ESS and maintains fnadir and fss.
4.2.2 Scenario III
In scenario III, 40% of ΔPd is below 0.037 p.u., 50% of ΔPd lies between 0.037 p.u. and 0.05 p.u., and ΔPdmax is 0.06 p. u. According to (10), if Δf1 is selected as 0.2 Hz, Δf2 is selected as 0.5 Hz, and Δfmax is 0.8 Hz, Vsi, δsi should satisfy Vs1δs1 ≥ 1.609, Vs2δs2 ≥ 1.608, and Vs3δs3 ≥ 2.654.
Eq. 12 yields ξ = 0.21 Hz for ΔPd2 and ξ = 0.276 Hz for ΔPd3, indicating that the ESS should be in fss maintaining mode and Vmδm ≥ 7.595 according to (11).
Figure 9 demonstrates that the ESDM maintains fnadir and fss not only at ΔPdmax but also at various ΔPd levels (as shown in Figure 9A). For instance, in Figure 9A, the fnadir is larger than 59.5 Hz but lower than 59.8 Hz, which means that ΔPd is larger than 0.036 and smaller than 0.05. Therefore, the ESS should be switched to fss maintaining mode for added assurance.
4.3 Discussion
From Figures 7–9, it is evident that the ESS based on EAM is conservative at the fnadir but exhibits some error at the fss. That is because of the neglect of the coupling relationship between active power and voltage in the model. With an increase in power disturbance, the active power support increases, leading to higher line losses and reduced load voltage. Taking the system load surge as an example, the active power of the system increases so that the load voltage decreases. As for the constant impedance load, active power is positively correlated with the voltage. Consequently, the actual power disturbance is lower than expected. With the frequency support provided by an ESS and SGs, the system frequency is recovered and the load voltage therefore increases. The increasing voltage increases the power disturbance, leading to tiny errors in maintaining the fss (as observed by the red lines (59.84 Hz) in 10; the error of 0.01 Hz is smaller than the dead-band of 0.015 Hz (GB/T 40595-2021, 2021)). In simulation scenarios, D is set as zero but cannot be zero in reality. As for FM and QM models used for the ESS calculation, D is not one of the input parameters according to (10) and (11), and all input parameters are from system operators, so D will not influence the accuracy of the models.
5 Conclusion
This paper proposes a method for calculating the capacity and droop of an ESS based on historical frequency events to maintain the fnadir and fss. The proposed method is convenient and accurate for system operators to evaluate the frequency support ability of an ESS and design ESSs. Furthermore, an ESS based on the ESDM proves to be energy-efficient. Given that all parameters are provided by system operators, the method holds significant practical applications. Moreover, the proposed method serves as a foundation for ESS sizing and control of distribution network ESSs.
Data availability statement
The raw data supporting the conclusion of this article will be made available by the authors, without undue reservation.
Author contributions
SD: Methodology, project administration, supervision, writing–original draft, and writing–review and editing. JZ: Data curation, investigation, methodology, validation, writing–original draft, and writing–review and editing. LY: Methodology, project administration, supervision, and writing–original draft. ZC: Methodology, project administration, supervision, and writing–review and editing.
Funding
The author(s) declare that financial support was received for the research, authorship, and/or publication of this article. The research is supported by State Key Laboratory of HVDC (Grant No. SKLHVDC-2022-KF-02).
Conflict of interest
Authors SD and LY were employed by China Southern Power Grid Co., Ltd.
The remaining authors declare that the research was conducted in the absence of any commercial or financial relationships that could be construed as a potential conflict of interest.
Publisher’s note
All claims expressed in this article are solely those of the authors and do not necessarily represent those of their affiliated organizations, or those of the publisher, the editors, and the reviewers. Any product that may be evaluated in this article, or claim that may be made by its manufacturer, is not guaranteed or endorsed by the publisher.
References
AEMO (2023). Market ancillary service specification 8.1. Available at: https://aemo.com.au/media/files/stakeholder_consultation/consultations/nem-consultations/2023/primary-freq-resp-norm-op-conditions/market-ancillary-services-specification-v81.pdf?la=en.
Aik, D. L. H. (2006). A general-order system frequency response model incorporating load shedding: analytic modeling and applications. IEEE Trans. Power Syst. 21 (2), 709–717. doi:10.1109/tpwrs.2006.873123
Anderson, P. M., and Mirheydar, M. (1990). A low-order system frequency response model. IEEE Trans. Power Syst. 5 (3), 720–729. doi:10.1109/59.65898
Bai, Y., Kou, B., and Chan, C. C. (2015). A simple structure passive MPPT standalone wind turbine generator system. IEEE Trans. Magnetics 51 (11), 1–4. doi:10.1109/tmag.2015.2439043
Baker, K., Hug, G., and Li, X. (2017). Energy storage sizing taking into account forecast uncertainties and receding horizon operation. IEEE Trans. Sustain. Energy 8 (1), 331–340. doi:10.1109/tste.2016.2599074
Ben Elghali, S., Outbib, R., and Benbouzid, M. (2019). Selecting and optimal sizing of hybridized energy storage systems for tidal energy integration into power grid. J. Mod. Power Syst. Clean Energy 7 (1), 113–122. doi:10.1007/s40565-018-0442-0
Chen, S., Zhang, T., Gooi, H. B., Masiello, R. D., and Katzenstein, W. (2016). Penetration rate and effectiveness studies of aggregated BESS for frequency regulation. IEEE Trans. Smart Grid 7 (1), 167–177. doi:10.1109/pesgm.2016.7741318
Gao, H., Xin, H., Huang, L., Xu, T., Ju, P., Qin, X., et al. (2021). Common mode frequency analysis and characteristic quantification of new energy power system. Chin. J. Electr. Eng. 41 (3), 890–900. doi:10.13334/j.0258-8013.pcsee.201897
GB/T 30370-2013 (2013). Guide of primary frequency control test and performance acceptance for thermal power generating units. Beijing: China Standards Press.
GB/T 40595-2021 (2021). Guide for technology and test on primary frequency control of grid-connected power resource. Beijing: China Standards Press.
Guangfu (2020). State Grid is trying to solve the problem of high proportion of new energy consumption. Available at: https://guangfu.bjx.com.cn/news/20200930/1108031.shtml.
Guangfu (2022). The installed new energy capacity of East China power grid exceeded 100 million kilowatts. Available at: https://guangfu.bjx.com.cn/news/20220314/1210096.shtml.
He, Y., and Wen, Z. (2021) Power system analysis. Wuhan, China: Huazhong University of Science and Technology Press.
Jiang, Y., Cohn, E., Vorobev, P., and Mallada, E. (2021). Storage-based frequency shaping control. IEEE Trans. Power Syst. 36 (6), 5006–5019. doi:10.1109/tpwrs.2021.3072833
Ju, P., Zheng, Y., Jin, Y., Qin, C., Jiang, Y., and Cao, L. (2021). Analytic assessment of the power system frequency security. IET Generation. Transm. Distribution 15 (15), 2215–2225. doi:10.1049/gtd2.12171
Mohanty, S., Subudhi, B., and Ray, P. K. (2016). A new MPPT design using grey wolf optimization technique for photovoltaic system under partial shading conditions. IEEE Trans. Sustain. Energy 7 (1), 181–188. doi:10.1109/tste.2015.2482120
Mustafa, H., and Altinoluk H, S. (2023). Current and future prospective for battery controllers of solar PV integrated battery energy storage systems. Front. Energy Res. 11. doi:10.3389/fenrg.2023.1139255
National Grid ESO (2019). Future of frequency response industry update. Available at: https://www.nationalgrideso.com/document/138861/download.
Rana, M. M., Uddin, M., Sarkar, M. R., Meraj, S. T., Shafiullah, G. M., Muyeen, S. M., et al. (2023). Applications of energy storage systems in power grids with and without renewable energy integration — a comprehensive review. J. Energy Storage 68, 107811–152X. 107811. doi:10.1016/j.est.2023.107811
Wang, F., Li, B., Xia, T., Peng, M., Wang, S., et al. (2023). Economic research on energy storage auxiliary frequency regulation of lithium iron phosphate battery for 2×600 MW coal-fired unit in Guangdong. South. Energy Constr. 10 (06), 71–77. doi:10.16516/j.gedi.issn2095-8676.2023.06.008
Wang, S., Liu, S., Yang, F., Bai, X., and Yue, C. (2020). Novel power allocation approach in a battery storage power station for aging minimization. Front. Energy Res. 7. doi:10.3389/fenrg.2019.00166
Wu, Q., Song, X., Zhang, J., Yu, H., Huang, J., Dai, H., et al. (2020). Study on self-adaptation comprehensive strategy of battery energy storage in primary frequency regulation of power grid. Power Grid Technol. 44 (10), 3829–3836. doi:10.13335/j.1000-3673.pst.2019.1214
Xiong, L., Liu, X., Zhang, D., and Liu, Y. (2021). Rapid power compensation-based frequency response strategy for low-inertia power systems. IEEE J. Emerg. Sel. Top. Power Electron. 9 (4), 4500–4513. doi:10.1109/jestpe.2020.3032063
Xiong, L., Liu, X., Zhao, C., and Zhuo, F. (2020). A fast and robust real-time detection algorithm of decaying DC transient and harmonic components in three-phase systems. IEEE Trans. Power Electron. 35 (4), 3332–3336. doi:10.1109/tpel.2019.2940891
Xiong, L., Zhuo, F., Wang, F., Liu, X., Chen, Y., Zhu, M., et al. (2016). Static synchronous generator model: a new perspective to investigate dynamic characteristics and stability issues of grid-tied pwm inverter. IEEE Trans. Power Electron. 31 (9), 6264–6280. doi:10.1109/tpel.2015.2498933
Yang, Y., Peng, J. C.-H., Ye, C., and Ye, Z.-S. (2022). Optimal reserve allocation with simulation-driven frequency dynamic constraint: a distributionally robust approach. IEEE Trans. Circuits Syst. II Express Briefs 69 (11), 4483–4487. doi:10.1109/tcsii.2022.3184969
Zarei, A., and Ghaffarzadeh, N. (2024). Optimal demand response scheduling and voltage reinforcement in distribution grids incorporating uncertainties of energy resources, placement of energy storages, and aggregated flexible loads. Front. Energy Res. 12. doi:10.3389/fenrg.2024.1361809
Keywords: energy storage system (ESS), distribution network, synchronous generator (SG), frequency response (FR), capacity, droop
Citation: Duan S, Zhang J, Yu L and Cai Z (2024) Development of an equivalent system frequency response model based on aggregation of distributed energy storage systems. Front. Energy Res. 12:1427593. doi: 10.3389/fenrg.2024.1427593
Received: 04 May 2024; Accepted: 29 May 2024;
Published: 08 July 2024.
Edited by:
Liansong Xiong, Xi’an Jiaotong University, ChinaReviewed by:
Nan Chen, University of Birmingham, United KingdomGen Li, Technical University of Denmark, Denmark
Copyright © 2024 Duan, Zhang, Yu and Cai. This is an open-access article distributed under the terms of the Creative Commons Attribution License (CC BY). The use, distribution or reproduction in other forums is permitted, provided the original author(s) and the copyright owner(s) are credited and that the original publication in this journal is cited, in accordance with accepted academic practice. No use, distribution or reproduction is permitted which does not comply with these terms.
*Correspondence: Jinjia Zhang, ZXBqaW5qaWF6aGFuZ0BtYWlsLnNjdXQuZWR1LmNu
 Shuyin Duan
 Jinjia Zhang
 Lei Yu
 Zexiang Cai2