 Hegazy Rezk
 Enas Taha Sayed
- 1Department of Electrical Engineering, College of Engineering in Wadi Alddawasir, Prince Sattam bin Abdulaziz University, Al-Kharj, Saudi Arabia
- 2Chemical Engineering Department, Faculty of Engineering, Minia University, Minya, Egypt
Background: The target of this paper is to improve the performance of the microbial electrolysis cell (MEC). The performance of MEC including bio-hydrogen production and energy recovery is depending on the values of three controlling parameters including buffer concentration, dilution factor, and applied voltage.
Problem: Therefore, defining the optimal values of three controlling parameters is the challenge of the work.
Methodology: In this paper the artificial gorilla troops optimization has been combined with and ANFIS modelling to increase the bio-hydrogen production from MEC. At first, using measured data, a model is created to simulate the MEC in terms of three controlling parameters. Then, for first time, an artificial gorilla troops optimization (AGTO) has been used to determine the optimal values of buffer concentration, dilution factor, and applied voltage to boost simultaneously bio-hydrogen production and energy recovery of MEC. To demonstrate the superiority of integration between ANFIS modelling and AGTO, the obtained results are compared with RSM methodology, and artificial neural network integrated with particle swarm optimization.
Findings: For hydrogen yield model, the RMSE lowered from 67.5 using RSM to 5.562 using ANFIS (decreased by 91.7%) as compared to RSM. The R-square for prediction rises from 0.94 (using RSM) to 0.99 (using ANFIS) by about 5.32%. For the ANFIS model of energy recovery, the RMSE decreased from 31.7 to 2.83 utilising ANFIS, a decrease of 91%. The R-square for prediction rises from 0.95 (using RSM) to 0.986 (using ANFIS) by about 3.8%. Compared with measured data, the integration between ANFIS and AGTO succeed to increase the hydrogen yield from 576.3 mL/g-VS to 843.32 mL/g-VS. in sum, the total performance of the MEC has been increased by 34.74%, 29.9% and 24.38% respectively compared to measured data, RSM and ANN-PSO.
1 Introduction
Eichhornia crassipes, generally known as water hyacinth, is a toxic weed that can seriously affect aquatic habitats. It is renowned for its quick development and capacity for rapid spread, which frequently results in the depletion of nutrients and oxygen in the water it inhabits (Gaurav et al., 2020). Water hyacinth grows into thick mats that cover the water’s surface, preventing algae and plants from receiving sunlight. This prevents photosynthesis and can throw off the aquatic ecosystem’s delicate equilibrium. The tight mats also prevent fish and other marine species from moving about, limiting their access to food, breeding grounds, and refuge. Additionally, the massive amounts of oxygen consumed by water hyacinth during its decomposition and death further reduce the already low oxygen levels in water (Liang et al., 2019). The dissolved oxygen level, which is essential for fish and other aquatic species to survive, may drop due to this. Manual or mechanical removal, biological control agents, and the application of herbicides are all methods used to manage and control water hyacinth. These techniques seek to counteract water hyacinth’s harmful effects and bring afflicted ecosystems back into equilibrium.
The water hyacinth has drawn interest due to its quick growth and potential to produce biofuels. Since it contains a lot of cellulose and hemicellulose, it can be used to generate biofuels, mainly hydrogen (H2) (Tran and Phan, 2022). Since hydrogen has no emissions when used as fuel, it is considered a sustainable and environmentally beneficial energy source. There are other ways to create hydrogen, including converting biomass like water hyacinth. Scientists and researchers have been looking at ways to turn water hyacinth into hydrogen gas through procedures including anaerobic digestion, fermentation, gasification, and more. These methods seek to convert the plant’s biomass into useful energy sources, including hydrogen gas (Wazeri et al., 2018).
The generation of biohydrogen has the potential to be a flexible and sustainable energy source with a wide range of uses (Morya et al., 2022). Hydrogen gas can be used as a clean fuel for heating systems, electric vehicles, and power plants. It can also be used in industrial operations like oil refining and ammonia manufacture. Furthermore, bio-hydrogen has the potential to serve as a reserve energy source, aiding in grid stabilization at times of peak demand or low renewable energy production. Hydrogen is produced via the intriguing biological process known as dark fermentation. Its low operating energy usage, which makes it a more environmentally responsible choice than other technologies, is one of its key advantages. Dark fermentation is also more adaptable in terms of operating settings because it is not light-dependent, unlike some different types of fermentation. Dark fermentation can produce H2 sustainably and can make use of a variety of biomass sources, giving it another critical advantage (Dahiya et al., 2021).
The two-stage method, DF-MEC, which combines dark fermentation with a microbial electrolysis cell (MEC), is headed in the right direction. With this method, it is possible to increase the generation of hydrogen and recover energy from biomass resources, such as water hyacinth. The fast-growing and plentiful water hyacinth plant has the potential to be used as a helpful feedstock in this process (Cheng et al., 2022). Anaerobic bacteria are involved in the biological process known as “dark fermentation,” which converts organic material into simpler chemicals like hydrogen gas. The total amount of hydrogen produced can be boosted by combining this procedure with a microbial electrolysis cell (MEC), which uses an electric potential to accelerate the hydrogen evolution reaction. This two-step process has several advantages. It permits energy recovery from biomass resources and efficient hydrogen synthesis. Dark fermentation and MEC can be combined to produce more hydrogen and recover energy in the form of electric current by using the by-products of the dark fermentation process in the MEC (Jadhav et al., 2022).
The performance of MECs fed with DFE from a variety of biomasses, such as wheat powder (Tuna et al., 2009) and palm oil mill (Krishnan et al., 2019), has been successfully improved in numerous investigations to date. Several effective auxiliary procedures, for example, centrifugation (Zhou et al., 2017), buffering (Wang et al., 2011), and high applied voltage, have been used in these investigations between DF and MEC. In particular, the WH-derived DFE, the interaction evaluation, and optimization for these auxiliary processes in DFE-fed MECs are covered in (Phan et al., 2023).
An effective model of hydrogen and energy recovery in MEC by artificial neural network and ANFIS has been developed by Hosseinzadeh et al. (2020). The main findings demonstrated that ANFIS models showed better prediction strengths than ANN models. In the same direction, Fathy et al. (2023) built an ANFIS model of MEC on terms of incubation temperature, initial potential of hydrogen (pH), and COD concentration. The results confirmed that the bio-hydrogen production is increased by around 6.7% compared to RSM. Hong et al. (2021) used fuzzy logic control (FLC) to regulate the MEC. The results demonstrated that the FLC resulted in a desirable hydrogen output via MEC over the PI and PID controller in terms of shorter settling time and lesser overshoot.
In the current research work, the performance of MEC-DE was improved using artificial intelligence and recent artificial gorilla troops optimization. At first, using measured data, ANFIS model is created to simulate the MEC-DE in terms of buffer concentration, dilution factor, and applied voltage. ANFIS is innovative hybrid model combines neural networks’ flexibility with fuzzy logic’s interpretability. It can simulate intricate and nonlinear connections between several input variables and one output variable (banza et al., 2023). ANFIS could be used to model different aspects of a microbial electrolysis cell’s (MEC) operation, including the relationship between the MEC’s performance (such hydrogen production) and its input parameters (such as pH, and electrode design). Typically begin by gathering experimental data to train and validate the model before using ANFIS to simulate MECs. Input-output pairs that include the numerous parameters to consider and the performance metric you are interested in make up this data. Using an approach like the hybrid learning algorithm, which combines gradient descent and least-squares estimation, ANFIS model can be trained (Shoorehdeli et al., 2009). During the training, the ANFIS model’s parameters are adjusted to reduce the difference between the model’s predictions and the actual output values. Using new input data, the ANFIS model can be utilized to simulate various scenarios or generate predictions after training.
Then, for first time, an artificial gorilla troops optimization (AGTO) has been applied to estimate the best values of three controlling input parameters to boost simultaneously hydrogen yield and energy recovery of MEC-DE. Because of the AGTO optimizer’s speedy convergence time, it may quickly locate ideal or almost ideal solutions (Abdollahzadeh et al., 2021). When solving complex optimization tasks, this efficiency is beneficial. Numerous problem types, including continuous, discrete, and mixed-variable optimization, can be accommodated by it. The AGTO achieves a balance between searching for prospective solutions in the search space and taking advantage of promising optimization opportunities. This equilibrium improves the algorithm’s ability to explore while preventing premature convergence. The AGTO optimizer uses a simple optimization procedure. Researchers and practitioners can use it because it is simple to apply and does not need intricate parameter adjusting. To confirm the robustness of AGTO, the optimized results are compared with particle swarm optimization (PSO), grey wolf optimization (GWO), cuckoo search (CS), slime mould algorithm (SMA) and equilibrium optimization (EO).
The main contributions of the paper can be summarized as follows.
✓ Devolving new ANFIS model to simulate the MEC-DE in terms of buffer concentration, dilution factor, and applied voltage.
✓ For first time, applying red-tailed hawk optimizer to determine the optimal values of buffer concentration, dilution factor, and applied voltage.
✓ Boosting simultaneously hydrogen yield and energy recovery of MEC-DE.
✓ Demonstration the superiority of the integration between ANFIS modelling and AGTO.
2 Data
The measured data with permeation (License Number-5778250508058) is shown in Table 1 (Phan et al., 2023). Two single-chamber MEC reactors are considered (Phan et al., 2023). In brief, 400-mL cylinder-shaped glass bottles with 0.3 L of working volume has been used for the MEC reactors. Table. 1 the dataset presents the relationship between the output parameters (hydrogen yield and energy recovery) and three input parameters (buffer concentration, dilution factor and applied voltage) of the MEC-DE. The total number of experiments is twenty. 70% of the data has been used for training the ANFIS model of the MEC-DE and 30% is used for the testing purpose. The minimum and maximum limits of buffer concentration (25–75 mM), dilution factor (2-6 folds), and applied voltage (0.4–1.0 V) were examined to boost the MEC’s performance.
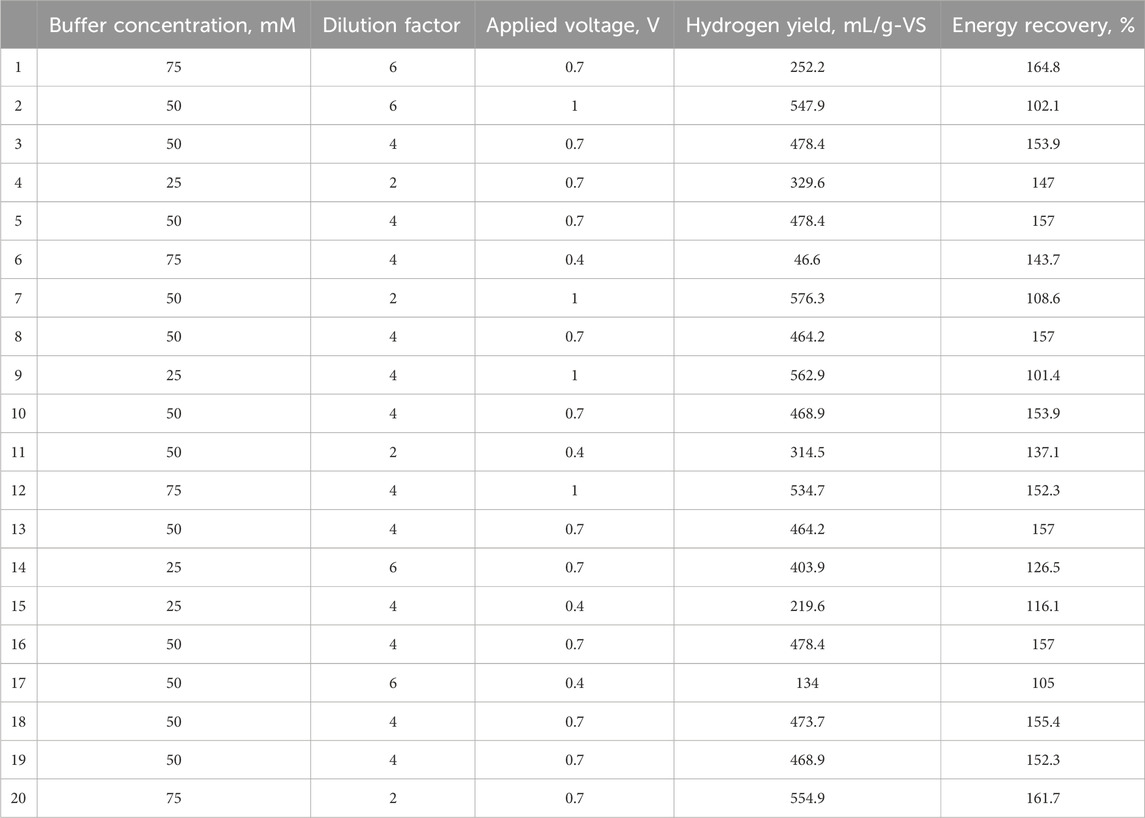
Table 1. Data set points (License Number-5778250508058).
3 Method
The target of the paper is determining the optimal values of three controlling input parameters to increase simultaneously bio-hydrogen production and energy recovery of MEC. Therefore, the suggested method contains two phases: modelling and parameter identification. Based on the data presented in Table 1, ANFIS model is created to simulate the MEC. Then in the second phase, artificial gorilla troops optimization is applied to identify the optimal values of buffer concentration, dilution factor, and applied voltage.
3.1 ANFIS
ANFIS is a hybrid computational system that combines artificial neural networks (ANNs) with fuzzy logic systems. It is especially adept at managing complicated, nonlinear problems. ANFIS can learn from data and reflect human knowledge through linguistic fuzzy rules. ANFIS typically comprises several layers: input, fuzzification, fuzzy inference, normalization, and defuzzification. ANFIS uses various learning techniques, like backpropagation and gradient descent, to update its parameters according to training data (Nikmanesh et al., 2023):
An assemblage of fuzzy IF-THEN rules within the rule base. The number of rules can be determined by multiplying the number of inputs. The rules can be represented by the following:
oIf α is X1 and β is Y1, then γ is Z1
oIf α is X2 and β is Y2, then γ is Z2
oIf α is Xn and β is Yn, then γ is Zn
Where α and β are inputs, γ is an output, X, Y, and Z are fuzzy sets.
Based on the FIS characteristics, the ANFIS architecture can be illustrated in Figure 1 (Yetilmezsoy et al., 2015).
- Layer 1 (fuzzification layer): The following Gaussian membership function (as presented in Equation 1) is used to determine the membership function connected to each input variable:
where ai and ci are variables linked with the Gaussian membership function.
- Layer 2 (product layer): in this layer, the degrees of memberships are used to calculate the ith rule’s firing strength (ωi) as presented in Equation 2:
- Layer 3 (normalization layer): In this layer, the weight-to-total-weight ratio is determined as presented in Equation 3:
- Layer 4 (defuzzification layer): the adaptive nodes are calculated in this layer as presented in Equation 4:
where pi, qi, and ri denote the adjustable consequent parameters.
- Layer five (output layer): the final output is calculated by the summation of all incoming inputs from layer 4.
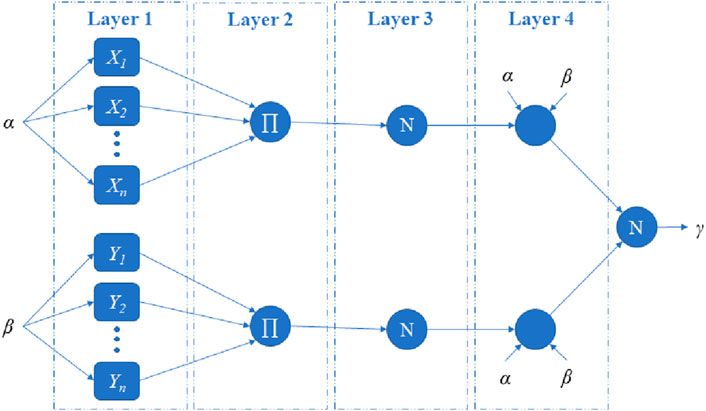
Figure 1. FIS architecture.
In the forward route, the Mean Squares Error (MSE) method improves subsequent parameters by reducing estimate error as presented in Equation 5:
where Pi is the parameters vector (pi, qi, and ri), t is the iteration number, and η is the learning rate factor presented as presented in Equation 6:
where Tmax is the total training iterations, and the RMS denotes the root mean square.
3.2 Artificial gorilla troops optimizer
GTO is a metaheuristic algorithm, which draws inspiration from the social intelligence exhibited by gorilla troops in their natural habitat. The GTO algorithm simulates optimization operations (exploitation and exploration) using five distinct operators in accordance with gorilla behavior (Abdollahzadeh et al., 2021).
During the exploration phase, this algorithm employs three operators:
• Behavior 01: migration to an unidentified location
• Behavior 02: movement toward other gorillas
• Behavior 03: migration to a known site
These phases can be modeled as presented in Equation 7:
where X is known positions if the gorilla, GX is candidate positions of the gorilla, Up and Low are the search space upper and lower limits, Xr and GXr are random positions from the gorilla positions (X) and the candidate positions (GX), r1,2,3 are random gains [0,1], p is constant [0,1], and C, L, and H can be calculated as presented in Equations 8–10:
where r4 is a random [0,1], l is a random [-1,1], and z is a random [-C, C].
During the exploitation phase, this algorithm employs two operators:
• Behavior 04: follow the silverback.
• Behavior 05: competition for adult females.
This phase can be modelled as presented in Equation 11:
where the used gains are calculated as presented in Equations 12, 13:
where Xbest is the best position vector (silverback gorilla position), r4 is a random [0,1], b is a constant, N1 and N2 are random values in the normal distribution with the problem’s dimensions. The steps of GTO is explained in Figure 2.
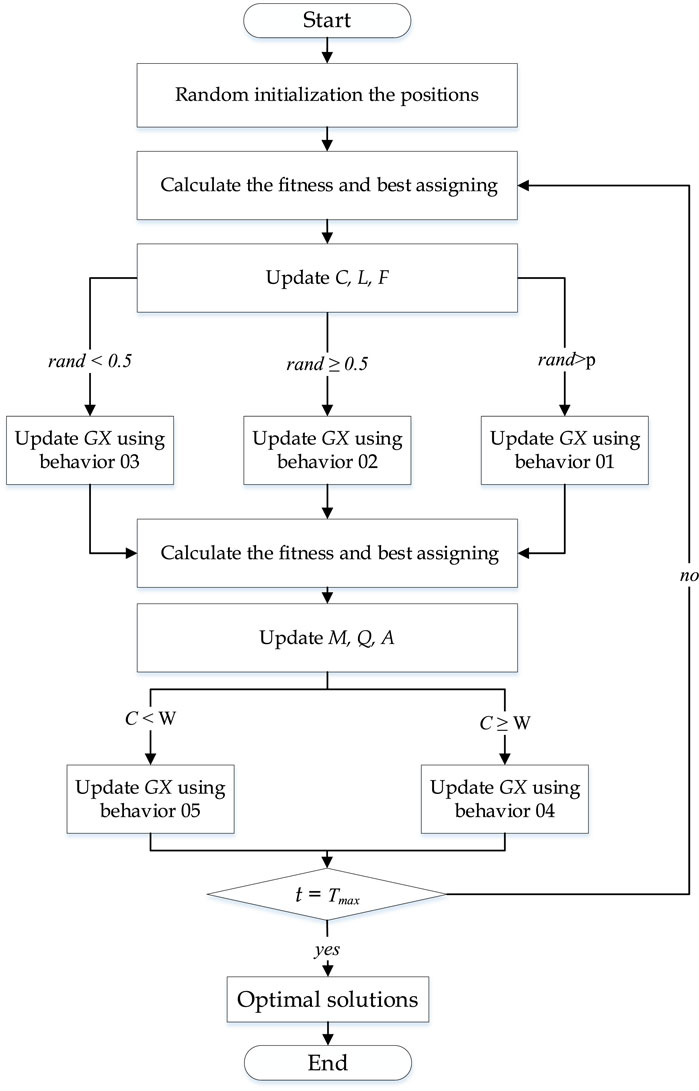
Figure 2. Main steps of GTO.
After constructing the ANFIS model, it integrated with AGTO optimizer to determine the optimal values of three input controlling parameters corresponding to maximum hydrogen yield and energy recovery of the MEC-DF. During the optimzation process, the three input controlling parameters are used as decision variables and the summation of hydrogen yield and energy recovery is assigned as the objective function that needed to be maximum. The problem argument of cost function can be stated as:
where x is the set of the three input parameters and y is the total performance of the MEC-DF (hydrogen yield plus energy recovery).
4 Results and discussion
As demonstrated in Table 1, the twenty collected data points were used to build the ANFIS model. The model is trained using 70% of the entire data, then tested using the remaining 30%. The hybrid training approach uses backpropagation for the backward path and LSE for the forward path. For the models of hydrogen yield and energy recovery, there are 10 and 12 fuzzy rules, respectively. These models were developed until they had a lower RMSE. The ANFIS model of MEC-DF statistical metrics is displayed in Table 2.
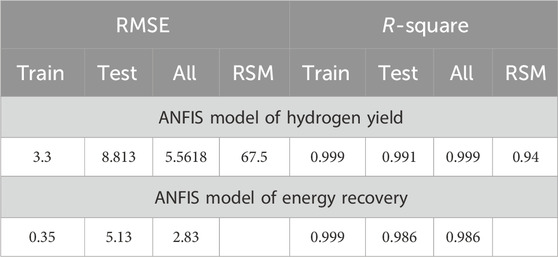
Table 2. Statistical metrics of ANFIS model of MEC-DF.
The training and testing sets of data for the ANFIS model of hydrogen yield’s RMSE values are 3.3 and 8.813, respectively, according to Table 1. The R-square values for training and testing are 0.999 and 0.991, respectively. Compared to RSM (Phan et al., 2023), the RMSE is decreased by 91.7% and at the same time the R-square for prediction rises by about 5.32%. For the ANFIS model of energy recovery, the RMSE values for the training and testing sets of data are 0.35 and 5.13, respectively. The R-square values for training and testing are 0.999 and 0.986, respectively. In comparison to RSM (Phan et al., 2023), the RMSE decreased by 91% and the R-square for prediction rises by about 3.8%. This higher prediction accuracy can be attributed to the ANFIS model’s ability to analyze higher-order non-linear systems than RSM, which predicts using a second-order polynomial (Nwosu et al., 2021). The modelling phase was successful, as evidenced by the ANFIS model’s low RMSE and strong R-square values. In Figure 3, the MEC-DF’s three-input single-output ANFIS model is depicted. On the other hand, Figure 4 depicts the generalised shape MFs.
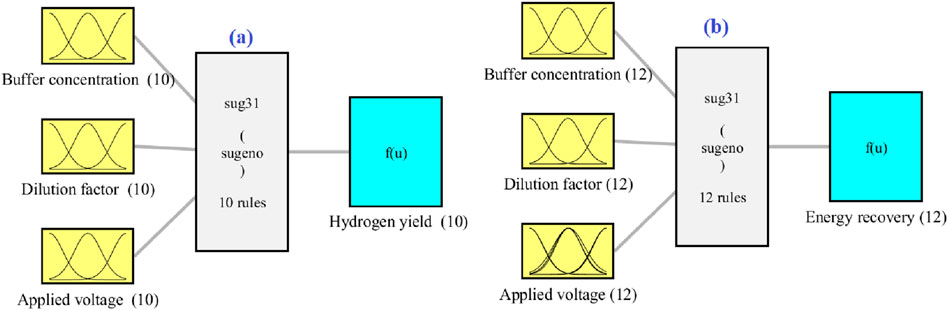
Figure 3. Arrangement of ANFIS model of MEC-FD (A) Hydrogen yield and (B) energy recovery.

Figure 4. Inputs’ MFs of ANFIS model of MEC-FD (A) Hydrogen yield and (B) energy recovery.
Figures 5A, B indicate the surface of ANFIS models of hydrogen yield and energy recovery respectively considering the system’s input-output function with every two inputs at a time. The peaks values of the hydrogen yield and energy recovery go to the dark red, but the smallest values go to the dark blue. It was clear from the figure higher the buffer concentration, the better MEC’s performance. Higher voltage (0.7–1.0 V) increased hydrogen yield, while a lower voltage (0.5–0.7 V) benefited energy recovery. Dilution factors less than 4-folds is suitable for MEC’s high performance.
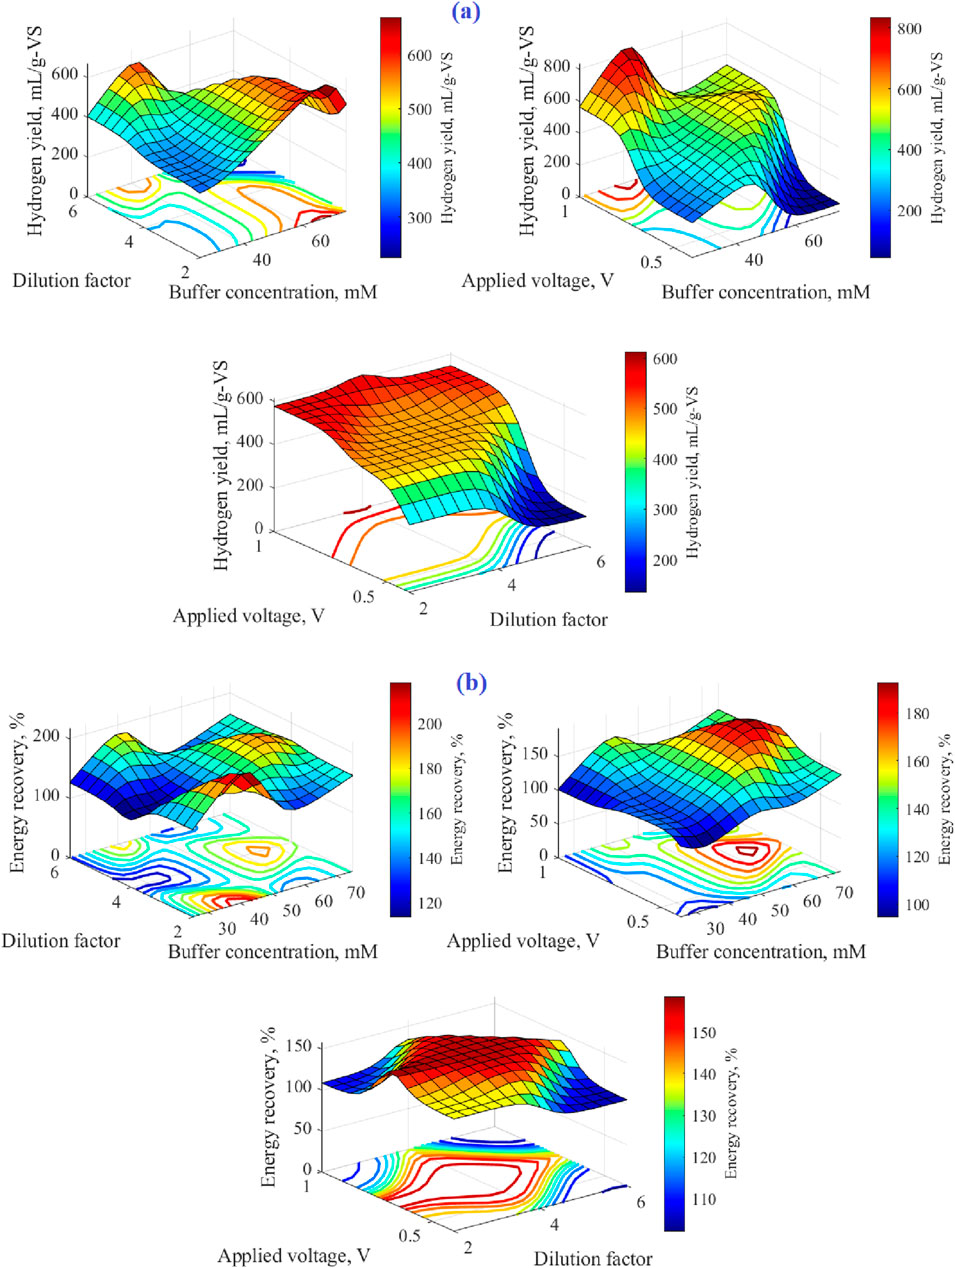
Figure 5. ANFIS surface of MEC-FD model (A) Hydrogen yield and (B) energy recovery.
By accurately capturing the appropriate link between the MEC-DF’s inputs and outputs, the proposed ANFIS model is encouraged to predict the hydrogen yield and energy recovery of the MEC-DF. This may be seen by comparing the ANFIS model’s predicted outputs to the experimental data displayed in Figure 6 and vice versa. It is evident that the measured and estimated values closely match each other. The plots of the predictions around the line of 100% accuracy for both the training and testing stages are also shown in Figure 7.
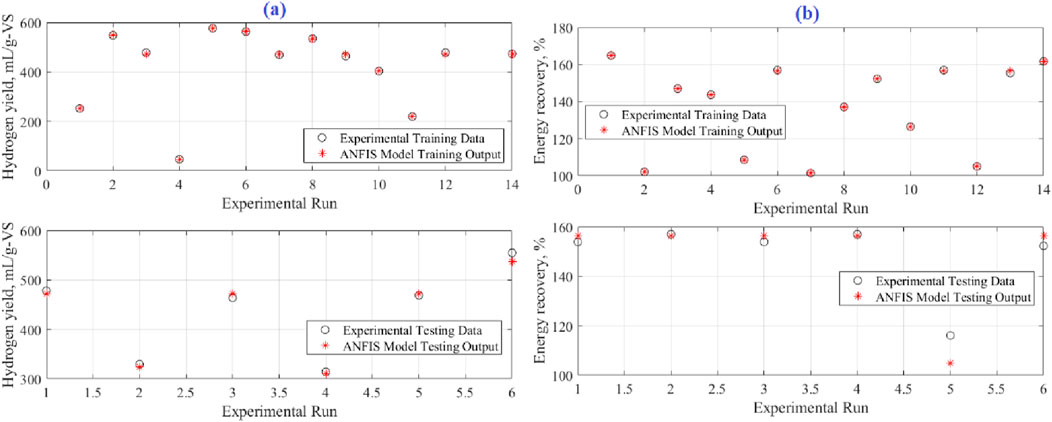
Figure 6. Predicted versus experimental data of ANFIS model of MEC-FD (A) Hydrogen yield and (B) energy recovery.
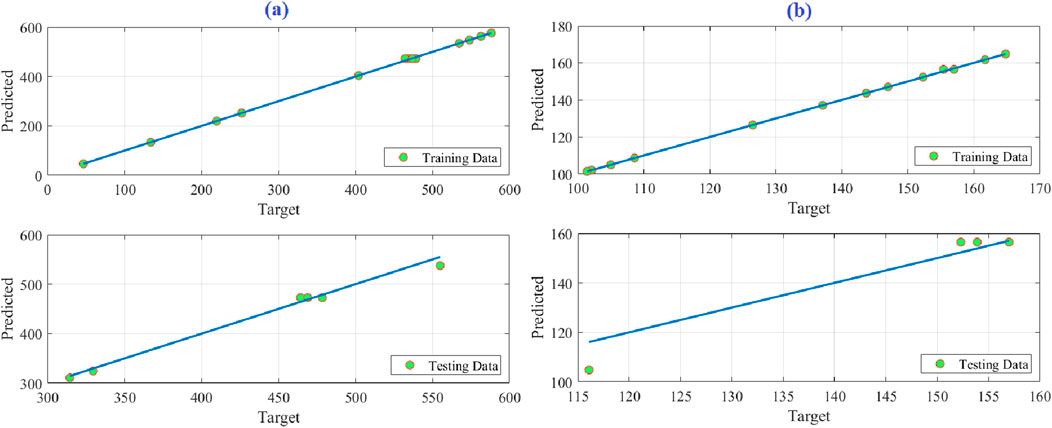
Figure 7. Predection accuarcy of ANFIS model of MEC-FD (A) Hydrogen yield and (B) energy recovery.
After constructing the ANFIS model, it integrated with AGTO optimizer to determine the optimal values of buffer concentration, dilution factor and applied voltage corresponding to maximum hydrogen yield and energy recovery of the MEC-DF. Table 3 displays the optimum input values, associated hydrogen yield, and energy recovery of the MEC-DF when using the measured RSM, ANN-PSO, and ANFIS- AGTO. Compared to measured data, RSM, and ANN-PSO, the MEC-DE’s overall performance has improved by 25.78%, 22.23%, and 18.09%, respectively. The convergence of the particles during the optimization process is shown in Figure 8. As seen in Figure 8A, the most significant cost function, 998.57, is perfectly attained. For the MEC-DF to produce the most hydrogen and recover the most energy, the ideal parameters for buffer concentration, dilution factor, and applied voltage are 41.25 mM, 3.9, and 1.0 V, respectively.
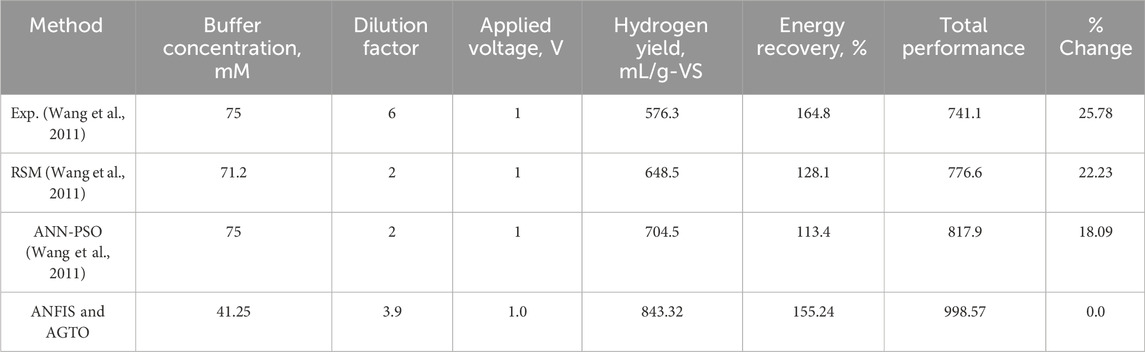
Table 3. Achieved best parameters using considered approaches.
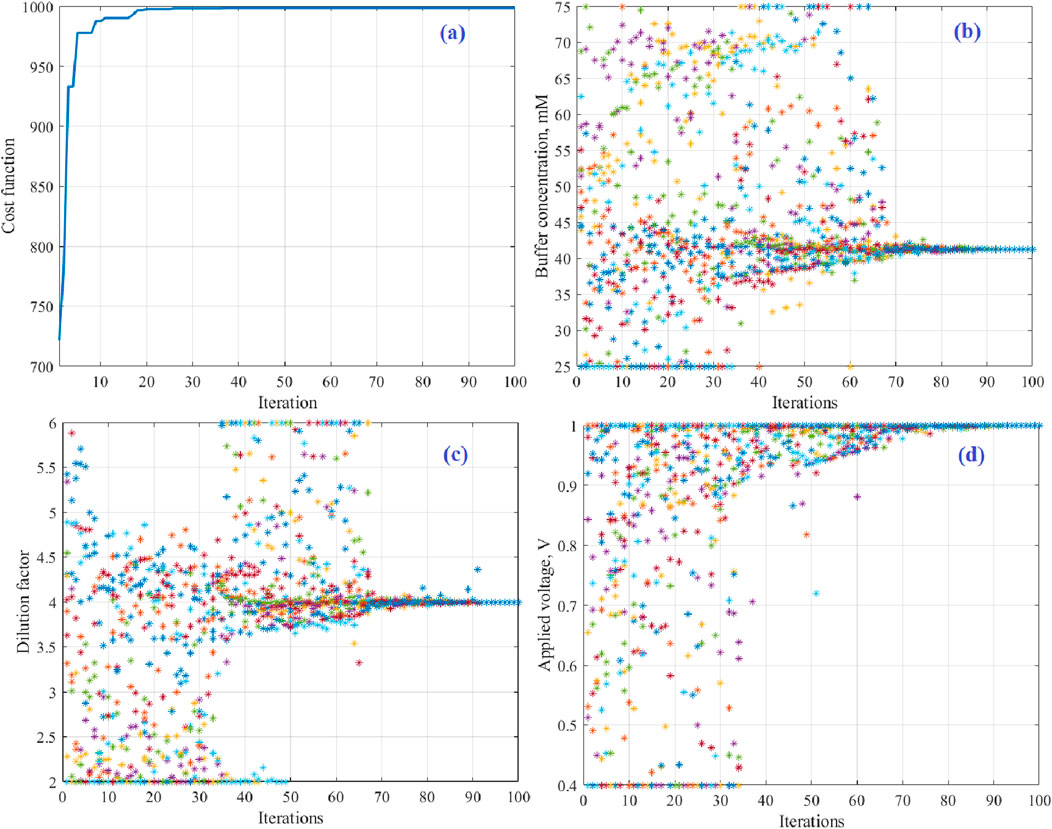
Figure 8. Particles convergence during optimization; (A) best objective function, (B) buffer concentration, (C) dilution factor and (D) applied voltage.
The optimized results are contrasted with PSO, GWO, CS, SMA, and EO to verify the robustness of AGTO. Each optimizer is run 30 times to avoid unpredictable results while a detailed statistical analysis is carried out. Table 4 and Figure 9 show the specifics of 30 runs using various optimizers. The best value, worst value, average value, standard deviation, and success rate (SR) are among the statistical indicators that are estimated and shown in Table 5. The values of the mean cost function ranged from 995.45 to 919.98. AGTO received the highest average value of 995.45, followed by GWO, with a score of 976.69, and PSO, with a value of 919.98. The values of the standard deviation fell between 16.81 and 82.67. AGTO and GWO provide the smallest standard deviation of 16.81, whereas PSO and GWO produce the maximum standard deviation of 82.67. Values for the success rate varied from 96.67 to 43.33. AGTO achieved the greatest SR of 96.67, followed by GWO with 76.67, and PSO with the lowest average value of 43.33.

Table 4. Details of 30 runs using different optimizers.
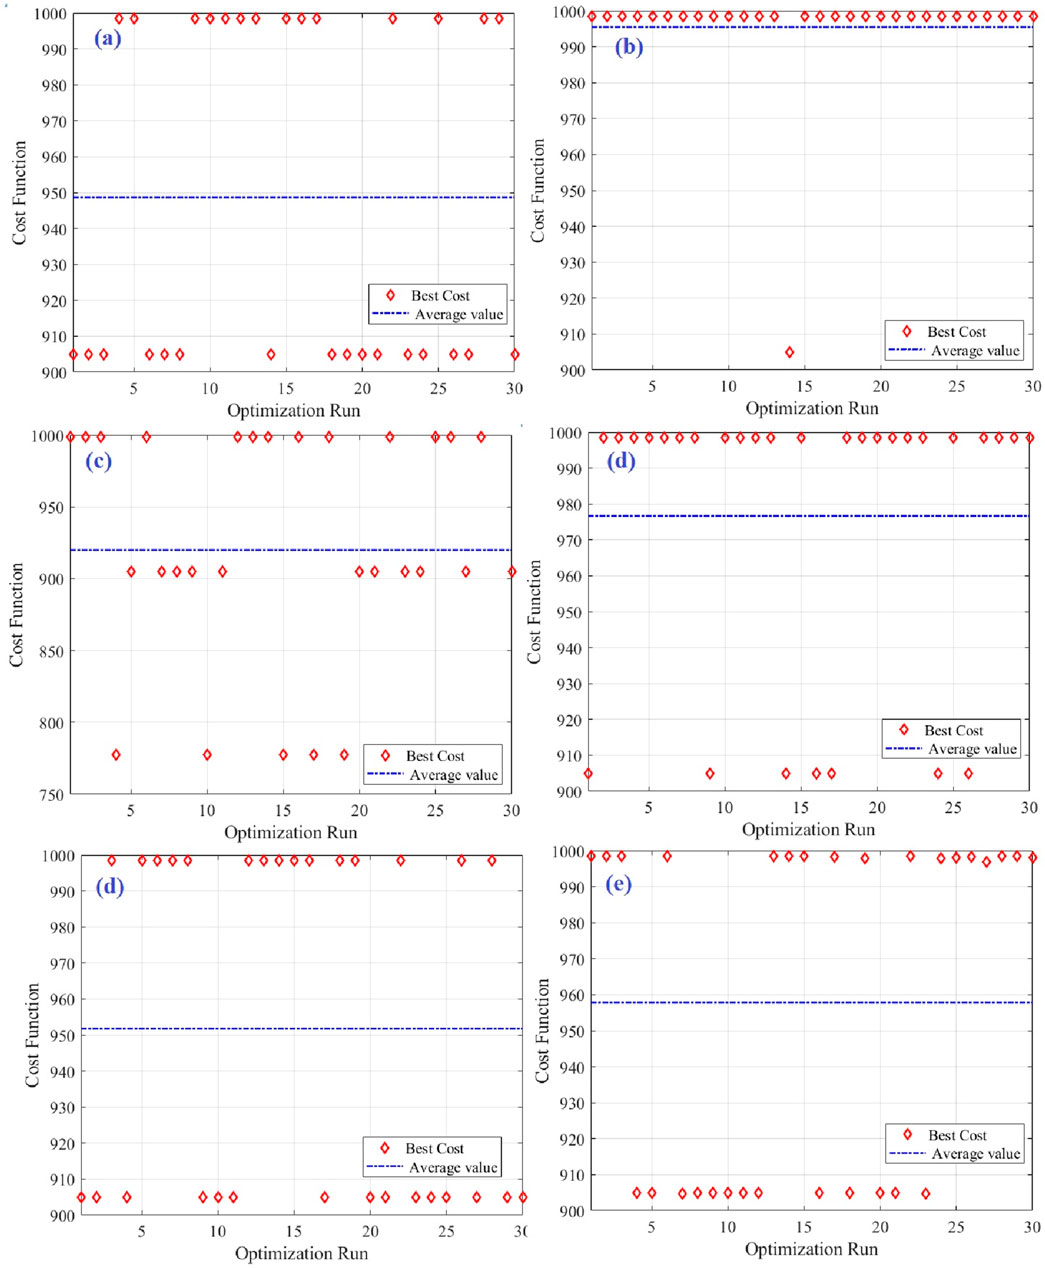
Figure 9. Details of 30 runs, (A) SMA, (B) AGTO, (C) PSO, and (D) GWO, (E) EO and (F) CS.
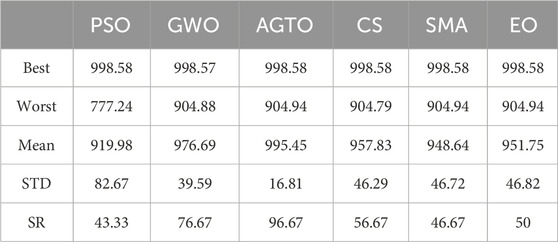
Table 5. Statistical evaluation for considered optimizers.
Other tests also carried out, ANOVA and Tukey. Table 6 summarizes the results of the ANOVA analysis, conclusively validating the distinctions among the algorithms. Meanwhile, Figure 10 provides a visual representation of the rankings that confirm the superior stability and accuracy exhibited by the AGTO algorithm.
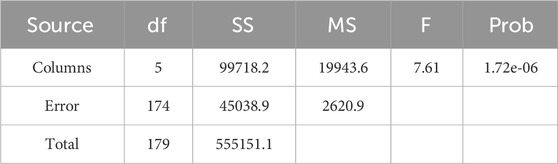
Table 6. ANOVA results.
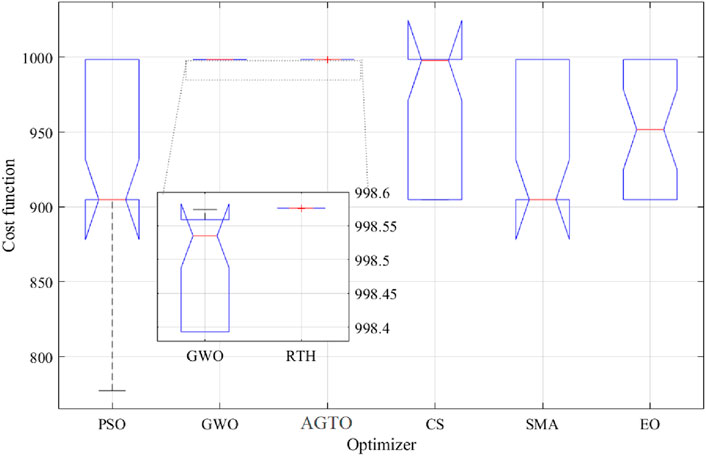
Figure 10. ANOVA ranking.
Figure 11 depicts the Tukey test results, confirming the conclusions from the ANOVA study. GWO delivered the second-best performance, then the CS. While the PSO provided the worst performance.
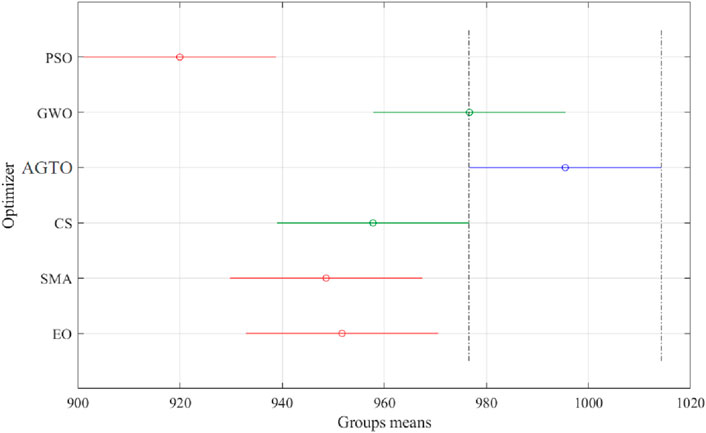
Figure 11. Tukey test.
5 Conclusion
Defining the optimal values of buffer concentration, dilution factor, and applied voltage is the challenge of the work. The main goal of the research work is to use artificial intelligence and modern optimization to improve the performance of microbial electrolysis cells fed. First, using the ANFIS, a model to simulate the hydrogen yield and energy recovery in terms of three input controlling parameters is developed. For the ANFIS model of hydrogen yield, compared with RSM, the RMSE reduced from 67.5 to 5.562 with ANFIS, a decrease of 91.7%. The prediction R-square increases by approximately 5.32% from 0.94 (using RSM) to 0.99 (using ANFIS). For the ANFIS model of energy recovery the RMSE dropped from 31.7 to 2.83, a 91% reduction. The prediction R-square increases by almost 3.8% from 0.95 (using RSM) to 0.986 (using ANFIS). To determine the ideal parameters of buffer content, dilution factor, and applied voltage corresponding to the highest hydrogen yield and energy recovery of MEC, the developed ANFIS model is then integrated with AGTO. Compared to measured data, RSM, and ANN-PSO, the MEC’s overall performance has improved by 34.74%, 29.9%, and 24.38%, respectively. To confirm the reliability of AGTO, the optimized findings from AGTO are compared with those from PSO, GWO, CS, SMA, and EO. The mean cost function had values ranging from 995.45 to 919.98. AGTO scored the highest overall, with an average of 995.45, followed by GWO (976.69) and PSO (919.98). The standard deviation values ranged from 16.81 to 82.67. The smallest standard deviation is produced by AGTO and GWO (16.81), and the largest standard deviation is made by PSO and GWO (82.67). The success rate ranged in value from 96.67 to 43.33. AGTO had the highest SR (96.67), GWO came in second (76.67), and PSO had the lowest average value (43.33). In sum, the optimized results demonstrated the superiority of integration between ANFIS and AGTO.
Data availability statement
The raw data supporting the conclusions of this article will be made available by the authors, without undue reservation.
Author contributions
HR: Writing–original draft, Writing–review and editing, Conceptualization, Formal Analysis, Investigation, Methodology, Project administration, Software. ES: Writing–original draft, Writing–review and editing, Conceptualization, Formal Analysis, Methodology, Software, Supervision.
Funding
The author(s) declare financial support was received for the research, authorship, and/or publication of this article. The authors extended their appreciation to Prince Sattam bin Abdulaziz University for funding this research work through the project number (PSAU/2024/01/78906).
Conflict of interest
The authors declare that the research was conducted in the absence of any commercial or financial relationships that could be construed as a potential conflict of interest.
Publisher’s note
All claims expressed in this article are solely those of the authors and do not necessarily represent those of their affiliated organizations, or those of the publisher, the editors and the reviewers. Any product that may be evaluated in this article, or claim that may be made by its manufacturer, is not guaranteed or endorsed by the publisher.
References
Abdollahzadeh, B., Gharehchopogh, F. S., and Mirjalili, S. (2021). Artificial gorilla troops optimizer: a new nature-inspired metaheuristic algorithm for global optimization problems. Int. J. Intelligent Syst. 36 (10), 5887–5958. doi:10.1002/int.22535
banza, M., Seodigeng, T., and Rutto, H. (2023). Comparison study of ANFIS, ANN, and RSM and mechanistic modeling for chromium (VI) removal using modified cellulose nanocrystals–sodium alginate (CNC–alg). Arabian J. Sci. Eng. 48, 16067–16085. doi:10.1007/s13369-023-07968-6
Cheng, D., Ngo, H. H., Guo, W., Chang, S. W., Nguyen, D. D., Zhang, S., et al. (2022). Impact factors and novel strategies for improving biohydrogen production in microbial electrolysis cells. Bioresour. Technol. 346, 126588. doi:10.1016/j.biortech.2021.126588
Dahiya, S., Chatterjee, S., Sarkar, O., and Venkata Mohan, S. (2021). Renewable hydrogen production by dark-fermentation: current status, challenges and perspectives. Bioresour. Technol. 321, 124354. doi:10.1016/j.biortech.2020.124354
Fathy, A., Rezk, H., Yousri, D., Alharbi, A. G., Alshammari, S., and Hassan, Y. B. (2023). Maximizing bio-hydrogen production from an innovative microbial electrolysis cell using artificial intelligence. Sustainability 15 (4), 3730. doi:10.3390/su15043730
Gaurav, G. K., Mehmood, T., Cheng, L., Klemeš, J. J., and Kumar Shrivastava, D. (2020). Water hyacinth as a biomass: a review. J. Clean. Prod. 277, 122214. doi:10.1016/j.jclepro.2020.122214
Hong, G. K. M., Hussain, M. A., and Ahmad, K. A. W. (2021). Fuzzy logic controller implementation on a microbial electrolysis cell for biohydrogen production and storage. Chin. J. Chem. Eng. 40, 149–159. doi:10.1016/j.cjche.2021.03.057
Hosseinzadeh, A., Zhou, J. L., Ali, A., Baziar, M., and Li, D. (2020). Effective modelling of hydrogen and energy recovery in microbial electrolysis cell by artificial neural network and adaptive network-based fuzzy inference system. Bioresour. Technol. 316, 123967. doi:10.1016/j.biortech.2020.123967
Jadhav, D. A., Park, S.-G., Pandit, S., Yang, E., Ali Abdelkareem, M., Jang, J.-K., et al. (2022). Scalability of microbial electrochemical technologies: applications and challenges. Bioresour. Technol. 345, 126498. doi:10.1016/j.biortech.2021.126498
Krishnan, S., Din, M. F.Md, Taib, S. M., Nasrullah, M., Sakinah, M., Wahid, Z. A., et al. (2019). Accelerated two-stage bioprocess for hydrogen and methane production from palm oil mill effluent using continuous stirred tank reactor and microbial electrolysis cell. J. Clean. Prod. 229, 84–93. doi:10.1016/j.jclepro.2019.04.365
Liang, J., Yu, Z., Chen, L., Fang, S., and Ma, X. (2019). Microwave pretreatment power and duration time effects on the catalytic pyrolysis behaviors and kinetics of water hyacinth. Bioresour. Technol. 286, 121369. doi:10.1016/j.biortech.2019.121369
Morya, R., Raj, T., Lee, Y., Pandey, A. K., Kumar, D., Singhania, R. R., et al. (2022). Recent updates in biohydrogen production strategies and life–cycle assessment for sustainable future. Bioresour. Technol. 366, 128159. doi:10.1016/j.biortech.2022.128159
Nikmanesh, M., Feili, A., and Sorooshian, S. (2023). Employee productivity assessment using fuzzy inference system. Information 14 (7), 423. doi:10.3390/info14070423
Nwosu, C., Ayodele, O., and Ibrahim, H. (2021). Optimization of hydrogen production via catalytic autothermal reforming of crude glycerol using response surface methodology and artificial neural network. Int. J. Energy Res. 45 (13), 18999–19013. doi:10.1002/er.7120
Phan, T. P., Qui, T. H.Ta, and Phan, K. T. N. (2023). Maximizing performance of microbial electrolysis cell fed with dark fermentation effluent from water hyacinth. Int. J. Hydrogen Energy 48 (14), 5447–5462. doi:10.1016/j.ijhydene.2022.11.155
Shoorehdeli, M. A., Teshnehlab, M., and Ali, K. S. (2009). Training ANFIS as an identifier with intelligent hybrid stable learning algorithm based on particle swarm optimization and extended Kalman filter. Fuzzy Sets Syst. 160 (7), 922–948. doi:10.1016/j.fss.2008.09.011
Tran, T. T.Ha, and Phan, K. T. N. (2022). Enhanced hydrogen production from water hyacinth by a combination of ultrasonic-assisted alkaline pretreatment, dark fermentation, and microbial electrolysis cell. Bioresour. Technol. 357, 127340. doi:10.1016/j.biortech.2022.127340
Tuna, E., Kargi, F., and Argun, H. (2009). Hydrogen gas production by electrohydrolysis of volatile fatty acid (VFA) containing dark fermentation effluent. Int. J. hydrogen energy 34 (1), 262–269. doi:10.1016/j.ijhydene.2008.10.041
Wang, A., Sun, D., Cao, G., Wang, H., Ren, N., Wu, W.-M., et al. (2011). Integrated hydrogen production process from cellulose by combining dark fermentation, microbial fuel cells, and a microbial electrolysis cell. Bioresour. Technol. 102 (5), 4137–4143. doi:10.1016/j.biortech.2010.10.137
Wazeri, A., Mohamed, E., Sophie, Le R., Peu, P., and Ahmed, T. (2018). Potentials of using mixed culture bacteria incorporated with sodium bicarbonate for hydrogen production from water hyacinth. Bioresour. Technol. 263, 365–374. doi:10.1016/j.biortech.2018.05.021
Yetilmezsoy, K., Ozgun, H., Kaan Dereli, R., Ersahin, M. E., and Ozturk, I. (2015). Adaptive neuro-fuzzy inference-based modeling of a full-scale expanded granular sludge bed reactor treating corn processing wastewater. J. Intelligent and Fuzzy Syst. 28 (4), 1601–1616. doi:10.3233/ifs-141445
Zhou, A., Zhang, J., Cai, W., Sun, R., Wang, G., Liu, W., et al. (2017). Comparison of chemosynthetic and biological surfactants on accelerating hydrogen production from waste activated sludge in a short-cut fermentation-bioelectrochemical system. Int. J. hydrogen energy 42 (14), 9044–9050. doi:10.1016/j.ijhydene.2016.02.075
Keywords: biofuel, microbial electrolysis cell, artificial gorilla troops optimization, artificial intelligence, optimization
Citation: Rezk H and Sayed ET (2024) Increasing bio-hydrogen production from microbial electrolysis cell using artificial gorilla troops optimization. Front. Energy Res. 12:1419785. doi: 10.3389/fenrg.2024.1419785
Received: 18 April 2024; Accepted: 11 September 2024;
Published: 23 September 2024.
Edited by:
Jürgen Krahl, Technische Hochschule Ostwestfalen-Lippe, GermanyReviewed by:
Dinesh Kumar, Saveetha University, IndiaGodvin Sharmila V., Mar Ephraem College of Engineering and Technology, India
Copyright © 2024 Rezk and Sayed. This is an open-access article distributed under the terms of the Creative Commons Attribution License (CC BY). The use, distribution or reproduction in other forums is permitted, provided the original author(s) and the copyright owner(s) are credited and that the original publication in this journal is cited, in accordance with accepted academic practice. No use, distribution or reproduction is permitted which does not comply with these terms.
*Correspondence: Hegazy Rezk, aHIuaHVzc2llbkBwc2F1LmVkdS5zYQ==
†ORCID: Hegazy Rezk, orcid.org/0000-0001-9254-2744