- 1Department of Computer Engineering, Bells University of Technology, Ota, Nigeria
- 2Department of Mechanical Engineering, Pan-Atlantic University, Lekki, Nigeria
- 3Department of Mechatronics Engineering, Bowen University, Iwo, Nigeria
- 4Department of Mechanical Engineering, University of Delta, Agbor, Nigeria
- 5Department of Mechanical Engineering, Bells University of Technology, Ota, Nigeria
Efficient steam energy production was essential for reducing energy consumption and operational costs while enhancing productivity, particularly in industrial settings prone to explosions due to boiler parameter control issues. This challenge was especially acute in the food and beverage industry amid rising energy costs and stricter environmental regulations, highlighting the importance of optimizing steam energy production. This study focused on refining operational parameters in a steam production plant to maximize steam energy output. It utilized mathematical models and optimization tools to identify ideal operational conditions and investigate extreme scenarios. Design-Expert version 13.0 statistical software and Response Surface Methodology (RSM) via Centre Composite Design (CCD) were employed to create a comprehensive design matrix encompassing key variables like time, pressure levels, temperature, mass flow rate, and steam energy production across three experimental levels. The research revealed that increased pressure and time significantly boosted steam energy production by leveraging water’s energy content rise under initial conditions, thus improving efficiency by reducing required water mass circulation. Moreover, elevated temperature and extended operation enhanced economizer efficiency, leading to increased heat recovery and reduced steam generation. Steam generation also increased with temperature and time due to the pressure rise during boiling, necessitating more energy for steam conversion. An optimum yield of steam energy of 620 Cal was attained at a time, pressure, temperature, and mass flow rate of 1 h, 16.97 MPa, 249.5°C, and 59.85 kg/s, respectively. The mathematical model developed is accurate, reliable, responsive, and can replicate the experimental data due to the high F-value (24.48), low CV (0.94) low p-value (< 0.005), and high R2 (0.9821) value close to 1. This research promises to enhance the efficiency of steam energy production in the food and beverage industry by reducing the need for resource-intensive experimental procedures, thus lowering costs and resource consumption.
1 Introduction
In today’s industrial landscape, where energy costs are rising, and environmental regulations are becoming more stringent, enhancing steam energy production has become a critical priority for many industries (Kumar et al., 2020; Onokwai et al., 2023a; Olusanya et al., 2023; Efetobor et al., 2024). Efficient steam energy production can lead to reduced energy consumption, increased productivity, and lower operating costs (Dieckhoffff et al., 2014). However, achieving optimal steam energy production requires attention to various operating factors. Ensuring proper regulation of a boiler’s operational parameters is crucial, given the significant risks of explosion associated with high working pressures and temperatures (Guo et al., 2017). Additionally, the financial implications of boiler operation and maintenance, including the expenses related to construction and fuel consumption, should not be overlooked (Dieckhoffff et al., 2014; Ahmadi and Dincer, 2018).
Plant steam also referred to as industrial steam, is utilized in the processing of food and beverages. This type of steam is generated by treating softened water, de-alkalized water, or reverse osmosis water with pre-heating and chemical treatment to prevent the formation of corrosion and scale in the system (Onokwai et al., 2023b). While steam is generally perceived as a clean and sanitary energy source that can be utilized in various applications, including heat exchangers, boiling systems, and hot water generation, it may also be used in direct contact with the process or product (Osueke et al., 2015a; Osueke et al., 2015b; Onokpite et al., 2023). In such cases, it is crucial to ensure the steam’s quality and purity to prevent any potential contamination that could compromise human health or the final product’s quality (Guo et al., 2017).
In the food and beverage sector, manufacturers must ensure the safety and quality of their products by identifying potential hazards and implementing control measures (Akinbami et al., 2002). Studies (Wang et al., 2023; Pealy, 2024) showed how the food and beverage industry is constantly working to maintain product safety and quality by implementing strict control procedures and cutting-edge technologies. During steam energy generation, potential sources of contamination include the boiler feed water, the steam distribution system, and any equipment or materials that interface with the steam.
To prevent contamination, manufacturers may implement measures such as using high-quality feed water, regularly cleaning and sanitizing the steam system, and using appropriate materials and design features to prevent the buildup of contaminants (Egeonu et al., 2015; As’ad et al., 2019). In modern industrial settings, steam energy production plays a crucial role in powering various processes and operations. As a result, the efficiency and reliability of steam plants are essential factors that directly impact overall energy consumption and productivity. In this regard, the design and operation of steam boilers represent a critical area of focus for maximizing steam energy production (Singha and Forcinito, 2018; Salahi et al., 2023).
Boiler efficiency is influenced by several factors, including the selection of appropriate boiler designs, fuel types, and combustion systems. For instance, a poorly designed or operated boiler can result in decreased efficiency, increased fuel consumption, and higher emissions. Therefore, it is crucial to select the right boiler design and fuel type based on the specific needs of the industrial process. Moreover, the quality of feedwater and its treatment can also impact boiler efficiency and lifespan. High-quality feed water can help minimize corrosion, scale formation, and other forms of damage that can affect the lifespan of boilers. Therefore, implementing proper water treatment measures and ensuring the quality of feedwater is essential for maintaining boiler efficiency and extending the lifespan of steam generation equipment (Szymon et al., 2016; Albana and Dahdah, 2023).
Researchers have investigated different approaches to enhance steam generation. Madu (2018) examined crucial factors that affect the variables for achieving effective operation of a typical steam power plant. The study yielded a specific work output of 854.65 kJ/kg at turbine pressures of 20 bar and 2 bar, and the plant’s thermal efficiency was 26.08%, while the rate of heat loss by the condenser and heat generation were 4114.55 and 5027.74 J/s, respectively.
The results showed wet steam at points 4 and 6s, but superheated steam at points 3 and 5. The study recommended optimizing the enthalpy values at points 3 and 5 to enhance the plant’s thermal efficiency. Egeonu et al. (2015) presented a successful application of genetic algorithms to optimize the performance of a power plant boiler, which has practical significance for improving the efficiency and cost-effectiveness of power generation. The results showed that the application of genetic algorithms in the thermodynamic optimization of the Egbin power plant boiler leads to a 4.76% and 3.89% increase in thermal efficiency.
Podlasek et al. (2016) applied a PLC control system to automatically adjust the pressure and temperature of the generated steam, which is necessary to ensure the optimal performance of the steam engines under varying load conditions. In a study on a boiler in a petrochemical company, Khoshhal et al. (2010) used numerical simulation to show that NOx emissions were consistent with measured values, indicating that NOx emissions are highly dependent on temperature and oxygen concentration. Similarly, Thornock et al. (2014) used numerical simulation, and large Eddy Dissipation (LES), to predict NOx formation in a steam generator, and proposed a burner design that resulted in lower NOx values. In their study on fuel-staged Low-NOx Burners (LNB), Liu et al. (2016) predicted flow field, temperature, OH molar fraction, and NO distribution, concluding that the number of staged guns had a significant effect on OH distribution but a negligible impact on the flow field and NO emission. In the study by Ye et al. (2017), a 3-D computational fluid dynamics (CFD) model to scrutinize the fluid dynamics inside an OTSG was created, and evaluated the impact of various structural configurations on coolant flow parameters.
Additionally, Liu et al. (2017) utilized numerical simulations to optimize the position and angle of staged gun injection for reducing NO pollutants and confirmed their findings with experiments. Ensuring effective control of a boiler’s operational conditions is crucial due to the potential hazards posed by high working pressures and temperatures, such as the risk of explosion. In addition to construction costs, there are high operating costs (due to significant fuel consumption) and maintenance expenses associated with these conditions. However, finding and maintaining optimal operating conditions for a steam boiler is challenging due to the complexity and inter-relatedness of all variables. Direct testing on a boiler is difficult and dangerous, as it involves manipulating operating conditions and requires significant time and money. Therefore, simulation may be a viable alternative method of analysis (Díaz, 2001).
Researchers have explored the intricacies of optimizing the operating conditions of a steam boiler, considering factors such as safety risks, operational costs, and the intricate interactions of multiple variables (Zhang et al., 2014; Varganova et al., 2023). Nevertheless, there is a lack of information in the literature regarding the optimization of more than three operating factors such as time, pressure, temperature, and mass flow rate using response surface methodology (RSM) to enhance steam energy production. RSM combines statistics and numerical optimization to generate empirical equations that clarify condition-response relationships. RSM combines statistical and numerical optimization techniques to generate empirical equations and determine the impact of specific conditions on targeted responses (Meshalkin et al., 2017; Onokwai et al., 2023c).
In RSM, the input variables are independent conditions, and the performance measures are considered responses (Laouge et al., 2020). During RSM, numerical optimization capabilities are embedded in Design-Expert version 13, allowing for the extraction of optimal numerical solutions (best values) from a given set of input factors and responses within the software (Maddah et al., 2019). Previous research by Onokwai et al. (2019) also implemented RSM to optimize the energy and exergy efficiency of a parabolic dish cooker and found that solar irradiances and temperature had a significant impact on efficiency. Similarly, pyrolysis operating parameters were optimized using RSM to enhanced the yield of pyrolysis products (Hassan et al., 2017).
The focus of this study was to utilize RSM to improve the operational factors of a steam production plant by modeling and optimizing these factors. The main goal was to understand the relationship between operating conditions and steam generation and to identify the optimal process conditions using RSM to optimized steam production. In this study, four steam energy generation operating factors such as time, pressure level, temperature, and mass flow rate. The influence of individual and two most important interactive factors on steam energy generation was investigated using RSM. The essence is to reduce the bottleneck in performing rigorous experimental runs and enhance the efficiency of steam energy production in the food and beverage industry by reducing costs and materials.
2 Methodology
2.1 Research design
This study employed the central composite design (CCD) as the experimental framework for optimizing the steam energy production process systematically. Utilizing response surface methodology (RSM) in conjunction with CCD, facilitated by Design-Expert version 13.0 statistical software (as detailed in Table 1), was the chosen approach. While methods such as Central Composite Design (CCD) and Box-Behnken Design (BBD) are commonly used for RSM, CCD was specifically selected in this investigation. The rationale behind this choice lies in CCD being a widely accepted statistical method for fitting second-order models and optimizing operational factors in steam energy production, as highlighted by previous research (Park et al., 2008; Martin et al., 2020; Yahya et al., 2021; Nainggolan et al., 2023; Umelo-Ibemere, 2023). The study by (Szpisják-Gulyás et al., 2023) further demonstrates how flexible and efficient CCD is in fitting second-order models to optimize a wide range of processes, especially when it comes to the production of steam energy and related fields. CCD stands out for its reliability, time and resource efficiency, ability to deduce regression model equations from pertinent experiments, exploration of interactions among independent factors influencing steam energy production, and efficiency in suggesting the minimum number of test runs when considering the effects of various operating conditions on the final output (Maddah et al., 2019). Given that this study involves four operating parameters with one response variable (steam energy), RSM proves invaluable in reducing analysis time. This is achieved through enhanced computational capabilities, converting numerical data into coded parameters within its black box, and subsequently recalculating it back to numerical data. Additionally, RSM facilitates the grouping of analyses for multi-objective functions (Akhtar et al., 2023). RSM aids in statistical judgments, considering factors such as p-values and F-values, guiding decisions on whether to adopt fractional factorial design for 1st-degree polynomial relationships or central composite design for 2nd-degree polynomial relationships for all independent factors and the response variable (Szpisják-Gulyás et al., 2023). Intriguingly, RSM also facilitates the exploration of interactions between independent parameters and the response variable, allowing for maximization, minimization, or specific target setting (Hossain et al., 2017). Since the interactions are limited to the 2nd order, the central composite design (CCD) proves to be highly effective in this context (Kumar et al., 2019). Furthermore, RSM investigates the influence of individual factors, the square of individual factors, and the interaction between two factors on steam energy production as shown in Eq. 1. This study employed key operational factors, specifically time (ranging from 1 to 5 h), pressure levels (ranging between 5 and 20 MPa), temperatures spanning from 100°C to 300°C, and mass flow rates ranging from 50 to 100 kg/s. Each factor was systematically varied at three levels throughout the experimental runs.
These factors were carefully chosen due to the influence on the quality and quantity of steam energy production as postulated by Chien and Schrodt (1995); Bouamama et al. (2006); Stanley and Pedrosa (2011); Bouamama et al. (2015); Qi et al. (2015). A mathematical expression (Eq. 1) was derived to depict the relationship between these operating factors and the response variable, steam energy production. Subsequently, the constant, linear, quadratic, and interactive coefficients were computed. The optimization of these operating factors aimed to enhance steam energy yield. The statistical model’s accuracy and significance were assessed through various criteria, including probability (p-value), lack-of-fit, Fisher (F) value, coefficient of variation (CV), coefficient of determination (R2), and the comparison between the adjusted and predicted R2 values (Ehsan et al., 2019; Okokpujie et al., 2023). This rigorous evaluation ensures the robustness and reliability of the mathematical model.
Where,
Thirty (30) experimental runs were generated from the Design Expert version 13.0 software statistical software and validated using Eq. 2.
Where N is the actual experimental runs, k is the number of operating factors and nc = 5 is the repeated number of identical runs at the centre points of the centre composite design.
2.2 Data collection
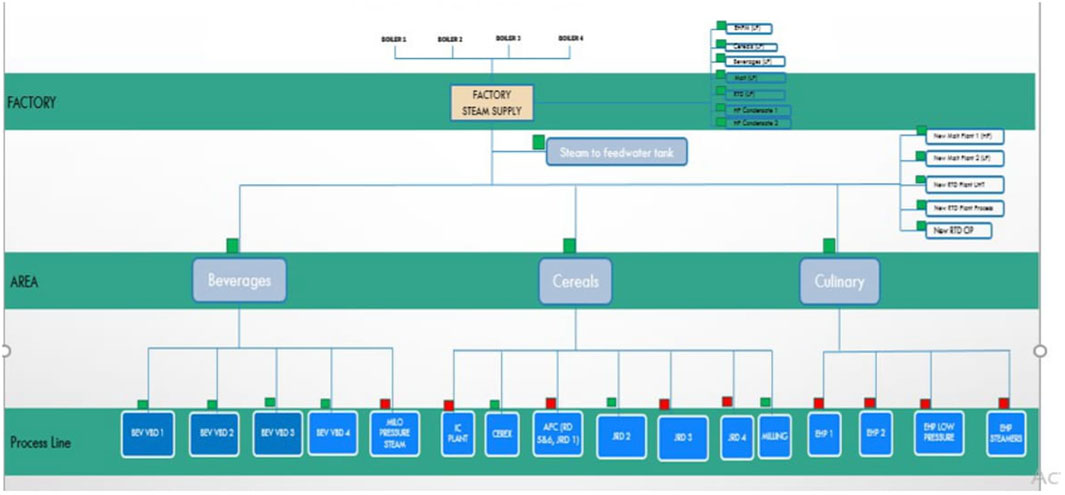
The steam energy production was generated from Boilers 1 to 4 as shown in Figure 1, while a digitized electronic flow meter with HTML5 and C# was utilized to record the quantity of steam energy production from the beverages industry, Nigeria was utilized due to its ease of configuration and sustainable system maintenance.
3 Results and discussion
Table 1 shows the experimental design matrix and the corresponding steam energy production obtained at different operational factors such as time, pressure, temperature, and mass flow rate. These factors were utilized each at three levels of experimental runs. The maximum steam energy production of 625 was achieved with specific operating conditions: a time (T) of 5 h, a pressure level (P) of 20 MPa, a temperature (θ) of 300°C, and a mass flow rate (M) of 50 kg/s.
3.1 Statistical analysis model for steam energy production
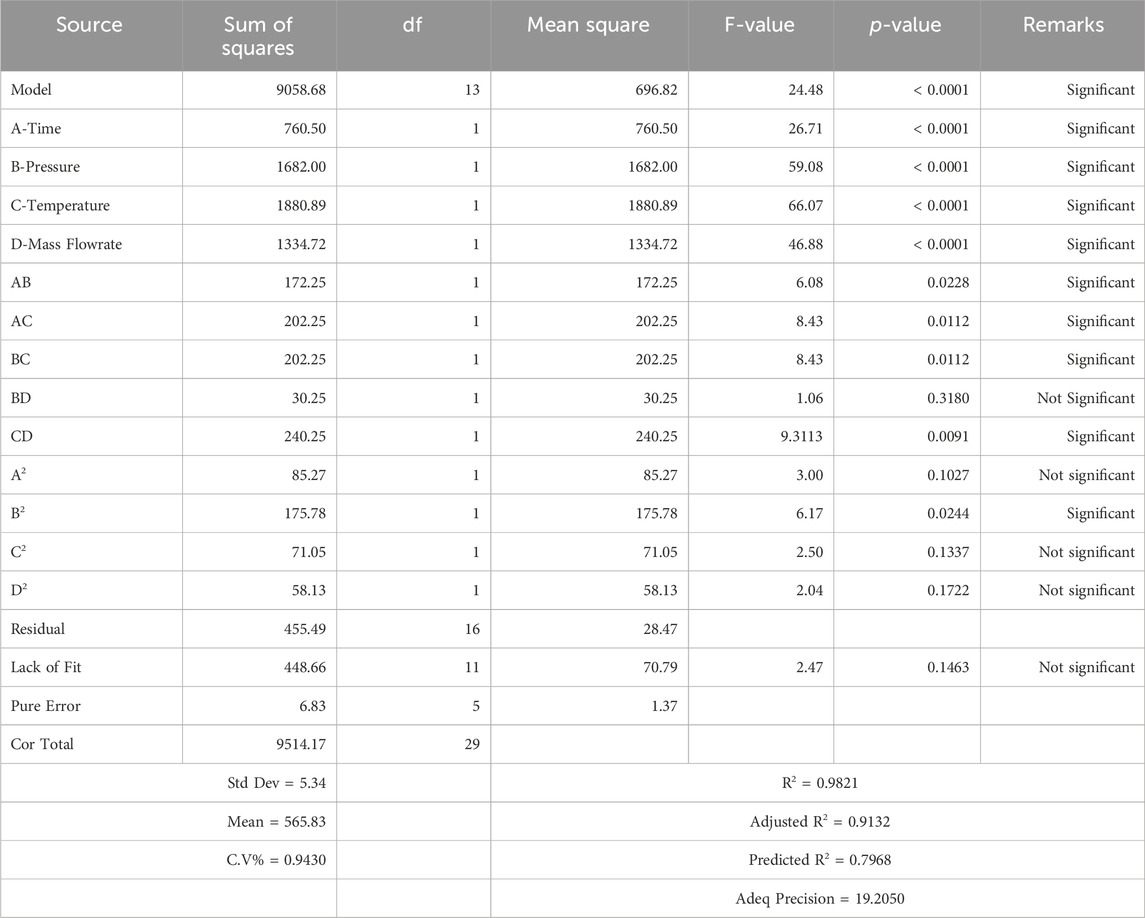
The coded mathematical model that was utilized to predict the steam production in a Nigerian beverage industry is shown in Eq. 3, while Table 2, depicts the summary of the outcome obtained from the Analysis of Variance (ANOVA) which assesses the influence of individual and interactive factors on steam energy production was conducted to validate the mathematical model’s accuracy in predicting steam energy production.
Where, SEP denotes steam energy production, while A, B, C, D, and E represent the coded values for time (h), pressure level (MPa), temperature (°C), and mass flow rate (kg/s), respectively. In the mathematical model, a positive (+) sign signifies a synergistic effect, while a negative (−) sign indicates antagonistic effects on steam energy production.
The Fischer test (F-value) and probability value (p-value) emerged as acceptable parameters for scrutinizing regression models, as highlighted in studies by Bensouici et al. (2023) and Okokpujie et al. (2023). The F-value compares the mean square value of the residuals and the mean square value of the developed regression model. A higher F-value signifies a more accurate, reliable, responsive, and reproductive regression model. Additionally, for a model to carry higher significance, the p-value should be low, as emphasized by Kumar et al. (2019) and Laouge et al. (2020). The ANOVA analysis showed a high F-value of 24.48 and a low p-value of 0.0001 (p < 0.05), signifying the high significance and precision of the developed regression model. The likelihood of a model F-value of this magnitude occurring solely due to noise is highly implausible, with a minimal chance (0.01%), as emphasized by Onokwai et al. (2022).
Results indicated that time (A), pressure (B), temperature (C), mass flow rate (D), quadratic of A (A2), the interaction between time (A) and pressure (B), the interaction between time (A) and temperature (C), the interaction of pressure (B) and temperature (C), the combination of temperature (C) and mass flow rate (D), are significance terms. Consequently, enhancing steam energy production is positively influenced by these significant terms, while insignificant terms do not contribute meaningfully to the improvement of steam energy production. The lack of fit of 0.1463 indicates the suitability of the developed mathematical model, as suggested by Tripathi et al. (2020), as capable of accurately predicting and reproducing the experimental data.
The metric for measuring the dispersion of values in the dataset relative is referred to as the coefficient of variation (%). A small CV value (CV < 10%) is indicative of the high reliability, consistency, reproducibility, and accuracy of the models. In the current study, the calculated CV% value of 0.9843 is relatively low. This low CV% suggests a high level of reproducibility and reliability in the conducted experiments and the investigated model (Kumar et al., 2019).
The R2 value quantifies the proportion of the variation in the dependent variable explained by all the independent factors incorporated into the model. This metric operates under the assumption that each independent variable in the model contributes to explaining variations in the dependent variable. It acts as the coefficient of determination for the regression model and is expected to be close to 1, aligning with the standards for a robust model (Akhtar et al., 2023). Specifically, the R2 value of 0.982 is approaching 1. This value affirms the goodness of the mathematical model under scrutiny, signifying its ability to accurately replicate the experimental data. The adjusted R2 value quantifies the fraction of variation elucidated solely by those independent factors that genuinely contribute to explaining the dependent variables (responses) in the regression model. On the other hand, the predicted R2 value gauges the extent to which the model explains variation in new data. Generally, a reasonable agreement between the adjusted and predicted R2 values is indicated when the difference is approximately within 0.2 (Onokwai et al., 2023a). The predicted R2 (0.7968) is in reasonable consonance (difference of 0.1164) with the adjusted R2 of 0.9132. Thus, the mathematical model closely aligns with the predicted values, indicating that the model can replicate the data obtained from the beverage industry.
3.2 Influence of individual factors on the steam energy production
Figures 2A–D depicts the influence of individual factors on steam energy production. The combination of higher pressure, simultaneous temperature elevation, and increased mass flow rate (ranging from 50 to 75 kg/s) enhances steam energy production as time increases. However, a reduction in steam energy was observed due to entropy inherent in the steam exchanger, resulting from losses related to initial thermal effects, minimized empty space, and overheating (Nadir et al., 2016).
3.3 Influence of two most significant factors on operating factors on the steam energy production
The 3D response surface and 2D contour plots (Figures 3–6) demonstrate how two key factors significantly influence steam energy production, based on the experimental conditions from Design expert version 13.0 software. Figure 4 depicts the combined effect of pressure level and time on steam energy production, shown through 3D response surface and 2D contour plots. The maximum steam energy production (574 Cal) was attained at a constant temperature (200°C) and mass flow rate (75 kg/s). Increasing pressure coupled with time (h) increased steam energy production, attributed to the increase in energy content of the mass of water under initial conditions, which decreased circulation of mass of water required for energy generation (Figures 3A, B), thereby improving steam energy production efficiency. However, increasing temperature (from 100°C to 200°C) and extending operational time enhanced economizer efficiency, leading to higher heat recovery at the steam generation outlet and consequently reducing steam energy generation (Hasananto et al., 2021).
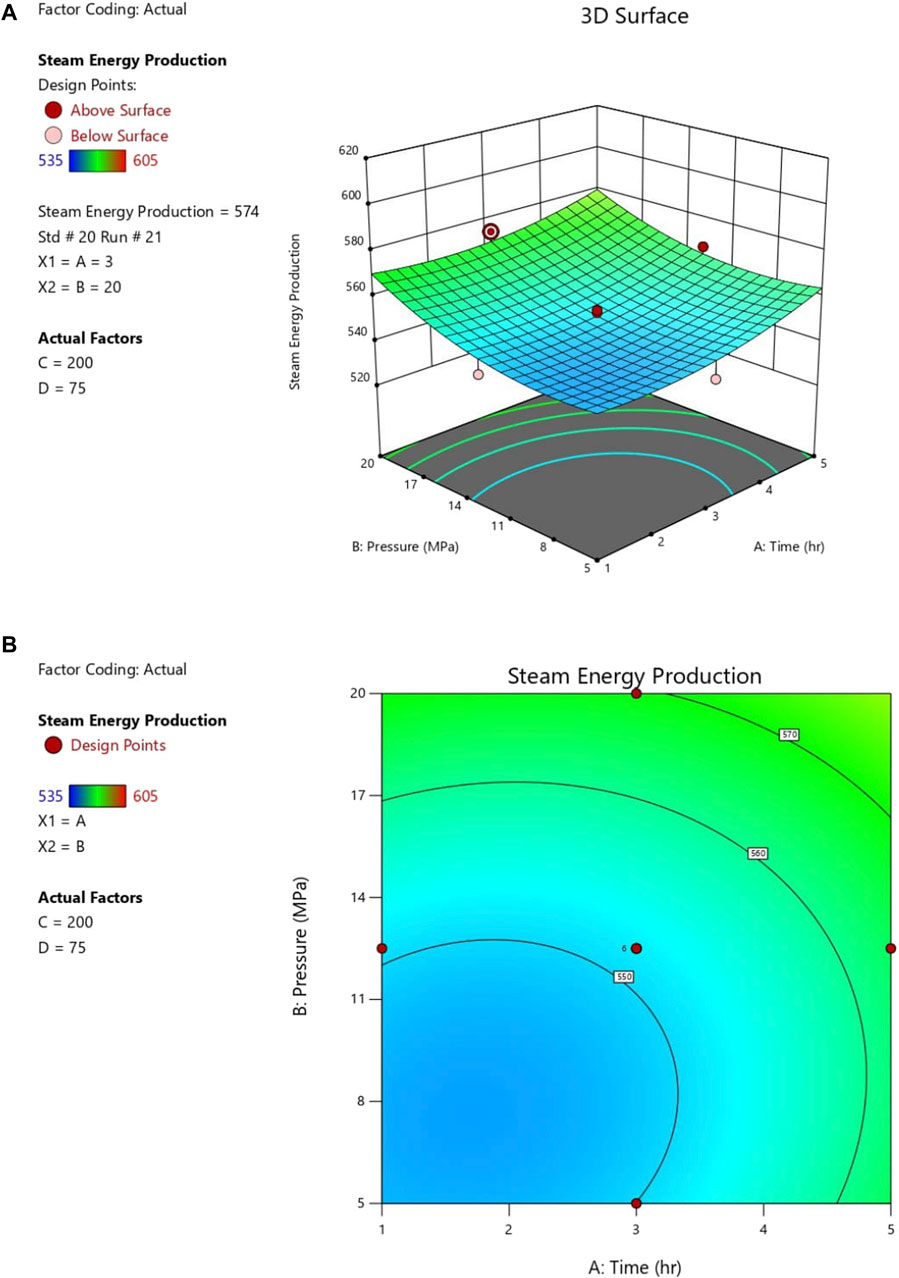
Figure 3. (A) 3D response surface plot showing the effect of pressure level and time on steam energy production at a constant 200°C of temperature and 75 kg/s of mass flow rate. (B) 2D contour plot showing the effect of pressure level and time on steam energy production at constant 200°C of temperature and 75 kg/s of mass flow rate.
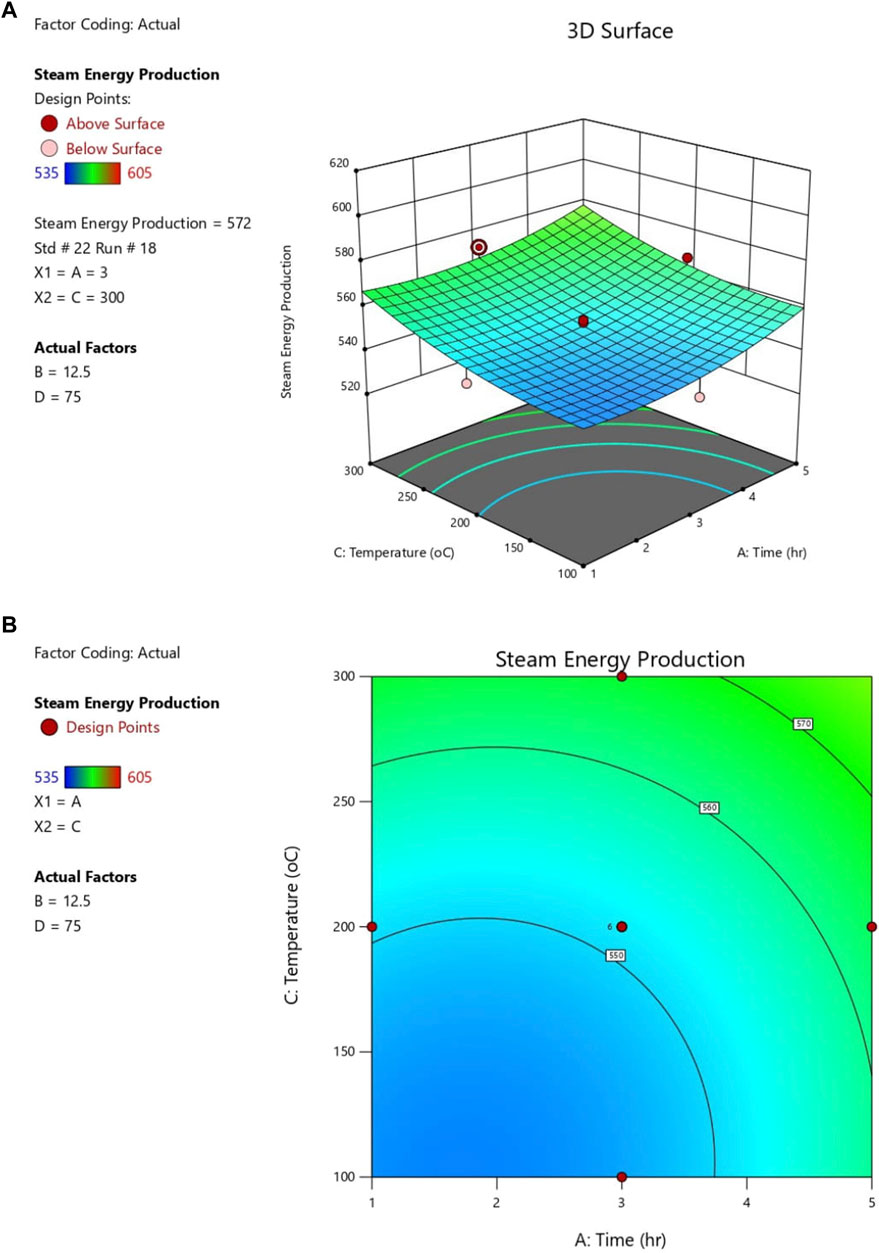
Figure 4. (A) 3D response surface plot showing the effect of time and temperature on steam energy production at a constant 12.5 MPa of pressure and 75 kg/s of mass flow rate. (B) 2D contour plot showing the effect of time and temperature on steam energy production at a constant 12.5 MPa of pressure and 75 kg/s of mass flow rate.
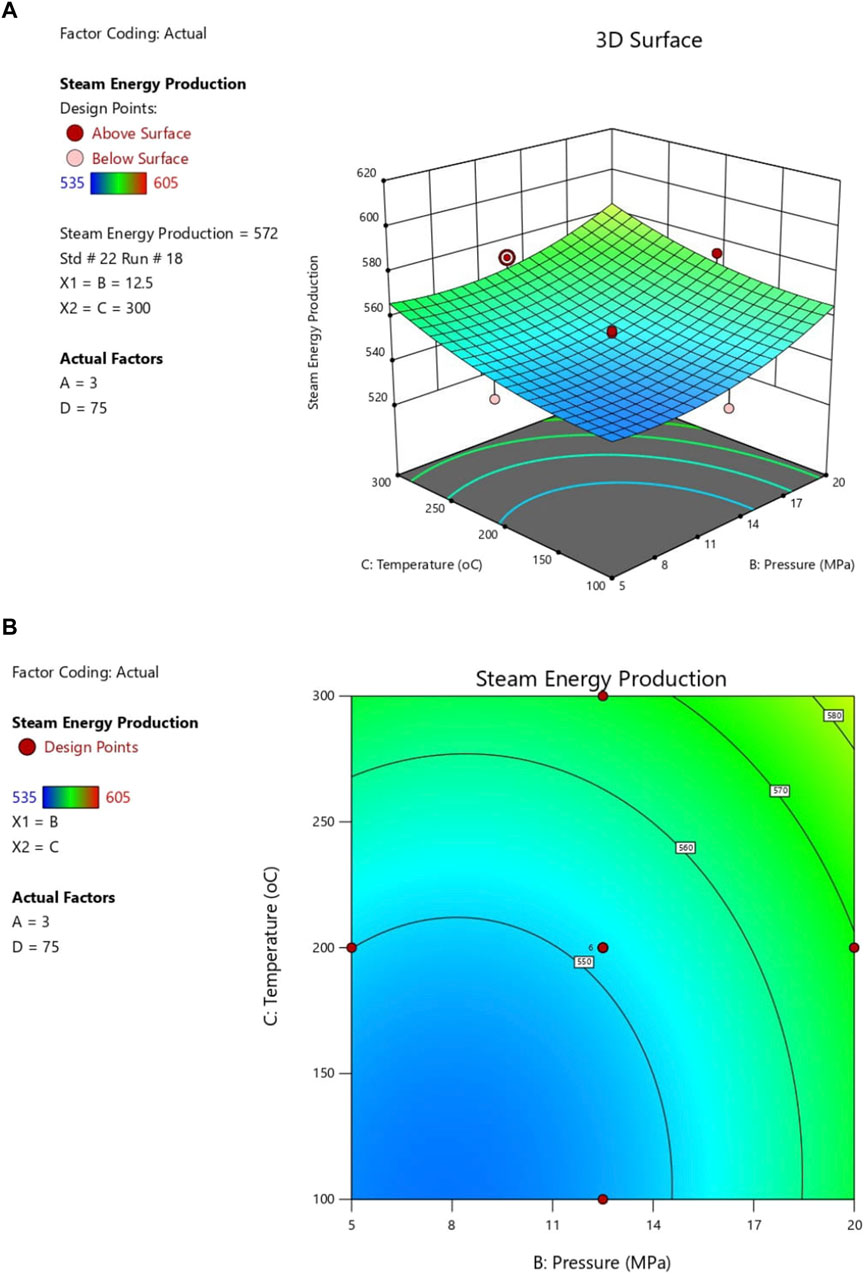
Figure 5. (A) 3D response surface plot showing the effect of temperature and pressure level on steam energy production at constant 3 h of time and 75 kg/s of mass flow rate. (B) 2D contour plot showing the effect of temperature and pressure level on steam energy production at constant 3 h of time and 75 kg/s of mass flow rate.
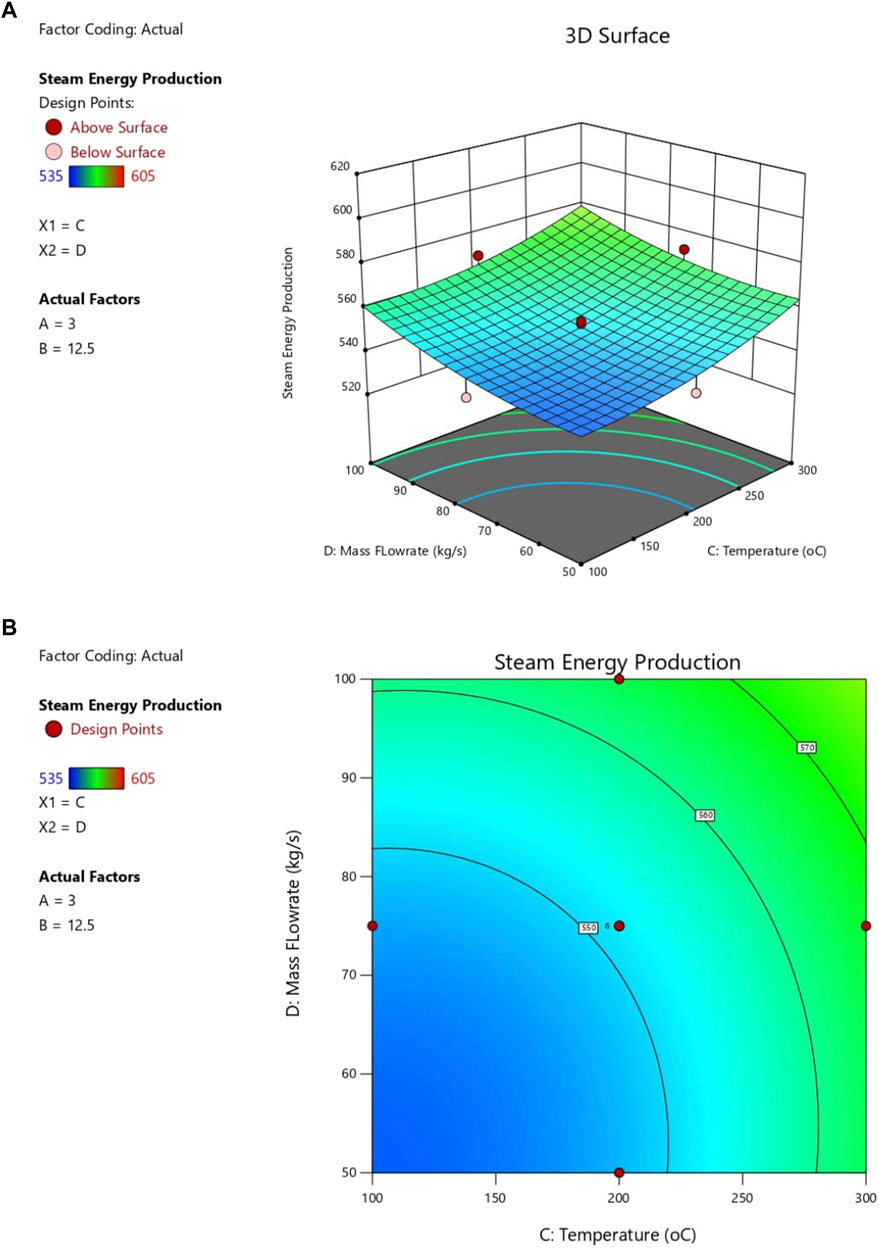
Figure 6. (A) 3D response surface plot showing the effect of temperature and mass flow rate on steam energy production at constant 3 h of time and 12.5 MPa of pressure level. (B) 2D contour plot showing the effect of temperature and mass flow rate on steam energy production at constant 3 h of time and 12.5 MPa of pressure level.
Similarly, steam energy generation rose with increasing temperature and time (Figures 4A, B) due to increased pressure on boiling water, requiring more energy to convert water into steam. Optimal steam energy (572 Cal) was observed at a pressure of 12.5 MPa and 3-h operation. Figures 5A, B depicts the pressure-temperature relationship on steam energy production. Simultaneous increases in temperature and pressure elevated energy transfer (enthalpy) in heat exchangers at higher levels, enhancing energy generation efficiency. Optimal steam energy (572 Cal) occurred at 12.5 Mpa pressure and 300°C temperature, with constant time and mass flow rate. Regarding temperature and mass flow rate interaction (Figures 6A, B), it was found that simultaneous increases enhanced steam velocities entering heat exchangers and water boiling point pressure, augmenting heat energy transfer to fluids and overall efficiency (Vargas et al., 2000). Maximum steam energy (569 Cal) was recorded at 3-h operation and 12.5 Mpa pressure, with constant temperature.
3.4 Optimum conditions of operating parameters
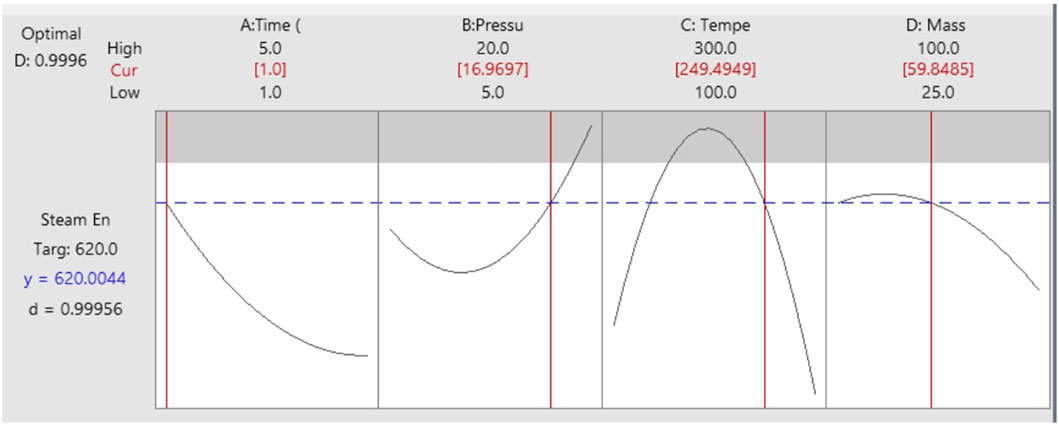
The optimal values of operating factors that enhance steam energy generation are shown in Figure 7. An optimum yield of steam energy (620 Cal) was attained at a time, pressure, temperature, and mass flow rate of 1 h, 16.97 MPa, 249.5°C, and 59.85 kg/s, respectively (Figure 8). Any value of the operating factors above or below these optimal values would lead to a reduction in steam energy generation. The ANOVA result (Table 3) obtained showed that the p-value is (> 0.05), Consequently, the established mathematical model stands as a reliable and practical tool for forecasting the steam energy production.
3.5 Validations of results
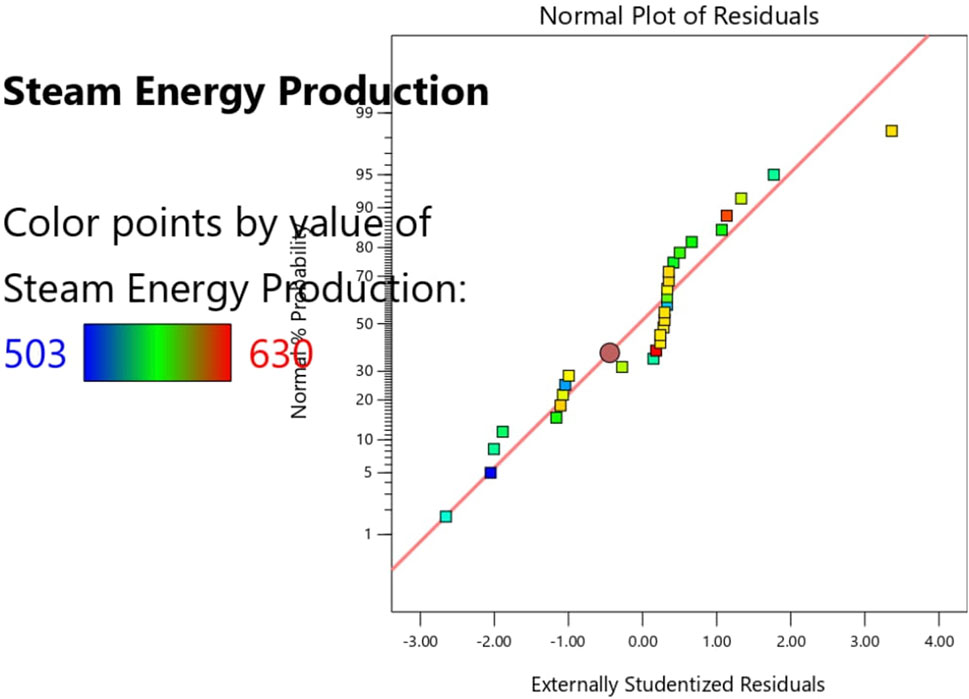
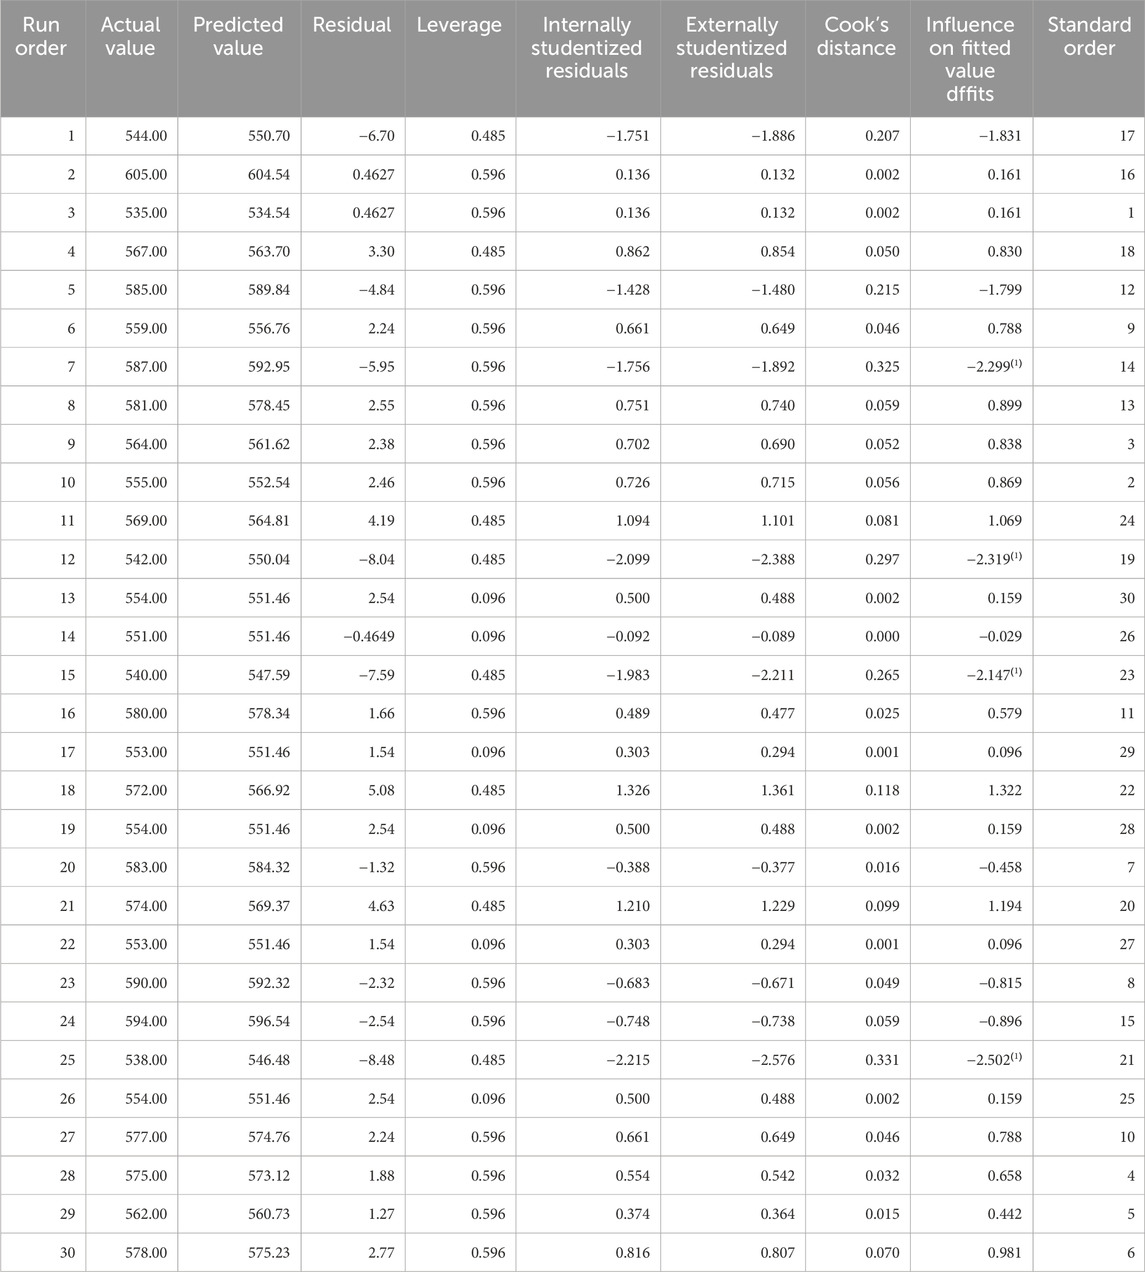
Tables 3, 4 revealed good agreement between the predicted and actual data. The variances were similar, suggesting comparable variability patterns (Table 3). Additionally, a strong positive linear association between the two variables was evident from the high correlation coefficient near 1. Furthermore, the very low t-statistic (0.000216) indicated a minimal difference between the predicted and actual values. The p-values, exceeding 0.05 for both one-tailed (0.4999) and two-tailed (0.9998) tests (Table 4), suggested a lack of statistically significant difference between the predicted and actual values. In other words, we failed to reject the null hypothesis, implying no meaningful difference in means exists. Similarly, the t-statistic being significantly lower than critical values reinforces the conclusion that the observed difference is likely due to random chance rather than a true discrepancy between the actual and predicted data. The t-test results and p-values thus support the interpretation that any observed variations are attributable to random fluctuations rather than reflecting a substantial difference between the predicted and actual values. Furthermore, the predicted values are in close proximity with the actual values as their values align along the regression line (Figure 8), thereby confirming the model’s efficacy. Hence, the mathematical model can replicate the experimental data accurately.
4 Conclusion
Steam energy plays a vital role in the food and beverage industry’s production, processing, handling, and packaging, such as cooking, sterilization, drying, humidification, etc,. The study utilized response surface methodology (RSM) based on centre composite design (CCD) to develop an experimental design matrix using four operating factors names time ranging from 1 to 5 h, pressure level (5–20 Mpa), temperature (100°C–300°C), and mass flow rate ranged between 50–100 kg/s, each varies at three levels of experimental runs. The response (steam energy production) and the operational factors were input into the Design-Expert version 13.0 software to generate a mathematical model, which was utilized for predicting and optimizing steam energy production. Increasing pressure and time significantly boosted steam energy production by elevating the water’s energy content, thereby reducing the required water mass circulation and enhancing steam energy production efficiency. Conversely, elevated temperature and extended operational time improved economizer efficiency, leading to higher heat recovery at the steam generation outlet, resulting in reduced steam energy generation. Similarly, steam energy generation increased with rising temperature and time due to the heightened pressure on boiling water, necessitating more energy for water-to-steam conversion. An optimal steam energy yield of 620 calories was achieved at specific conditions: 1 h time, 16.97 MPa pressure, 249.5°C temperature, and a mass flow rate of 59.85 kg/s. The ANOVA analysis showed that the mathematical model was significant, reliable, and responsive due to the high F-value (24.48), low CV (0.943) and low p-value (< 0.005). The predicted values correlate very well with the experimental values, confirming the model’s capability to reproduce the experimental data. It was observed that the R2 value (0.9821) is close to 1 and the difference between the adjusted (0.9132) and predicted R2 value (0.7968) falls within the recommended range of 0.1164. Hence, the mathematical model accurately predicts the experimental data. This study contributes to predicting future steam energy production for industrial usage and reduces the bottle in performing rigorous experimental runs.
Data availability statement
The original contributions presented in the study are included in the article/Supplementary Material, further inquiries can be directed to the corresponding authors.
Author contributions
OO: Conceptualization, Data curation, Formal Analysis, Methodology, Resources, Software, Validation, Writing–original draft, Writing–review and editing. AO: Conceptualization, Data curation, Formal Analysis, Investigation, Methodology, Software, Supervision, Validation, Visualization, Writing–original draft, Writing–review and editing. BA: Funding acquisition, Investigation, Methodology, Project administration, Software, Supervision, Writing–original draft, Writing–review and editing. SI: Conceptualization, Funding acquisition, Investigation, Methodology, Resources, Supervision, Validation, Writing–original draft, Writing–review and editing. EO: Data curation, Funding acquisition, Investigation, Methodology, Resources, Software, Visualization, Writing–original draft, Writing–review and editing.
Funding
The author(s) declare that no financial support was received for the research, authorship, and/or publication of this article.
Acknowledgments
The Authors appreciate the Management of Pan-Atlantic University, Lekki, Nigeria for their immense contributions to the success of the study.
Conflict of interest
The authors declare that the research was conducted in the absence of any commercial or financial relationships that could be construed as a potential conflict of interest.
Publisher’s note
All claims expressed in this article are solely those of the authors and do not necessarily represent those of their affiliated organizations, or those of the publisher, the editors and the reviewers. Any product that may be evaluated in this article, or claim that may be made by its manufacturer, is not guaranteed or endorsed by the publisher.
References
Ahmadi, P., and Dincer, I. (2018). 1.28 energy optimization. Compr. Energy Syst. 1, 1085–1143. doi:10.1016/B978-0-12-809597-3.00135-8
Akhtar, M., Shankarampeta, A., Gupta, V., Patil, A., Cocarascu, O., and Simperl, E. (2023) “Exploring the numerical reasoning capabilities of language models: a comprehensive analysis on tabular data,” in Computer science > computation and language. Cornell University.
Akinbami, J., Ilori, M. O., and Sanni, A. A. (2002). Improving energy use efficiency in Nigeria’s industrial sector: a case study of a beverage plant. Int. J. Glob. Energy Issues 18, 239. doi:10.1504/IJGEI.2002.000962
Albana, A., and Dahdah, S. S. (2023). Improving the quality of boiler feed water based on the PDCA cycle by integrating seven tools. Daengku Journal of Humanities and Social Sciences Innovation, 3 (6), 907–915. doi:10.35877/454RI.daengku2113
As’ad, R., Alkhati, O., and Alkhatib, O. (2019). Two-stage closed-loop supply chain models under consignment stock agreement and different procurement strategies. Appl. Math. Model. 65 (2019), 164–186. doi:10.1016/j.apm.2018.08.007
Bensouici, M., Azizi, M. W., and Bensouici, F. Z. (2023). Performance analysis and optimization of regenerative gas turbine power plant using RSM. Int. J. Automot. Mech. Eng. 20 (3), 10671–10683. doi:10.15282/ijame.20.3.2023.10.0824
Bouamama, B. O., Medjahera, K., Samantaray, A. K., and Staroswiecki, M. (2006). Supervision of an industrial steam generator. Part I: bond graph modelling. Control Eng. Pract. 14 (2006), 71–83. doi:10.1016/j.conengprac.2005.01.004
Bouamama, B. O., Staroswiecki, M., Riera, B., and Cheri, E. (2015). Multi-modelling of an industrial steam generator. Control Eng. Pract. 8 (2000), 1249–1260. doi:10.1016/s0967-0661(00)00018-6
Chien, S., and Schrodt, J. L. G. (1995). Determination of steam quality and flow rate using pressure data from an orifice meter and a critical flowmeter. E&P Technol. Dept 10, 76–81. doi:10.2118/24832-pa
Díaz, S. P. (2001). “Modelling and simulation of an industrial steam boiler with Ecosimpro,” in 1st meeting of EcosimPro users (Madrid: UNED), 1–10.
Dieckhoffff, C., Appelrath, H. J., Fischedick, M., Grunwald, A., and Höfflfflffler, F. (2014). Interpretation of energy scenarios, Mai 2014. München: acatech-Deutsche Akademie der Technikwissenschaften, 2014. (in German).
Efetobor, U. J., Onokwai, A. O., Onokpite, E., and Okonkwo, U. C. (2024). Response surface methodology application for the optimization of biogas yield from an anaerobic Co-digestion process. Port. Electrochem. Acta 42, 205–221. (Scopus Indexed). doi:10.4152/pea.2024420304
Egeonu, D., Oluah, C., Okolo, P., and Njoku, H. (2015). Thermodynamic optimization of steam boiler parameter using genetic algorithm. Innovative Syst. Des. Eng. 6 (11), 53–64.
Ehsan, A., Mahsa, M., and Omid, F. V. (2019). A novel model for optimization of logistics and manufacturing operation service composition in Cloud manufacturing system focusing on cloud-entropy. Int. J. Prod. Res. 58 (10), 1–29.
Guo, S., Liu, D., Chen, X., Chu, Y., Xu, C., Liu, Q., et al. (2017). Model and control scheme for recirculation mode direct steam generation, parabolic trough solar power plants. Appl. Energy 202, 700–714. doi:10.1016/j.apenergy.2017.05.127
Hasananto, N., Darmadi, D. B., and Yuliati, L. (2021). Modelling of load variation effect on the steam power plant heat rate and performance using Gatecycle. IOP Conf. Ser. Mater. Sci. Eng. 1034, 012048. IOP Publishing. doi:10.1088/1757-899X/1034/1/012048
Hassan, S. N. A., Ishak, M. A., and Ismail, K. (2017). Optimizing the physical parameters to achieve maximum products from co-liquefaction using response surface methodology. Fuel 207 (2017), 102–108. doi:10.1016/j.fuel.2017.06.077
Hossain, A., Ganesan, P., Laxmi, J., and Chinna, K. (2017). Optimization of process parameters for microwave pyrolysis of oil palm fiber (OPF) for hydrogen and biochar production. Energy Convers. Manag. 133 (2017), 3 49–362. doi:10.1016/j.enconman.2016.10.046
Khoshhal, A., Rahimi, M., and Alsairafifi, A. A. (2010). The CFD modeling of NOx emission, HiTAC, and heat transfer in an industrial boiler. Numer. Heat. Transf. Part A Appl. 58, 295–312. doi:10.1080/10407782.2010.505156
Kumar, G., Kim, S. H., Lay, C. H., and Ponnusamy, V. K. (2020). Recent developments on alternative fuels, energy and environment for sustainability. Bioresour. Technol. 317, 124010. doi:10.1016/j.biortech.2020.124010
Kumar, M., Mishra, P. K., and Upadhyay, S. N. (2019). Pyrolysis of Saccharum munja: optimization of process parameters using response surface methodology (RSM) and evaluation of kinetic parameters. Bioresour. Technol. Rep. 8 (2019), 100332. doi:10.1016/j.biteb.2019.100332
Laouge, Z. B., Çığgın, A. S., and Merdun, H. (2020). Optimization and characterization of bio-oil from fast pyrolysis of Pearl Millet and Sida cordifolia L. by using response surface methodology. Fuel 274, 117842. doi:10.1016/j.fuel.2020.117842
Liu, B., Bao, B., Wang, Y., and Xu, H. (2017). Numerical simulation of flow, combustion and NO emission of a fuel-staged industrial gas burner. J. Energy Inst. 90, 441–451. doi:10.1016/j.joei.2016.03.005
Liu, B., Wang, Y.-H., and Xu, H. (2016). Numerical study of the effect of staged gun and quarl on the performance of low-NOx burners. J. Energy Eng. 142, 04015040. doi:10.1061/(asce)ey.1943-7897.0000296
Maddah, H., Sadeghzadeh, M., Ahmadi, H., Kumar, R., and Shamshirband, S. (2019). Modeling and efficiency optimization of steam boilers by employing neural networks and response-surface method (RSM). Mathematics 7 (7), 629. doi:10.3390/math7070629
Madu, K. (2018). Performance analysis of a steam power plant operating under superheated and isentropic conditions. Equat. J. Eng. 2018, 22–28.
Martin, M., Kasina, K. J., and Mutiso, J. (2020). Application of central composite design to optimize spawns propagation. Open J. Optim. 9 (3), 2020.
Meshalkin, V. P., Bobkov, V. I., Maksim, D., and Khodchenko, S. M. (2017). Optimizing the energy efficiency of the chemical and energy engineering process of drying of a moving dense multilayer mass of phosphorite pellets. Dokl. Chem. 477 (2), 286–289. doi:10.1134/s0012500817120059
Nadir, M., Ghenaiet, A., and Carcasci, C. (2016). Thermo-economic optimization of heat recovery steam generator for a range of gas turbine exhaust temperatures. Appl. Therm. Eng. 106, 811–826. doi:10.1016/j.applthermaleng.2016.06.035
Nainggolan, E. A., Banout, J., and Urbanova, K. (2023). Application of central composite design and superimposition approach for optimization of drying parameters of pretreated cassava flour. Foods 12, 2101. doi:10.3390/foods12112101
Okokpujie, I. P., Onokwai, A. O., Onokpite, E., Babaremu, K., Ajisegiri, E. S. A., Osueke, C. O., et al. (2023). Modelling and optimisation of intermediate pyrolysis synthesis of bio-oil production from palm kernel shell. Clean. Eng. Technol. 16 (2023), 100672. doi:10.1016/j.clet.2023.100672
Olusanya, O. O., Olabode, E., Olakunle, K., Onokwai, O. A., Omoniyi, E. B., and Olakunle, A. J. (2023). “Application of programmable electronic flow meter for enhanced data capturing: a case study of the beverage industry in ogun state, Nigeria,” in International conference on science, engineering and business for sustainable development goals (SEB-SDG), Omu-Aran, Nigeria, 05-07 April 2023 (IEEE), 57117–57123. doi:10.1109/SEB-SDG57117.2023.10124623
Onokpite, E., Balogun, A. O., Onokwai, A. O., Oki, M., Olabisi, S. A., and Oyebanji, J. O. (2023). Preliminary characterization of woody and non-woody biomass samples based on physicochemical, structural composition and thermal analyses for improving bio-oil yield quality. Port. Electrochem. Acta 42, 285–298. doi:10.4152/pea.2024420404
Onokwai, A. O., Ajisegiri, S. A. E., Omoniyi, E. B., Aliyu, J. S., Ibikunle, A. R., Onokpite, E., et al. (2023a). “Optimization of process parameters for intermediate pyrolysis of sugarcane bagasse for biochar production using response surface methodology,” in International conference on science, engineering and business for sustainable development goals (SEB-SDG), Omu-Aran, Nigeria, 05-07 April 2023 (IEEE). doi:10.1109/SEB-SDG57117.2023.10124642
Onokwai, A. O., Okokpujie, I. P., Ajisegiri, E. S. A., Nnodim, C. T., Kayode, J. F., and Tartibu, L. K. (2023b). Application of response surface methodology for the modelling and optimisation of bio-oil yield via intermediate pyrolysis process of sugarcane bagasse. Adv. Mater. Process. Technol., 1–19. doi:10.1080/2374068X.2023.2193310
Onokwai, A. O., Okokpujie, I. P., Onokpite, E., Ajisegiri, E. S. A., Oki, M., Onokpite, E., et al. (2023c). Optimization of pyrolysis operating parameters for biochar production from palm kernel shell using response surface methodology. Math. Model. Eng. Problems 10 (3), 757–766. doi:10.18280/mmep.100304
Onokwai, A. O., Okonkwo, U. C., Osueke, C. O., Okafor, C. O., Olayanju, T. M. A., and Dahunsi, S. O. (2019). Design, modelling, energy and exergy analysis of a parabolic cooker. Renew. Energy 142 (2019), 497–510. doi:10.1016/j.renene.2019.04.028
Onokwai, A. O., Owamah, H. I., Ibiwoye, M., Ayuba, G., and Olayemi, O. A. (2022). Application of response surface methodology (RSM) for the optimization of energy generation from jebba hydro-power plant, Nigeria. ISH J. Hydraulic Eng. 28 (1), 1–9. doi:10.1080/09715010.2020.1806120
Osueke, C. O., Onokwai, A. O., and Adeoye, A. O. (2015b). Energy and exergy analysis of a 75MW steam power plant in sapele (Nigeria). Int. J. Innovative Res. Adv. Eng. (IJIRAE) 11 (2), 169–179. Available at: http://www.ijirae.com/volumes/Vol2/iss6/26.JNAE10124.pdf.
Osueke, C. O., Onokwai, A. O., Adeoye, A. O., and Ezugwu, C. A. K. (2015a). Enhancing the performance of 75MW steam power plant with second law efficiency, condenser pressure, and rankine cycle. Int. J. Eng. Sci. (IJES) 10 (9), 18–29. Available at: http://www.theijes.com/papers/v4-i9/Version-2/C0492018029.pdf.
Park, S. H., Kim, H. J., and Cho, J. I. (2008). Optimal central composite designs for fitting second order response surface linear regression models. Physica-Verlag HD, 323–339. doi:10.1007/978-3-7908-2064-5_17
Pealy, H. (2024). Safety and security: the top 10 APAC food and beverage industry food safety and security stories from 2023. FoodNavigator Asia.
Podlasek, S., Lalik, K., Filipowicz, M., Sornek, K., Kupski, R., and Raś, A. (2016). Mathematical modeling of control system for the experimental steam generator. EPJ Web Conf. 114, 02151. doi:10.1051/epjconf/201611402151
Qi, F., Shukeir, E., and Kadali, R. (2015). Model predictive control of once through steam generator steam quality. IFAC-PapersOnLine 48-8, 716–721. doi:10.1016/j.ifacol.2015.09.053
Salahi, F., Zarei-Jelyani, F., and Rahimpour, M. R. (2023). Optimization of hydrogen production by steam methane reforming over Y-promoted Ni/Al2O3 catalyst using response surface methodology. J. Energy Inst. 108 (2023), 101208. doi:10.1016/j.joei.2023.101208
Singha, A., and Forcinito, M. (2018) “Emission characteristic map and optimization of NOx in 100 MW staged combustion once-through steam-generator (OTSG),” in Proceedings of the AFRC Industrial Combustion Symposium, Salt Lake City, UT, USA, 17–19.
Stanley, R., and Pedrosa, F. (2011). Managing steam quality in food and beverage processing. UK: Spirax Sarco Ltd.
Szpisják-Gulyás, N., Al-Tayawi, A. N., Horváth, Z. H., László, Z., Kertész, S., and Hodúr, C. (2023). Methods for experimental design, central composite design and the Box–Behnken design, to optimise operational parameters: a review. Acta Aliment. 52 (4), 521–537. doi:10.1556/066.2023.00235
Szymon, K. L., Filipowicz, M., Sornek, K., Kupski, R., and Ra, A. (2016). Mathematical modeling of a control system for the experimental steam generator EPJ Web of Conferences 114. doi:10.1051/epjconf/2016110
Thornock, J. N., Spinti, J. P., and Hradisky, M. (2014). Evaluating the NOx performance of a steam generator for heavy oil production. Am. Flame Res. Comm. Houst. TX, USA.
Tripathi, M., Bhatnagar, A., Mubarak, N. M., Sahu, J. N., and Ganesan, P. (2020). RSM optimization of microwave pyrolysis parameters to produce OPS char with high yield and large BET surface area. Fuel 225, 118184. doi:10.1016/j.fuel.2020.118184
Umelo-Ibemere, N. C. (2023). Extended central composite designs for second-order model: a performance comparison. Asian J. Pure Appl. Math. 5 (1), 98–111. Available at: https://globalpresshub.com/index.php/AJPAM/article/view/1798.
Varganova, A. V., Khramshin, V., and Radionov, A. A. (2023). Operating modes optimization for the boiler units of industrial steam plants. Energies 16 (6), 2596. doi:10.3390/en16062596
Vargas, J. V. C., Benjan, O. A., and Bejan, A. (2000). Power extraction from a hot stream in the presence of phase change. Int. J. Heat Mass Transf. 43 (2000), 191–201. doi:10.1016/s0017-9310(99)00146-5
Wang, Y., Jin, X., Yang, L., He, X., and Wang, X. (2023). Predictive modeling analysis for the quality indicators of matsutake mushrooms in different transport environments. Foods 12, 3372. doi:10.3390/foods12183372
Yahya, H. S. M., Abbas, T., and Amin, N. A. S. (2021). Optimization of hydrogen production via toluene steam reforming over Ni–Co supported modified-activated carbon using ANN coupled GA and RSM. Int. J. Hydrogen Energy 46 (48), 24632–24651. doi:10.1016/j.ijhydene.2020.05.033
Keywords: steam energy generation, response surface methodology, mathematical modelling, optimization, boiler efficiency
Citation: Olusanya OO, Onokwai AO, Anyaegbuna BE, Iweriolor S and Omoniyi EB (2024) Modelling and optimization of operating parameters for improved steam energy production in the food and beverage industry in a developing country. Front. Energy Res. 12:1417031. doi: 10.3389/fenrg.2024.1417031
Received: 13 April 2024; Accepted: 06 June 2024;
Published: 04 July 2024.
Edited by:
Mufutau Adekojo Waheed, Federal University of Agriculture, Abeokuta, NigeriaReviewed by:
Collins Nwaokocha, Olabisi Onabanjo University, NigeriaOlufemi Babalola, Covenant University, Nigeria
Olawale Olaluyi, Bamidele Olumilua University of Education, Science and Technology, Nigeria
Copyright © 2024 Olusanya, Onokwai, Anyaegbuna, Iweriolor and Omoniyi. This is an open-access article distributed under the terms of the Creative Commons Attribution License (CC BY). The use, distribution or reproduction in other forums is permitted, provided the original author(s) and the copyright owner(s) are credited and that the original publication in this journal is cited, in accordance with accepted academic practice. No use, distribution or reproduction is permitted which does not comply with these terms.
*Correspondence: Olamide O. Olusanya, b29vbHVzYW55YUBiZWxsc3VuaXZlcnNpdHkuZWR1Lm5n; Anthony O. Onokwai, b25va3dhaWFudGhvbnlAZ21haWwuY29t; Benjamin E. Anyaegbuna, YmFueWFlZ2J1bmFAcGF1LmVkdS5uZw==
 Olamide O. Olusanya
 Anthony O. Onokwai
 Benjamin E. Anyaegbuna2*