- 1EHV Maintenance and Test Center of China Southern Power Grid, Guangzhou, China
- 2XJ Electric Flexible Transmission Company, Xuchang, China
Introduction: Precise fault diagnosis is crucial for enhancing the reliability and lifespan of the flexible converter valve equipment. To address this issue, depthwise separable convolution, bidirectional gate recurrent unit, and multi-head attention module (DSC-BiGRU-MAM) based fault diagnosis approach is proposed.
Methods: By DSC and BiGRU operation, the model can capture the correlation between local features and temporal information when processing sequence data, thereby enhancing the representation ability and predictive performance of the model for complex sequential data. In addition, by incorporating a multi-head attention module, the proposed method dynamically learns important information from different time intervals and channels. The proposed MAM continuously stimulates fault features in both time and channel dimensions during training, while suppressing fault independent expressions. As a result, it has made an important contribution to improving the performance of the fault diagnosis model.
Results and Discussion: Experimental results demonstrate that the proposed method achieves higher accuracy compared to existing methods, with an average accuracy of 95.45%, average precision of 88.67%, and average recall of 89.03%. Additionally, the proposed method has a moderate number of model parameters (17,626) and training time (935 s). Results indicate that the proposed method accurately diagnoses faults in flexible converter valve equipment, especially in real-world situations with noise overlapping signals.
1 Introduction
The flexible converter valve equipment is a critical component in power systems as it facilitates the conversion between high-voltage direct current transmission and AC transmission (Zhang X. et al., 2021). Nonetheless, this equipment is susceptible to malfunctions due to its intricate structure and operating environment, thereby potentially affecting the overall operation of the power system (He et al., 2020). Consequently, an effective fault diagnosis method is imperative to ensure the safe and stable operation of the power system.
Currently, fault diagnosis methods mainly include two categories: model-based methods and machine learning methods (Zhang et al., 2023). Model-based methods rely on manual empirical judgment or simple rules for fault diagnosis, e.g., fault tree analysis (Yazdi et al., 2017) and state observer method (Hizarci et al., 2022). These methods suffer from issues such as subjective interpretation, low diagnostic efficiency, and susceptibility to human biases (Zhao et al., 2022). Moreover, model-based methods have limited capabilities in handling complex and variable fault modes as well as large amounts of data (How et al., 2019; Esmail et al., 2023). Additionally, these methods heavily depend on manual feature extraction and rule design for fault diagnosis. Due to the complex and ever-changing nature of flexible converter valve equipment, these methods have limitations in extracting features and designing rules for flexible converter valve equipment (Habibi et al., 2019).
Based on this, researchers proposed fault diagnosis methods for flexible converter valve equipment using machine learning algorithms (Rohouma et al., 2023). For instance, in a study by scholars (Ye et al., 2019), a KFCM and support vector machine algorithm was proposed. This algorithm is capable of quickly and accurately diagnosing faults in analog circuits. To enhance the convergence speed and generalization performance of diagnostic methods, scholars (Muzzammel, 2019) designed a machine learning method to diagnose short faults in High Voltage Direct Current (HVDC) transmission system.
However, the above-mentioned machine learning methods rely on historical data and algorithmic rules for trial and error training. The iterative process automatically adjusts and fine-tunes the model parameters to obtain appropriate results (Abedinia et al., 2016). Due to lack of deep feature extraction, machine learning methods may perform poorly in diagnosing large amounts of data, heterogeneous signals, and complex signals (Zhang et al., 2017).
In recent years, deep learning methods have gained significant popularity in the field of fault diagnosis due to their ability to extract fault features at a deeper level and achieve high diagnostic accuracy (Yuan and Liu, 2022). For instance, in the case of insulator strings on transmission lines, researchers (Zhou et al., 2022) presented deep convolutional generative adversarial network to capture comprehensive fault data characteristics, which enables accurate diagnosis of insulator string faults and defects, even under conditions of strong background noise. To against noise, a steady-state screening model-based feedforward-long short-term memory (FF-LSTM) is proposed to reduce complex variations for lithium-ion batteries (Wang et al., 2022). In addition, an improved anti-noise adaptive long short-term memory (ANA-LSTM) neural network with high-robustness feature extraction and optimal parameter characterization is proposed for accurate RUL prediction for lithium-ion batteries (Wang et al., 2023).
To effectively extract subtle fault features, scholars (Salehi et al., 2023) proposed transfer learning depthwise separable convolutional neural network to address the issue of single-phase-to-ground fault line selection in resonant grounding system. The smaller number of separable convolutional neural network parameters increases the portability of the model (Zhou et al., 2020).
To extend the previously mentioned research methods to flexible converter valve equipment, it is essential to analyze and summarize the fault diagnosis challenges specific to this type of equipment. The following challenges are identified as crucial research opportunities for diagnosing faults in flexible converter valve equipment:
(1) The flexible converter valve equipment has a complex and ever-changing structure and working environment, which leads to nonlinear characteristics in sensor data and increases the difficulty of fault diagnosis.
(2) Flexible converter valve equipment is subject to varying operational conditions, resulting in non-stationary data patterns that can be difficult to analyze and interpret.
(3) In many cases, the available data samples for faulty operations of flexible converter valve equipment are scarce, which makes it challenging to develop accurate models for fault diagnosis.
This article aims to propose a fault diagnosis method for flexible converter valve equipment based on DSC-BiGRU-MAM, and address the research challenges mentioned above. The specific contributions are as follows:
(1) A novel framework is proposed to extract deep features from the data generated by flexible converter valve equipment. This framework leverages advanced deep learning techniques to automatically learn and capture intricate fault patterns, even in the presence of limited fault samples and non-stationary working conditions.
(2) To avoid the disadvantage of neglecting fault categories with smaller sample sizes during the training process, overlapping sampling method is applied to expand categories with smaller sample sizes through. The application of overlapping sampling methods also helps to reduce the risk of overfitting. Because fault categories with smaller sample sizes usually have larger variances, they can easily lead to overfitting problems. By overlapping sampling, it is possible to increase the training samples for these fault categories, reduce overfitting of the model to specific fault categories, and improve the model’s generalization ability.
(3) By employing the proposed fault diagnosis models, accurate classification of faults in flexible converter valve equipment can be achieved, thus facilitating timely and effective maintenance actions. As a result, maintenance professionals can take prompt and appropriate actions to address the identified issues, minimizing downtime and maximizing the operational efficiency of the equipment.
2 DSC-BiGRU-MAM method
2.1 Depthwise separable convolution
Convolutional neural networks (CNN) are a type of artificial neural network primarily designed for processing video and image data. As shown in Figure 1A, they excel at extracting features from input images and leveraging these learned features to classify output images (Nguyen et al., 2020). In order to extend the benefits of CNN to text data, a specialized variant known as the 1D Convolutional Neural Network (1DCNN) has been developed and successfully applied in signal processing and sequence data analysis (Junior et al., 2022). As shown in Figure 1B, 1DCNN performs convolution operations on input sequences to extract informative features, enabling it to tackle tasks such as sequence data classification and regression.
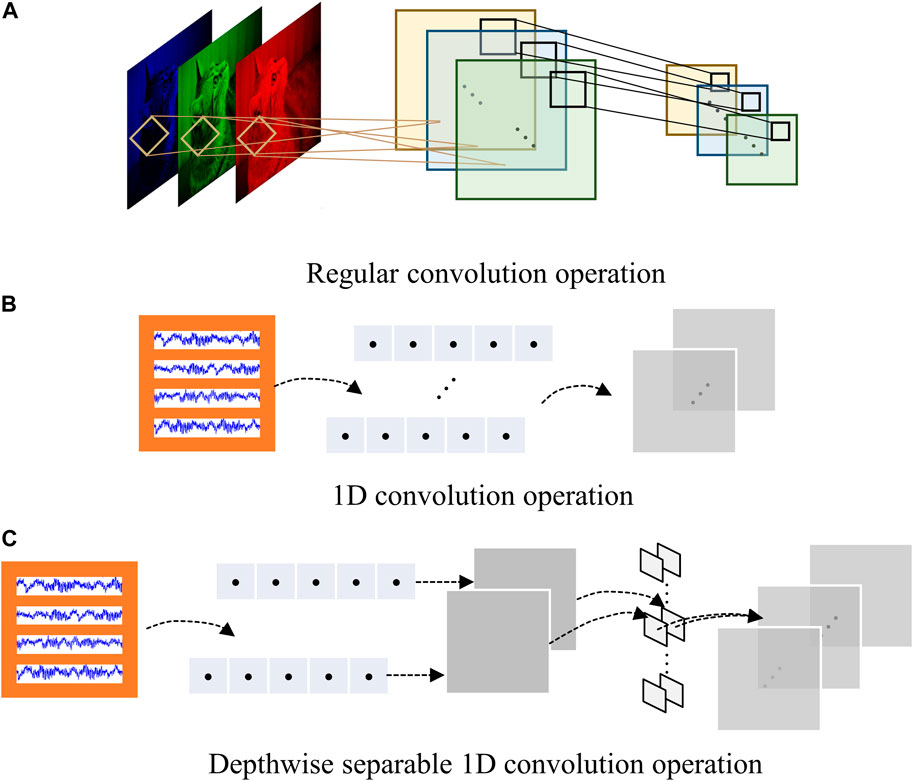
Figure 1. The difference between (A) Regular convolution layer, (B) 1D convolution layer and (C) Depthwise separable 1D convolution layer.
1DCNN has the following important characteristics:
(1) The 1D Convolutional Neural Network is capable of capturing local correlations within input sequences. By utilizing convolutional kernels of various sizes, the 1DCNN performs sliding window operations on the input sequences at different scales, extracting local subsequences of varying lengths (Hsu et al., 2022). This ability enables the network to effectively capture local patterns and features present in the input sequence.
(2) In the convolutional layer, each convolutional kernel convolves with the entire input sequence, resulting in the creation of a new feature map. Consequently, the number of parameters that the model needs to learn remains fixed regardless of the length of the input sequence. This parameter sharing mechanism substantially reduces model complexity, leading to increased training efficiency.
(3) 1DCNN can enhance the depth and complexity of the model by stacking multiple convolutional and pooling layers (Xiao et al., 2023). This architecture enables the 1DCNN to perform multi-level feature extraction and abstraction. As a result, the network gradually learns more sophisticated and abstract representations of the input sequence’s features. This ability significantly enhances the model’s expressive power when dealing with intricate and complex sequence data.
As shown in Figure 1C, depthwise separable convolution decomposes the 1DCNN into two separate operations: depthwise convolution and
where
This technique offers significant advantages by reducing both the number of parameters and the floating-point operations required for the convolutional operation (Salehi et al., 2023). Depthwise separable 1D-convolution has the following important characteristics:
(1) It reduces the number of parameters compared to traditional convolutional operations. By separating the spatial and channel dimensions, it applies a separate
(2) It also decreases the overall computation cost. By decomposing the convolution into separate depthwise and pointwise convolutions, it requires fewer floating-point operations, resulting in improved computational efficiency.
(3) It allows for more flexibility in model architecture design. It enables the use of different kernel sizes for the depthwise and pointwise convolutions, providing control over the receptive field and feature representation of the network.
(4) Due to its parameter efficiency and hierarchical structure, it helps prevent overfitting and improve generalization performance on various tasks and datasets.
2.2 Bidirectional gate recurrent unit
In order to consider the temporal correlation in the voltage signal data of the flexible converter valve, it is crucial to utilize Recurrent Neural Networks (RNN) for extracting the trend characteristics of data changes in time series (Bandara et al., 2020). RNNs are a specific type of neural network that take sequence data as input and recur in the direction of sequence evolution, with all nodes (recurrent units) interconnected in a chain. However, a common issue with RNNs is the problem of gradient attenuation. To address this, a solution called Long Short-Term Memory (LSTM) was proposed (Hochreiter and Schmidhuber, 1997). LSTM maintains the model’s memory of historical data through input gates, forgetting gates, and output gates, thereby preventing the loss of important information over time (Wang et al., 2023).
Another extension of RNN is the Bidirectional Gate Recurrent Unit (BiGRU), which was presented as a simplified version based on LSTM. It operates in a bidirectional manner, processing the input sequence in both forward and backward directions simultaneously (Zhang Y. et al., 2021). This allows the model to capture information from both past and future contexts, enabling a better understanding of the temporal dependencies in the time series data. The calculation of the BiGRU can be divided into two directions: forward and backward. Forward propagation convolution operation is shown in Eqs 3–6:
where input sequence is
where
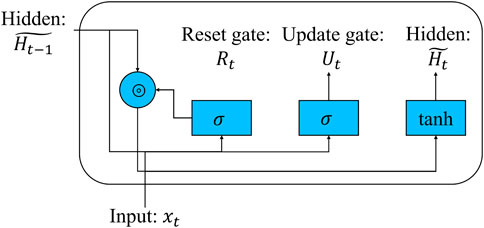
As shown in Figure 2, the reset gate in BiGRU contributes to capturing short-term dependencies in the time series. By evaluating the current input, it determines which preceding information should be disregarded or updated, enabling the model to concentrate on the pertinent short-term patterns present in the data. The update gate in BiGRU aids in capturing long-term dependencies in the time series. It decides how much of the previous information should be carried forward to the current step, allowing the model to retain important long-term patterns and context in the data.
Overall, the BiGRU architecture provides a balance between computational efficiency and capturing both short-term and long-term dependencies in time series data.
2.3 Multi-head attention mechanism
The attention mechanism is a technique employed to enhance a model’s focus on important parts of the input sequence. In sequential data processing tasks, attention mechanisms aid models in autonomously discerning the contributions of different positions or features to the given task and weighting them based on their significance. By incorporating attention mechanisms, models gain the ability to adaptively attend to various segments of the input sequence. In fault diagnosis tasks, attention mechanisms can direct the model’s attention towards signal fragments or features that may be pertinent to faults, thereby enhancing the accuracy and robustness of fault diagnosis. As depicted in Figure 3, the multi-head attention module induces the activation of fault-related features relying on the periodicity of temporal data or the importance of different convolutional kernel channels. It achieves more comprehensive semantic modeling by mapping input sequences into multiple different subspaces and calculating attention weights and weighted summation on each subspace. The proposed multi-head attention module has two attention heads, which can be represented as
where

Figure 3. Multi-head attention module which enhances fault-related features relying on temporal data and convolutional kernel channels, where GMP, GAP, and FC denote global mean pooling, global average pooling, and fully-connected layer, respectively.
Additionally, the proposed multi-head attention module provides an interpretable approach for understanding the decision-making process of deep learning networks. By analyzing the distribution of attention weights, researchers can discern the network’s inclination towards fault features at distinct time points or frequency ranges. This interpretability proves beneficial for subsequent fault analysis and optimization endeavors.
3 Proposed method
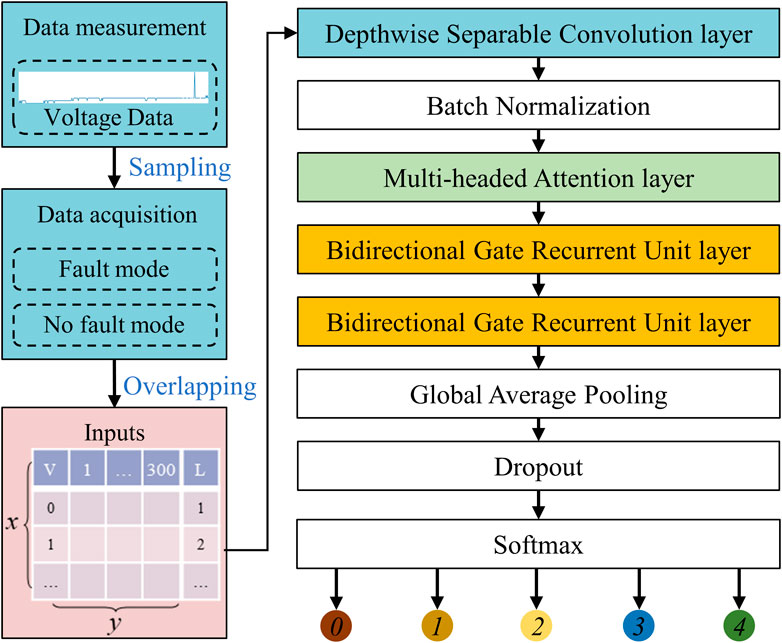
The fault diagnosis process of the proposed method is shown in Figure 4, and the main process is as follows:
(1) Preprocessing: In order to augment the data and ensure sample equalization on 1D voltage signals, we employed the overlapping sampling method. Specifically, for each sample type, we generated 300 datasets with overlapping step size determined by the number of fault samples of that type. This technique helped in reducing the class imbalance and ensured that each sample type had an equal representation in the training dataset. Moreover, by generating multiple datasets with varying overlapping sizes, we increased the robustness of the model to variations in the input data.
(2) Feature deep extraction process: The initial stage of our proposed approach involves the utilization of a depthwise separable 1D convolutional kernel measuring
(3) Classifier: The proposed method includes a global average pooling layer, which simplifies the model architecture and facilitates better generalization. Subsequently, the resulting feature maps are fed into a Softmax layer for classification. The model is optimized using a predefined loss function until either the maximum number of iterations is reached or the desired level of accuracy is achieved. Once trained, we evaluate the performance of the model using a distinct test set to determine the effectiveness of the fault diagnosis model. This evaluation helps to ensure that the model can accurately diagnose faults in previously unseen data and is robust enough to handle real-world scenarios.
4 Experimental verification
4.1 Experimental setup
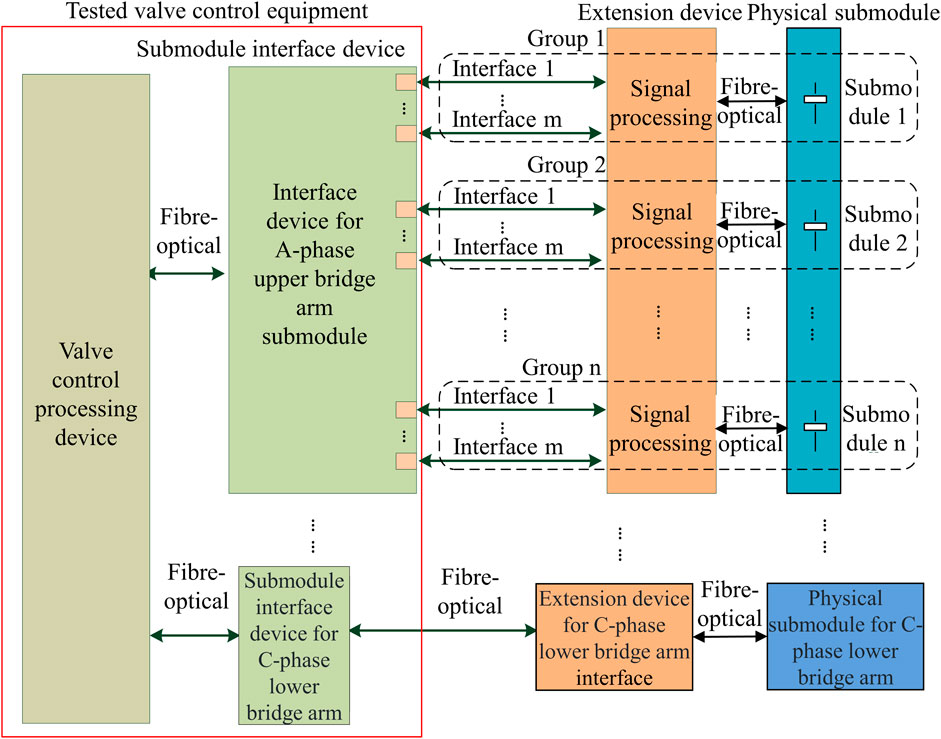
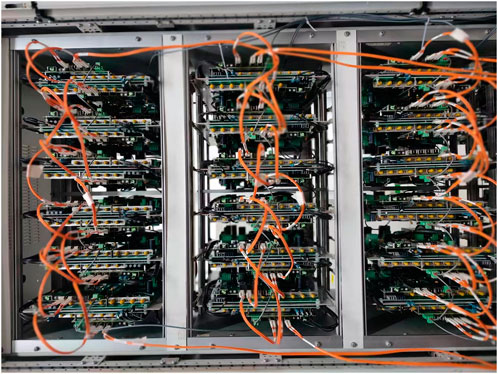
The overall structure of the flexible converter valve equipment is depicted in Figure 5. The control processing device utilizes the FCK611 control chassis, which consists of 1 MC board, 1 recording board, 1 LER board, and 54 SCE boards for networking purposes. A prototype of the flexible converter valve equipment is illustrated in Figure 6. It is notable that in the default configuration, the valve control command is initially received by Receiver 1. If there is a communication fault with Receiver 1, the system switches to Receiver 2. In case of a malfunction with Receiver 1, frame synchronization is instead carried out using Receiver 2.
The flexible converter valve may experience faults or failures, which can result in system instability or even damage. In this article, the main types of faults diagnosed include component fault, fiber optic fault, power supply voltage drop fault, and abnormal flow injection fault. Component fault occurs due to mechanical wear and tear, overheating, or the aging of the valve’s components. When a valve fails, it can cause a short circuit, which can lead to a loss of DC voltage and a sudden drop in the converter’s output. In addition, a valve failure can produce high-frequency noise, which can interfere with other components in the system. Fiber optic fault in a flexible converter valve refers to a failure or damage to the fiber optic cables that are used for data communication between the different control systems and components of the valve. A fiber optic fault can occur due to various reasons, e.g., mechanical stress, bending, twisting, crushing, or exposure to high temperatures or harsh environments. When a fiber optic cable is damaged, it can result in signal loss or interruption, which can cause the valve to malfunction or even shut down. The power supply voltage drop is a common fault in the flexible converter valve, and it can occur due to a variety of reasons.
The power supply voltage drop in the flexible converter valve can be caused by various factors, including overloading of the power source, loose connections, corrosion in the electrical contacts, or damaged cables or wires. When the voltage drops below the required level, the valve’s components may not receive enough power to operate correctly, leading to system instability or even complete failure. An abnormal flow injection fault in a flexible converter valve refers to an unexpected or irregular flow of a medium (e.g., coolant, oil, or gas) into the valve’s internal components or control systems. It may be caused by the leak in the valve’s seals, gaskets, or connections, foreign particles or contaminants enter the valve, and inadequate maintenance practices.
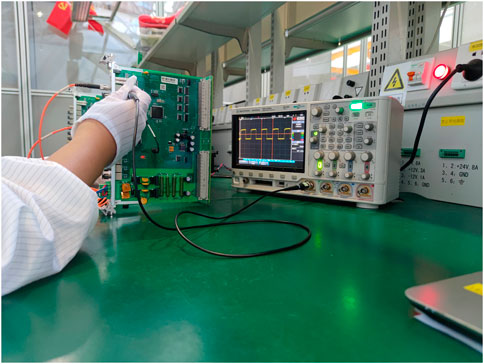
Data are collected using an oscilloscope, as depicted in Figure 7. The voltage waveform patterns for both normal conditions and different types of faults are presented in Figure 8.
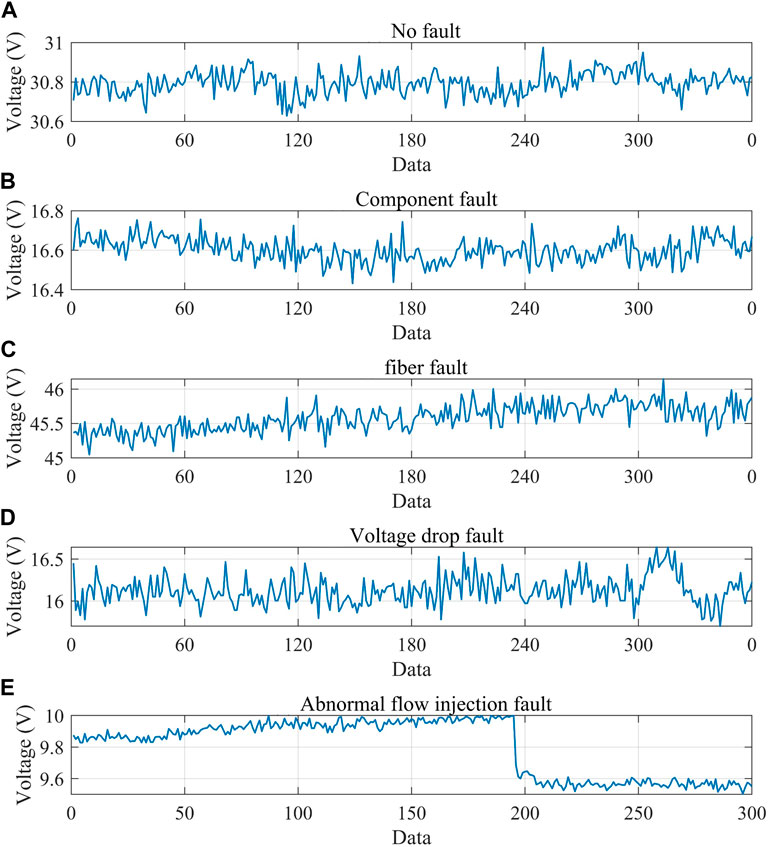
Figure 8. Voltage waveform under different faults. (A) No fault. (B) Component fault. (C) Fiber fault. (D) Voltage drop fault. (E) Abnormal flow injection fault.
The lengths of fault-free data samples, component fault, fiber fault, voltage drop fault, and abnormal flow injection fault are 22,800, 102,300, 345,600, 526,100, and 125,300, respectively. Each fault scenario is extended to 300 samples with 300 time series data through different overlapping sampling steps based on the sample length of each scenario. In total, 1,500 1D data samples of size 300 are obtained. To simulate data disturbances that may arise from equipment aging, external factors, and other factors during actual operation, we added 10% Gaussian noise to the dataset mentioned earlier. This noise was added to help improve the robustness of the model and ensure its effectiveness in practical applications.
80% of these samples were used for training purposes, while the remaining 20% was utilized for testing. Within the training samples, 20% of the data was allocated for validating the model under this iteration number.
The experiment used Google’s TensorFlow deep learning framework, version 2.3. The experiment was conducted in a Windows 11 operating environment, using a simulation device equipped with a Core i7-1165G7 2.8 GHz CPU. The hyper-parameter settings of the model are shown in Table 1. Among them, the optimizer selects Adam, the loss function selects classification cross entropy, the training method is min-batch, the batch size is 16, the number of iterations is set to 100, and the learning rate is set to 0.001.
To evaluate the performance of the proposed method, F1-score and Area Under Curve (AUC) are applied, which are range from zero (the worst) to one (the best) and convolution operation is shown in Eqs 14–17:
where
4.2 Result discussion
(1) Train loss: Figure 9 portrays the loss function indicators of the proposed method throughout the 100 iterations. It is evident that the accuracy and classification cross entropy of the proposed method tend to stabilize during the training process, indicating that the fault diagnosis model has reached a relatively optimal state.
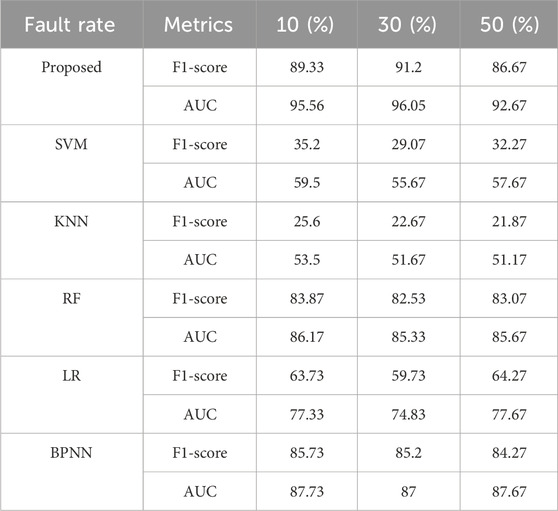
(2) Compared with machine learning methods: Due to the fact that the equipment designed in this article is still in the research and development stage, there are relatively few fault diagnosis methods for this equipment. Based on this, we compared classic fault diagnosis methods for similar devices, e.g., Support Vector Machines [SVM (Ye et al., 2019)], K-Nearest Neighbors [KNN (Chen, et al., 2023)], Random Forests [RF (Movahed et al., 2023)], Logistic Regression [LR (Mirsaeidi et al., 2018)], and Back Propagation Neural Networks [BPNN (Liu and Wang, 2023)]. The comparison results between the above method and the method proposed in this article are shown in Table 2. From the results, it can be seen that the F1-score and AUC of the proposed method in this article are significantly higher than classical methods under similar devices, indicating that the use of deep separable convolution and BiGRU has a positive impact on fault related feature extraction.
(3) Compared with deep learning methods: Under the same parameter configuration, the proposed method with multiple methods, and the model structures of different methods are shown in Table 3. Among them, Model 1, Model 2, Model 3, Model 4 and Model 5 do not contain attention modules, which are used to compare the accuracy of model that only consists of the BiGRU layer, the model that only consists of the BiLSTM layer and mixed models in fault diagnosis. Model 6, Model 7, Model 8, and Model 9 are all based on a mixture of Depthwise separable 1D Conv (DSC) and BiGRU models. After the DSC layer, the Squeeze and Excitation (SE) attention module (Li et al., 2018), Convolutional Block Attention Module (CBAM) module (Woo et al., 2018), Joint Attention Module (JAM) module (Wang et al., 2019), and multi-head Attention Module (MAM) module are added, respectively.
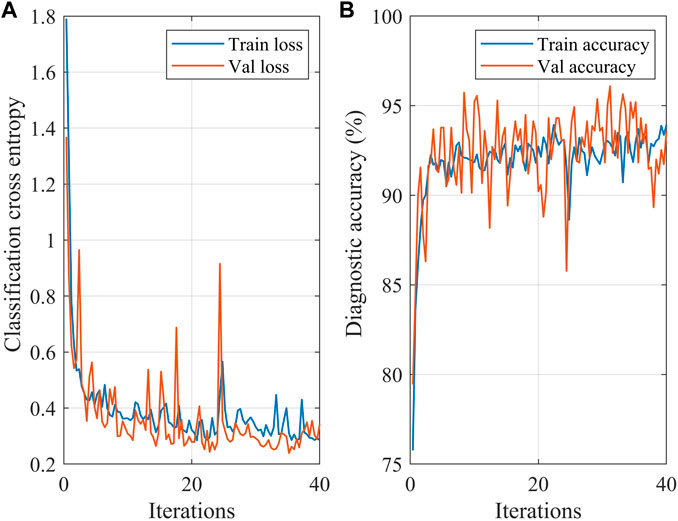
Figure 9. Loss and diagnostic accuracy within 100 iterations under 10% Gaussian noise. Results indicate that loss and accuracy tend to stabilize during the training process.
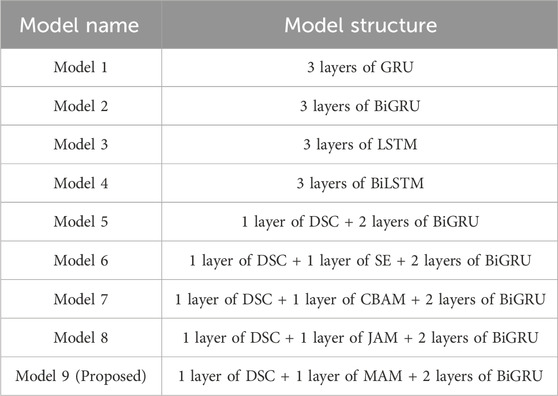
Table 3. Model structure of different methods, where “+” denotes serial connection. For instance, “1 layer of DSC + 1 layer of MAM + 2 layers of BiGRU” of Model 9 indicates that the structure of Model 9 is a DSC operation in the first layer, a MAM operation in the second layer, two BiGRU operations in the third and fourth layers. All models adopt global average pooling, Dropout and Softmax operation in the last layer.
Figure 10 demonstrates the characteristics of fault-related data (original signal in Figure 10A and frequency of signal in Figure 10B) after undergoing depthwise separable 1D convolution operation (in Figure 10C), multi-head attention operation (in Figure 10D), two BiGRU operations (in Figures 10E, F). It is evident that the fault-related data (represented by black dashed box) exhibit more distinct features compared to other time periods. Furthermore, other time periods’ noise data is effectively filtered out.
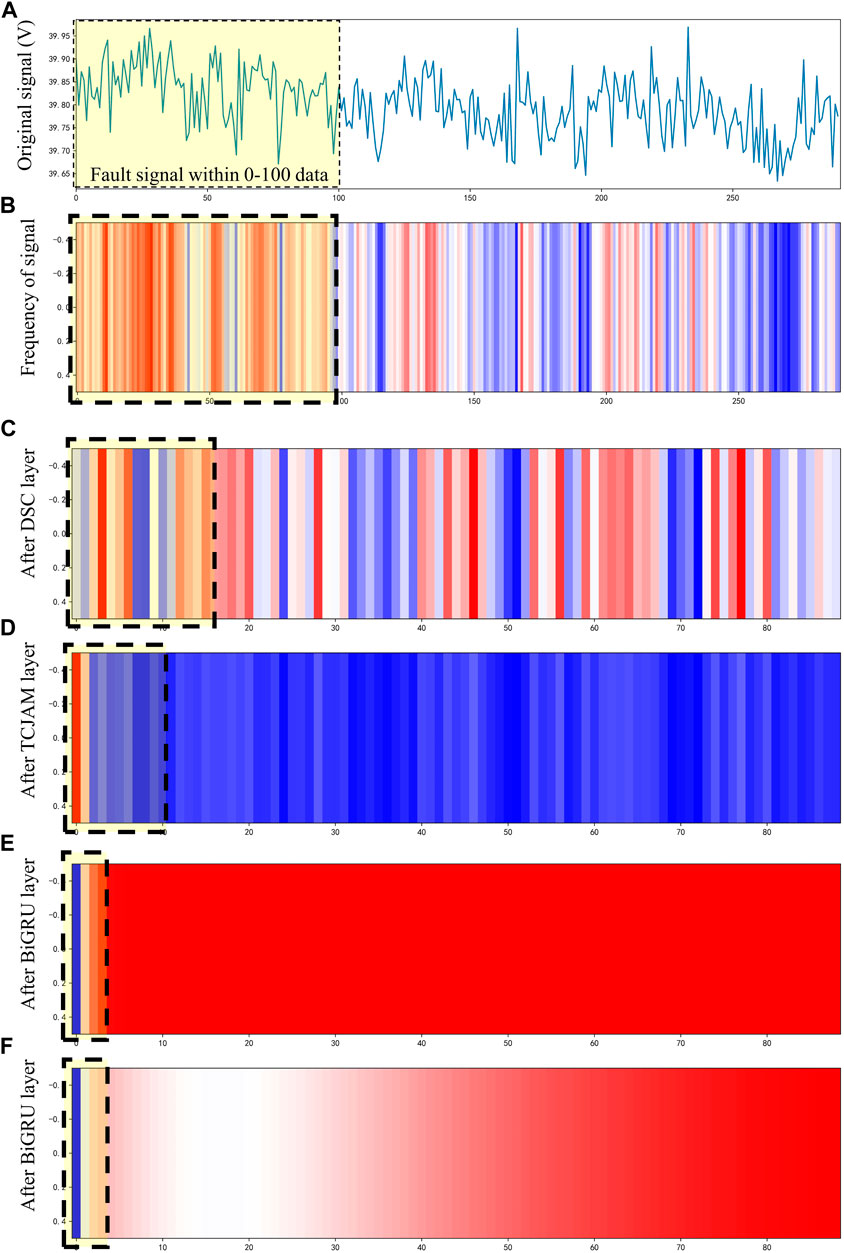
Figure 10. After extracting features, the data features are clearly polarized. (A) Original signal. (B) Frequency of signal. (C) After DSC layer. (D) After MAM layer. (E) After BiGRU layer. (F) After BiGRU layer.
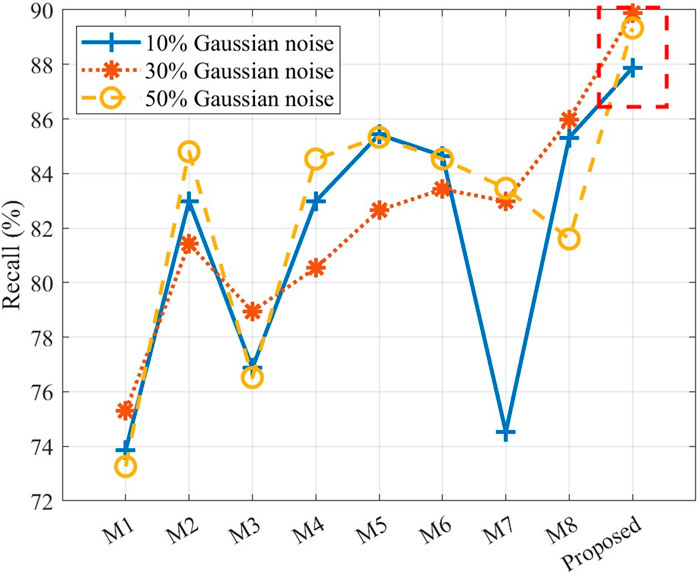
Figure 11A illustrates the average diagnostic accuracy, precision, and recall of the aforementioned models under 10%, 30%, and 50% Gaussian noise levels. Among them, precision refers to the proportion of samples correctly predicted as a specific fault among all the test samples, while recall represents the proportion of samples accurately predicted as a specific fault among all the test samples. Both of these evaluation metrics are commonly used to assess the performance of fault diagnosis models when dealing with imbalanced samples. The results indicate that the proposed method achieves the highest diagnostic accuracy among the repeated experiments, with an average of 95.45%, surpassing the second-highest method by 0.76%. This outcome suggests that the proposed method can accurately diagnose the five fault situations of the flexible converter valve equipment.
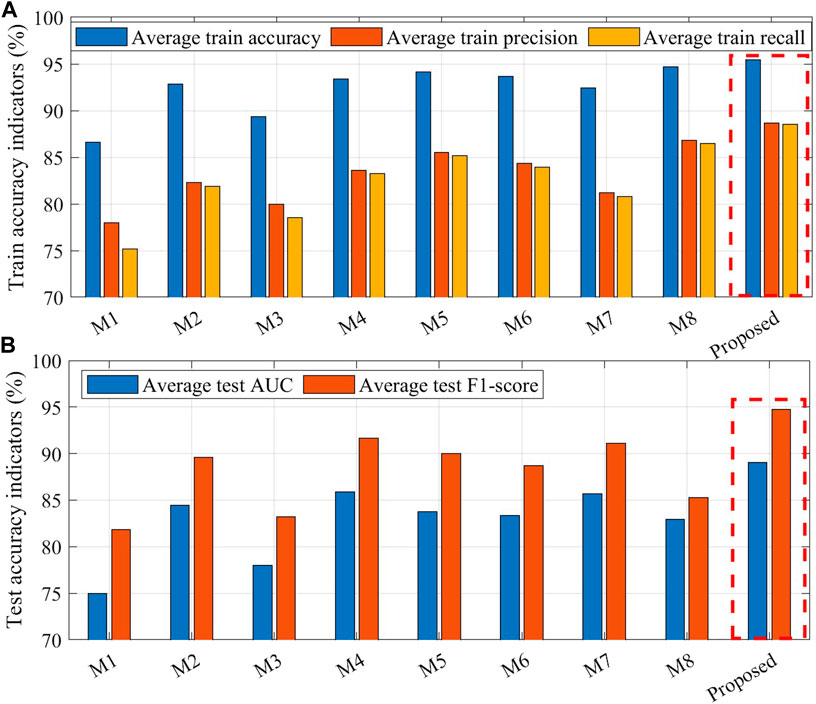
Figure 11. Accuracy indicators of different methods under 10%, 30%, and 50% Gaussian noise levels, where training results are shown as average diagnostic accuracy, precision, and recall in (A), testing results are shown as average F1-score, AUC in (B).
Based on Figure 11B, it is evident that the proposed method outperforms the comparative methods in terms of F1-score, AUC, and generalization. Results suggest that the proposed method can accurately diagnose the five fault situations with F1-score of 89.06% and AUC of 94.76% related to the flexible converter valve equipment.
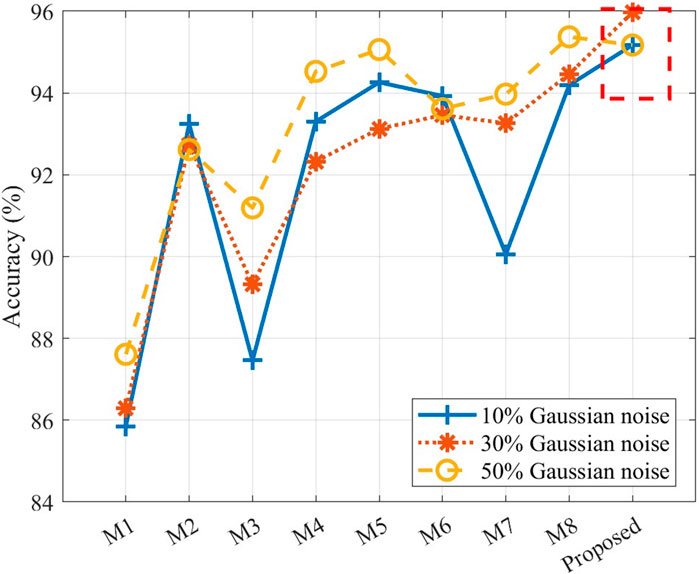
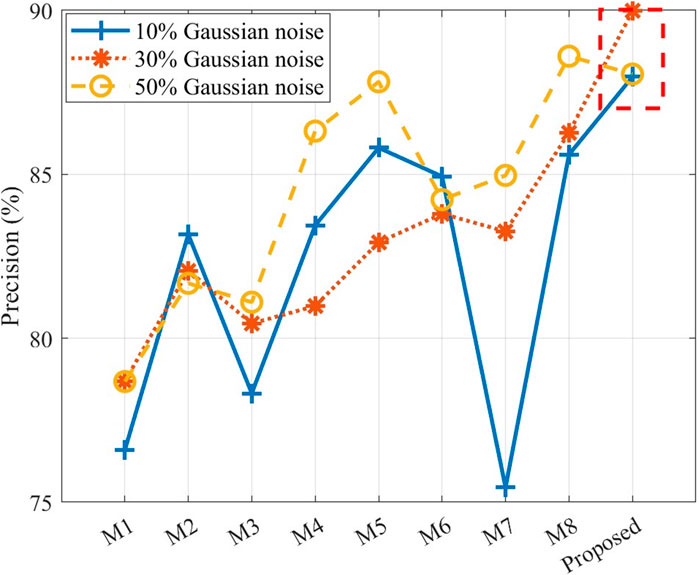
In addition, this study also compared the accuracy, precision, and recall of different models under Gaussian noise levels of 10%, 30%, and 50%, as shown in Figures 12–14. The reason for choosing these noise levels is that they represent varying degrees of noise interference. 10% noise level represents lower noise interference, 30% noise level represents moderate noise interference, and 50% noise level represents higher noise interference. By considering these different levels, the performance and robustness of the model can be evaluated and compared under different levels of noise. The results indicate that the proposed method achieved the highest accuracy metrics under all Gaussian noise levels. As the proportion of Gaussian noise increases, the accuracy metrics of all methods affected. However, due to the deep extraction of fault features, the proposed method has the minimum fluctuation of accuracy indicators. This also demonstrates the strong tolerance of the proposed method to noise during the actual operation of the device, maintaining high diagnostic accuracy even in the presence of data deviations caused by aging or other factors.
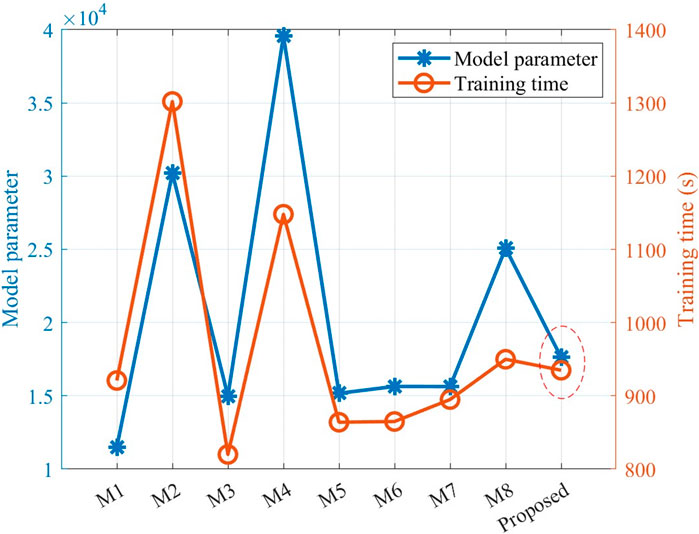
(4) Model efficiency: Figure 15 provides insights into parameters and time required for one iteration of the nine fault diagnosis models. In this figure, the blue line represents the model parameter quantity, while the red line represents the running time of one iteration. Model parameters refer to the number of weights, biases, and other learnable parameters in a model. The number of model parameters is usually proportional to the complexity of the model. More complex models typically have more parameters, requiring more computational resources and time for training. Choosing model parameters as a metric helps evaluate the complexity and availability of the model. Training deep learning models often requires significant computational resources and time. Iteration time refers to the time taken to complete one training iteration. Shorter iteration time means the model can complete training faster, thereby accelerating the speed of fault diagnosis processes. Additionally, shorter iteration time makes it easier to scale the model to large-scale datasets and more complex fault scenarios.
Based on the results, it is apparent that the proposed method has a moderate number of model parameters (17,626 parameters) and requires a reasonable amount of time for one iteration (approximately 935 s). Although the model parameters and training time of methods M1 and M3 are slightly lower than those of the proposed method, the diagnostic accuracy indicators of M1 and M3 methods are significantly lower than those of the proposed method. Considering the diagnostic accuracy and other indicators, it can be concluded that the proposed method achieves the highest diagnostic accuracy compared to the other methods. Additionally, the model’s parameter quantity and training time are also within acceptable ranges.
(5) Limitation of the proposed method: Although the experimental results illustrate that the proposed method can effectively diagnose the faults, the equipment diagnosed in the experiment is only a submodule of the flexible converter valve equipment. The impact of signal aliasing and the coupling of multiple submodule faults after the integration of multiple identical submodules in the practical application are not considered in this paper.
In practical applications, important faults usually need to pay more attention and higher priority in handling. Correspondingly, faults slightly impact the system are usually receiving little attention. The proposed method did not consider the importance of faults and provided preferential training based on the fault situation to ensure that important faults receive sufficient training.
5 Conclusion
This study addresses the limitations of diagnostic accuracy in flexible converter valve equipment by using DSC-BiGRU-MAM method. To evaluate the effectiveness of the proposed method, multiple fault data are acquired from the flexible converter valve through experimental methods. The data was enhanced balanced using overlapping sampling techniques. The results demonstrate that the proposed method can accurately diagnose the mentioned faults of flexible converter valve equipment in this paper. Compared to the comparative method, the proposed method exhibits higher accuracy (with an average diagnostic accuracy of 95.45%) and robustness (with a maximum difference in diagnostic accuracy of 0.76% across multiple experimental results), enabling more precise detection and diagnosis of various faults. The utilization of the proposed multi-head attention module enables achieving precise classification of faults in flexible converter valve equipment, which ultimately leads to facilitating timely and effective maintenance actions. Based on this, we can effectively extract informative features from raw sensor data and accurately identify different fault categories in the valve equipment. The proposed method can achieve good results in diagnosing voltage signals in different noise environments, and can be transferred into similar scenarios model fine-tuning by where voltage signals can reflect fault status, e.g., cable faults, circuit board faults, transformer faults.
In addition, smaller model size and less training time contribute to minimizing downtime and maximizing the operational efficiency of the equipment. In this way, the proposed method can be embedded into IoT device to achieve edge computing, reducing redundant data transmission and fault response time.
In the future, there is great potential for further optimization of both the model structure and algorithms in fault diagnosis. One aspect that can be considered is the importance of different faults. By assigning priority levels to each fault, the fault diagnosis system can determine which faults are more critical or have a higher impact on system performance. This allows for a prioritized approach to fault handling, ensuring that the most important faults are addressed first. To implement such prioritization, the fault diagnosis system can incorporate techniques such as fault severity assessment or fault criticality analysis. These techniques can provide a quantitative measure of the impact of each fault on system operation, allowing the system to make informed decisions regarding fault handling priorities.
Data availability statement
The raw data supporting the conclusion of this article will be made available by the authors, without undue reservation.
Author contributions
JG: Conceptualization, Data curation, Funding acquisition, Project administration, Writing–original draft. HL: Conceptualization, Writing–review and editing. LF: Data curation, Writing–review and editing. LZ: Data curation, Investigation, Writing–review and editing.
Funding
The author(s) declare financial support was received for the research, authorship, and/or publication of this article.
Acknowledgments
Authors greatly thank for the fund support of Innovation Project of China Southern Power Grid Co., Ltd.
Conflict of interest
Authors JG, HL, and LF were employed by EHV Maintenance and Test Center of China Southern Power Grid. Author LZ was employed by XJ Electric Flexible Transmission Company.
The authors declare that this study received funding from the Innovation Project of China Southern Power Grid Co., Ltd. (CGYKJXM20220059). The funder had the following involvement in the study: Conceptualization, Data curation, Writing–original draft, Writing–review and editing.
Publisher’s note
All claims expressed in this article are solely those of the authors and do not necessarily represent those of their affiliated organizations, or those of the publisher, the editors and the reviewers. Any product that may be evaluated in this article, or claim that may be made by its manufacturer, is not guaranteed or endorsed by the publisher.
References
Abedinia, O., Amjady, N., and Zareipour, H. (2016). A new feature selection technique for load and price forecast of electrical power systems. IEEE T. Pow. Sys. 32 (1), 62–74. doi:10.1109/TPWRS.2016.2556620
Bandara, K., Bergmeir, C., and Smyl, S. (2020). Forecasting across time series databases using recurrent neural networks on groups of similar series: a clustering approach. Expert Syst. Appl. 140, 112896. doi:10.1016/j.eswa.2019.112896
Chen, Q., Li, Q., Wu, J., He, J., Mao, C., Li, Z., et al. (2023). State monitoring and fault diagnosis of hvdc system via knn algorithm with knowledge graph: a practical China power grid case. Sustainability 15 (4), 3717. doi:10.3390/su15043717
Esmail, E. M., Alsaif, F., Abdel Aleem, S. H., Abdelaziz, A., Yadav, A., and El-Shahat, A. (2023). Simultaneous series and shunt earth fault detection and classification using the Clarke transform for power transmission systems under different fault scenarios. Front. Energy Res. 11, 1208296. doi:10.3389/fenrg.2023.1208296
Habibi, H., Howard, I., and Simani, S. (2019). Reliability improvement of wind turbine power generation using model-based fault detection and fault tolerant control: a review. Renew. Energy 135, 877–896. doi:10.1016/j.renene.2018.12.066
He, J., Chen, K., Li, M., Luo, Y., Liang, C., and Xu, Y. (2020). Review of protection and fault handling for a flexible dc grid. Prot. Con. Mod. Pow. Syst. 5, 15. doi:10.1186/s41601-020-00157-9
Hizarci, B., Kıral, Z., and Şahin, S. (2022). Optimal extended state observer based control for vibration reduction on a flexible cantilever beam with using air thrust actuator. Appl. Acoust. 197, 108944. doi:10.1016/j.apacoust.2022.108944
Hochreiter, S., and Schmidhuber, J. (1997). Long shortterm memory. Neural Comput. 9 (8), 1735–1780. doi:10.1162/neco.1997.9.8.1735
How, D., Hannan, M., Lipu, M., and Ker, P. (2019). State of charge estimation for lithium-ion batteries using model-based and data-driven methods: a review. IEEE Access 7, 136116–136136. doi:10.1109/ACCESS.2019.2942213
Howard, A., Zhu, M., Chen, B., Kalenichenko, D., Wang, W., Weyand, T., et al. (2017). Mobilenets: efficient convolutional neural networks for mobile vision applications. arXiv preprint arXiv:1704.04861.
Hsu, C., Lu, Y., and Yan, J. (2022). Temporal convolution-based long-short term memory network with attention mechanism for remaining useful life prediction. IEEE T. Semicond. M. 35 (2), 220–228. doi:10.1109/TSM.2022.3164578
Junior, R., Areias, I., Campos, M., Teixeira, C., Silva, L., and Gomes, G. (2022). Fault detection and diagnosis in electric motors using 1d convolutional neural networks with multi-channel vibration signals. Measurement 190, 110759. doi:10.1016/j.measurement.2022.110759
Li, H., **ong, P., An, J., and Wang, L. (2018). Pyramid attention network for semantic segmentation. arxiv preprint arxiv:1805.10180.
Liu, S., and Wang, S. (2023). Fault location of flexible dc system based on bp neural network. Eighth Int. Symposium Adv. Electr. Electron. Comput. Eng. (ISAEECE 2023) 12704, 640–645. doi:10.1117/12.2680124
Mirsaeidi, S., Dong, X., Tzelepis, D., Said, D., Dy´sko, A., and Booth, C. (2018). A predictive control strategy for mitigation of commutation failure in lcc-based hvdc systems. IEEE T. Power Electr. 34 (1), 160–172. doi:10.1109/TPEL.2018.2820152
Movahed, P., Taheri, S., and Razban, A. (2023). A bi-level data-driven framework for fault-detection and diagnosis of hvac systems. Appl. Energy 339, 120948. doi:10.1016/j.apenergy.2023.120948
Muzzammel, R. (2019). “Machine learning based fault diagnosis in hvdc transmission lines,” in Intelligent Technologies and Applications: First International Conference, 496–510.
Nguyen, N., Do, T., Ngo, T., and Le, D. (2020). An evaluation of deep learning methods for small object detection. J. Electr. Comput. Eng. 2020, 1–18. doi:10.1155/2020/3189691
Rohouma, W., Abdelkader, S., Ernest, E. F., Megahed, T. F., and Abdel-Rahim, O. (2023). A model predictive control strategy for enhancing fault ride through in PMSG wind turbines using SMES and improved GSC control. Front. Energy Res. 11, 1277954. doi:10.3389/fenrg.2023.1277954
Salehi, A., Khan, S., Gupta, G., Alabduallah, B., Almjally, A., Alsolai, H., et al. (2023). A study of cnn and transfer learning in medical imaging: advantages, challenges, future scope. Sustainability 15 (7), 5930. doi:10.3390/su15075930
Wang, H., Liu, Z., Peng, D., and Qin, Y. (2019). Understanding and learning discriminant features based on multiattention 1DCNN for wheelset bearing fault diagnosis. IEEE T. Ind. Inf. 16 (9), 5735–5745. doi:10.1109/TII.2019.2955540
Wang, S., Fan, Y., ∗∗, S., Takyi-Aninakwa, P., and Fernandez, C. (2023). Improved anti-noise adaptive long short-term memory neural network modeling for the robust remaining useful life prediction of lithium-ion batteries. Reliab. Eng. Syst. Safe. 230, 108920. doi:10.1016/j.ress.2022.108920
Wang, S., Takyi-Aninakwa, P., ∗∗, S., Yu, C., Fernandez, C., and Stroe, D. I. (2022). An improved feedforward-long short-term memory modeling method for the whole-life-cycle state of charge prediction of lithium-ion batteries considering current-voltage-temperature variation. Energy 254, 124224. doi:10.1016/j.energy.2022.124224
Wang, S., Wu, F., Takyi-Aninakwa, P., Fernandez, C., Stroe, D. I., and Huang, Q. (2023). Improved singular filtering-Gaussian process regression-long short-term memory model for whole-life-cycle remaining capacity estimation of lithium-ion batteries adaptive to fast aging and multi-current variations. Energy 284, 128677. doi:10.1016/j.energy.2023.128677
Woo, S., Park, J., Lee, J. Y., and Kweon, I. S. (2018). “Cbam: convolutional block attention module,” in Proceedings of the European conference on computer vision (ECCV), 3–19.
Xiao, F., Chen, T., Zhang, J., and Zhang, S. (2023). Water management fault diagnosis for proton-exchange membrane fuel cells based on deep learning methods. Int. J. Hydrogen Energy. 48, 28163–28173. doi:10.1016/j.ijhydene.2023.03.097
Yazdi, M., Nikfar, F., and Nasrabadi, M. (2017). Failure probability analysis by employing fuzzy fault tree analysis. Int. J. Syst. Assur. Eng. Manag. 8, 1177–1193. doi:10.1007/s13198-017-0583-y
Ye, Y., Zheng, J., and Mei, F. (2019). “Research on upfc fault diagnosis based on kfcm and support vector machine,” in 2019 14th IEEE Conference on Industrial Electronics and Applications (ICIEA), 650–655. doi:10.1109/iciea.2019.8834208
Yuan, Z., and Liu, J. (2022). A hybrid deep learning model for trash classification based on deep trasnsfer learning. J. Electr. Comput. Eng. 2022, 1–9. doi:10.1155/2022/7608794
Zhang, C., Zhao, S., Yang, Z., and He, Y. (2023). A multi-fault diagnosis method for lithium-ion battery pack using curvilinear Manhattan distance evaluation and voltage difference analysis. J. Energy Sto. 67, 107575. doi:10.1016/j.est.2023.107575
Zhang, W., Peng, G., Li, C., Chen, Y., and Zhang, Z. (2017). A new deep learning model for fault diagnosis with good anti-noise and domain adaptation ability on raw vibration signals. Sensors 17 (2), 425. doi:10.3390/s17020425
Zhang, X., Cong, Y., Yuan, Z., Zhang, T., and Bai, X. (2021). Early fault detection method of rolling bearing based on mcnn and gru network with an attention mechanism. Shock Vib. 2021, 1–13. doi:10.1155/2021/6660243
Zhang, Y., Luo, W., Sun, X., Zheng, Q., Zhao, C., and Chen, H. (2021). Multi⁃physical field coupling simulation analysis of flexible HVDC converter valve power module based on clamping IGBT element. Hi. Vol. App 57 (11), 84–92. doi:10.13296/j.1001⁃1609.hva.2021.11.011
Zhao, Z., Liu, X., and Gao, J. (2022). Model-based fault diagnosis methods for systems with stochastic process–a survey. Neurocomputing 513, 137–152. doi:10.1016/j.neucom.2022.09.134
Zhou, N., Liang, R., and Shi, W. (2020). A lightweight convolutional neural network for real-time facial expression detection. IEEE Access 9, 5573–5584. doi:10.1109/ACCESS.2020.3046715
Keywords: flexible converter valve equipment, fault diagnosis, feature extraction, depthwise separable convolution, bidirectional gated recurrent unit
Citation: Guo J, Liu H, Feng L and Zu L (2024) A fault diagnosis method for flexible converter valve equipment based on DSC-BIGRU-MA. Front. Energy Res. 12:1369360. doi: 10.3389/fenrg.2024.1369360
Received: 12 January 2024; Accepted: 25 March 2024;
Published: 12 April 2024.
Edited by:
Chaolong Zhang, Jinling Institute of Technology, ChinaReviewed by:
Xing Yang, Nanjing Agricultural University, ChinaShunli Wang, Southwest University of Science and Technology, China
Fangming Deng, East China Jiaotong University, China
Copyright © 2024 Guo, Liu, Feng and Zu. This is an open-access article distributed under the terms of the Creative Commons Attribution License (CC BY). The use, distribution or reproduction in other forums is permitted, provided the original author(s) and the copyright owner(s) are credited and that the original publication in this journal is cited, in accordance with accepted academic practice. No use, distribution or reproduction is permitted which does not comply with these terms.
*Correspondence: Jianbao Guo, Z2piMTA0QDE2My5jb20=
 Jianbao Guo
 Hang Liu1