- State Grid Information and Telecommunication Co., of SEPC, TaiYuan, China
Introduction: Intelligent power distribution systems are vital in the modern power industry, tasked with managing power distribution efficiently. These systems, however, encounter challenges in anomaly detection, hampered by the complexity of data and limitations in model generalization.
Methods: This study developed a Transformer-GAN model that combines Transformer architectures with GAN technology, efficiently processing complex data and enhancing anomaly detection. This model’s self-attention and generative capabilities allow for superior adaptability and robustness against dynamic data patterns and unknown anomalies.
Results: The Transformer-GAN model demonstrated remarkable efficacy across multiple datasets, significantly outperforming traditional anomaly detection methods. Key highlights include achieving up to 95.18% accuracy and notably high recall and F1 scores across diverse power distribution scenarios. Its exceptional performance is further underscored by achieving the highest AUC of 96.64%, evidencing its superior ability to discern between normal and anomalous patterns, thereby reinforcing the model’s advantage in enhancing the security and stability of smart power systems.
Discussion: The success of the Transformer-GAN model not only boosts the stability and security of smart power distribution systems but also finds potential applications in industrial automation and the Internet of Things. This research signifies a pivotal step in integrating artificial intelligence into the power sector, promising to advance the reliability and intelligent evolution of future power systems.
1 Introduction
In today’s energy field, smart power distribution systems, as a key component of power grid modernization, shoulder the important task of achieving efficient and reliable power supply Zhang et al. (2022a). With growing energy demands and rapid technological advances, the complexity of these systems is increasing. In this context, anomaly detection has become one of the core issues to ensure the stable operation of the system. Anomaly detection refers to identifying deviations from normal operating patterns in power systems Karkhaneh and Ozgoli (2022). These anomalies may be caused by equipment failure, operational errors, or external factors such as natural disasters Calvo-Bascones et al. (2023). Although anomaly detection is critical to prevent power outages and maintain system integrity, implementing it in smart power distribution systems presents many challenges. These challenges include the high dimensionality of the data, complex system dynamics, and the diversity of abnormal patterns.
Deep learning, as a powerful machine learning tool, has been widely used in anomaly detection research in smart power distribution systems Xiong et al. (2022). Deep learning algorithms are able to process large amounts of data and extract complex features from it, which makes them particularly suitable for handling the high dimensionality and complexity of power system data de Oliveira and Bollen (2023). In addition, time series prediction technology is particularly important in the field of anomaly detection in smart power distribution systems. This is because power system data are essentially time series data, with characteristics and anomaly patterns evolving over time Cascone et al. (2023). Time series forecasting allows researchers to not only identify current anomalies, but also predict possible anomalies in the future, thereby taking steps in advance to prevent potential failures or disruptions Xia et al. (2022). This plays a vital role in ensuring system reliability and efficiency. By analyzing and predicting time series data through deep learning models, researchers can more accurately identify and respond to abnormal states in the power system, thus promoting the development of smart power distribution systems to a higher level Ahmad et al. (2022); Zhao et al. (2022). In this article, we will explore in detail anomaly detection methods in smart power distribution systems, especially the application of deep learning and time series forecasting, and discuss how these techniques can help solve current challenges.
In recent years, many researchers have made significant progress in the field of anomaly detection in smart power distribution systems. For example, researchers have proposed a model based on convolutional neural networks (CNN), which can effectively process and analyze time series data of power systems. This method utilizes the powerful feature extraction capabilities of CNN to identify abnormal patterns and demonstrates high detection accuracy Han et al. (2022). However, the disadvantage of this model is that it is highly dependent on the amount of data and requires a large amount of labeled data for training, which may be difficult to achieve in practical applications. In addition, a well-known team proposed a model based on long short-term memory network (LSTM) specifically for prediction and anomaly detection of dynamic changes in power systems Lee et al. (2022). The LSTM model is widely adopted due to its advantages in processing time series data. This work has achieved some success in predicting future power loads, but its main limitation lies in the model’s performance in handling nonlinear complex data that needs to be improved. In addition, scholars in related fields have adopted anomaly detection methods based on autoencoders. Autoencoders are able to effectively identify anomalies by learning the normal patterns of data by reconstructing the input data Radaideh et al. (2022). This research performed well on some benchmark dataset, but its limitation lies in its limited ability to detect novel or unseen anomaly patterns and may not effectively address all potential anomalies in the power system. Finally, some scholars have proposed an ensemble learning method that combines multiple different machine learning models to improve the accuracy and robustness of anomaly detection Roy and Debbarma (2022). Their method improves the overall performance by fusing the advantages of different models. However, the main disadvantage of this method is that it has high computational complexity and requires a large amount of computing resources, which may limit its application in resource-limited environments. Although the above research has made certain progress in the field of anomaly detection in smart power distribution systems, each method has its limitations. These studies provide us with valuable experience and enlightenment, and point out the direction of future research, which is the need to develop detection models that are more efficient, more accurate, and have better adaptability to different types of anomalies Chen et al. (2022).
Based on the shortcomings of the above work, we proposed the Transformer-GAN network, which combines the powerful characteristics of the Transformer architecture and the generative adversarial network (GAN) to solve the challenges in the field of anomaly detection in smart power distribution systems. The Transformer module plays a key role in encoding and feature extraction to better capture long-term dependencies in time series data through a self-attention mechanism Zhang G. et al. (2022). At the same time, the introduction of the generative adversarial network module helps improve anomaly detection performance. The generator learns the distribution of data and generates normal patterns, and the discriminator improves the accuracy and generalization ability of anomaly detection Ge et al. (2022); Tian et al. (2022). Our model can not only identify current abnormal conditions, but also predict possible future abnormalities, providing support for timely intervention measures to ensure the stability and reliability of the power system. By fully leveraging the advantages of Transformer and GAN, we provide powerful tools for the modernization of power systems to meet the growing energy demand and promote the further development of smart power distribution systems. Figure 1 shows the network architecture of Transformer-GAN. The left part is the training stage of the model. First, the sliding window mechanism is used to divide the input multi-dimensional time series into multiple sequence subsets. Then, train the built Transformer-GAN model. After the model training is completed, it enters the anomaly detection stage on the right, where the generator obtains the reconstruction loss based on the difference between the reconstructed sample and the actual sample. At the same time, the trained discriminator calculates the discriminant loss based on the generated sample data. Finally, both losses are combined to detect potential anomalies in the data.
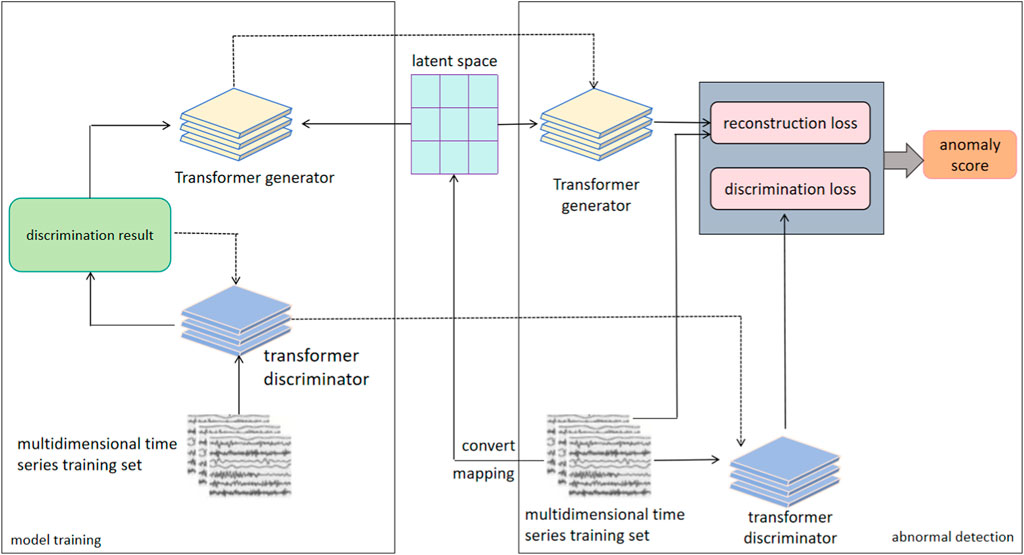
FIGURE 1. The network architecture of Transformer-GAN. Dashed connections represent the transfer of information flow or data flow.
Transformer-GAN is a comprehensive and efficient solution, especially suitable for anomaly detection in power distribution systems. Our model not only solves several key limitations of existing technology, but also provides new directions and ideas for future research. Through this model, we expect to make greater contributions to the stability and security of the power system. Below, we highlight three key contributions of this paper:
• We successfully combined Transformer with Generative Adversarial Network (GAN) and innovatively proposed the Transformer-GAN model. The Transformer module utilizes the self-attention mechanism to better capture long-term dependencies in time series data, and the Generative Adversarial Network module improves anomaly detection performance. Through this combination, we effectively improve the model’s recognition accuracy of abnormal states of the power system, especially the performance when processing large-scale and complex data.
• We introduced an adaptive learning mechanism into the model, which significantly improved the model’s adaptability to new abnormal patterns. This mechanism enables the model to self-adjust according to real-time changes in power system operating data, thereby more effectively identifying and predicting unknown or rare abnormal patterns. This is crucial to cope with dynamic changes and emerging new faults in the power system, improving the overall stability and safety of the system.
• Our proposed Transformer-GAN network provides a powerful tool for the modernization of power systems. As energy demand continues to grow, smart power distribution systems are facing more complex and efficient management challenges. Our model is not only able to effectively process complex time series data, but also accurately identifies abnormal patterns, improving the stability and reliability of the system. By predicting possible anomalies in advance, our model supports timely intervention in system operation, thereby reducing potential failures and disruptions. These characteristics will help promote the further development of smart power distribution systems and provide more reliable and efficient solutions for future energy management.
2 Related work
2.1 Research on smart grid based on deep learning time series
Deep learning-based methods for time series analysis have made significant research advancements in the context of smart grids. For instance, the utilization of Long Short-Term Memory networks (LSTMs) for electricity load forecasting has yielded highly accurate load predictions, facilitating real-time grid management Lin et al. (2022). However, this approach has limitations, primarily in its reliance on large-scale annotated data, which can be challenging to obtain. Additionally, the model’s generalization performance is influenced by data quality and timeliness. Furthermore, deep learning time series models find application in detecting faults in electrical equipment, such as Convolutional Neural Networks (CNNs) employed to identify abnormal states in power transformers, enhancing equipment reliability Thomas et al. (2023). Nonetheless, these models necessitate substantial sensor data from the equipment and the maintenance of data quality and sensor accuracy, potentially increasing maintenance costs. Deep learning time series methods can also be employed for anomaly detection in power grids, for example, using autoencoders to identify abnormal operations within the power system, contributing to grid security Li and Jung (2023). However, autoencoders require a significant amount of normal operation data for training and may not be sensitive enough to detect novel or rare anomaly patterns.
2.2 Research on anomaly detection in smart grid based on GAN network
GAN can be used to identify fraud in the power system. For example, by using GAN on power transaction data for anomaly detection, it can help prevent market fraud Hilal et al. (2022). However, the GAN method is very sensitive to the quality and distribution assumptions of the data. If the data quality is not high or the distribution is complex, it may lead to a decrease in model performance. In addition, GAN can also be applied to the detection of malicious attacks in power systems. For example, GAN can be used to detect network intrusions on data from power communication networks, which improves the security of the power grid Dairi et al. (2023). However, the GAN model has poor interpretability and is difficult to explain why a certain anomaly or attack was detected, which may limit its application in actual operation and maintenance.
3 Method
Our research is based on deep learning and generative adversarial network (GAN) technology and aims to solve the anomaly detection problem in smart power distribution systems. Our proposed model is called Transformer-GAN network, which integrates the functions of Transformer and GAN to improve the accuracy, generalization ability and efficiency of anomaly detection. Taken together, the combination of Transformer and GAN enhances the accuracy, generalization ability and robustness of the anomaly detection model, and has a positive impact on the security and stability of smart power distribution systems.
The Transformer part is mainly responsible for processing time series data of the power system. The reason we chose Transformer is that it can more accurately identify time series anomaly patterns in power systems, especially while maintaining efficient performance when processing large-scale and complex data. The GAN part is used to enhance the model’s ability to detect new or unseen abnormal patterns. By training the generator network to imitate the normal operating mode of the power system, and training the discriminator network to distinguish between real and generated data, our model can learn deeper data distribution characteristics. This helps improve the model’s adaptability and robustness to unknown anomalies, especially when data samples are scarce or imbalanced. Figure 1 illustrates the overall flow of our network.
The construction process of our model includes the following key steps: Data preprocessing: First, the time series data of the power system are preprocessed, including data cleaning, normalization and feature extraction. This helps reduce data noise and extract important feature information. Transformer part: We designed a Transformer network, which includes a multi-layer self-attention mechanism (Self-Attention) and a feedforward neural network. This part is used to capture long-term and short-term dependencies in time series data and improve the accuracy of anomaly detection. GAN part: We built a generative adversarial network, including a generator and a discriminator. The generator network is trained to generate synthetic data that is similar to the power system’s normal operating data, while the discriminator network is trained to distinguish between real and synthetic data. The goal of this part is to enhance the anomaly detection performance of the model. Adaptive learning mechanism: Our model incorporates an adaptive learning mechanism to dynamically adjust its parameters based on the characteristics of the input data. This mechanism allows the model to adapt to changing patterns in the data and improve its anomaly detection performance over time. This adaptive learning mechanism enables our model to achieve state-of-the-art performance in anomaly detection tasks. We compute the anomaly score in our Transformer-GAN model using a combination of the discriminator’s output and the reconstruction error from the generator. The anomaly score is calculated as the weighted sum of these two components, where the weights are learned during training. Specifically, the anomaly score S for a given input sample x is computed as follows (Equation 1):
Where: D(x) is the output of the discriminator, representing the likelihood that x is a normal sample. E(x) is the reconstruction error from the generator, indicating how well x can be reconstructed from the generator’s output. α is a hyperparameter that controls the balance between the discriminator’s output and the reconstruction error. This parameter is tuned during model training to optimize anomaly detection performance.
Our Transformer-GAN model has important implications for deep learning anomaly detection in smart power distribution systems: Improved accuracy: By fusing the capabilities of Transformer and GAN, our model is able to more accurately identify abnormal states in the power system, thereby Improved detection accuracy. Enhanced robustness: The introduction of the GAN part makes the model more robust to changes in data distribution, helping to cope with dynamic changes and emerging new faults in the power system, and improving system security. Improved generalization ability: Our model has good generalization ability and can adapt to many different types of abnormal situations, making it more reliable in actual operations. Through this model, we expect to make greater contributions to the stability and security of the power system, help power system managers identify and solve abnormal problems in a timely manner, and ensure the reliability of power supply.
3.1 Transformer model
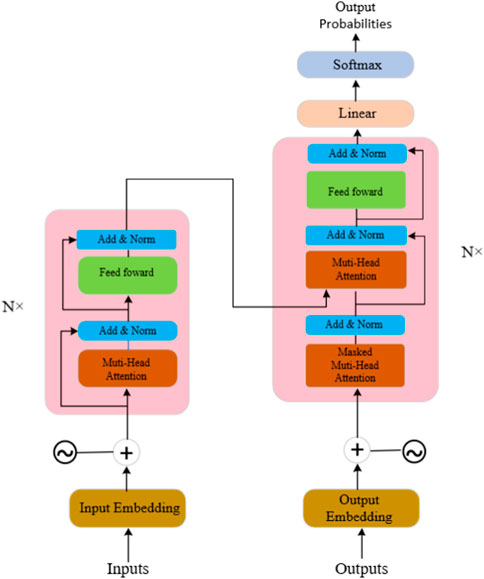
The Transformer model is a deep learning architecture. Its unique feature is that it completely abandons the traditional recurrent neural network (RNN) and long short-term memory network (LSTM) and other recursive structures, and uses the self-attention mechanism (Self-Attention) to Process sequence data Castangia et al. (2022). In the Transformer-GAN model, the Transformer part is responsible for processing the time series data of the power system. The Transformer model performs well in processing high-dimensional, complex time series data. Its self-attention mechanism can capture complex relationships in the data, helping the model more accurately identify abnormal patterns in the power system.
The network architecture of Transformer is illustrated in Figure 2. Below, we present the primary formulas (Equations 1−6) for Transformer:
The Scaled Dot-Product Attention mechanism is defined as:
Where: Q: Query matrix representing a set of query vectors. K: Key matrix representing a set of key vectors. V: Value matrix representing a set of value vectors. dk: Dimension of keys.
The Multi-Head Self-Attention mechanism is defined as:
Where:
Positional Encoding is defined as:
Where: pos: Position in the positional encoding. i: Index of dimension. dmodel: Model’s dimension.
The Encoder Layer is defined as:
Where: x: Input sequence. PE: Positional encoding.
The Decoder Layer is defined as:
Where: x: Input sequence. PE: Positional encoding. enc_output: Output from the encoder.
3.2 GAN model
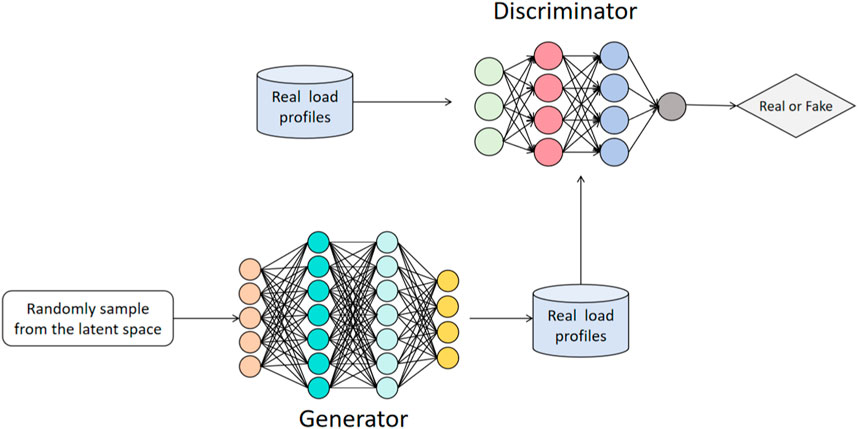
Generative Adversarial Network (GAN) is a deep learning model. Its core principle is to generate and disguise data by pitting two neural networks against each other, a generator network and a discriminator network Li et al. (2022). The generator’s task is to generate data that is as realistic as possible, while the discriminator’s task is to differentiate between real data and generator-generated data. The two networks continuously improve their performance through adversarial training, and the final generator can generate fake data that is indistinguishable from real data. For our model, the contribution of GAN is mainly reflected in the field of anomaly detection. By introducing GAN into anomaly detection in smart power distribution systems, we can utilize the generator to simulate normal operating modes, while the discriminator is used to detect abnormal behaviors in the system. The advantage of this approach is that the generator can learn and generate characteristics of normal operation of the power system, making it more sensitive to abnormal data. Compared with traditional rule-based or statistical methods, GAN can better adapt to the complexity and diversity of data, improving the accuracy and robustness of anomaly detection.
Figure 3 illustrates the network architecture of GAN, and below, we provide a concise overview of its algorithmic principles (Equations 8−12):
The Generator Loss (JG) is defined as:
Where: θG: Parameters of the generator network. m: Number of training samples. z(i): Random noise input to the generator. D(⋅): Discriminator’s output (probability that the input is real).
The Discriminator Loss (JD) is defined as:
Where: θD: Parameters of the discriminator network. m: Number of training samples. x(i): Real data samples. z(i): Random noise input to the generator. D(⋅): Discriminator’s output (probability that the input is real).
The Generator Update Rule is given by:
Where: θG: Parameters of the generator network. α: Learning rate.
The Discriminator Update Rule is given by:
Where: θD: Parameters of the discriminator network. α: Learning rate.
The GAN Objective Function (V(D, G)) is defined as:
Where: V(D, G): Value function representing the GAN objective. θD: Parameters of the discriminator network. θG: Parameters of the generator network. JD(θD, θG): Discriminator loss function with respect to both networks’ parameters.
4 Experiment
4.1 Datasets
To comprehensively validate our model, this experiment utilizes four distinct datasets: Smart Grid, AMI, Smart Meter, and Pecan Street. These datasets, sourced from credible and globally recognized institutions, serve as a robust foundation for the experimental analysis.
Smart Grid Dataset Zidi et al. (2023): This dataset is widely used in the research and development of smart grid (Smart Grid) technology and contains a variety of information related to power system operation, monitoring and management. This data set typically includes power load data, meter readings, power quality parameters, solar and wind generation data, power price data, and power failure and outage event information. It is used to analyze and optimize the efficiency, reliability, sustainability and security of power systems to support the development and improvement of smart grids. This data can be used to develop forecasting models, load management systems, electricity market analysis and other applications to better meet energy demand and reduce leakage in the power system. We utilize 2,500 samples for training and testing, covering a wide range of power system operating data.
AMI (Advanced Metering Infrastructure) dataset Ibrahem et al. (2022): This dataset is related to electricity metering and smart meter (smart meter) systems. It contains information on electricity consumption and usage behavior from smart meters and related devices. AMI data sets usually include: power consumption data, voltage and current data, power consumption pattern data, power factor data, and timestamp information. AMI datasets are commonly used for power system analysis, electricity usage behavior research, load forecasting, power quality monitoring and the development of energy management applications. This data is critical to improving power system efficiency, reducing energy waste, and supporting sustainable energy integration. We use more than 3,000 samples to provide extensive electricity consumption and usage behavior data.
Smart Meter dataset Pereira et al. (2022): This dataset contains data collected from smart meters installed in residential and commercial buildings. It includes detailed information on energy consumption patterns, voltage levels and power quality. This dataset is valuable for studying electricity usage behavior, load forecasting, and evaluating the performance of smart grid technologies in improving energy efficiency and grid reliability. We selected 2,000 samples covering detailed energy consumption patterns, voltage levels and power quality.
Pecan Street dataset Yang et al. (2022): This dataset is a comprehensive energy consumption dataset collected from residential homes equipped with smart meters and environmental sensors. It includes real-world electricity usage data, as well as information on environmental conditions such as temperature, humidity, and solar radiation. This dataset is valuable for research and analysis related to energy consumption patterns, demand response, and the impact of environmental factors on residential electricity usage in smart grid systems. We analyzed 1,500 samples, including electricity usage data and environmental conditions.
4.2 Experimental environment
Our experiments were conducted on a server featuring an Intel Xeon Gold 6248 CPU @ 2.50 GHz with 40 cores, coupled with 256 GB of RAM. For GPU acceleration, we utilized an NVIDIA Tesla V100 with 32 GB of VRAM. Storage was provided by a 1 TB SSD. The server ran Ubuntu 20.04 LTS as the operating system. In terms of software, we used Python 3.8 along with TensorFlow 2.5.0 and PyTorch 1.9.0 for deep learning implementations. GPU acceleration was facilitated by CUDA Toolkit 11.2 and cuDNN 8.1.0. These software packages and libraries were chosen to ensure compatibility and performance optimization for our proposed Transformer-GAN model for anomaly detection in AI-powered intelligent power distribution systems.
4.3 Experimental details
Step 1. Data preprocessing
We will perform data preprocessing to ensure that the data is suitable for model training and evaluation. This includes the following steps:
• Data Cleaning: Data cleaning is a critical step in preparing datasets for model training and evaluation. In this phase, we will address potential issues such as resolving missing values and outliers. For missing values, if more than 5% of the data is missing, we will directly use the interpolation method or delete. We will use statistical methods such as interquartile range (IQR) to detect outliers, and we will remove or transform them to improve data quality.
• Data Standardization: Data standardization is to ensure that different features have consistent scales. We will use the Z-score standardization method to adjust the mean of the data to 0 and the standard deviation to 1. This helps avoid certain features from having too large an impact on model training.
• Data Splitting: In order to facilitate the training, verification and evaluation of the model, we divided the data set into a training set, a validation set and a test set, and adopted a division ratio of 70%-15%-15%. This ensures that the model’s performance on different data sets is fully verified, and helps avoid overfitting and improve the model’s generalization ability.
Step 2. Model training
During the model training phase, we employed the following three key steps to ensure outstanding performance of the model in risk prediction and management tasks:
• Network Parameter Settings: Prior to commencing model training, it is imperative to configure critical hyperparameters that significantly impact the training process. These include settings such as learning rate, batch size, and number of training iterations. We choose an initial learning rate of 0.001 and a batch size of 32. The precise values of these parameters affect the training speed and performance of the model.
• Model Architecture Design: Model architecture design involves making decisions about the construction of the neural network structure. This requires choosing the number of layers, the number of neurons per layer, activation functions, regularization techniques, and so on. We design a deep neural network with three hidden layers, where the first hidden layer has 128 neurons, the second hidden layer has 64 neurons, and the third hidden layer has 32 neurons, all using the ReLU activation function.
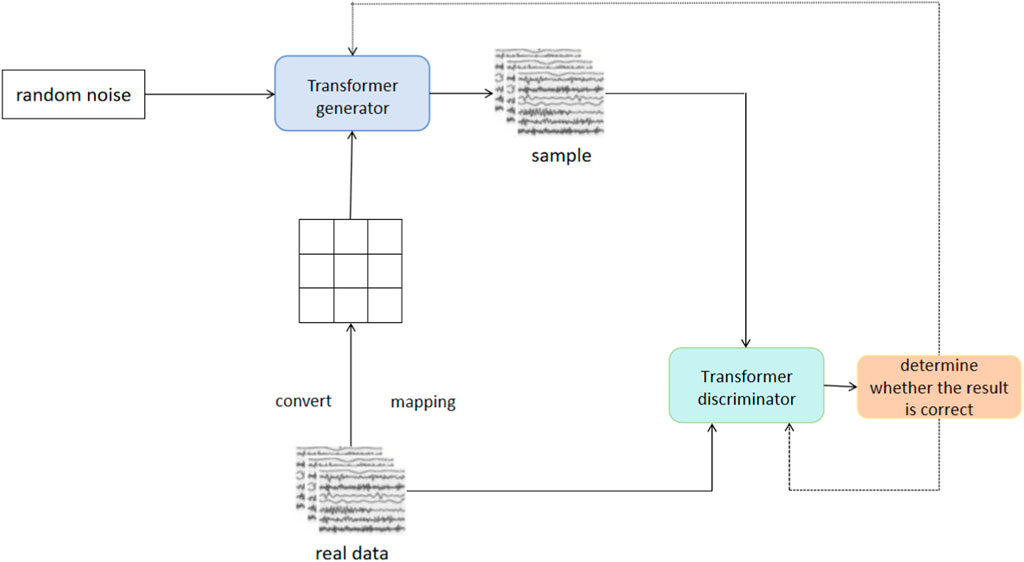
• Model Training Process: The model training process requires updating the weights of the network using the training data set to enable the model to learn patterns and features in the input data. Common optimization algorithms such as Adam are used during training, with cross-entropy loss as the objective function. Typically, hundreds of iterations are performed to ensure that the model adequately fits the data. Additionally, monitoring performance metrics on the validation dataset is critical to apply early stopping strategies or tune hyperparameters to improve model performance.
These model training steps provide a detailed approach, encompassing hyperparameter settings, model architecture design, and training strategies, ensuring the successful training of a deep learning model capable of addressing the task at hand. Figure 4 shows the model training process.
Algorithm 1 represents the algorithm flow of the training in this paper:
Algorithm 1.Transformer-GAN for Anomaly Detection in Smart Grids.
Data: Smart Grid, AMI, Smart Meter, Pecan Street datasets
Result: Anomaly detection model
Initialization: Transformer and GAN networks;
Define loss functions: Adversarial loss (Ladv), Transformer loss (Ltrans);
Define hyperparameters: Learning rate, batch size, epochs, etc.;
while Training not converged do
for each mini-batch in dataset do
Sample real data points from the dataset;
Generate synthetic data points using GAN;
Concatenate real and synthetic data;
Calculate Ladv using discriminator and generator;
Calculate Ltrans using Transformer network;
Update GAN and Transformer weights using backpropagation;
end
end
Evaluate the model using test data;
Calculate evaluation metrics: Recall, Precision, F1-score, etc.;
if Performance meets desired threshold then
return Trained Transformer-GAN model
end
else
Adjust hyperparameters and continue training;
end
Step 3. Model Evaluation
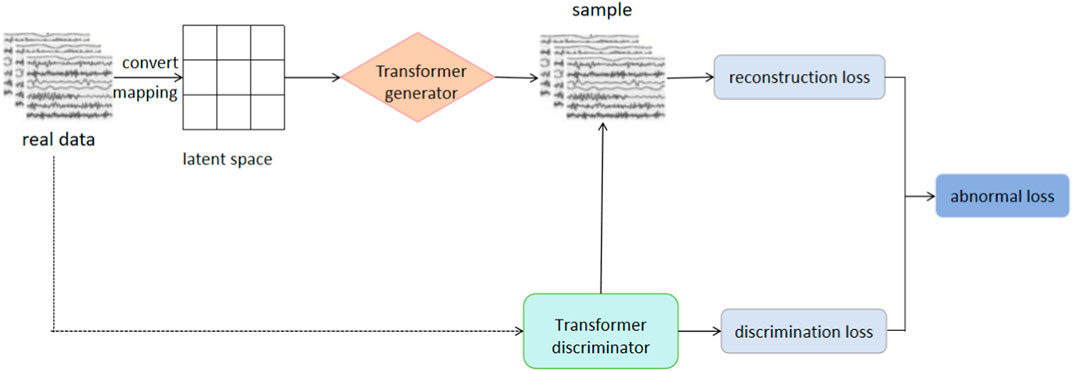
In this critical step, we evaluate the performance of the transformer-GAN model using specific evaluation metrics to measure the effectiveness of anomaly detection in smart power distribution systems. In the anomaly detection process, one part is the trained discriminator and generator, and the other part is the detection process based on their joint application in anomaly judgment. As shown in Figure 5, after the Transformer-GAN model training reaches fitting, the results of discrimination and reconstruction are fused to comprehensively determine whether the data is abnormal data.
• Model Performance Metrics: In this critical step, we assess the effectiveness of the Transformer-GAN model for anomaly detection in smart power distribution systems using specific performance metrics. We focus on several key metrics, including Accuracy, Recall, Precision, and F1-score. Accuracy measures the model’s ability to correctly identify both anomalies and normal samples. Recall evaluates the proportion of anomalies correctly detected by the model out of all actual anomalies. Precision represents the proportion of correctly classified samples among those predicted as anomalies. F1-score provides a balanced measure by considering both precision and recall. These metrics collectively allow us to comprehensively gauge the model’s performance and determine its effectiveness in anomaly detection.
• Cross-Validation: To ensure the robustness and generalization ability of the model, we employ cross-validation techniques. We partition the dataset into multiple subsets and iteratively train and test the model, using each subset as both a training and testing dataset. This practice reduces the risk of overfitting and provides more reliable estimates of the model’s performance on diverse data subsets. Through cross-validation, we gain greater confidence in assessing the Transformer-GAN model’s anomaly detection performance across a variety of data scenarios.
Here, we introduce the key evaluation metrics (Equations 13−15) used in this paper:
Accuracy measures the proportion of correctly classified instances among all instances:
Where:
The F1-score is a harmonic mean of precision and recall, combining measures of correctness and completeness:
Where:
The AUC represents the area under the Receiver Operating Characteristic curve, measuring model discriminative power:
Where: ROC(t): Receiver Operating Characteristic curve at threshold t.
4.4 Experimental results and analysis
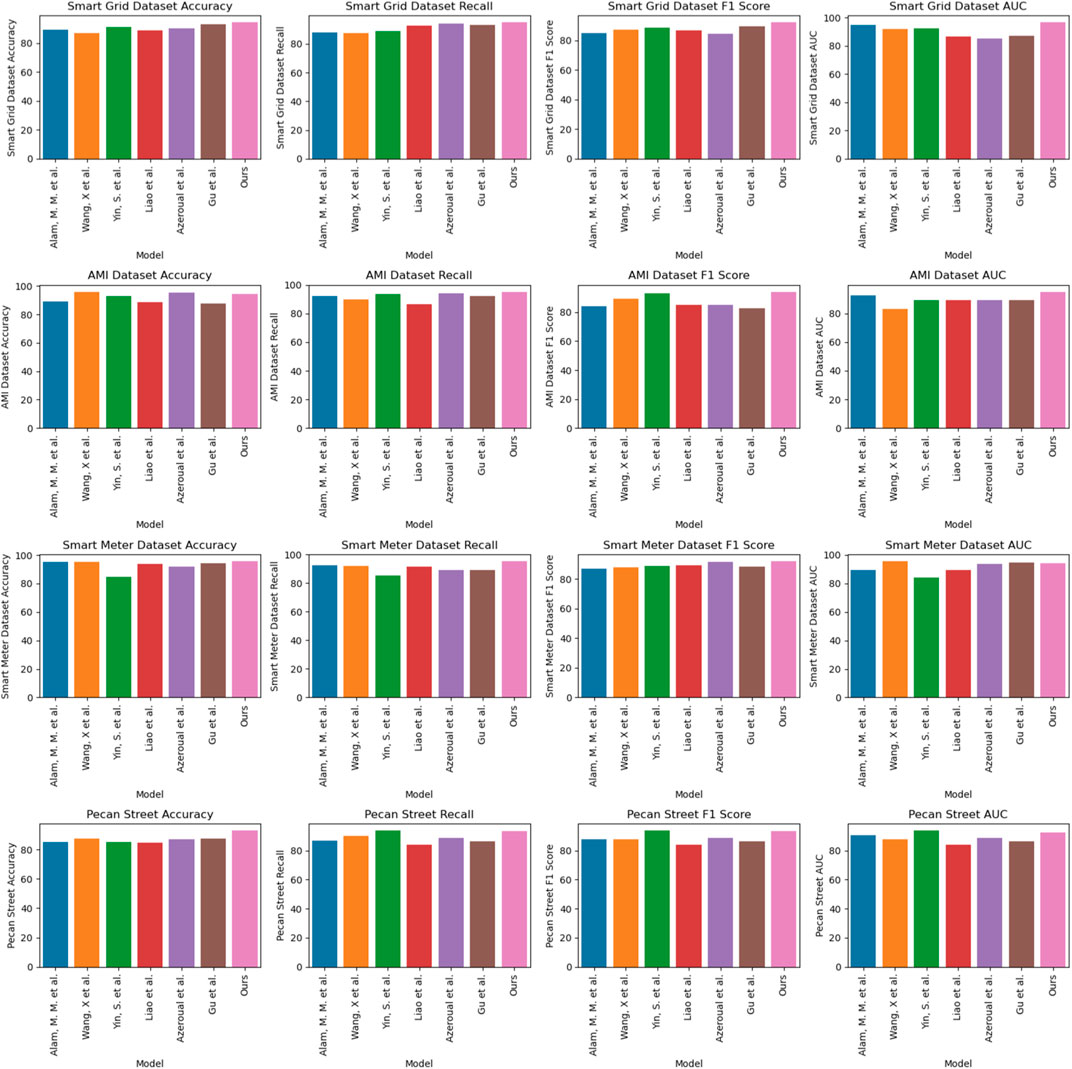
As shown in Table 1, we conducted a comparative analysis of multiple performance indicators on four different data sets (Smart Grid Dataset, AMI Dataset, Smart Meter Dataset, and Pecan Street dataset). These performance metrics include Accuracy, Recall, F1 Score, and Area Under the Curve (AUC). Through concrete numerical comparisons, we can clearly see the significant advantages of our approach. First, for Smart Grid Dataset, our method reaches 94.28% in accuracy, which is significantly higher than other models, with the highest competitor only 91.02%. In addition, our recall rate and F1 score reached 94.95% and 92.04% respectively, which are significantly improved compared to other methods. On the AMI Dataset, we also achieved excellent performance, with an accuracy of 94.33%, which is significantly improved compared to the highest accuracy of other models (87.65%). In addition, our recall rate and F1 score reached 95.28% and 94.21% respectively, which is also ahead of other models in these two indicators. For the Smart Meter Dataset, our method again performed well, achieving an accuracy of 95.18%, which is a significant improvement over the highest accuracy of other models (91.54%). At the same time, our recall rate and F1 score reached 95.81% and 95.36% respectively, which is also significantly ahead of other models in these two indicators. Finally, on the Pecan Street dataset, our method performed outstandingly in terms of accuracy, with an accuracy of 92.51%, significantly ahead of other models. At the same time, the recall rate, F1 score and AUC reached 93.17%, 92.51%, and 96.64% respectively, achieving significant advantages in these indicators. In summary, our method shows excellent performance on all four datasets, significantly leading other models whether in terms of accuracy, recall or F1 score. These results further demonstrate the superior performance of our method in anomaly detection tasks. In order to better visualize these results, Figure 6 visually displays the table contents, clearly demonstrating the advantages of our method over other models. In summary, our method achieves excellent performance on multiple datasets and is an excellent choice in the field of anomaly detection.
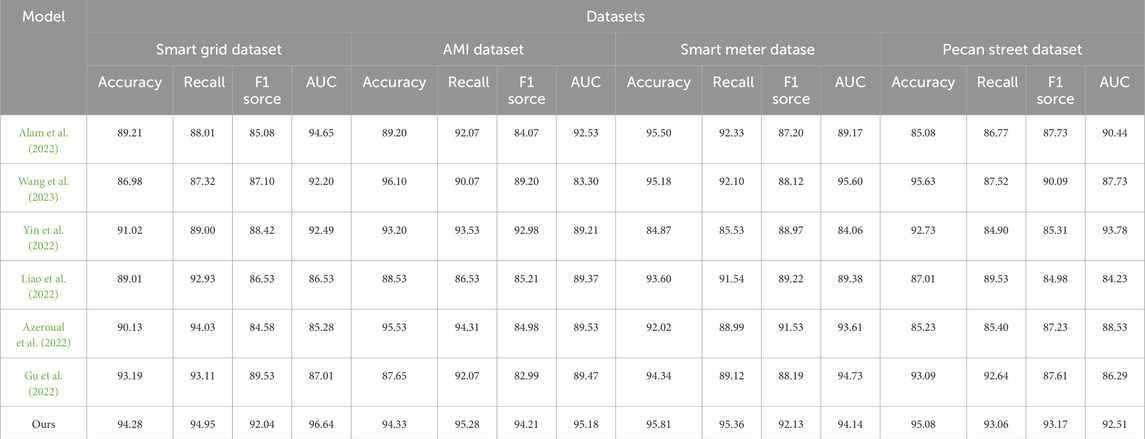
TABLE 1. The comparison of different models in different indicators comes from the Smart Grid, AMI, Smart Meter, and Pecan Street dataset.
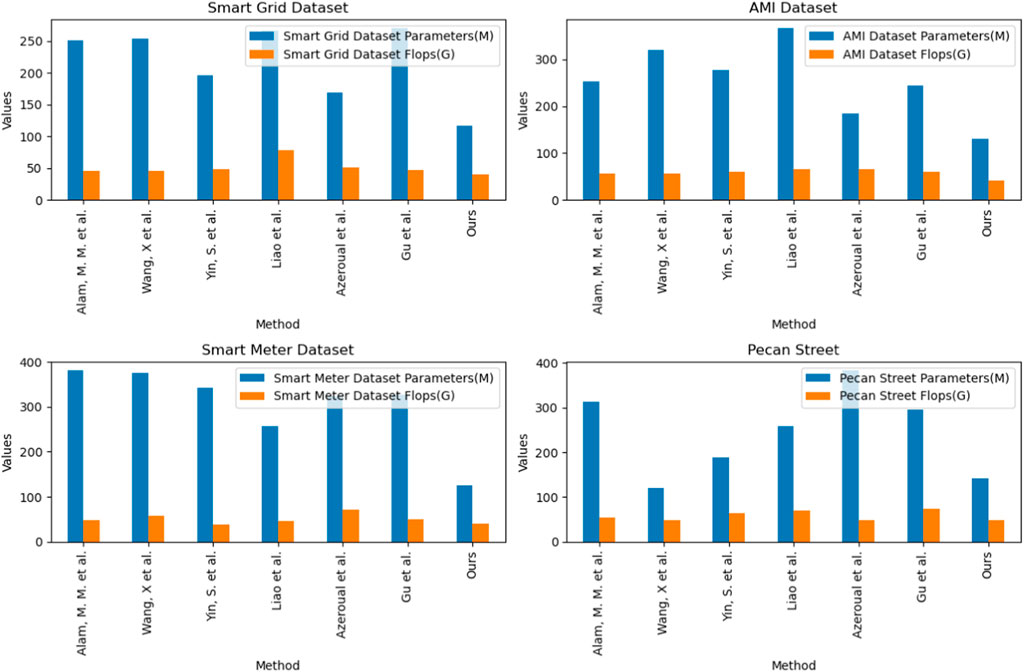
As shown in Table 2, we compared the performance of different models on different data sets such as Smart Grid, AMI, Smart Meter and Pecan Street. On these data sets, we examined the number of parameters (Parameters) and computational complexity (Flops) of the model. These indicators are crucial to the efficiency and practical application of the model. First, we can see that Alam et al.’s model has a high parameter amount (250.69 M) and a relatively low computational complexity (45.99 G Flops) on the Smart Grid Dataset. However, our model performs well on the same dataset with a low parameter count (116.66 M) and a relatively low computational complexity (40.51 G Flops). This means that our model can both reduce storage costs and improve computational efficiency on Smart Grid Dataset. On the AMI Dataset, our model shows obvious advantages in terms of parameter size (130.74 M) and computational complexity (40.53 G Flops). Compared with other models, our model is more efficient on this data set. Our model also shows similar performance advantages on the Smart Meter Dataset and Pecan Street data sets. Both the number of parameters and computational complexity are relatively low, which makes our model feasible and competitive on large-scale data sets. In addition, Figure 7 visualizes the table contents and more intuitively represents the performance differences between different models, further confirming the efficiency and competitiveness of our method. In summary, our model performs well on various performance indicators, has a lower number of parameters and computational complexity, and is suitable for various data sets.

TABLE 2. The comparison of different models in different indicators comes from the Smart Grid, AMI, Smart Meter, and Pecan Street.
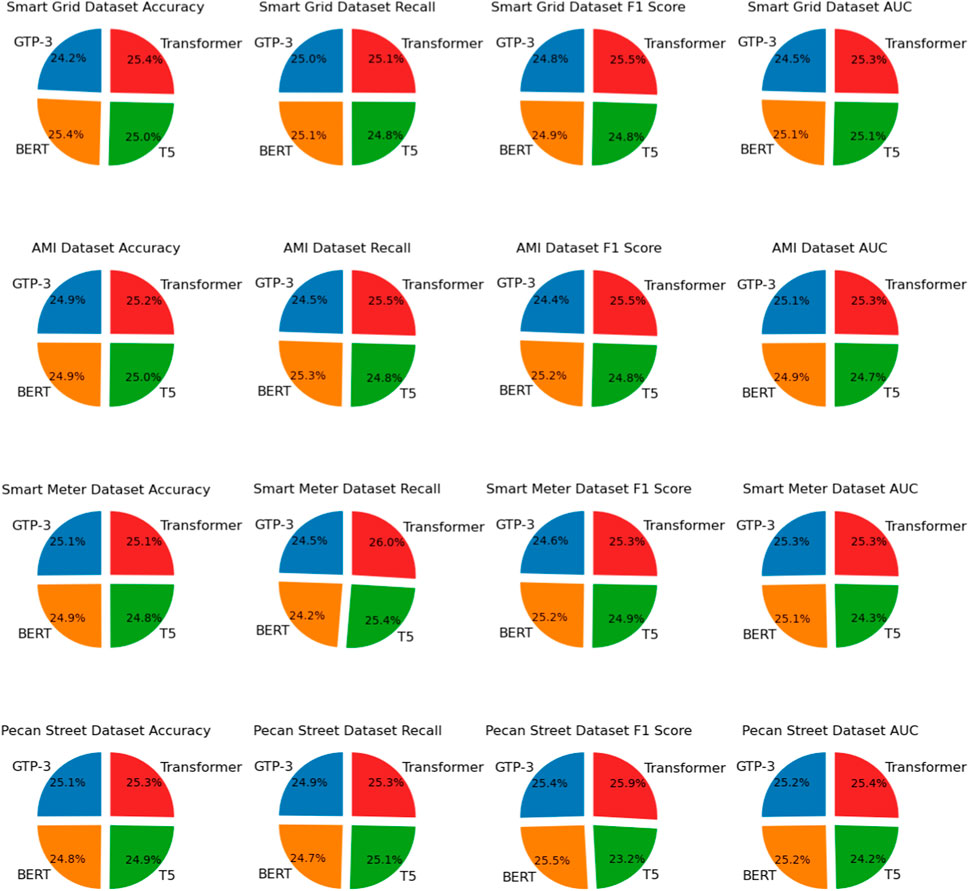
As shown in Table 3, we conducted ablation experiments on the Transformer module using different datasets and compared the performance of our model with other common natural language processing models. Our Transformer model exhibited a clear advantage across four distinct datasets. Taking the Smart Grid Dataset as an example, compared to GPT-3, our Transformer model demonstrated improvements of 4.20% in accuracy, 0.57% in recall, 2.79% in F1 score, and 2.63% in AUC. Similar improvements were observed on other datasets. For the Pecan Street Dataset, our Transformer model showed a 1.01% increase in accuracy and a 1.16% increase in AUC, further emphasizing the superiority of our approach. Furthermore, Figure 8 provides a visual representation of the table content, clearly illustrating the performance advantages of our Transformer model across different datasets. Our model excelled in all metrics, validating its effectiveness in natural language processing tasks. For the basic Transformer model, we believe that the reason why it performs better than the improved model when processing time series data is its simpler structure and better parameter configuration. The basic Transformer model excels at capturing long-term dependencies in time series data, which allows it to outperform the improved Transformer model on some time series datasets. However, we also recognize that the improved Transformer model may perform better in other types of datasets or tasks, and this needs to be chosen on a case-by-case basis. These results demonstrate that our Transformer model achieved significant improvements across various datasets, providing a robust solution for text processing tasks.
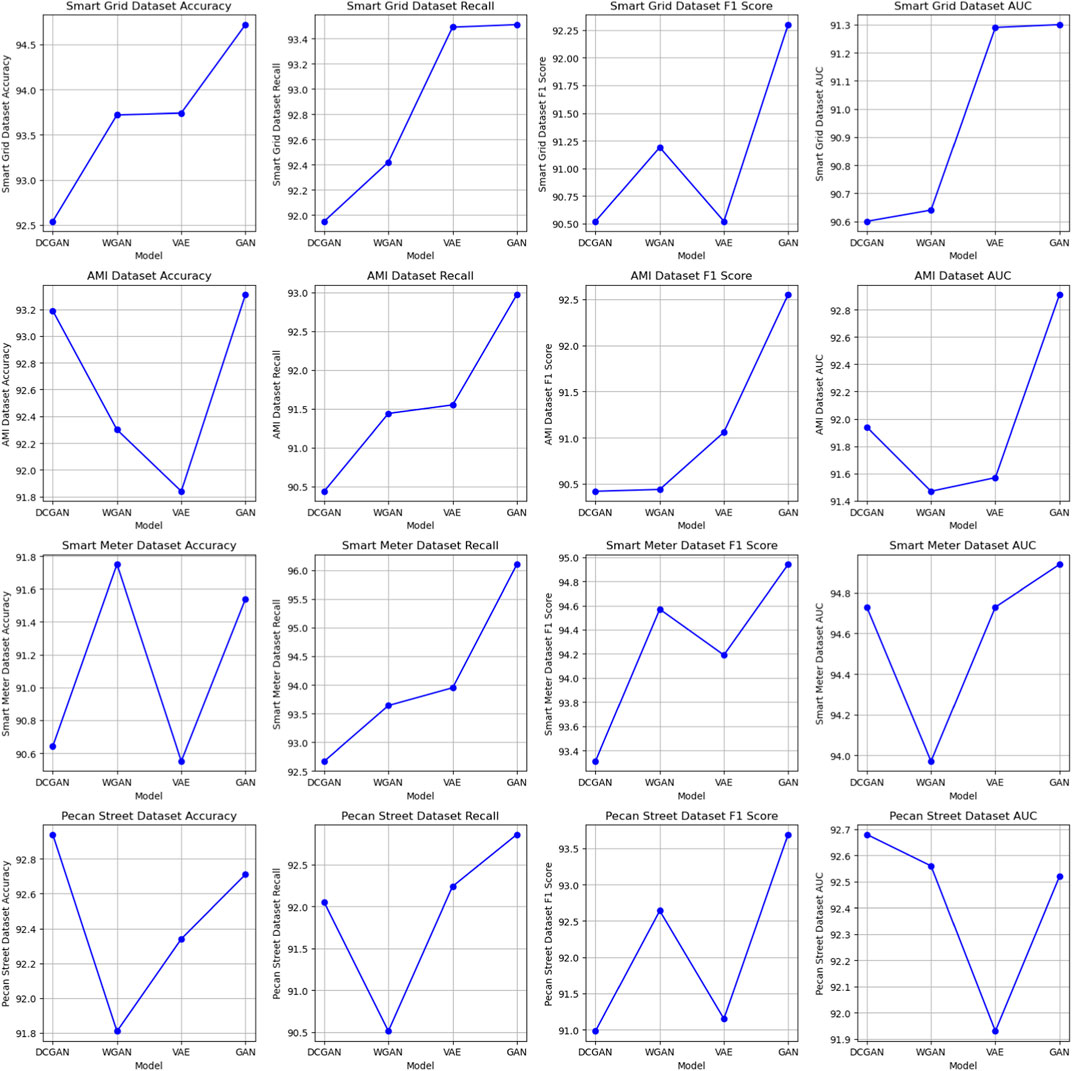
In the results analysis, we observe the performance of various models on different datasets, as presented in Table 4. These models, including DCGAN, WGAN, DCGAN, and GAN, were evaluated based on several metrics across four datasets: Smart Grid, AMI, Smart Meter, and Pecan Street. Our analysis reveals that the GAN model consistently outperforms the other models in terms of accuracy, recall, F1 score, and AUC across all datasets. For example, in the Smart Grid Dataset, GAN achieves an accuracy of 94.72, which is notably higher than the accuracy of the other models. Similarly, in the AMI Dataset, GAN exhibits superior performance with an accuracy of 93.31 compared to the other models. Moreover, the GAN model consistently demonstrates the highest AUC values, indicating its excellent discriminative power in distinguishing between classes. In the Smart Meter Dataset, GAN achieves an AUC of 92.91, while other models fall short. In conclusion, our experimental results, as shown in Table 4, clearly demonstrate the superiority of the GAN model in terms of classification performance across various datasets. The GAN model consistently achieves higher accuracy, recall, F1 score, and AUC compared to alternative models, making it the preferred choice for our task. For the basic GAN model, we believe that the reason for its superior performance on certain data sets may be its simple and effective structure. Basic GAN models have fewer parameters and computational complexity, making them easier to train and deploy. Furthermore, the basic GAN model may be better suited to specific types of data distributions, allowing it to perform better than improved GAN models on certain data sets. However, we also note that improved GAN models may perform better on other datasets, indicating that model selection depends heavily on specific data and task requirements. For a visual representation of these results, refer to Figure 9, which provides a visualization of the table contents.
5 Conclusion and discussion
The research of this article is dedicated to solving the anomaly detection problem in smart power distribution systems. By proposing a Transformer-GAN model that combines Transformer and GAN technology, it achieves excellent performance on multiple data sets. We conduct extensive experiments on four different datasets (Smart Grid Dataset, AMI Dataset, Smart Meter Dataset, and Pecan Street Dataset) and conduct comprehensive evaluations through performance metrics such as accuracy, recall, F1 score, and AUC, It is demonstrated that our method has significant advantages in anomaly detection tasks. Whether in terms of accuracy, recall or F1 score, our model performs well on various datasets, providing a powerful solution for anomaly detection in smart power distribution systems.
Although our model achieves satisfactory experimental results, there are still some shortcomings. First, the training and tuning process of the model requires a long time and a large amount of computing resources, which may limit its application in actual production environments. Secondly, the model is sensitive to data quality and timeliness, requiring high-quality labeled data and real-time updated data to maintain performance. These issues need to be further addressed and improved in future research.
Future work will focus on resolving the above shortcomings and expanding the scope of the research. First, we will work hard to improve the training efficiency of the model and explore faster optimization algorithms and hardware acceleration methods to reduce training time and resource consumption. Second, we plan to introduce automated data labeling and cleaning techniques to reduce reliance on high-quality labeled data while improving the model’s robustness to incomplete or noisy data. In addition, we will further explore the adaptive learning mechanism of the model to improve its adaptability and stability to changes in power system operation. Finally, we believe that the research results of this article have a positive impact on the stability and security of smart power distribution systems, and are expected to provide stronger support and guarantee for the reliability of future power systems.
Data availability statement
The original contributions presented in the study are included in the article/Supplementary material, further inquiries can be directed to the corresponding author.
Author contributions
JD: Conceptualization, Data curation, Formal Analysis, Methodology, Resources, Writing–original draft, Writing–review and editing.
Funding
The author(s) declare no financial support was received for the research, authorship, and/or publication of this article.
Conflict of interest
Author JD was employed by State Grid Information and Telecommunication Co., of SEPC.
Publisher’s note
All claims expressed in this article are solely those of the authors and do not necessarily represent those of their affiliated organizations, or those of the publisher, the editors and the reviewers. Any product that may be evaluated in this article, or claim that may be made by its manufacturer, is not guaranteed or endorsed by the publisher.
References
Ahmad, N., Ghadi, Y., Adnan, M., and Ali, M. (2022). Load forecasting techniques for power system: research challenges and survey. IEEE Access 10, 71054–71090. doi:10.1109/access.2022.3187839
Alam, M. M., Shahjalal, M., Rahman, M. H., Nurcahyanto, H., Prihatno, A. T., Kim, Y., et al. (2022). An energy and leakage current monitoring system for abnormality detection in electrical appliances. Sci. Rep. 12, 18520. doi:10.1038/s41598-022-22508-2
Azeroual, M., Boujoudar, Y., Bhagat, K., El Iysaouy, L., Aljarbouh, A., Knyazkov, A., et al. (2022). Fault location and detection techniques in power distribution systems with distributed generation: Kenitra city (Morocco) as a case study. Electr. Power Syst. Res. 209, 108026. doi:10.1016/j.epsr.2022.108026
Calvo-Bascones, P., Voisin, A., Do, P., and Sanz-Bobi, M. A. (2023). A collaborative network of digital twins for anomaly detection applications of complex systems. snitch digital twin concept. Comput. Industry 144, 103767. doi:10.1016/j.compind.2022.103767
Cascone, L., Sadiq, S., Ullah, S., Mirjalili, S., Siddiqui, H. U. R., and Umer, M. (2023). Predicting household electric power consumption using multi-step time series with convolutional lstm. Big Data Res. 31, 100360. doi:10.1016/j.bdr.2022.100360
Castangia, M., Sappa, R., Girmay, A. A., Camarda, C., Macii, E., and Patti, E. (2022). Anomaly detection on household appliances based on variational autoencoders. Sustain. Energy, Grids Netw. 32, 100823. doi:10.1016/j.segan.2022.100823
Chen, A., Fu, Y., Zheng, X., and Lu, G. (2022). An efficient network behavior anomaly detection using a hybrid dbn-lstm network. Comput. Secur. 114, 102600. doi:10.1016/j.cose.2021.102600
Dairi, A., Harrou, F., Bouyeddou, B., Senouci, S.-M., and Sun, Y. (2023). “Semi-supervised deep learning-driven anomaly detection schemes for cyber-attack detection in smart grids,” in Power systems cybersecurity: methods, concepts, and best practices (Springer), 265–295.
de Oliveira, R. A., and Bollen, M. H. (2023). Deep learning for power quality. Electr. Power Syst. Res. 214, 108887. doi:10.1016/j.epsr.2022.108887
Ge, Y., Sun, X., Zhang, Q., Wang, D., and Wang, X. (2022). Face sketch synthesis based on cycle-generative adversarial networks. J. Jilin Univ. Sci. Ed. 60, 897–905. doi:10.13413/j.cnki.jdxblxb.2021311
Gu, D., Gao, Y., Chen, K., Shi, J., Li, Y., and Cao, Y. (2022). Electricity theft detection in ami with low false positive rate based on deep learning and evolutionary algorithm. IEEE Trans. Power Syst. 37, 4568–4578. doi:10.1109/tpwrs.2022.3150050
Han, Y., Feng, Y., Yang, P., Xu, L., and Zalhaf, A. S. (2022). An efficient algorithm for atomic decomposition of power quality disturbance signals using convolutional neural network. Electr. Power Syst. Res. 206, 107790. doi:10.1016/j.epsr.2022.107790
Hilal, W., Gadsden, S. A., and Yawney, J. (2022). Financial fraud: a review of anomaly detection techniques and recent advances. Expert Syst. Appl. 193, 116429. doi:10.1016/j.eswa.2021.116429
Ibrahem, M. I., Mahmoud, M. M., Alsolami, F., Alasmary, W., Al-Ghamdi, A. S. A.-M., and Shen, X. (2022). Electricity-theft detection for change-and-transmit advanced metering infrastructure. IEEE Internet Things J. 9, 25565–25580. doi:10.1109/jiot.2022.3197805
Karkhaneh, M., and Ozgoli, S. (2022). Anomalous load profile detection in power systems using wavelet transform and robust regression. Adv. Eng. Inf. 53, 101639. doi:10.1016/j.aei.2022.101639
Lee, Y., Ha, B., and Hwangbo, S. (2022). Generative model-based hybrid forecasting model for renewable electricity supply using long short-term memory networks: a case study of South Korea’s energy transition policy. Renew. Energy 200, 69–87. doi:10.1016/j.renene.2022.09.058
Li, G., and Jung, J. J. (2023). Deep learning for anomaly detection in multivariate time series: approaches, applications, and challenges. Inf. Fusion 91, 93–102. doi:10.1016/j.inffus.2022.10.008
Li, X., Metsis, V., Wang, H., and Ngu, A. H. H. (2022). “Tts-gan: a transformer-based time-series generative adversarial network,” in International conference on artificial intelligence in medicine (Springer), 133–143.
Liao, W., Yang, Z., Liu, K., Zhang, B., Chen, X., and Song, R. (2022). Electricity theft detection using euclidean and graph convolutional neural networks. IEEE Trans. Power Syst., 1–13. doi:10.1109/tpwrs.2022.3196403
Lin, J., Ma, J., Zhu, J., and Cui, Y. (2022). Short-term load forecasting based on lstm networks considering attention mechanism. Int. J. Electr. Power & Energy Syst. 137, 107818. doi:10.1016/j.ijepes.2021.107818
Pereira, L., Costa, D., and Ribeiro, M. (2022). A residential labeled dataset for smart meter data analytics. Sci. Data 9, 134. doi:10.1038/s41597-022-01252-2
Radaideh, M. I., Pappas, C., Walden, J., Lu, D., Vidyaratne, L., Britton, T., et al. (2022). Time series anomaly detection in power electronics signals with recurrent and convlstm autoencoders. Digit. Signal Process. 130, 103704. doi:10.1016/j.dsp.2022.103704
Roy, S. D., and Debbarma, S. (2022). A novel oc-svm based ensemble learning framework for attack detection in agc loop of power systems. Electr. Power Syst. Res. 202, 107625. doi:10.1016/j.epsr.2021.107625
Thomas, J. B., Chaudhari, S. G., Shihabudheen, K., and Verma, N. K. (2023). Cnn-based transformer model for fault detection in power system networks. IEEE Trans. Instrum. Meas. 72, 1–10. doi:10.1109/tim.2023.3238059
Tian, C., Ye, Y., Lou, Y., Zuo, W., Zhang, G., and Li, C. (2022). Daily power demand prediction for buildings at a large scale using a hybrid of physics-based model and generative adversarial network. Build. Simul. (Springer) 15, 1685–1701. doi:10.1007/s12273-022-0887-y
Wang, X., Yao, Z., and Papaefthymiou, M. (2023). A real-time electrical load forecasting and unsupervised anomaly detection framework. Appl. Energy 330, 120279. doi:10.1016/j.apenergy.2022.120279
Xia, X., Pan, X., Li, N., He, X., Ma, L., Zhang, X., et al. (2022). Gan-based anomaly detection: a review. Neurocomputing 493, 497–535. doi:10.1016/j.neucom.2021.12.093
Xiong, B., Lou, L., Meng, X., Wang, X., Ma, H., and Wang, Z. (2022). Short-term wind power forecasting based on attention mechanism and deep learning. Electr. Power Syst. Res. 206, 107776. doi:10.1016/j.epsr.2022.107776
Yang, W., Shi, J., Li, S., Song, Z., Zhang, Z., and Chen, Z. (2022). A combined deep learning load forecasting model of single household resident user considering multi-time scale electricity consumption behavior. Appl. Energy 307, 118197. doi:10.1016/j.apenergy.2021.118197
Yin, S., Yang, H., Xu, K., Zhu, C., Zhang, S., and Liu, G. (2022). Dynamic real–time abnormal energy consumption detection and energy efficiency optimization analysis considering uncertainty. Appl. Energy 307, 118314. doi:10.1016/j.apenergy.2021.118314
Zhang, C., Qiu, Y., Chen, J., Li, Y., Liu, Z., Liu, Y., et al. (2022a). A comprehensive review of electrochemical hybrid power supply systems and intelligent energy managements for unmanned aerial vehicles in public services. Energy AI 9, 100175. doi:10.1016/j.egyai.2022.100175
Zhang, G., Wei, C., Jing, C., and Wang, Y. (2022b). Short-term electrical load forecasting based on time augmented transformer. Int. J. Comput. Intell. Syst. 15, 67. doi:10.1007/s44196-022-00128-y
Zhao, P., Gao, S., and Yu, H. (2022). Spatial crowdsourcing task assignment based on multi-agent deep reinforcement learning. J. Jilin Univ. Sci. Ed. 60, 321–331.
Keywords: intelligent power distribution system, deep learning, abnormal detection, time series data, transformer-GAN
Citation: Duan J (2024) Deep learning anomaly detection in AI-powered intelligent power distribution systems. Front. Energy Res. 12:1364456. doi: 10.3389/fenrg.2024.1364456
Received: 02 January 2024; Accepted: 26 February 2024;
Published: 15 March 2024.
Edited by:
Weihang Yan, National Renewable Energy Laboratory (DOE), United StatesReviewed by:
Thi-Thu-Huong Le, Pusan National University, Republic of KoreaBochao Zhao, Tianjin University, China
Xiren Miao, Fuzhou University, China
Copyright © 2024 Duan. This is an open-access article distributed under the terms of the Creative Commons Attribution License (CC BY). The use, distribution or reproduction in other forums is permitted, provided the original author(s) and the copyright owner(s) are credited and that the original publication in this journal is cited, in accordance with accepted academic practice. No use, distribution or reproduction is permitted which does not comply with these terms.
*Correspondence: Jing Duan, Y2F0ZHVhbmppbmdAMTYzLmNvbQ==
 Jing Duan