- 1Electric Power Dispatching and Control Center of Guangdong Power Grid Co., Ltd, Guangzhou, China
- 2School of Electric Power Engineering, South China University of Technology, Guangzhou, China
In the evolving landscape of power systems, the integration of various renewable energy resources (RERs) introduces complex challenges, particularly in maintaining power quality, which are paramount for system stability. To address this issue, an adaptive power quality disturbance (PQD) detection framework is implemented in this paper. First, the optimal mode decomposition (OMD) is developed to decompose the compound PQDs into sub-ingredients to make them more visible based on the optimal energy ratio. Subsequently, we propose an improved attention convolutional neural network (IACNN), an advanced neural network architecture that leverages an enhanced attention mechanism to expedite the identification of PQDs. Importantly, the sub-ingredients can be strengthened based on the established PQD detection framework. Finally, a series of experiments are conducted under different noise levels and various types of PQDs. The results demonstrate that the proposed framework has profound detection effectivity with about 99.2% accuracy under the simulation condition of 20 dB noise level. In addition, the experimental verification analysis proves a satisfactory real-time performance. This underscores the potential of the proposed framework as a significant advancement in the realm of power quality management, offering a robust solution to the challenges posed by the integration of RERs into modern power systems.
1 Introduction
The integration of renewable energy resources (RERs) into the power grid has a significant impact on the stability and operation of the power system (Chawda et al., 2020). Specifically, it is imperative to implement precise control mechanisms for RERs to effectively manage and mitigate power quality disturbances (PQDs). Employing technologies such as grid-synchronization and grid-forming control strategies (Xiao et al., 2023b) is essential to ensure the seamless integration of RERs, thereby maintaining the stability and reliability of the power grid. For instance, the power output from solar and wind resources can fluctuate significantly due to changes in weather conditions, leading to voltage variations, frequency deviations, and harmonic distortions in the power grid. Moreover, the use of power electronic converters in RERs for converting DC to AC power can also generate harmonics and cause power quality issues (Xiao et al., 2023a). This highlights the importance of advanced power quality disturbance detection and mitigation techniques in the era of renewable energy. The accurate and timely detection of power quality disturbances is essential to prevent these issues, enabling prompt corrective actions to be taken. It also aids in maintaining the stability and reliability of power systems, ensuring uninterrupted power supply, and enhancing the overall performance and efficiency of electrical systems.
PQDs are the result of a variety of power electronic devices operating within the grid, leading to complex and compound types of disturbances. Recognized standards such as IEEE Std 1159, which delineates practices for monitoring electric power quality, and IEEE 519-2022, which specifies guidelines for limiting electrical harmonic contributions, provide crucial benchmarks for managing PQ issues. For example, the total demand distortion (TDD), as defined by IEEE 519, considers harmonic components up to the 50th order, highlighting the comprehensive nature of these standards (Sabin et al., 2022). Such criteria underscore the increasing necessity for enhanced detection efficiency and precision.
To address the abovementioned problem, some recent studies have elaborated the method to detect the power quality signals. These approaches are typically segmented into three distinct phases: the identification of sub-components within the PQDs, extraction of salient features from the signal components, and subsequent detection of PQD characteristics.
The initial phase of PQD analysis involves the dissection of complex signals into discernible sub-components or domains, such as the frequency domain. To this end, methodologies such as variational mode decomposition (VMD) are utilized, facilitating the breakdown of PQDs into several intrinsic mode functions (Zhao et al., 2019). Next, a Wigner–Ville distribution (WVD) technique is developed to transfer the PQD into the time–frequency domain (Cai et al., 2019). Then, the PQD can be identified from a graphical perspective. Some other technologies include ensemble empirical mode decomposition (EMD) (Hukampal and Mohanty, 2020), Stockwell transform (ST) (Kumar et al., 2020; Panigrahi et al., 2022), and short-time Fourier transform (STFT) (De Frein and Rickard, 2011). Similar to VMD, the EMD decomposes the PQDs into multiple modes. The advantage of EMD is its fast execution time (Jalilian and Samadinasab, 2021). One of the limitations is the modal aliasing and end effects. Additionally, it can only extract temporal information. In contrast, time–frequency transformative methods, such as the ST (Cui et al., 2022) and the adaptive ST, leverage window-matching spectrum techniques to address the issue of time–frequency resolution (Pan et al., 2023). Despite their utility, these time–frequency-based algorithms are characterized by computational intensity, which may result in delays when detecting high-frequency PQDs, an aspect that demands consideration in their application.
In the pursuit of expediting PQD detection in systems with high penetration of RERs, the extraction of distinctive features from the decomposed sub-components is a critical step. As demonstrated by Yılmaz et al. (2022), five features are extracted from the decimated wavelet transform, including the mean, standard deviation, variance, entropy, and energy. In addition, 24 features were derived from the discrete wavelet transform for each PQD case by Shafiullah et al. (2021). It will highly speed up the detection of PQDs. However, this efficiency may come at the cost of comprehensiveness, as the condensed information within the extracted features may not encapsulate the full spectrum of PQD data.
Based on extracted features, the PQD feature detection is implemented as the last stage. In this stage, the conventional methods and the advanced methods are used. Aiming at feature processing at the second stage, the kernel support vector machine method was proposed by Tang et al. (2020). The method named adaptive k-nearest neighbor with excluding outliers was developed by Liu et al. (2021). Some typical methods consist of the decision tree and artificial neural network (ANN) (Igual and Medrano, 2020). However, the limitation of conventional methods is their insufficient learning ability. To mitigate this problem, deep learning methods are developed. For example, a novel sequential, non-parametric, and supervised disturbance detector is proposed to facilitate cooperative detection with only 0.61 cycles, corresponding to 0.0123s (Mozaffari et al., 2022). In addition, the ensemble deep learning is applied for the automated classification of PQDs (Wang et al., 2022). A method called end-to-end PQD detection is achieved based on the integrated conventional neural networks and gate recurrent unit (Xiao and Li, 2021). It can detect the PQDs without the need to perform feature extraction to achieve real-time detection. Furthermore, the deep conventional neural networks are combined with the WVD (Cai et al., 2019). Adaptive and hybrid deep learning methods (Sindi et al., 2021) are proposed against the noise. The primary limitation is that the importance of the features is not strengthened, and therefore, they need to consume more layers to learn more distinguishing characteristics.
To address the challenges associated with the real-time detection and identification of compound PQDs, this paper introduces a groundbreaking method, whose efficacy is underpinned by the following significant contributions:
1. To accurately distinguish different disturbance components, optimal mode decomposition (OMD) is developed based on ensemble empirical mode decomposition. An innovative energy ratio metric is formulated to mitigate the influence of decomposition parameters within the OMD.
2. To highlight the importance of the disturbance features, an improved attention convolutional neural network (IACNN) is proposed to learn the critical information from PQDs automatically. This model enables the autonomous learning of vital information from PQDs, thus enhancing feature recognition capabilities.
3. Integrated with the OMD and IACNN, a compound PQD detection framework is proposed to eliminate the impact of the irrelevant disturbance features. This integration facilitates real-time PQD detection and obviates the necessity for manual feature engineering.
The structure of this paper is organized as follows. Section 2 presents the principle of OMD. Then, the details of the IACNN are given step by step in Section 3. Next, the conducted experiments are explained in Section 4. Finally, the conclusion is given in Section 5.
2 Optimal mode decomposition
2.1 Principle of ensemble empirical mode decomposition
The sophisticated nature of PQD signals, characterized by their nonlinearity and non-stationarity, necessitates a robust feature extraction method to yield accurate disturbance identification. The empirical mode decomposition (EMD) technique is widely utilized for this purpose, enabling the extraction of multiple intrinsic mode functions (IMFs) from PQD signals. These IMFs are instrumental in isolating various frequency components, thereby providing detailed insights into disturbances and facilitating the analysis of non-stationary signals. Nevertheless, a significant limitation of the EMD method is its susceptibility to mode mixing, a phenomenon that can introduce errors in the decomposition of complex PQD signals. To mitigate this issue and enhance the accuracy of EMD, the ensemble empirical mode decomposition (EEMD) is developed. The EEMD approach augments the decomposition efficacy by averaging the results from numerous EMD iterations, each with a unique instantiation of white noise added to the PQD signal.
For the PQD signal x(t), the EMD is carried out M times. In each EMD trial, x(t) is superimposed with an independent white noise wm(t), which can be expressed as shown in Eq. 1.
After the EMD operation, xm(t) is decomposed into multiple IMFs Imp(t) and a residual rm(t). The number of IMFs is denoted by K, and the decomposition result can be described as shown in Eq. 2.
Then, to eliminate the influence of white noise on real IMF components, the mean values of the corresponding IMFs and residuals are computed, as shown in Eqs 3, 4, respectively.
where IMFp(t) denotes the pth IMF component after the EEMD operation.
Based on these IMF components and the residual, the EEMD result of the original PQD signal x(t) can be further obtained as shown in Eq. 5.
Relative to the EMD method, the EEMD technique offers an enhanced ability to diminish noise impact and alleviate the mode mixing issue, leading to a more precise extraction of PQD signal modes. However, the typical empirical approach to determining the number of IMFs can introduce artifacts or omit vital information when handling complex PQD signals. To address this, the novel optimized mode decomposition strategy is introduced. This method adaptively configures the number of IMFs based on the specific characteristics of the PQD signal, thereby optimizing the decomposition process and ensuring a more accurate signal representation.
2.2 Proposed OMD
In essence, EEMD builds upon the foundation of the EMD method, with each IMF correlating to a specific frequency range. Within this range, EEMD effectively extracts the inherent oscillatory elements of the PQD signal (Prosvirin et al., 2019). Consequently, EEMD’s operation can be likened to a form of band-pass filtering, where signal energy divergent from the central frequency is attenuated. It follows that the cumulative energy across all IMFs may decrease if the number of decompositions is either excessively high or low. Furthermore, the aggregate energy of the IMFs is invariably less than that of the original PQD signal.
Considering this analysis, an effective selection method of the decomposition number is presented. This method involves comparing the total energy of all IMFs subsequent to the EEMD process. The cornerstone of the optimized mode decomposition technique is the dynamic adjustment of the decomposition number K, aiming to maximize the total IMF energy. This enhancement renders the original EEMD more adaptable, thereby significantly bolstering the precision of disturbance identification across a spectrum of complex PQD signals.
The PQD signal is denoted as x(t), and the initial total energy can be defined as follows:
where S represents the number of sampling points and x(j) represents the amplitude of x(t) at different sampling points.
After the EEMD operation, multiple mode signals are obtained, and the total energy of these IMFs can be expressed as follows:
and there is
where E (IMF) represents the energy summation of the IMF signals when the corresponding decomposition number is K and IMFp(t) is the pth IMF signal.
Based on Eqs 6–8, the energy ratio between the IMFs and the original PQD signal can be further computed, which is given as shown in Eq. 9.
In OMD, when the sampling frequency and sampling period are determined, the corresponding sampling points S are fixed. Namely, the original disturbance energy E(x) is a fixed value. Therefore, once the energy ratio ξ reaches the maximum, the corresponding total energy of all IMFs also obtains the maximum, which demonstrates that the decomposition number K is optimal.
After the OMD-based feature extraction process, an improved attention convolutional neural network model is further proposed to identify different complex PQD signals based on the IMFs provided by OMD.
3 Improved attention convolutional neural network for PQD identification
3.1 Principle of the convolutional neural network
As a quintessential archetype of deep learning, convolutional neural networks (CNNs) are distinguished for their superior feature extraction proficiency. The CNN architecture uniquely integrates feature extraction with classification, thereby optimizing the utilization of informational resources. This dual capability has propelled its adoption across a broad spectrum of applications, including image recognition, fault diagnosis, and natural language processing. Complementing its practical applications, scholarly inquiries have substantiated CNNs’ effectiveness in PQD signal identification, consistently delivering a commendable performance. Consequently, this paper selects the CNN as the primary model for PQD signal classification, leveraging its validated strengths in this specialized area of study.
Generally, the CNN contains the input layer, convolutional layer, pooling layer, fully connected layer, and output layer. When it is used for PQD identification in this article, the input layer is the IMFs of the PQD signals. The feature information of IMFs is extracted by the convolutional layer. Then, the pooling layer is utilized to reduce feature dimensions to improve network efficiency. Thus, the pooling layer is also called the downsampling layer. The classification performance of the CNN is usually reflected by combining multiple convolutional layers and pooling layers. The fully connected layer is used to combine the extracted features in a nonlinear manner and then transfer the feature information to the output layer. Namely, the fully connected layer is not expected to have feature extraction ability, but it attempts to use existing higher-order features to complete the identification goal. Finally, the output layer outputs the classification result of the CNN.
For some simple PQD signals, a traditional CNN can typically yield satisfactory classification outcomes by increasing the count of the convolutional and pooling layers. However, this approach tends to escalate processing time, making it challenging to fulfill the real-time processing demands of PQD detection. Furthermore, when it comes to complex PQD signals, classification accuracy may suffer. To achieve a balance between high identification accuracy and expedient detection time, this work introduces an advanced attention convolutional neural network. This innovative model intends to significantly amplify the inherent feature extraction prowess of the CNN. This approach aims to deliver precise classification of PQD signals while adhering to the time-sensitive requirements of real-time detection.
3.2 Proposed IACNN
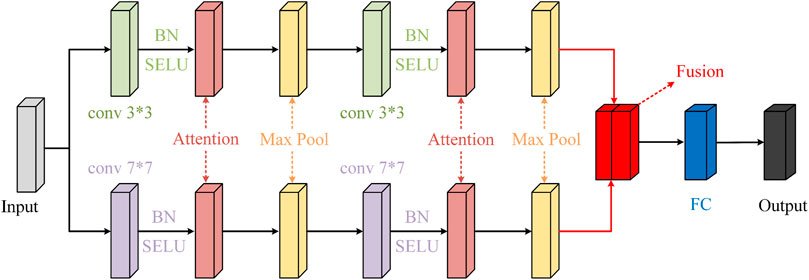
In the improved attention convolutional neural network, the enhancement of feature extraction is approached from two strategic angles. First, the deployment of multiple convolutional kernels of varying sizes supplants the traditional singular kernel, enabling the capture of both global and local signal characteristics. This variety allows for the integration of diverse feature sets, culminating in a composite feature that encapsulates more detailed information.
Second, the integration of an attention module subsequent to the convolutional layers serves a pivotal role. Its primary function is to direct the IACNN’s focus toward salient features of disturbances while diminishing the influence of non-essential elements. The objective is to streamline the flow of pertinent information within the model. The configuration of the proposed IACNN architecture is illustrated in Figure 1, with an in-depth exposition provided in the subsequent sections.
Instead of the single convolution kernel, the sizes of 3 × 3 and 7 × 7 are used to obtain the local and global information, respectively. Taking the 3 × 3 convolution as an example, the output of the convolutional layer can be determined as shown in Eq. 10.
where Wp denotes the weight of the convolutional kernel in the pth layer, bp is the corresponding bias, X is the input, * denotes the convolution operator, and f is the activation function. In this article, the scaled exponential linear unit (SELU) activation is used in both the convolution layers and fully connected layers. The description of SELU can be expressed as shown in Eq. 11.
where λ = 1.0507 denotes the scale constant and α is a constant.
In addition, to increase the convergence speed and accelerate the network stability, batch normalization is added in the convolutional layer, and the convolution result is normalized to a Gaussian distribution before the activation operation.
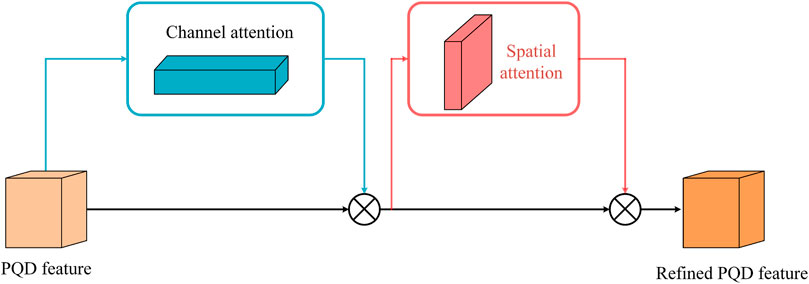
After the convolutional layer, motivated by the work of Woo et al. (2018), the attention modules are placed to emphasize the important disturbance feature. The attention modules consist of channel attention and spatial attention modules, where channel attention is used to reflect ‘what’ is meaningful, and spatial attention is used to find ‘where’ is an informative part. These two attention modules are placed as shown in Figure 2. The PQD feature extracted by the convolutional layer is first processed by the channel attention. The description of the channel attention can be expressed as shown in Eq. 12.
where Zc3 is the output of convolution 3 × 3, AvgPool and MaxPool represent the average-pooling and max-pooling operations, respectively, MLP denotes the multi-layer perceptron, and σ represents the sigmoid function.
After the channel attention, the output of the disturbance feature is adjusted as shown in Eq. 13.
where ⊗ represents the element-wise multiplication.
Next, the new disturbance feature is processed by the spatial attention, which can be described as shown in Eq. 14.
where Convn×n denotes the convolutional layer with the size of n × n.
The attention layer output can be obtained after the spatial attention, which can be expressed as shown in Eq. 15.
Then, the pooling layer is deployed for downsampling, and the pooling size is 2 × 2. The convolution, attention, and pooling are carried out twice in the proposed IACNN. After that, the features from convolutions 3 × 3 and 7 × 7 are fused to provide more comprehensive disturbance information. In this way, the IACNN can further improve its classification performance. Finally, the IACNN can output the classification result after the fully connected (FC) layer. The number of FC layers is set to five in the proposed IACNN model.
4 Illustrative example
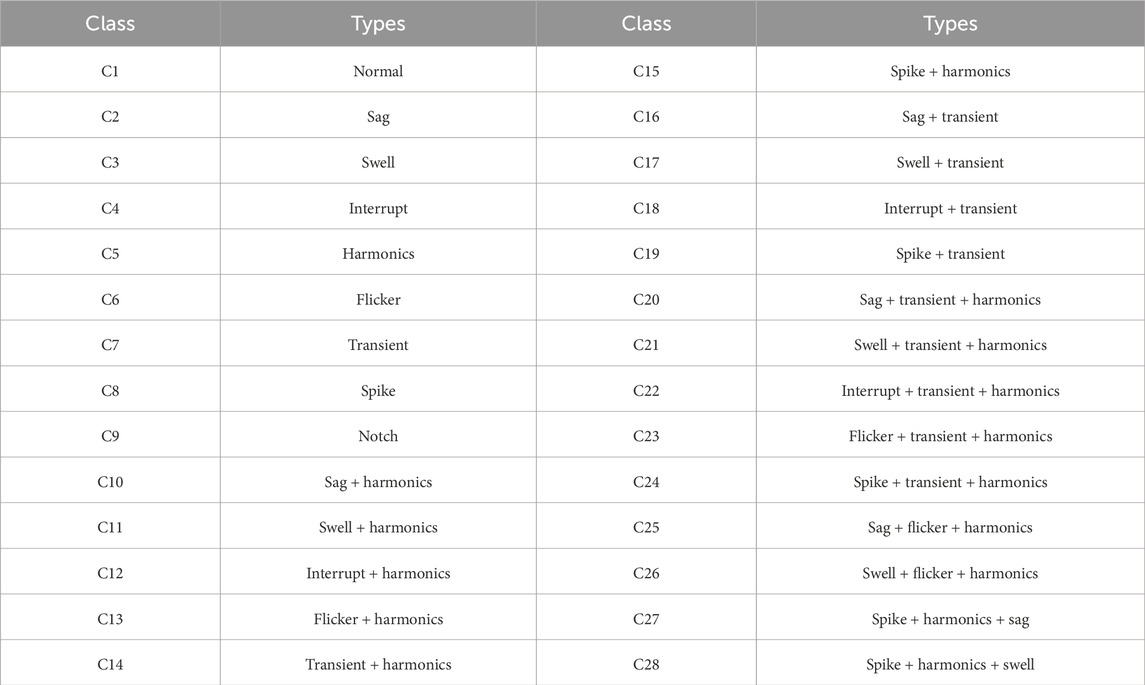
To evaluate the efficacy of the proposed OMD–IACNN method for PQD classification, a series of comparative experiments are conducted. These experiments are designed in accordance with the IEEE (2019) and draw upon findings by Tang et al. (2020). A total of 28 PQD types are examined, which include nine categories of single PQDs and 19 variations of complex PQD signals. The PQD signals under test are cataloged in Table 1. In the experimental setup, each PQD category is represented by a dataset of 2,000 samples generated in MATLAB. The datasets are partitioned into three subsets: 60% for training, 20% for validation, and the remaining 20% for testing purposes. Furthermore, the PQD signals are characterized by a fundamental frequency of 50 Hz and a sampling frequency of 3,200 Hz, with a sampling duration set to capture 640 data points per PQD sample, equivalent to a 10-s observation window.
4.1 Feature extraction using OMD
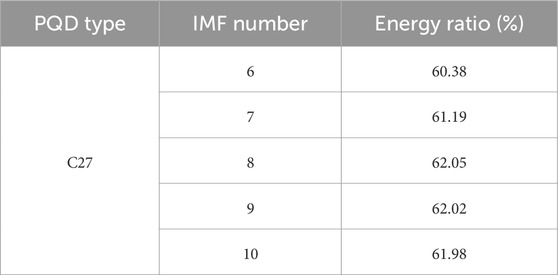
The features extracted by the OMD method directly affect the classification accuracy. In OMD, the decomposition number ranges from 6 to 10, and the specific number is determined based on the energy ratio of IMFs. Taking one complex PQD signal C27 as an example to explain the set of decomposition numbers for OMD, when the decomposition number ranges in OMD, different energy ratios of IMFs are listed in Table 2.
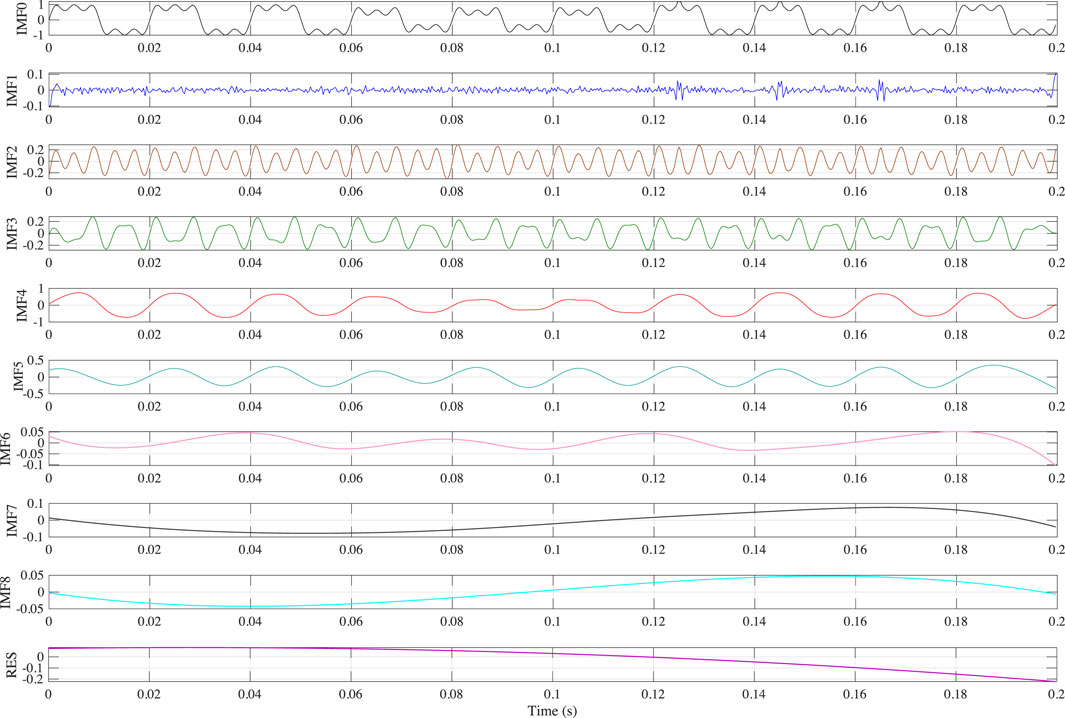
From Table 2, it can be seen that the energy ratio has a lower value when the IMF number is small, which demonstrates that the PQD signal is not fully decomposed. When the IMF number is over eight, the energy ratio decreases with the increase in its number, indicating some false components are generated. Therefore, the optimal number of OMD is set to eight for proper decomposition. The corresponding decomposition result is shown in Figure 3. It is worth mentioning that IMF0 denotes the original C27 signal and RES denotes the residual. In this way, different PQD signals can be set the optimal decomposition number.
4.2 Verification for OMD and the IACNN
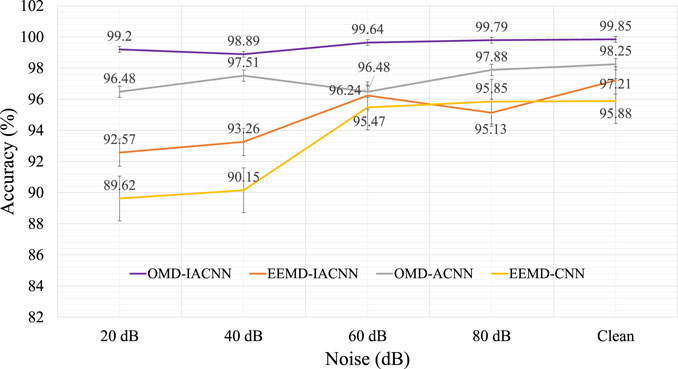
In addition, to verify the improvement of OMD and the IACNN for the PQD classification performance, the accuracy of OMD–IACNN is compared with other combination methods, including EEMD–IACNN, OMD–ACNN, and EEMD–CNN. It is important to note that the ACNN model differs from the IACNN in that it utilizes a singular convolutional approach as opposed to the latter’s advanced attention-fused convolutional strategy. For the input features of the various CNN architectures, a fixed dimension of 640 × 10 was established, where 640 represents the length of IMFs and 10 represents the highest decomposition level. In instances where the decomposition level of OMD fell short of 10, null values were padded with zeros to maintain a consistent input size. The comparison results under different noise levels are presented in Figure 4.
Figure 4 shows that both the feature extraction and the classifier have an obvious effect on PQD identification. On the one hand, the OMD–IACNN has higher classification accuracy compared to the EEMD–IACNN under different noise levels. This demonstrates that the OMD can provide more reliable disturbance feature information by adjusting the decomposition number adaptively, proving its effectiveness. Furthermore, the superior performance of OMD–IACNN over OMD–ACNN and EEMD–CNN underscores the advantages of incorporating an attention mechanism and a convolution fusion strategy into the CNN framework. This combination bolsters the CNN’s ability to discern disturbances more accurately. Notably, the OMD–IACNN maintains a high accuracy rate of 99.2% even under 20 dB noise, affirming its robustness against noise interference. In addition, Figure 4 also shows an increase in model accuracy when the noise level shifts from 40 dB to 20 dB; the reason is that the PQD signals are changeable before the noise is added, which can reflect the randomness of the classification result. Such results are indicative of the model’s strong anti-noise capabilities, making it a suitable tool for PQD identification under challenging conditions.
4.3 Comparison with other PQD classification frameworks
To further verify the proposed OMD–IACNN, some existing PQD detection frameworks are selected for a comprehensive comparison. The comparison result is given in Table 3.
It can be seen from Table 3 that the proposed OMD–IACNN model has a higher PQD identification accuracy compared with some other popular detection frameworks. First, more PQD types are considered in our OMD–IACNN, which is important to address the challenges of power grid complexity. In addition, under the same noise level, the proposed OMD–IACNN can obtain the highest accuracy. For example, the accuracy of the OST–KSVM and the EITD–GSCNN is 98.82% and 98.56%, respectively, while that the OMD–IACNN is 99.20%. The result demonstrates that the optimal mode decomposition and improved network structure can significantly enhance disturbance detection performance. Therefore, the proposed OMD–IACNN is more suitable for complex PQD identification.
4.4 Experimental verification analysis
To further ascertain the practical applicability of the proposed methodology, a hardware experimental platform was employed to capture authentic PQDs signals. The hardware platform is presented in Figure 5.
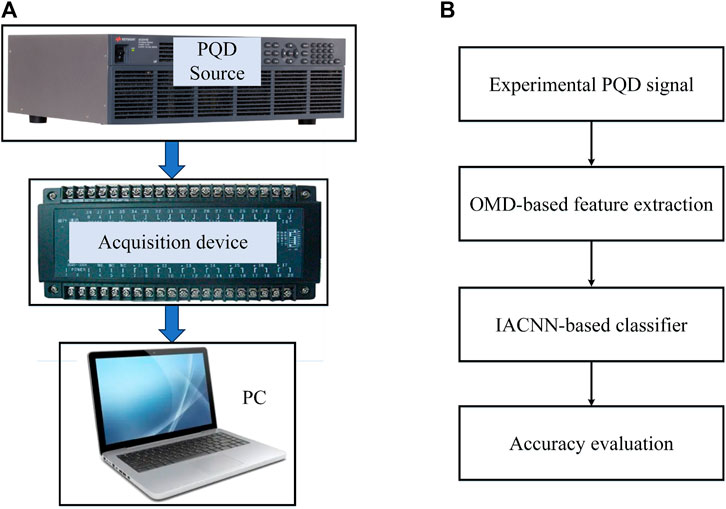
FIGURE 5. Hardware platform. (A) Experimental PQD collection process. (B) PQD identification flowchart.
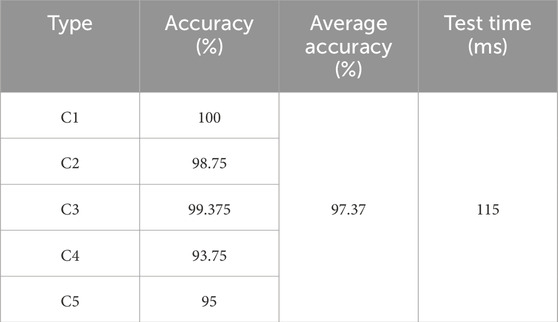
Figure 5 shows that the hardware platform is based on the AC6801 series AC power source. After the experimental PQD signals are collected, they can be identified by the proposed OMD–IACNN model in PC. The experiment encompasses a suite of PQD scenarios: C1 (normal), C2 (sag), C3 (swell), C4 (interrupt), and C5 (harmonics). We adhered to a sampling frequency of 3,200 Hz and a total sampling duration of 10 s. To reinforce the robustness of the identification process, each PQD category was subjected to 160 random tests, with the results presented in Table 4.
The data in Table 4 attest to the resilience of the OMD–IACNN approach when applied to experimental PQD signals. An average classification accuracy of 97.37% was achieved with the OMD–IACNN, underscoring its efficacy in accurate detection. Moreover, the average time taken to test each PQD sample was less than the time required for signal sampling, highlighting the model’s commendable real-time performance. Collectively, these experimental findings reinforce the OMD–IACNN model’s superiority in the identification of multiple PQD types.
5 Conclusion
In this paper, a compound power quality disturbance detection framework is proposed to improve the identification performance in power systems with high penetration of RERs. The optimal mode decomposition is first deployed to select the optimal decomposition parameters. The performance under various energy ratios and different numbers of mode components demonstrated that a better parameter can be successfully selected with a strong anti-noise ability. Then, an improved attention-based CNN is implemented to identify the PQDs based on the results from OMD. The experiment comparison reveals that the useful feature information can be incorporated into the IACNN model, resulting in improved accuracy. The experiments under different noise levels and numbers of PQDs reveal that the proposed framework has profound detection performance, with approximately 99.2% performance, which is better than some state-of-the-art approaches. The test based on the emulator indicates that the real-time performance can be satisfied. However, the convolution process is still time consuming, and some more complex and unknown PQD signals may be produced with the development of the RERs system. Further research can focus on the network parameter simplification method and explore more possible complex PQD signals. We will also focus on the PQD control using the advanced grid-synchronization-based inverter control method to eliminate the PQD issues.
Data availability statement
The raw data supporting the conclusion of this article will be made available by the authors, without undue reservation.
Author contributions
SW: writing–original draft. YL: investigation, validation, and writing–review and editing. YZ: visualization and writing–review and editing. HX: supervision and writing–review and editing. ZZ: writing–review and editing. PY: validation and writing–review and editing.
Funding
The authors declare that financial support was received for the research, authorship, and/or publication of this article. This work was supported by the China Southern Power Grid Corporation Science and Technology Project Funding Project (Grant No. GDKJXM20220335).
Conflict of interest
Authors SW, YL, and YZ were employed by Guangdong Power Grid Co., Ltd.
The remaining authors declare that the research was conducted in the absence of any commercial or financial relationships that could be construed as a potential conflict of interest.
Publisher’s note
All claims expressed in this article are solely those of the authors and do not necessarily represent those of their affiliated organizations, or those of the publisher, the editors, and the reviewers. Any product that may be evaluated in this article, or claim that may be made by its manufacturer, is not guaranteed or endorsed by the publisher.
References
Cai, K., Cao, W., Aarniovuori, L., Pang, H., Lin, Y., and Li, G. (2019). Classification of power quality disturbances using wigner-ville distribution and deep convolutional neural networks. IEEE Access 7, 119099–119109. doi:10.1109/ACCESS.2019.2937193
Chawda, G. S., Shaik, A. G., Shaik, M., Padmanaban, S., Holm-Nielsen, J. B., Mahela, O. P., et al. (2020). Comprehensive review on detection and classification of power quality disturbances in utility grid with renewable energy penetration. IEEE Access 8, 146807–146830. doi:10.1109/ACCESS.2020.3014732
Cui, C., Duan, Y., Hu, H., Wang, L., and Liu, Q. (2022). Detection and classification of multiple power quality disturbances using stockwell transform and deep learning. IEEE Trans. Instrum. Meas. 71, 1–12. doi:10.1109/TIM.2022.3214284
De Frein, R., and Rickard, S. T. (2011). The synchronized short-time-fourier-transform: properties and definitions for multichannel source separation. IEEE Trans. Signal Process. 59, 91–103. doi:10.1109/TSP.2010.2088392
Hukampal, S. R., and Mohanty, S. R. (2020). “Hardware implementation of ensemble empirical mode decomposition for critical pq disturbances detection,” in 2020 IEEE 7th Uttar Pradesh Section International Conference on Electrical, Electronics and Computer Engineering (UPCON), 1–6. doi:10.1109/UPCON50219.2020.9376546
IEEE (2019). 1159-2019 Ieee recommended practice for monitoring electric power quality. IEEE Std. Revision of IEEE Std 1159-2009. doi:10.1109/IEEESTD.2019.8796486
Igual, R., and Medrano, C. (2020). Research challenges in real-time classification of power quality disturbances applicable to microgrids: a systematic review. Renew. Sustain. Energy Rev. 132, 110050. doi:10.1016/j.rser.2020.110050
Jalilian, A., and Samadinasab, S. (2021). Detection of short-term voltage disturbances and harmonics using μpmu-based variational mode extraction method. IEEE Trans. Instrum. Meas. 70, 1–17. doi:10.1109/TIM.2021.3075744
Kumar, R., Singh, B., Kumar, R., and Marwaha, S. (2020). Recognition of underlying causes of power quality disturbances using stockwell transform. IEEE Trans. Instrum. Meas. 69, 2798–2807. doi:10.1109/TIM.2019.2926876
Liu, Y., Jin, T., Mohamed, M. A., and Wang, Q. (2021). A novel three-step classification approach based on time-dependent spectral features for complex power quality disturbances. IEEE Trans. Instrum. Meas. 70, 1–14. doi:10.1109/TIM.2021.3050187
Motlagh, Z. T., and Akbari Foroud, A. (2021). Power quality disturbances recognition using adaptive chirp mode pursuit and grasshopper optimized support vector machines. Measurement 168, 108461. doi:10.1016/j.measurement.2020.108461
Mozaffari, M., Doshi, K., and Yilmaz, Y. (2022). Real-time detection and classification of power quality disturbances. Sensors 22, 7958. doi:10.3390/s22207958
Pan, L., Han, Z., Wenxu, X., and Qingquan, J. (2023). A fast adaptive s-transform for complex quality disturbance feature extraction. IEEE Trans. Industrial Electron. 70, 5266–5276. doi:10.1109/TIE.2022.3189107
Panigrahi, R. R., Patnaik, B., Biswal, M., and Mishra, M. (2022). Power quality disturbance detection and classification using stockwell transform and pattern recognition techniques. In 2022 IEEE Delhi Section Conference (DELCON). 1–6. doi:10.1109/DELCON54057.2022.9753413
Prosvirin, A. E., Islam, M. M. M., and Kim, J. M. (2019). An improved algorithm for selecting imf components in ensemble empirical mode decomposition for domain of rub-impact fault diagnosis. IEEE Access 7, 121728–121741. doi:10.1109/ACCESS.2019.2938367
Sabin, D., Norwalk, M., Kittredge, K., and Johnston, S. (2022). “Ieee power quality standards,” in 2022 20th International Conference on Harmonics and Quality of Power (ICHQP), 1–6. doi:10.1109/ICHQP53011.2022.9808543
Shafiullah, M., Khan, M. A., and Ahmed, S. D. (2021). “Chapter 11 - pq disturbance detection and classification combining advanced signal processing and machine learning tools,” in Power quality in modern power systems. Editors P. Sanjeevikumar, C. Sharmeela, J. B. Holm-Nielsen, and P. Sivaraman (Academic Press), 311–335. doi:10.1016/B978-0-12-823346-7.00012-8
Sindi, H., Nour, M., Rawa, M., Öztürk, Ş., and Polat, K. (2021). An adaptive deep learning framework to classify unknown composite power quality event using known single power quality events. Expert Syst. Appl. 178, 115023. doi:10.1016/j.eswa.2021.115023
Tang, Q., Qiu, W., and Zhou, Y. (2020). Classification of complex power quality disturbances using optimized s-transform and kernel svm. IEEE Trans. Industrial Electron. 67, 9715–9723. doi:10.1109/TIE.2019.2952823
Wang, J., Zhang, D., and Zhou, Y. (2022). Ensemble deep learning for automated classification of power quality disturbances signals. Electr. Power Syst. Res. 213, 108695. doi:10.1016/j.epsr.2022.108695
Wang, Y., Li, Q., Zhou, F., Zhou, Y., and Mu, X. (2019). A new method with hilbert transform and slip-svd-based noise-suppression algorithm for noisy power quality monitoring. IEEE Trans. Instrum. Meas. 68, 987–1001. doi:10.1109/TIM.2018.2864446
Woo, S., Park, J., Lee, J. Y., and Kweon, I. S. (2018). Cbam: convolutional block attention module. In Proceedings of the European conference on computer vision (ECCV) 11211, 3–19. doi:10.1007/978-3-030-01234-2_1
Xiao, H., Gan, H., Yang, P., Li, L., Li, D., Hao, Q., et al. (2023a). Robust submodule fault management in modular multilevel converters with nearest level modulation for uninterrupted power transmission. IEEE Trans. Power Deliv., 1–16. doi:10.1109/TPWRD.2023.3343693
Xiao, H., He, H., Zhang, L., and Liu, T. (2023b). Adaptive grid-synchronization based grid-forming control for voltage source converters. IEEE Trans. Power Syst., 1–4. doi:10.1109/TPWRS.2023.3338967
Xiao, X., and Li, K. (2021). Multi-label classification for power quality disturbances by integrated deep learning. IEEE Access 9, 152250–152260. doi:10.1109/ACCESS.2021.3124511
Yılmaz, A., Küçüker, A., Bayrak, G., Ertekin, D., Shafie-Khah, M., and Guerrero, J. M. (2022). An improved automated pqd classification method for distributed generators with hybrid svm-based approach using un-decimated wavelet transform. Int. J. Electr. Power and Energy Syst. 136, 107763. doi:10.1016/j.ijepes.2021.107763
Zhao, C., Li, K., Li, Y., Wang, L., Luo, Y., Xu, X., et al. (2019). Novel method based on variational mode decomposition and a random discriminative projection extreme learning machine for multiple power quality disturbance recognition. IEEE Trans. Industrial Inf. 15, 2915–2926. doi:10.1109/TII.2018.2871253
Keywords: renewable energy resources, power quality disturbances, optimal mode decomposition, improved attention convolutional neural network, noise level
Citation: Wu S, Liu Y, Zhu Y, Xiao H, Zhang Z and Yang P (2024) Adaptive compound power quality disturbance detection via OMD and improved networks for renewable energy systems. Front. Energy Res. 12:1363028. doi: 10.3389/fenrg.2024.1363028
Received: 29 December 2023; Accepted: 20 February 2024;
Published: 08 March 2024.
Edited by:
Shengyuan Liu, State Grid Zhejiang Electric Power Co., Ltd., ChinaReviewed by:
Yuqing Dong, The University of Tennessee, United StatesWenxuan Yao, Hunan University, China
Copyright © 2024 Wu, Liu, Zhu, Xiao, Zhang and Yang. This is an open-access article distributed under the terms of the Creative Commons Attribution License (CC BY). The use, distribution or reproduction in other forums is permitted, provided the original author(s) and the copyright owner(s) are credited and that the original publication in this journal is cited, in accordance with accepted academic practice. No use, distribution or reproduction is permitted which does not comply with these terms.
*Correspondence: Huangqing Xiao, eGlhb2hxQHNjdXQuZWR1LmNu
 Shuangxi Wu1
 Huangqing Xiao