- 1Renewables (Qingyun) Co., Ltd., China Three Gorges Corporation, Dezhou, China
- 2School of Electrical Engineering, Shandong University, Jinan, China
The widespread adoption of renewable energy sources presents a significant challenge to the flexibility of power system. To assess the flexibility of the power system in scenarios with uncertain renewable energy output, it is crucial to quantify it quantitatively. This evaluation plays a vital role in planning flexible regulatory resources and dispatching resources for both the energy source and load. This study introduces a novel flexibility assessment model tailored for power grids with high renewable energy penetration, specifically addressing uncertainty associated with wind and PV. By analyzing the impact of wind and PV uncertainty on system flexibility, the paper proposes an improved cohesive hierarchical cluster analysis method, incorporating reliability considerations based on the Davies-Bouldin classification reliability index. Additionally, the study develops models for flexibility resources and demands within high renewable energy power systems, along with quantitative assessment indicators across three key aspects. Through a structured flexibility assessment process accounting for wind and PV uncertainty, the effectiveness of the proposed approach is validated using real-world data from a renewable energy power grid in Shandong province. A set of typical renewable energy output scenarios with uncertainty is constructed using the improved hierarchical cluster analysis method. The study then analyses the impact of different wind and PV penetration rates and the proportion of energy storage units on system flexibility by the flexibility assessment model to validate the proposed method's effectiveness.
1 Introduction
In recent years, power systems have seen an increasing penetration of renewable energy sources. The rapid expansion of the renewable energy scale and the reduction of the non-clean energy ratio have contributed to improving the green and low-carbon levels of the energy industry. However, the typical uncertainty associated with renewable energy output poses significant challenges to the power system with high proportions of renewable energy access. The net load fluctuation of the system increases due to the high-frequency fluctuation and low-frequency intermittency of wind power generation, which, in turn, leads to insufficient allocation of flexible regulation resources and difficulties in balancing source–load dispatch. Moreover, there is no common flexibility assessment process to quantitatively calculate the flexibility adequacy of highly proportional renewable energy power systems to judge whether the flexibility regulation capacity of the system can meet the operation requirements. This is a key challenge that needs to be addressed.
In the field of wind and PV power uncertainty research, most of the existing studies are based on scenario analysis methods to process possible scenarios of wind and PV power by means of simulation, sampling, or clustering to obtain multiple typical scenarios of wind and PV power and their probability distributions so as to transform the uncertainty problem of wind and PV power into deterministic scenarios for solution and analysis and effectively realize the uncertainty description and characterization of wind and PV power. Ai et al. (2014), Zhang et al. (2014), and Yu (2015) described typical wind power scenarios in grid dispatching models, considering the influence of uncertainty based on Monte Carlo sampling methods. Liu et al. (2022) obtained a typical set of wind–light–load output scenarios by downscaling the wind–light–load massive high-dimensional scenarios through a principal component–Gaussian hybrid clustering algorithm. Zheng et al. (2022) applied a multi-scene clustering method to divide the scene space into several roughly equal subspaces, considering the temporal and stochastic nature of distributed units and loads, and the point corresponding to the algebraic mean of the coordinates of each dimensional component in each subspace is taken as the cluster center of the scene, respectively. Hou et al. (2023) used the Latin hypercube sampling method to sample from the joint probability distribution interval of wind and PV and then obtained the initial sample scenarios of wind and PV output. Martins and Borges (2011) designed a new E-C-K-means clustering algorithm to cluster the wind speed and irradiance in four-season scenarios, considering the time series characteristics of load and distributed power output to obtain typical scenario daily curves. Li et al. (2021) described the source and load uncertainty problem as a deterministic multi-scenario problem by constructing planning scenarios that may exist in active distribution network planning. The above methods are usually based on large-scale data fitting to generate typical scenarios to characterize the uncertainty of wind power and PV output, but they are less capable of handling outliers and large amounts of data, and the efficiency of the model solution decreases with the increase in the size of the input data. At the same time, the number of typical scenarios needs to be set by human beings beforehand, which may lead to a strong similarity between different scenarios because of too many divisions or too few divisions, resulting in large differences between the samples in each category of the selected scenarios, which lacks representativeness. In summary, the traditional uncertainty analysis method has limitations in the processing of large-scale renewable energy output data, and further research is needed to improve the accuracy and rationality of the classification of uncertainty scenarios.
In a high-percentage renewable energy power system, flexibility is the power regulation ability of the power system to cope with the volatility and randomness of renewable energy output by optimizing the deployment of various types of flexibility resources, i.e., the ability of the system flexibility resources to meet the flexibility demand, and based on the shortage of the flexibility regulation ability of the system, the power, capacity, and response speed requirements of the flexibility resources such as energy storage can be quantitatively evaluated. In the study of the flexibility assessment of systems containing renewable energy, by studying the power output characteristics of wind power and photovoltaic, a mathematical morphology algorithm is used to obtain the flexibility evaluation index system for different time scales and climbing directions by Tong et al. (2023). For the problem of flexibility assessment of power systems containing a high proportion of wind power access, based on the Monte Carlo simulation method and economic dispatch model for the calculation of flexibility metrics, Li et al. (2015) and Liu et al. (2019) proposed a flexibility evaluation index system based on the fluctuation of wind power and load, as well as the inherent flexibility supply capacity of various generation resources in the system. Li et al. (2017) conducted a quantitative analysis from the perspective of the regulation range of system flexibility resources, and a practical system flexibility adequacy calculation method was proposed based on the power balance constraint to realize the evaluation of system renewable energy consumption capacity. Gholizadeh-Roshanagh and Zare (2019), Huang et al. (2023), and Lu et al. (2023) constructed the main types of flexibility resources, the principle of flexibility balance, and the quantitative flexibility assessment index system, and the core content and solution ideas of coordinated planning of power system flexibility including energy storage devices were proposed. Yasuda et al. (2013) proposed a flexibility radar diagram to characterize system flexibility, and the installed percentages of various types of flexible resources (such as hydroelectric plants, cogeneration, pumped storage, gas turbines, and interconnected grids) and wind power were given in the form of radar diagrams. Zhao et al. (2015), Xu et al. (2021), and Xu et al. (2022) established a unified framework system for flexibility assessment and proposed key factors of flexibility, including time scale, system action behavior, and cost. Following the concept and idea of a safe operation domain of power systems, the concept of a flexible operation domain is proposed by Ulbig and Andersson (2014), which is a three-dimensional space consisting of a climbing-flexible domain, power-flexible domain, and energy-flexible domain, and the multi-node flexibility tidal model is obtained from the power injection analysis of a single node. Although the above studies have proposed the evaluation index process for various types of flexibility resources and demands, they are still exploratory in the field of quantitative analysis of power system flexibility, and their evaluation models often focus on considering one aspect of flexibility resources, lack synergy and universality, and are difficult to be coupled with the operation and planning of flexibility resources, such as energy storage, in the system. At the same time, the traditional methods do not include the output uncertainty of wind turbines in the scope of system flexibility analysis and assessment. In summary, future research should realize the quantitative analysis and assessment of grid flexibility based on the consideration of the impact of a high percentage of renewable energy uncertainty. This research content is of great significance for the rational planning of power system flexibility resources, as well as for meeting the challenges of renewable energy access to the safe and stable operation of the power grid.
This study adopts an improved cohesive hierarchical clustering method in the given context to construct a quantitative assessment model for the flexibility of high-proportional renewable energy power systems, considering uncertainties in wind and photovoltaic sources. First, a method for improved cohesive hierarchical clustering analysis, considering reliability indicators, is proposed. The study also discusses the specific process of optimizing the classification of typical scenarios using historical renewable energy output data. Second, the study models the flexibility of resources and demands of high-proportional renewable energy power systems. It also proposes quantitative evaluation indicators for flexibility, considering the expectations of insufficient peak flexibility, expectations of insufficient climbing flexibility, and the probability of inflexibility. The study establishes a multi-scenario flexibility assessment process for high-proportional renewable energy power systems, incorporating uncertainties in wind and photovoltaic sources. Finally, a case study is conducted using historical data from a high-proportional renewable energy power system. The study constructs a typical set of renewable energy output scenarios, incorporating uncertainties, using the proposed improved hierarchical clustering analysis method. These scenarios are then substituted into the flexibility assessment model to analyze the impact of different renewable energy penetration rates and energy storage unit percentages on system flexibility. The effectiveness of the proposed flexibility evaluation method is verified.
2 Mechanism of the impact of renewable energy uncertainty on power systems
2.1 Analysis of the impact of renewable energy output trends on net load peaking demand
The connection of large-scale wind power and photovoltaic generating units to the power system greatly reduces the pressure of the system power supply during peak load hours and reduces the environmental pollution problems caused by the reliance on fossil fuel combustion of traditional generating units, but at the same time, the uncertainty characteristics inherent in the high proportion of renewable energy generation put forward higher requirements on the reliability of system operation and the stability of power quality. In order to study the impact of uncertainty on system peaking, the renewable energy output is treated as the reverse load, the uncertainty is characterized by the trend of renewable energy output under different scenarios by analyzing the net load output curve, and the mechanism of uncertainty on the net negative peaking demand of the system is investigated. The impact of renewable energy grid connection on peaking can be summarized into three types: positive peaking, excessive peaking, and reverse peaking.
According to Figure 1A, in the same sampling period, the power output trend of renewable energy units is similar to the power demand trend of load, and the difference between the peak and valley of the source load in this period is not much. At this time, the net load curve of the system is flatter than the original load curve, and the net load peak–valley difference, i.e., the system peaking demand, decreases while the flexibility regulation demand decreases. In this case, the impact of renewable energy output on power system operation is positive peaking.
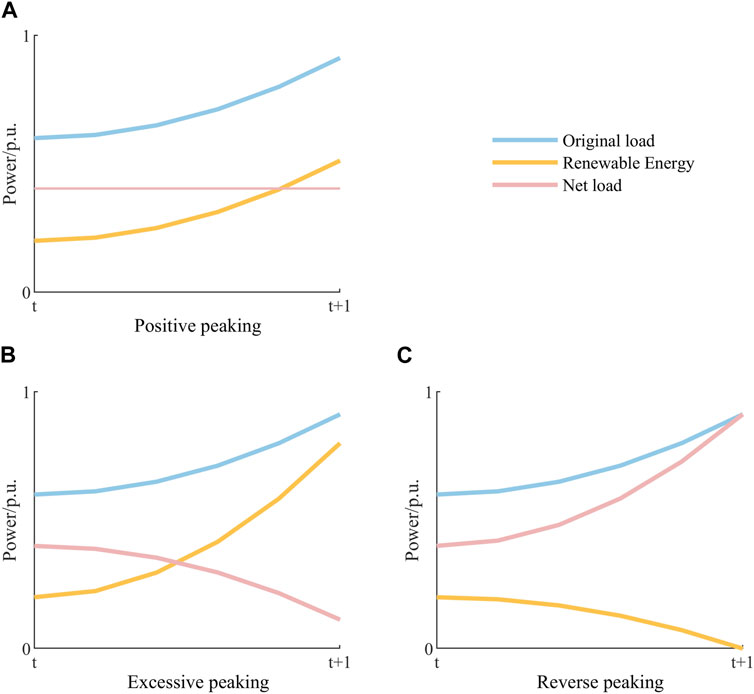
Figure 1. Three types of peaking of renewable energy output. (A) Positive peaking; (B) Excessive peaking; (C) Reverse peaking.
According to Figure 1B, in the same sampling period, the power output trend of renewable energy units is similar to the power demand change of the load, but the peak-to-valley difference of renewable energy output in this period is much larger than the power change of the load. At this time, the net load curve of the system changes the peak regulation direction compared with the original load curve, and when the peak-to-valley difference of renewable energy output is greater than twice the peak-to-valley difference of the load, the peak regulation demand of the system will increase in the opposite direction compared with the original working condition, and the flexibility regulation demand rises. In this case, the impact of renewable energy output on power system operation is excessive peaking.
According to Figure 1C, in the same sampling period, the power output trend of renewable energy units is opposite to the power demand trend of the load. At this time, the net load output curve of the system will increase its peak regulation demand in the same direction compared with the original load output curve, and the flexibility regulation demand rises. In this case, the impact of renewable energy output on power system operation is reverse peaking.
According to the above analysis, the high proportion of renewable energy sources connected to the grid may both reduce the intra-day peaking pressure of the system and increase the regulation demand of flexibility, so it is necessary to propose the quantification method of system flexibility supply and demand under the condition of considering uncertainty factors to cope with the problems of wind and light abandonment caused by high renewable energy penetration.
2.2 System net load demand at different renewable energy penetration levels
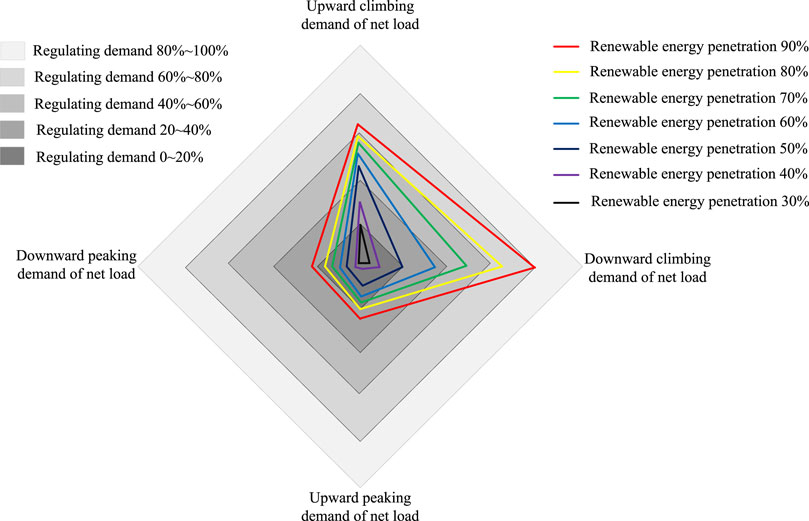
In order to quantify the flexible regulation demand of the system at each time scale when the renewable energy penetration reaches different levels, the upward (downward) net load creep demand is defined as the ratio of the maximum upward (downward) regulation demand of the net load in a day to the average annual load; the net load upward (downward) regulation demand is defined as the ratio of the maximum daily power upward (downward) regulation demand to the average daily load power in a year. Taking the renewable energy penetration rate of 30%–90%, the defined net load regulation demand is estimated, and the results are shown in Figure 2.
With the increase in renewable energy penetration, the net load regulation demand caused by the uncertainty of wind and PV power output also increases gradually, which poses a great challenge to both power regulation and energy regulation of system flexibility resources. As shown in the estimation results in Figure 2, when the renewable energy penetration is ≤ 30%, the net load regulation demand of the system is small, and the regulation margins of the flexibility regulating units can realize the envelope to the fluctuation of the renewable energy output in the usual case; when the renewable energy penetration is ≥ 40%, the net load climbing and peaking demands increase significantly, and the upward and downward net load regulation demands show a similar change trend. The estimation shows that under the condition of maintaining a certain installed capacity of adjustable units, as the penetration of renewable energy increases, the system net load peaking and climbing regulation demand gradually grows to an extremely high level, and the existing flexibility resources are unable to maintain the power balance state of the system in terms of both power regulation and energy regulation. In this context, how to quantitatively assess the flexibility supply and demand of a high percentage of renewable energy power systems and fully utilize the regulation capability of system flexibility resources is the key to the future power systems to cope with the uncertainty of a high percentage of renewable energy.
3 Improved cohesive hierarchical cluster analysis method with reliability
In power systems with high proportions of renewable energy access, the output of renewable energy is closely related to meteorological conditions, geographical distribution, and system operation status, resulting in typical stochasticity and uncertainty. After analyzing the influence mechanism of renewable energy output uncertainty on power grid flexibility, in order to solve the above problems, this study employs an improved hierarchical clustering algorithm to conduct a typical scenario clustering analysis on renewable energy output data in order to effectively characterize the uncertainty of renewable energy output. To optimize the number of clustering scenarios, the Davies–Bouldin classification reliability index is incorporated into the traditional hierarchical clustering analysis method, and an improved cohesive hierarchical clustering analysis method is introduced to account for reliability.
Based on N days of renewable energy output data on power systems under a high proportion of renewable energy access and using cluster analysis, the daily data points are designated as T for sampling, and each day’s renewable energy output sample is treated as an initial cluster; then, the regional renewable energy output sample
where
When the similarity between clusters
The interclass squared distance
where
Let the non-diagonal elements of matrix D2 have the minimum value
where
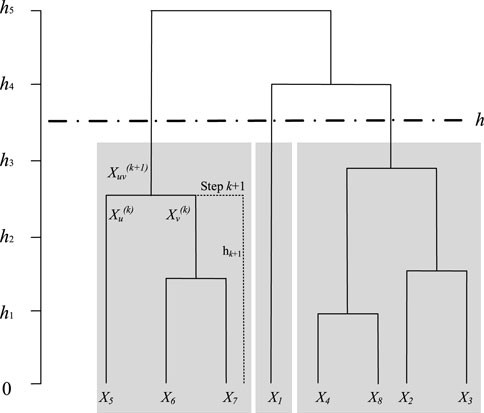
In order to visualize the similarity and tightness relationship between the clustered samples of renewable energy output, a tree diagram is used to represent the clustering process of renewable energy output samples within N days, as shown in Figure 3. Taking the k+1st clustering as an example,
The traditional hierarchical clustering analysis method requires the manual setting of the branch cut of the clustering tree diagram based on historical experience after obtaining the clustering hierarchy tree diagram. This paper introduces the Davies–Bouldin classification reliability index to quantitatively evaluate the reliability of the clustering results with different numbers of branches in order to achieve optimal selection of the number of clustering scenarios. The classification reliability index of hierarchical clustering can be expressed as follows:
where
By calculating the reliability index of different clustering scenarios and considering engineering requirements, the minimum value of
4 Assessment of high-percentage renewable energy power system flexibility considering wind and PV uncertainty
With the large-scale integration of renewable energy sources into the power grid, the supply capacity of the system has greatly increased. However, due to the close correlation between renewable energy generation and factors such as weather conditions, geographic location, and system operating conditions, the output exhibits significant uncertainty and randomness, posing significant challenges to the stable and economic operation of the power grid. In this context, considering the uncertainty of wind and photovoltaic power generation, it is important to study the quantitative evaluation method of the flexibility of the high-proportion renewable energy power system, which plays an important role in the flexible regulation of power grid resource planning and bidirectional resource scheduling.
4.1 Theoretical overview and impact analysis of flexibility
The broad flexibility of power systems refers to the system’s responsive regulation ability to cope with internal and external uncertainties. In the high percentage of renewable energy power systems, the large-scale grid connection of scenery causes a significant challenge to the flexibility regulation ability of the system, which is prone to wind and light abandonment and load shedding caused by insufficient peak regulation and ramp climbing flexibility. Therefore, flexibility can be defined as the ability of the system to maintain a balance between power supply and demand on both sides of the system source and load by coordinating various types of flexible regulation resources.
For example, due to the change in weather conditions, when the sudden increase of wind power and photovoltaic unit output makes the system net load power demand suddenly decrease, the adjustable generating unit output should be reduced accordingly. If the unit output continues to decrease until it works in the minimum normal operation power state and the energy storage unit is charged with maximum power, the load still cannot completely consume the renewable energy output, that is, if the system flexibility cannot meet the balance of output supply and demand, then the problem of insufficient downward flexibility arises. At this time, the dispatcher needs to issue wind and light abandonment instructions and wind power and photovoltaic unit output reduction to maintain the system supply and demand balance.
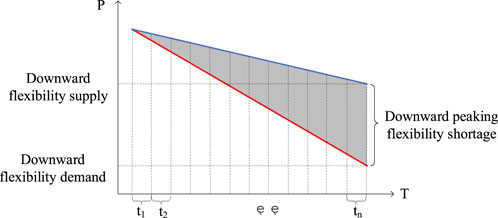
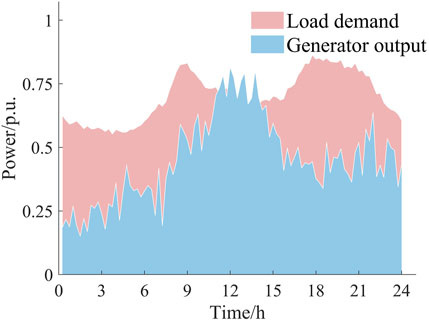
As shown in Figure 4, the solid blue line is the downward flexibility margin of the system flexibility resources and the solid red line is the downward flexibility demand of the net load. When the downward flexibility supply is less than the net load demand, the downward flexibility of the system is insufficient, and wind or PV will be curtailed to consume the excess renewable energy output. Similarly, when the supply of upward flexibility of the system is less than the net load regulation demand, the dispatch will issue a load-shedding command to maintain the power balance of the system. The source–load output comparison curve and the insufficient flexibility capacity are shown in Figure 5.
Due to the immature development of energy storage technology, in the operation of the power system, the supply and demand of power from both sides of the source and load need to be corresponded in real time. When the renewable energy output is at peak hours or the load power demand changes suddenly, the problem of lack of flexibility caused by insufficient system regulation speed and margin is likely to occur. Therefore, a quantitative analysis of the flexibility of the power system with a high proportion of renewable energy is important for the rational planning and real-time dispatch of the power system.
4.2 Modeling of flexibility requirements and resources for high-percentage renewable energy power systems
Compared with traditional flexible resources (such as gas, coal, and storage units), scenic renewable energy can be regarded as the reverse load of the system because the power output variation in scenic renewable energy is determined by meteorological conditions and almost does not actively participate in the power adjustment of the grid. Let the sequence of renewable energy power plant output in the system be
where N is the number of load nodes, M is the number of renewable energy stations, n is the load node number, and m is the renewable energy station number.
The sampling time interval is set as
where
System flexibility resources refer to units with flexibility regulation capability that can actively participate in system power regulation through unified dispatch and control, including coal-fired units, gas-fired units, adjustable hydropower units, and energy storage. Corresponding to the upregulation (downregulation) flexibility demand of the system, the upregulation (downregulation) flexibility supply of the system is defined as the difference between the upper bound (lower bound) of the system flexibility resource output at a certain moment and the system flexibility resource output at the previous moment, which is expressed as shown in Eq. 10:
where
4.3 A multi-scenario flexibility evaluation model accounting for wind and PV uncertainty
Because of the randomness of renewable energy output, during peak output periods, renewable energy output reduction can occur due to insufficient downward adjustment capacity of the system, i.e., insufficient system absorption capacity. Similarly, during peak net load demand periods, load reduction can occur due to insufficient upward adjustment capacity of the system, i.e., insufficient supply of system flexibility resources, defining the expectations of insufficient peak flexibility, reflecting the severity of the deficiency of the system’s adjustment margin. By subtracting the system flexibility supply–demand output curve, the expected indicator of insufficient system flexibility for adjusting peaks can be calculated as follows:
where
The increase in net load output demand per unit time is defined as positive and the decrease as negative; according to the definition of flexibility demand and flexibility supply, the time series of fluctuations of system upward (downward) flexibility supply and demand per unit time can be differentiated from the perspective of system output supply and demand balance, and the system’s supply and demand flexibility assessment index
where
When
where
The probability indicator of flexibility insufficiency reflects the dynamic stability and balance of the system by calculating the proportion of the time periods where the flexibility supply is less than the flexibility demand during the total sampling period, based on the statistics of the number of time periods corresponding to the insufficiency of climbing and peaking flexibility. It indicates the probability of the system’s flexibility insufficiency. The probability of inflexibility is as follows:
where
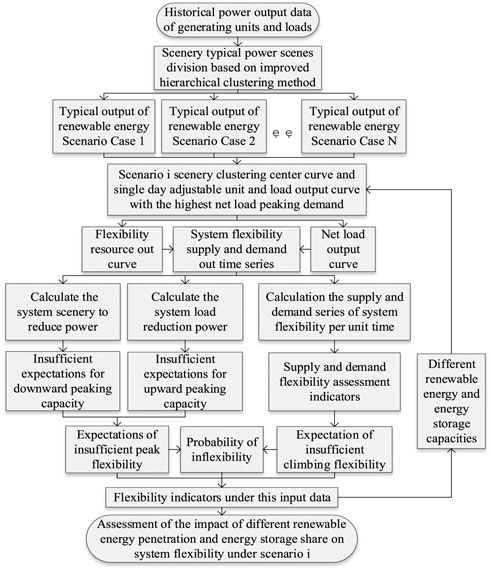
Based on the flexibility assessment indexes proposed in this paper, the typical scenarios of renewable energy output are extracted through an improved hierarchical clustering algorithm, which converts the linearly correlated multiple groups of wind and PV output data into several linearly independent renewable energy output clustering center curves to reflect the uncertainty characteristics of the original output data in a reduced dimensional way, effectively reducing the complexity of flexibility calculation. The specific process of the multi-scenario flexibility assessment of high-percentage renewable energy power systems with wind and PV uncertainty is shown in Figure 6.
Step 1. Based on the improved hierarchical clustering algorithm, the historical wind and PV output data on the high proportion of renewable energy power systems are clustered to build a set of typical renewable energy output scenarios taking into account the uncertainties.
Step 2. The central curve of renewable energy clustering in case I scenario and the single-day generating units, energy storage units, and load output data are substituted with the highest net load peaking demand in this scenario, and the load output and renewable energy output are compared to obtain the net load output curve, i.e., the demand flexibility curve; the sum of energy storage units and adjustable generating units output constitutes the supply flexibility curve.
Step 3. The scenario in which the supply of peaking flexibility is greater than the demand in the sampled supply–demand comparison curve is selected, making the difference between the supply and demand curves to obtain the system renewable energy reduction power, thus calculating the system downward peaking capacity shortage expectation index; then, from the scenario in which the supply of flexibility is less than the demand, the system load reduction power and upward peaking capacity shortage expectation index are calculated. After weighting and summing the indicators, the expectations of insufficient peak flexibility are obtained.
Step 4. First-order difference processing is carried out on the system flexibility supply and demand output data, which is decomposed into upward and downward system flexibility supply and demand per unit time, according to the power direction, and then, the fluctuation series of system flexibility supply and demand per unit time are differenced to obtain the upward and downward flexibility supply and demand evaluation index. By counting the corresponding output segments when
Step 5. The system flexibility assessment index under this condition is recorded, the capacity of energy storage and renewable energy units is changed, steps 1–4 are repeated, and the flexibility change in the high proportion of renewable energy power systems under the condition of different influencing factors is obtained.
5 Example
5.1 Algorithm setup
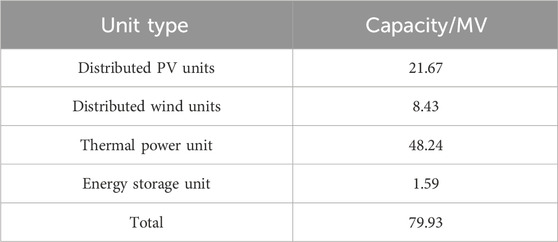
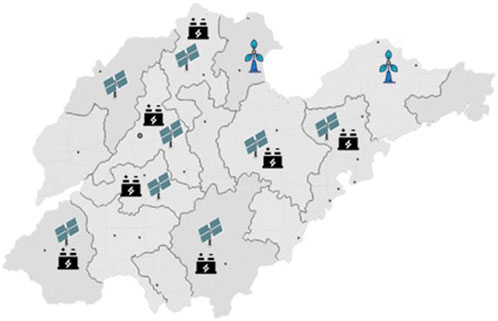
This example selects a typical intra-day operation of a high proportion of distributed PV and wind power pilot area in Shandong Province for flexibility calculation and analysis. The total installed capacity of all types of units in the regional grid is 79.93 MW, including approximately 49.83 MW of adjustable generating units and 30.10 MW of renewable energy units, with a maximum system load of 61.00 MW and a maximum network supply load of 55.45 MW. The specific unit types and installed capacities are shown in Table 1. The distribution of major wind power, PV, and energy storage in Shandong Province is shown in Figure 7.
5.2 Typical scenarios of renewable energy output taking into account the uncertainty
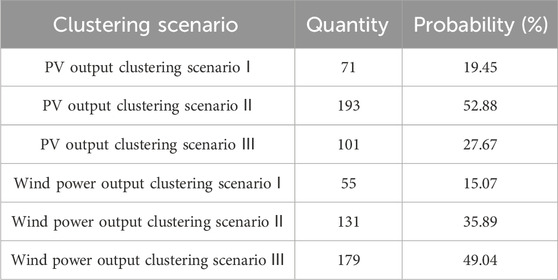
Based on an improved hierarchical clustering algorithm, a typical scenario analysis of historical power output data is performed for the installed renewable energy generating units in the region. The original data were provided by the power company in the region, and the inverter control strategy used power synchronization control (Zhang et al., 2009; Harnefors et al., 2021; Xiao et al., 2023a; Xiao et al., 2023b). The cohesive hierarchical clustering algorithm is used to divide the renewable energy output curve into scenes, and the clustering branch tree diagram of wind and PV output curve is obtained. Then, the Davies–Bouldin classification reliability indexes under different numbers of clustering scenes are calculated by Equation 7, and the reliability of the clustering results is quantitatively evaluated to achieve the optimal selection of the number of clustering scenes. The calculation results of the reliability index under each number of scenes are shown in Table 2. Based on the reliability analysis results of different clustering schemes, the clustering scheme with the smallest reliability index is selected, and the number of clustering scenes h is set to three. Based on the robust uncertainty processing to eliminate the interference of bad data, the set of renewable energy typical power output scenes is obtained, as shown in Figure 8, and the probability and number of each scene are shown in Table 3.

Table 2. Calculation results of wind and the PV clustering reliability index for each number of scenarios.
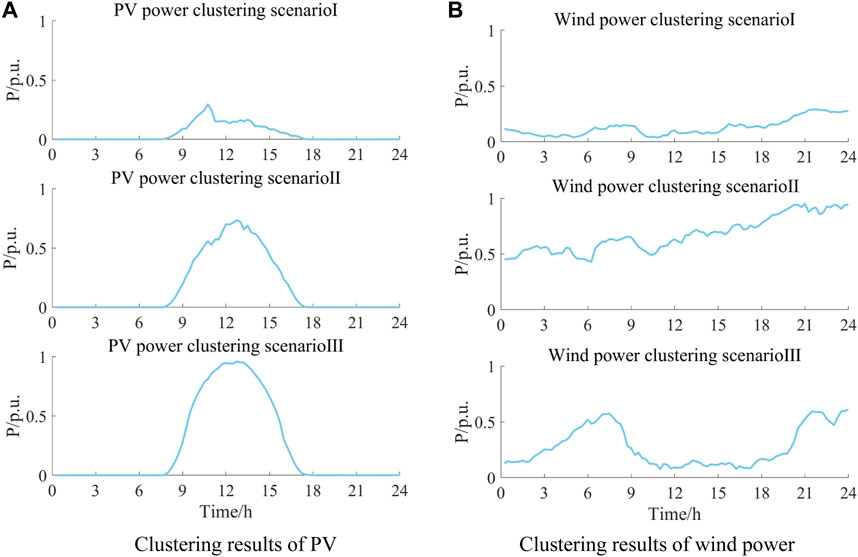
Figure 8. Clustering results of PV and wind power. (A) Clustering results of PV; (B) Clustering results of wind power.
5.3 Analysis and the solution process of high-percentage renewable energy power system flexibility
Assuming that the solar irradiation and wind resources in the region do not affect each other, the clustering center curves of each wind and PV output obey independent distribution. The dataset with the highest probability of occurrence in each scenario is used as an example for analysis, and the central curve of wind and PV clustering in this scenario is summed up as the input of regional renewable energy output data. Under the conditions of PV output clustering scenario II and wind power output clustering scenario III, the single day with the highest net load peaking demand is selected as the research object, and the thermal power units, energy storage, and load data of this day are substituted into the flexibility assessment. The model is used to calculate and analyze the data and show the solution process. Different wind and PV penetration rates and energy storage units are set as variables to differentiate the working conditions and calculate the change in flexibility under different working conditions.
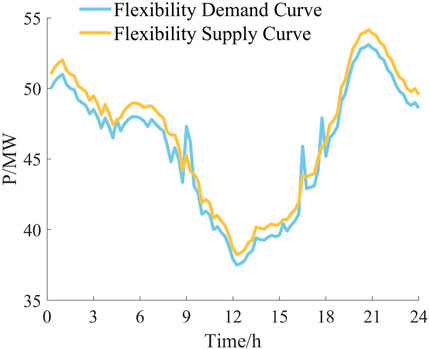
The net load output curve, i.e., the demand flexibility curve, is obtained by finding the difference between the load output and the distributed wind and PV unit output, and the supply flexibility curve is formed by the sum of the energy storage unit and thermal unit output. After sampling on the scale of
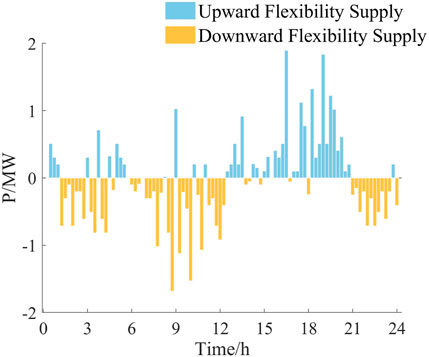
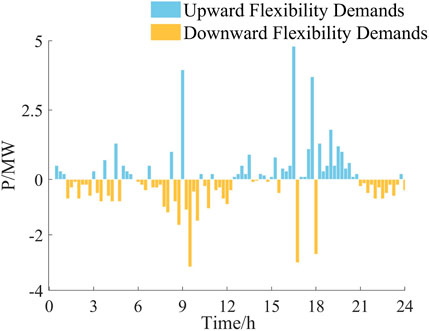
The system flexibility supply and demand output curves are first-order differential processed and decomposed into upward and downward system flexibility supply and demand per unit time, according to the power direction, as shown in Figures 10, 11, where the system flexibility demand output sequence is affected by the output of the wind and PV unit, and the creeping flexibility deficiency situation where the system output supply is smaller than the demand per unit time will occur in the time period with a larger output fluctuation range.
According to Equation 12, the time series of fluctuations of system upward (downward) flexibility supply and demand per unit time are made differential, and the upward and downward system supply and demand flexibility assessment index
The system flexibility supply and demand output curves will be differential, and the expectations of insufficient peak flexibility can be calculated by Equation 11; the power deficiency of
5.4 Analysis of the impact of renewable energy and energy storage on system flexibility
The evaluation index of system flexibility under this working condition is recorded. Keeping the load capacity and the total installed capacity of generating units unchanged, the distributed wind and PV unit penetration rate and the proportion of the installed capacity of energy storage units to the capacity of renewable energy units are changed, and the system source load data under the scenic penetration rate of 20%–80% and the energy storage ratio of 0%–10% are implemented in the model to iteratively calculate the system flexibility index values under different wind, light, and energy storage parameters. Based on the MATLAB CFTOOL toolbox, the calculated data points are fitted to the 3D polynomial, and the continuous variation in the flexibility indexes under different operating conditions is obtained, as shown in Figure 12.
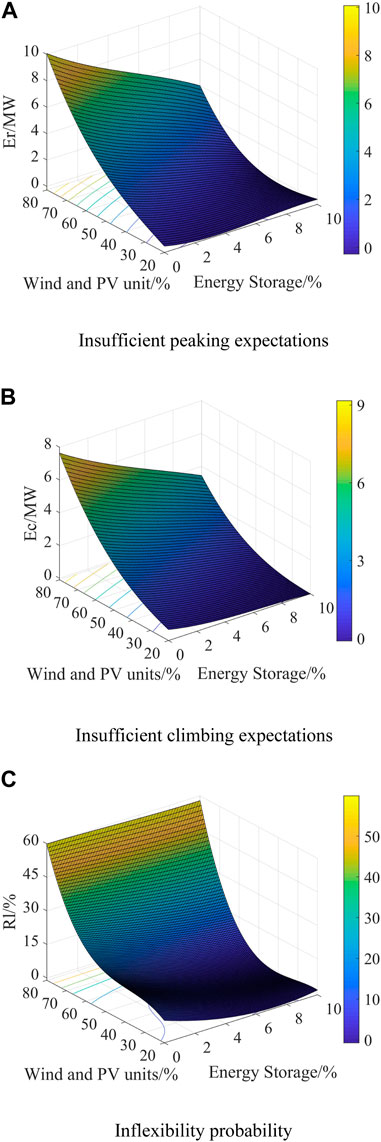
Figure 12. Continuous variation in the flexibility indexes under different operating conditions. (A) Insufficient peaking expectations. (B) Insufficient climbing expectations. (C) Inflexibility probability.
In the high proportion of renewable energy power systems, the access of energy storage units plays an important regulating role for the system flexibility. Based on the calculation results of the flexibility assessment index, the influence mechanism of different wind and PV penetration rates and energy storage proportions on system flexibility is analyzed: with the increasing wind and PV penetration rate and decreasing energy storage unit proportion, the expectations of insufficient peak flexibility increases continuously from 0 to 10.19 MW; the expectation of insufficient climbing flexibility increases from 0 to 7.86 MW; the system flexibility deficiency probability increases from 0% to 60.42%. The system’s flexibility deficiency continues to intensify.
According to the analysis of Figures 12A, B, because the total installed capacity of the generators and load power demand is certain, the higher the renewable energy units generate, the more difficult it is for the load to completely dissipate the energy. At the same time, with the continuous increase in the installed renewable energy capacity, when the wind and PV penetration rate exceed a certain range to reach a very high proportion of the renewable energy access level, the proportion of generating units with flexible power output regulation capability is very low, resulting in a serious shortage of the power support capacity of generating units to system load during the low time of wind and PV unit power output, leading to a situation of imbalance between the system active power supply and demand. At this time, in order to maintain the stable operation of the system, a large amount of load-shedding on the power system is required, causing incalculable losses to the economy and even production and life. In order to avoid the above situation, energy storage can be configured to cope with the problem of insufficient system flexibility. It can be seen from the index data that under different wind and PV penetration conditions, the access of energy storage units can effectively reduce the expectation of insufficient peak regulation and climbing flexibility of the power system, and the flexibility adequacy of the system is improved comprehensively, which verifies that the energy storage system can solve the problem of the insufficient supply of flexibility resources in the power system with a high proportion of renewable energy through power regulation and energy storage.
According to the analysis in Figure 12C, when the proportion of wind and PV is low, the access of energy storage units can effectively reduce the probability of insufficient flexibility, which is because in the system with a lower proportion of renewable energy access, the main reason for insufficient flexibility is the fluctuation of wind and PV output in a short time, and the access of the energy storage system can make up for the shortcomings of a lower climbing rate and longer response regulation time of traditional generating unit flexibility. However, with the increase in wind and PV penetration in the power system, the effect of energy storage units on the management of the probability of insufficient system flexibility gradually decreases, which is because when the wind and PV penetration rate is too high, the proportion of traditional generating units decreases, the system load power demand is too dependent on renewable energy generation, and the flexibility regulation capacity of generating units is insufficient during the low hours of renewable energy output, and the generating units appear in most output sections. In most of the output periods, the power supply of generating units and energy storage reaches the upper limit, but the system power supply is still less than the load demand, resulting in a certain capacity of energy storage unit access that still cannot effectively reduce the probability of insufficient system flexibility. New flexibility resources need to be added to the system to maintain the balance of power supply and demand in the power system.
In summary, in power systems with a high proportion of renewable energy sources on the grid, the access of energy storage units can effectively improve the system’s climbing and peaking flexibility and significantly reduce the probability of insufficient flexibility of the system. However, in the power system with a very high proportion of renewable energy sources on the grid, the access of the energy storage system should take into account the economic impact factors and combine it with other adjustable units for cooperative scheduling to improve the flexibility of the system and ensure the stable and economic operation of the power system.
6 Conclusion
This paper presents an analysis and evaluation of operational flexibility in high-percentage renewable energy power systems using an improved hierarchical clustering algorithm. The proposed flexibility evaluation method offers significant guidance for quantifying power system flexibility, analyzing the balance between the supply and demand of electric power, and allocating flexibility resources effectively. Initially, the traditional hierarchical clustering analysis method is applied, augmented by the Davies–Bouldin classification reliability index to optimize the number of clustering scenarios. Additionally, an enhanced cohesive hierarchical clustering analysis method is introduced to incorporate reliability considerations. Subsequently, a structured flexibility assessment process is devised for high-proportion renewable energy power grids, considering uncertainties associated with wind and PV sources. Furthermore, leveraging power grid data with notable distributed wind power and PV integration, a typical renewable energy output scenario is formulated, accounting for uncertainties in wind and PV sources. The system’s flexibility is then comprehensively calculated and analyzed under diverse operating conditions. The results indicate that, at a certain proportional renewable energy penetration rate, the inclusion of energy storage units can effectively alleviate flexibility regulation pressures arising from the uncertainty in renewable energy output. However, in cases of extremely high renewable energy penetration, relying solely on energy storage configurations becomes insufficient to meet the flexibility demands of the power system. Consequently, a strategic planning approach incorporating multiple flexibility resources is necessary to address the flexibility challenges posed by high levels of renewable energy grid integration. Although this paper has achieved some results in the study of flexibility assessment modeling for high-percentage renewable energy grids, there are still some issues that have not been studied in depth. For example, the special scenarios in the inflexibility situation are not defined, and the impact of multiple types of energy storage access systems is not considered. In the future, further research will focus on applying the flexibility assessment indexes proposed in this paper to the planning and scheduling of high-ratio renewable energy distribution grids and continue to conduct in-depth research on reducing the operating costs of distribution grids with high-ratio renewable energy access and improving the system’s flexible regulation capability, contributing to valuable solutions to the challenges of meeting the “dual-carbon” target and the integration of high-ratio renewable energy into the grid.
Data availability statement
The raw data supporting the conclusion of this article will be made available by the authors, without undue reservation.
Author contributions
QA: conceptualization, methodology, software, and writing–original draft. JX: conceptualization, methodology, validation, and writing–original draft. YL: software, validation, and writing–review and editing. LQ: data curation, writing–review and editing, and investigation. JC: writing–review and editing, data curation, and validation. XL: validation, writing–review and editing, and investigation. YW: formal analysis, investigation, and writing–review and editing.
Funding
The author(s) declare that financial support was received for the research, authorship, and/or publication of this article. This work was supported by the China Three Gorges Renewables (Group) Co., Ltd. (37044032).
Conflict of interest
Authors QA, JX, LQ, JC, XL, and YW were employed by Renewables (Qingyun) Co., Ltd.
The authors declare that this study received funding from Renewables (Qingyun) Co., Ltd., China Three Gorges Corporation, Dezhou, China. The funder had the following involvement in the study: study design, data collection and analysis.
The remaining authors declare that the research was conducted in the absence of any commercial or financial relationships that could be construed as a potential conflict of interest.
Publisher’s note
All claims expressed in this article are solely those of the authors and do not necessarily represent those of their affiliated organizations, or those of the publisher, the editors, and the reviewers. Any product that may be evaluated in this article, or claim that may be made by its manufacturer, is not guaranteed or endorsed by the publisher.
References
Ai, X., Zhou, S. P., and Zhao, R. Q. (2014). Research on optimal dispatch model considering interruptible loads based on scenario analysis. Chin. J. Electr. Eng. 34 (S1), 25–31. doi:10.13334/j.0258-8013.pcsee.2014.S.004
Gholizadeh-Roshanagh, R., and Zare, K. (2019). Electric power distribution system expansion planning considering cost elasticity of demand. IET Generation, Transm. Distribution 13 (22), 5229–5236. doi:10.1049/iet-gtd.2018.6740
Harnefors, L., Schweizer, M., Kukkola, J., Routimo, M., Hinkkanen, M., and Wang, X. (2021). Generic PLL-based grid-forming control. IEEE Trans. Power Electron. 37 (2), 1201–1204. doi:10.1109/tpel.2021.3106045
Hou, H., Gan, M., Wu, X. X., Zhao, B., Zhang, L. q., Wang, Z., et al. (2023). Two-stage distributionally robust optimal scheduling for port multi-energy microgrid considering mobile hydrogen energy storage. Chin. J. Electr. Eng., 38, 1–18. doi:10.13334/j.0258-8013.pcsee.223327
Huang, B. B., Xie, M., Lin, S. Z., He, R. Q., and Cheng, P. J. (2023). Research on collaborative optimization planning method of power supply under the background of new-type power system. Electr. Autom. 45 (01), 54–58. doi:10.3969/j.issn.1000-3886.2023.01.015
Li, G. L., Han, J. F., and Ma, P. (2021). Optimal allocation of distributed wind power in active distribution network based on scenario clustering. Guangdong Electr. Power 34 (04), 53–58. doi:10.3969/j.issn.1007-290X.2021.004.007
Li, H. B., Lu, Z. X., Qiao, Y., and Zeng, P. (2015). Assessment on operational flexibility of power grid with grid-connected large-scale wind farms. Power Grid Technol. 39 (6), 1672–1678. doi:10.13335/j.1000-3673.pst.2015.06.032
Li, Z. H., Chen, L., Lu, X. M., Zhang, Y. W., Xu, F., Yan, G. G., et al. (2017). Assessment of renewable energy accommodation based on system flexibility analysis. Power Grid Technol. 41 (07), 2187–2194. doi:10.13335/j.1000-3673
Liu, J. S., Luo, N., Wang, J., Xu, C., Cao, Y., and Liu, Z. W. (2022). Massive scenario reduction based distribution-level power system planning considering the coordination of source, network, load and storage. China Electr. Power 55 (12), 78–85. doi:10.11930/j.issn.1004-9649.202208020
Liu, Y. Q., Xie, M., Wei, W., Zhang, Y., and Liu, M. (2019). Assessment and optimization for power system flexibility with high proportion of wind power. Power Constr. 40 (9), 1–10. doi:10.3969/j.issn.1000-7229.2019.09.001
Lu, X., Zhang, D. H., Zhou, S. C., Gong, X. F., Zhang, H. B., Xue, X. Z., et al. (2023). Coordinated planning layout method for system-level new energy storage of complex ac/dc power grids. South. Power Grid Technol., 1–11. 57, doi:10.13648/j.cnki.issn1674-0629.2023.08.010
Martins, V. F., and Borges, C. L. T. (2011). Active distribution network integrated planning incorporating distributed generation and load response uncertainties. IEEE Trans. Power Syst. 26 (4), 2164–2172. doi:10.1109/tpwrs.2011.2122347
Tong, Y. X., Hu, J. J., Liu, X., Tao, C., and Ma, Y. (2023). Quantification of flexibility supply and demand and distributionally robust optimal dispatch of renewable energy dominated power systems. Power Syst. Autom., 1–18. doi:10.7500/AEPS20220707011
Ulbig, A., and Andersson, G. (2014). Analyzing operational flexibility of electric power systems. Power systems computation conference(PSCC). August 18-22 2014, Wroclaw,Poland:8p.
Xiao, H., Gan, H., Yang, P., Li, L., Hao, Q., Huang, Y., et al. (2023b). Robust submodule fault management in modular multilevel converters with nearest level modulation for uninterrupted power transmission. IEEE Trans. Power Del., 1–16. 99, doi:10.1109/tpwrd.2023.3343693
Xiao, H., He, H., Zhang, L., and Liu, T. (2023a). Adaptive grid-synchronization based grid-forming control for voltage source converters. IEEE Trans. Power Syst., 1–4. 99, doi:10.1109/tpwrs.2023.3338967
Xu, L. W., Sun, Y. Y., Ma, Z., Li, Y. H., Sun, K. Q., Li, K. J., et al. (2022). Study on voltage level in low voltage direct current supply and utilization system. Power Supply 39 (8), 3–14. doi:10.19421/j.cnki.1006-6357.2022.08.001
Xu, Z. Y., Liu, H., and Zhang, C. H. (2021). Operational flexibility evaluation of active distribution network based on the sequential direction matrix. J. Tianjin Univ. Nat. Sci. Eng. Technol. Ed. 54 (4), 362–373. doi:10.11784/tdxbz202004004
Yasuda, Y., Gomez-Lazaro, E., and Menemenlis, N. (2013), Flexibility chart: evaluation on diversity of flexibility in various areas. 12th wind integration workshop, . London,UK: October-24 2013.
Yu, R. (2015). Multi-objective optimization for DG planning based on multi-scenario analysis. Nanchang, Jiangxi, China: East China Jiaotong University,
Zhang, L., Harnefors, L., and Nee, H.-P. (2009). Power-synchronization control of grid-connected voltage-source converters. IEEE Trans. Power Syst. 25 (2), 809–820. doi:10.1109/tpwrs.2009.2032231
Zhang, X. hui., Yan, K. K., Lu, Z. G., and Zhong, J. (2014). Scenario probability based multi-objective optimized low-carbon economic dispatching for power grid integrated with wind farms. Power Grid Technol. 38 (7), 1835–1841. doi:10.13335/j.1000-3673.pst.2014.07.018
Zhao, J., Zheng, T., and Litvinov, E. (2015). A unified frame work for defining and measuring flexibility in power system. IEEE Trans Power Syst. 31 (3), 339–347. doi:10.1109/tpwrs.2015.2390038
Keywords: renewable energy, power system flexibility, evaluation model, resource scheduling, hierarchical cluster analysis
Citation: Ai Q, Xiang J, Liu Y, Qu L, Cao J, Li X and Wang Y (2024) Multi-scenario flexibility assessment of power systems considering renewable energy output uncertainty. Front. Energy Res. 12:1359233. doi: 10.3389/fenrg.2024.1359233
Received: 21 December 2023; Accepted: 15 February 2024;
Published: 15 March 2024.
Edited by:
Yuqing Dong, The University of Tennessee, Knoxville, United StatesReviewed by:
Xiangmin Xie, Qingdao University, ChinaGuangsheng Pan, Southeast University, China
Huangqing Xiao, South China University of Technology, China
Copyright © 2024 Ai, Xiang, Liu, Qu, Cao, Li and Wang. This is an open-access article distributed under the terms of the Creative Commons Attribution License (CC BY). The use, distribution or reproduction in other forums is permitted, provided the original author(s) and the copyright owner(s) are credited and that the original publication in this journal is cited, in accordance with accepted academic practice. No use, distribution or reproduction is permitted which does not comply with these terms.
*Correspondence: Yaolin Liu, MjAyMTM0NjY3QG1haWwuc2R1LmVkdS5jbg==
 Qing Ai1
 Yaolin Liu