 Yadukrishnan Sasikumar
 Stylianos Chatzidakis
 Zachery Dahm
 Samuel G. Durbin
 Rose Montgomery
95% of researchers rate our articles as excellent or good
Learn more about the work of our research integrity team to safeguard the quality of each article we publish.
Find out more
ORIGINAL RESEARCH article
Front. Energy Res. , 15 February 2024
Sec. Nuclear Energy
Volume 12 - 2024 | https://doi.org/10.3389/fenrg.2024.1229025
Interim dry storage of spent nuclear fuel involves storing the fuel in welded stainless-steel canisters. Under certain conditions, the canisters could be subjected to environments that may promote stress corrosion cracking leading to a risk of breach and release of aerosol-sized particulate from the interior of the canister to the external environment through the crack. Research is currently under way by several laboratories to better understand the formation and propagation of stress corrosion cracks, however little work has been done to quantitatively assess the potential aerosol release. The purpose of the present work is to introduce a reliable generic numerical model for prediction of aerosol transport, deposition, and plugging in leak paths similar to stress corrosion cracks, while accounting for potential plugging from particle deposition. The model is dynamic (changing leak path geometry due to plugging) and it relies on the numerical solution of the aerosol transport equation in one dimension using finite differences. The model’s capabilities were also incorporated into a Graphical User Interface (GUI) that was developed to enhance user accessibility. Model validation efforts presented in this paper compare the model’s predictions with recent experimental data from Sandia National Laboratories (SNL) and results available in literature. We expect this model to improve the accuracy of consequence assessments and reduce the uncertainty of radiological consequence estimations in the remote event of a through-wall breach in dry cask storage systems.
The current disposal pathway for commercial spent nuclear fuel (SNF) in the United States involves transfer from wet storage in pools to stainless steel storage canisters for dry storage until a solution is finalised for final disposal. Typically, the canisters are made of stainless steel. The open volume between the canister and the surrounding shielding concrete cask allows passive ventilation from outside air, which can impart dust and other contaminants that may collect on the outer surfaces of the canister. As the SNF sealed inside the canister cools, salts contained in the dust on the external canister surfaces may deliquesce to form concentrated brines, which may contain corrosive species such as chlorides. These species are capable of causing localized corrosion, called pitting. With sufficient stresses, these pits can evolve into stress corrosion cracks (SCCs) that could eventually penetrate through the canister wall. The performance of dry storage canisters has been widely studied under such conditions (Gilkey et al., 2022; EPRI, 2023; U.S.NRC, 2021; NUREG/CR-7030, 2010; Enos and Bryan, 2016; Bryan and Enos, 2014). However, the potential consequences associated with unmitigated through wall leak paths associated with chloride-induced stress corrosion cracking (CISCC) of canisters have not been specifically analyzed. The hypothetical CISCC degradation scenario could include through-wall cracking followed by loss of inert backfill overpressure, air ingress, and reduced heat removal capacity.
Of primary concern in the development of this model is the potential release of radioactive aerosols from surface contamination, in-reactor failed fuel rods, or rods breached as a result of air ingress to the canister after canister breach (Durbin et al., 2021; Montgomery et al., 2022). Such particles are considered to be respirable when they are under 10 μm in aerodynamic diameter and can diffuse in the air until they are trapped by a surface (NRC Library, 2014). CISCC cracks are known to be convoluted and tight, typically with channel openings ranging from 3 to 160 μm with an average of ∼37 μm (thus the term microchannel) (Durbin et al., 2021) (Figure 1) through the wall thickness in the case of SCCs in canisters. Recent studies have shown that aerosols can deposit in the crack paths leading to partial, or in some cases complete, plugging of the leak path, significantly reducing the potential consequences (Durbin et al., 2018; Chatzidakis and Scaglione, 2019a).
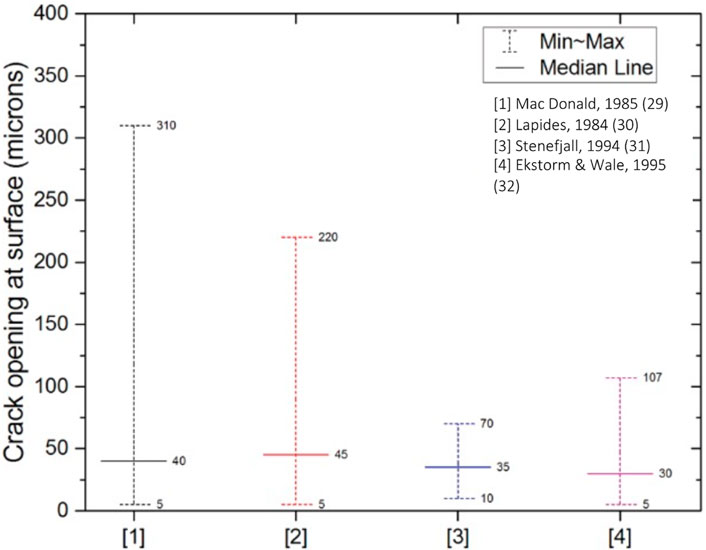
FIGURE 1. Crack opening displacement median, minimum and maximum values from extensive literature studies looking at stress corrosion cracks in austenitic stainless steels [Figure adapted from Liu and Nazaroff (2001) comparing results from (29), (30), (31) and (32)].
This work presents a numerical aerosol transport and plugging model that can predict the diffusion, deposition, and retention of aerosol particles in capillaries, slots and cracks similar to stress corrosion cracks (Chatzidakis, 2018). The paper discusses the underlying physics of the model developed and confirmation of model validity with recent experimental data. The large number of parameters and features involved in modeling aerosol flow makes high fidelity calculations a slow and cumbersome process. In such scenarios, a simplified mechanistic model, such as the one presented in this paper, can provide reasonable estimates with less computational cost. The present model can simulate a wide range of particle size, distribution, pressure differential, flow regimes, and microchannel dimensions. It can predict pressure change over time due to depressurization (transient state) and particle deposition within a large vessel, such as a canister, before, during, and following depressurization.
The validation data presented in this paper is based on surrogate SNF aerosol experiments conducted by Durbin et al. (SNL) (Durbin et al., 2018) and experiments conducted by Tian et al. (Tian et al., 2017). The two experimental studies were chosen based on the best available experimental data to replicate aerosol flow through stress corrosion crack like geometries on canisters. As such, there is a dearth of experimental data looking at such scenarios, as discussed by Durbin et al. (2021). The apparatus and experiment conditions adopted by Durbin et al. have been discussed in Section 4. Tian et al. on the other hand has compared the settling and particle penetration efficiencies as a function of pressure and flow velocities for different crack dimensions. Together, these experimental studies present a suite of conditions for validating the model. Section 4 also discusses the results from the benchmarking exercise, highlighting the model considerations and the unique capability of the model to identify the dominating deposition mechanisms based on particle size and flow kinetics.
Lastly, the paper also presents the model’s capabilities including a Graphical User Interface (GUI) that was developed to simplify user access and help stakeholders perform quick and easy first-principles calculations without the need to understand the underlying MATLAB script.
Aerosol transport is accomplished by dispersion of the small solid particles suspended in a gas and the two phases are one-way coupled, i.e., the gas phase influences the behavior of the particulate phase while the particle phase has no influence on the hydrodynamics of the gas phase (Chatzidakis, 2018). As discussed on the following subsections, aerosol transport, deposition, and retention depend on the thermodynamic behavior of the canister inert gas, as well as the geometric characteristics of the leak path and the aerosols. Therefore, the model is based on three sets of parameters describing 1) the thermo-dynamic behavior of the inert gas within the canister before, during, and after depressurization, 2) the flow rate through a microchannel leak path, and 3) the transport and deposition of aerosols within a microchannel leak path. Each parameter set is described in the following sections.
For purposes of modeling the potential leakage of aerosols from the canister interior through a CISCC path in the canister wall to the environment, three thermodynamic volumes are defined: everything interior to the inner surfaces of the dry storage canister, the CISCC through wall crack, and everything external to the canister.
Inside the canister, flow is driven by natural convection generated by the temperature gradients imposed by the decay heat of the stored fuel. Aerosol particles being circulated by the natural convection within the canister can adhere to particles/surfaces, settle by gravity, and be resuspended. The magnitude of aerosol deposition on surfaces within a canister is contingent upon several factors, including the concentration and size of the aerosols, as well as the size, roughness, orientation, and shape of the surfaces.
Coagulation and deposition are inherent properties of aerosols (Hinds WC, 1982). Coagulation is the process of aerosol particles colliding and sticking with one another, to form larger particles. Deposition happens through the boundary layer at the surface walls and is only possible when the particles penetrate the stagnant boundary layer in contact with the walls. Both coagulation and deposition can be described using the principle of mass conservation when applied to aerosol particles inside a canister (Chatzidakis, 2018):
where K1c is the coagulation decay rate (hr−1), C1 is the particle concentration (kgm−3), t is time (s), Q is the volumetric flow rate (m3s−1), V1 is the canister’s free volume (m3), K1g is the particle decay rate due to gravitational settling, and K1d is the particle decay rate due to diffusion to the surfaces. The first and second terms on the right side represent the rate at which particles are removed from the canister by coagulation and airflow, respectively. The third term represents the rate at which particles are removed by deposition mechanisms on surfaces other than microchannels.
Within a canister, a homogeneously distributed monodisperse aerosol will decay exponentially due to gravitational settling with a decay constant:
where vs is the Stokes settling velocity (m/s), Sf the projected area of the canister (m2), and V is the canister volume (m3). For a typical vertical canister with vs = 3 × 10⁻⁵ m/s, Sf = 1 m2 and V = 6 m3, the decay constant for particles of 1 μm aerodynamic diameter is 0.02 h−1, which translates to a half-life of 34.6 h. For 0.1 μm aerodynamic diameter the decay constant is 0.002 h−1 with a half-life of 346 h. Similarly, for 10 μm aerodynamic diameter, the decay constant is 0.2 h−1 with a half-life of 3.46 h. Coagulation and diffusive deposition are expected to decrease these times even further. This shows that aerosol suspension time within a canister decreases with increasing aerodynamic diameter with half of the suspended particles having less than 10 μm depositing within the canister is less than 4 h and after 40 h (or ten half-lives) a 1000-fold reduction of the initial aerosol concentration is expected.
A temperature difference of 0.01°C in a canister with an effective wall length of 1 m can keep an aerosol consisting of particles smaller than 10 μm homogenously distributed inside the canister (Chatzidakis, 2020). When the particle size is so large that the deposition velocity approaches the velocity of the free convection there will arise inhomogeneous aerosol distribution. The particle diameter at which this occurs (
where µ is the viscosity of the gas (Pa.s), α is the coefficient of thermal expansion of the gas (K−1), ΔT is the average temperature difference causing the convection, ρ is the particle density (kgm−3), and l is the wall length (m). F (dmax) may be taken unity for dmax larger than 1 and then the following relation holds:
For the usual range of canister volumes and ΔΤ = 0.01οC, dmax ranges from 18–24 μm (aerodynamic diameter). Clearly, respirable aerosol particles of a few μm or less would remain homogeneously distributed within a canister. Another way to interpret this result is to compare the convective flow velocity of the order of 10–20 cm/s or higher to the particle’s settling velocity, which is several orders of magnitude lower ∼10–3 cm/s.
To estimate the volumetric flow rate from Eq. 1 that may remove aerosols from the canister to the outside environment once a crack forms, a depressurization equation was added to the model to account for pressure change over time. Combining mass and energy conservation equations for vessel depressurization, one can arrive at the following formula to account for pressure change over time (transient state):
Where γg is the ratio of specific heat capacity at constant pressure and volume, and
Leak path parameters through which a particle must travel to escape from the canister mainly include crack characteristics such as location, quantity, branching, roughness, area. The principle of mass conservation (Eq. 1) is applied to describe aerosol transport in an arbitrary leak path. An aerosol transport equation can be applied to any cross-sectional shape for which the hydraulic diameter and mass flow rate are known (Williams, 1994). The mass flow rate Qm for continuum flow can be written as a function of the pressure drop along the flow direction:
where x is the axial distance from the inlet of the crack (or capillary) (m), pu and pd are the pressures upstream and downstream from the crack (Pa), respectively, L is the length of the duct (m), χ is the perimeter of the duct (m), and A is the cross-sectional area (m2). This equation can be solved numerically to determine the mass flow rate Qm (m3sec−1). When this is known, the velocity and volumetric flow rate can be calculated using mass continuity.
Using the approach by Williams (1994) (16), the mass flow rate from Eq. 6 for a constant cross section can be expressed as:
Where, Cf is the friction factor, Rg is the gas constant (Jkg−1K−1), pu and pd are the pressure at the upstream and at the downstream of the crack, respectively, T is the fluid temperature (K), L is the length of the duct (m), χ is the perimeter of the duct (m), and A is the cross-sectional area (m2).
The transition from laminar to turbulent flow for pipes supposedly takes place at Re = 2,300. However, microcracks or capillaries with microscale diameters show the transition to occur much earlier, at Re numbers as low as 5–10 for rectangular geometries and Re = 400–600 for cylindrical geometries (Chatzidakis and Scaglione, 2019b). At these low Re numbers, any error in the friction factor has a large influence and this resulted in the need for new friction factor correlations for transient flows. A detailed derivation of the friction factors and flow equations can be found elsewhere (Chatzidakis, 2018).
The current model is based on the aerosol general dynamic equation (Crowe et al., 2005). For the case of aerosol penetration through a microchannel, assuming only external processes, the general dynamic equation (GDE) is reduced to a transport equation, which can be written as follows in one-dimensional form (Mitrakos et al., 2008; Chatzidakis and Scaglione, 2019b):
Where, C is the aerosol mass concentration (kgm−3), Vd is the deposition velocity (msec−1), A is the cross-sectional area (m2), χ is the wetted perimeter of the cross section (m), and u is the gas velocity (msec−1). The deposition velocity is calculated as the sum of the deposition velocities corresponding to each individual deposition mechanism. The deposition mechanisms transport aerosols to the walls of the leak path due to gas flow, gradients, or external forces. Five primary deposition mechanisms are included in the model:
1. Gravitational settling: The deposition velocity due to gravitational settling is written as follows (Drossinos et al., 2016):
Angle θ is the angle between the airway direction and the force of gravity (the so-called gravity angle), ρp is the particle’s density (kgm−3), dp is the particle’s diameter (μm), Cc is the Cunningham slip correction factor that depends on the particle’s size, g is the acceleration due to gravity (ms−2), and μg is the dynamic viscosity of the gas (Pa.s).
2. Brownian diffusion: The deposition velocity due to Brownian diffusion is determined using mass transfer theory. It is expressed in terms of the concentration boundary layer thickness, where according to the heat-mass transfer theory analogy, the Nusselt number is replaced by the Sherwood number Shah and London (1978). Specifically,
where, DH is the hydraulic diameter (m) of the crack, DB is the diffusion coefficient (m2s−1), KB is the decay rate (hr−1), Cc is the Cunningham’s slip correction factor and μg is the dynamic viscosity of the gas (Pa.s). The Sherwood number is specified as a function of distance from the beginning of the crack to properly account for entrance effects.
3. Eddy impaction: Eddy impaction comes into effect only when the flow is turbulent. In a turbulent fluid, there is an ensemble of eddies of varying size and intensity. Depending on their size and mass, particles tend to become entrained within the eddies and follow the eddies’ motion. Eddy impaction velocity will be written in terms of friction velocity ufr (ms−1) and reduced stopping time τ+, as follows (Drossinos et al., 2016):
4. Inertial impaction: The deposition velocity due to inertial impaction is written as follows (Drossinos et al., 2016):
where u is the gas velocity (ms−1), Stk is the Stokes number, DH is the hydraulic diameter (m) and Lc the length of the curved branching zone (m).
5. Turbulent diffusion: In case of turbulent flow, the mechanism of eddy diffusion is considered. Molecular (Brownian) diffusion can be neglected in this case. The deposition velocity due to eddy diffusion is determined by using the standard correlation given below (Wells and Chamberlain, 1967):
where ufr is the friction velocity in a turbulent boundary layer (ms−1), Scp is the Schmidt number which is the kinematic viscosity of the fluid to the diffusivity of the particle, Re is the Reynolds number and
In practice, any temperature change through the crack flow path would only have a small effect on gas flow, but it could provoke thermophoretic velocities that could affect aerosol deposition. This is, however, not included in the present model. Other second order deposition mechanisms such as electrophoresis and diffusiophoresis are neglected as rough calculations indicate that the contribution of these mechanisms is relatively lesser in the removal of particles as compared to the first order mechanisms considered in the model. The total deposition velocity is given as the algebraic sum of the deposition velocities corresponding to each individual mechanism, namely:
As can be seen from Eq. 16, the model is flexible and additional deposition mechanisms can be added if needed. As mentioned in the introduction, studies have shown evidence of partial or complete plugging of aerosol leak paths. Plugging occurs when particulate matter deposits on the surface of the flow channel, changing the internal geometry of the flow area. To model this, the mass of the deposit up to any position S in the crack path, can be obtained in terms of the deposition velocity Vd (ms−1) and the particle concentration C (kgm−3) as follows (Mitrakos et al., 2008):
The deposition of particles is assumed to occur uniformly on the path’s circumference. This assumption is valid for mechanisms such as Brownian or turbulent diffusion or for eddy impaction, but it is approximate for directional mechanisms such as gravitational settling. Under this assumption, the change in radius due to plugging is related to the deposit volume, as follows:
Where,
Figure 2 shows a flowchart of the code and the different underlying steps that are involved in predicting the penetration, retention, and modifications to the crack, as a result of depressurization. The code currently covers rectangular and cylindrical geometries that are perceived as ideal stress corrosion crack geometries. The numerical solution first calculates the fluid velocity in each time step. Then the particle transport equation is solved using an implicit finite difference scheme. As mentioned previously, the deposition of particles is assumed to occur uniformly along the path’s circumference in the current model. The duct radius is then updated by calculating the amount of the deposited mass (Eq. 18). All the numerical integrations required in this calculation are performed using the trapezoidal rule (Chatzidakis, 2020). The new cross section is then used for the aerosol calculations in the next step.
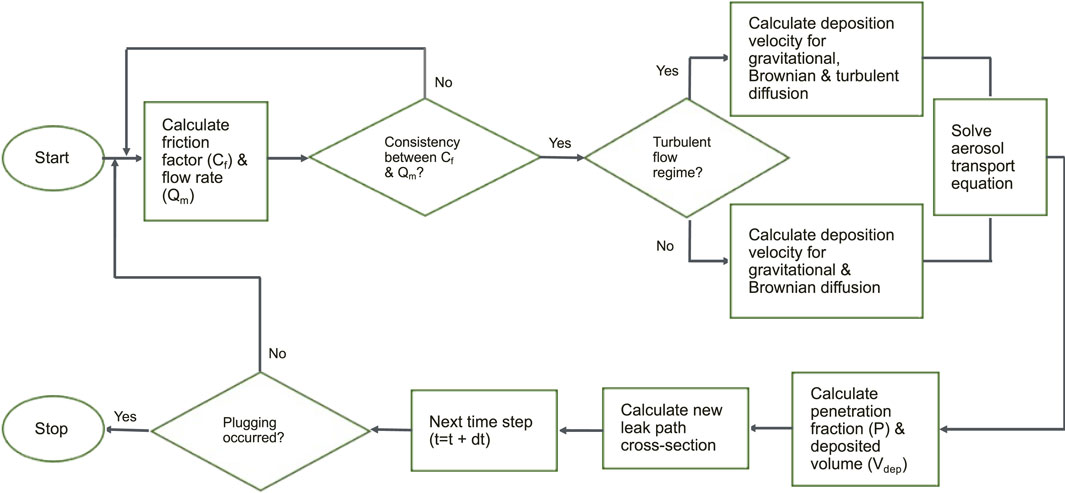
FIGURE 2. Steps involved in the numerical solution of the aerosol transport equation in the model.
The model is approximate in the way it can simulate rough or smooth surfaces, irregular geometries, and unsteady flow. Four main deposition mechanisms including gravitational, Brownian diffusion, turbulent diffusion, and eddy impaction are considered in the model as discussed in Section 2. It is noted that the deposition mechanisms are weighted equally in the model, however their contribution depends strongly on particle size. For example, in this work gravitational settling and inertial impaction have a dominant contribution to deposition when compared to Brownian given the larger particle sizes used. Laminar, transition, and turbulent gas flow regimes have also been included in the model. Further, a wide range of particle size, distribution, pressure differential, flow regimes, and microchannel dimensions can be simulated using the current model. The model can predict pressure change over time due to depressurization (transient state) and particle deposition within a large vessel, such as a canister, before, during, and following depressurization. A summary of the model characteristics is presented in Table 1.
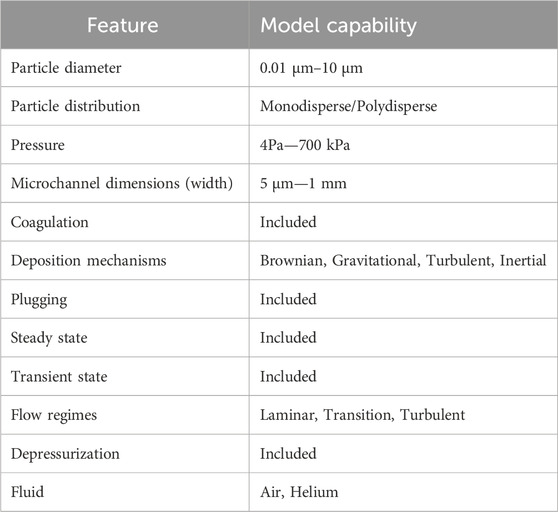
TABLE 1. Main characteristics covered in the model.
Additionally, a simple Graphical User Interface (GUI) was developed based on the model (Figure 3). The GUI is based on a series of MATLAB scripts that make up the aerosol transport code. The scripts perform calculations for two specific crack geometries (cylindrical and rectangular) to give specific outputs. The GUI was constructed in MATLAB App Developer with call back functions from the code. The executive function first chooses the specific call back functions based on the chosen geometry, and then all the necessary user inputs from the GUI are fed into the function which calculates the desired outputs and passes these back to the GUI to be displayed. A detailed description of the GUI and its functions can be found in Dahm et al. (2022).
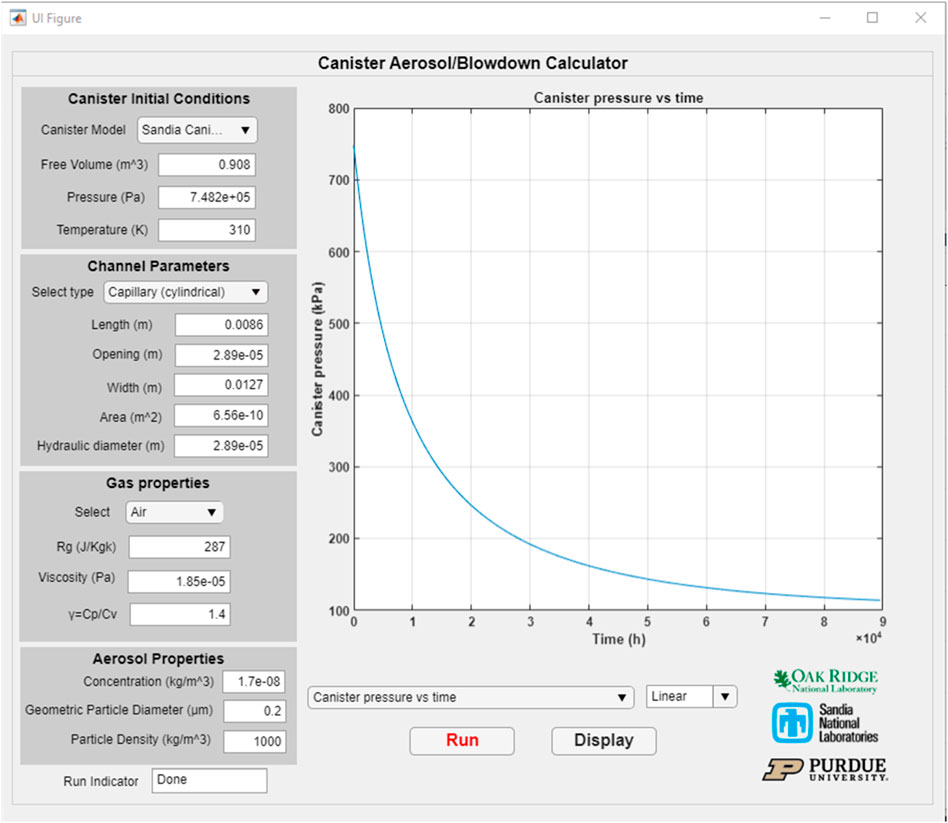
FIGURE 3. Graphical User Interface of the present code.
The proposed model was previously validated (Chatzidakis and Scaglione, 2019a) using generic theoretical and experimental studies looking at penetration of particles through cracks in a naturally broken brick (Liu and Nazaroff, 2003) and through a cracked reinforced concrete sample (Gelain and Vendel, 2008). However, the consideration for the present model is to simulate aerosol transport through stress corrosion cracks in dry storage canister walls where the focus is on much narrower and shorter crack paths resembling microchannels. Hence, the benchmarking efforts were extended to real experimental cases looking at aerosol flows through microchannels. Two cases have been presented here (Gilkey et al., 2022): SNF surrogate particle penetration through an engineered microchannel by Durbin et al. (2018), and (EPRI, 2023) plugging in ideal SCC induced leak paths by Tian et al. (2017).
Durbin et al.‘s experiments aimed at understanding the flow rates and aerosol retention in stress corrosion cracks using an engineered microchannel/slot with characteristic dimensions resembling that of real cracks observed on canisters. The experimental setup (seen in Figure 4) consisted of a 0.908 m3 (240 gal) pressure tank that was used to simulate a canister. A test section was connected to the tank with a mass flow meter to precisely measure the flow from the tank to the test section. An engineered microchannel simulating a crack was mounted in the middle of the test section. The dimensions of the microchannel were 12.7 mm (0.500 in.) wide, 8.86 mm (0.349 in.) long and an average of 28.9 μm (0.0011 in.) deep. A schematic of the microchannel assembly is shown in Figure 5. Cerium oxide (CeO2) was chosen as the surrogate for spent nuclear fuel because of its relatively high density (7.22 g/cm3) and its commercial availability. The experimental approach was similar to previous studies (Wells and Chamberlain, 1967; Lewis, 1995; Liu and Nazaroff, 2003; Gelain and Vendel, 2008) in that aerosol analyzers are used to characterize the particle size distribution and concentration present in the gas before and after flowing through a simulated crack. A detailed layout and description of the experiment can be found in Durbin et al. (2018).
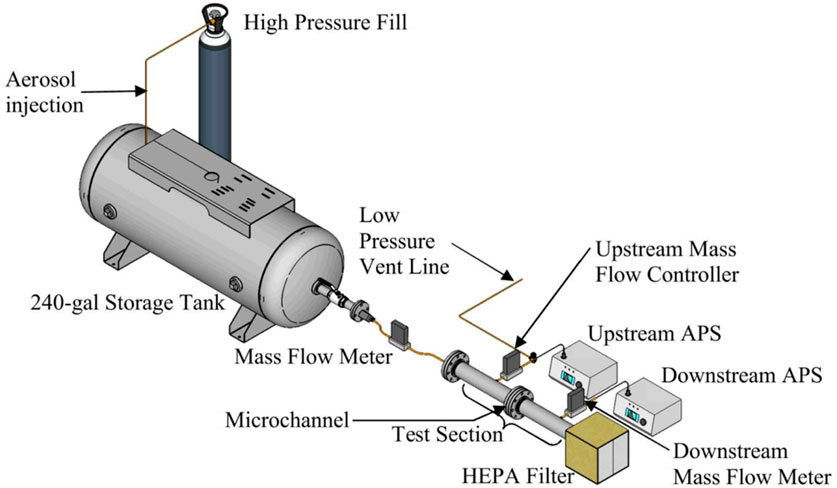
FIGURE 4. General layout of the experimental apparatus used by Durbin et al. (2018).
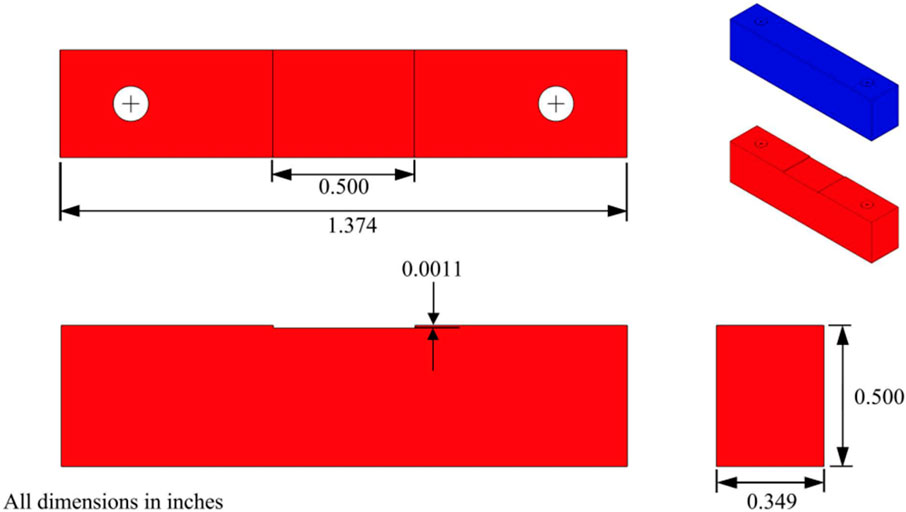
FIGURE 5. Schematic of the microchannel assembly used by Durbin et al. (2018).
The engineered microchannel geometry was added to the model and it was initially run for blowdown conditions dealing with transient states. The blowdown results were then compared to the gas flow measurements from Durbin et al. (2018). It is noted that the measurements were taken before particles were released into the tank, so there was no aerosol influence in the flow (pre-aerosol measurements). The canister (tank) was assumed to have a starting initial pressure of 800 kPa (116 psia). Deposition mechanisms depend on flow rate, so the ability to correctly predict flow rate is critical to both the experiment and the predictions using the model. The results of the present model vs. Durbin et al.‘s experimental measurements are shown in Figure 6 for two Reynolds number co-relations. A model with friction factor correlation of Gelain and Vendel, (2008) is also presented for comparison.
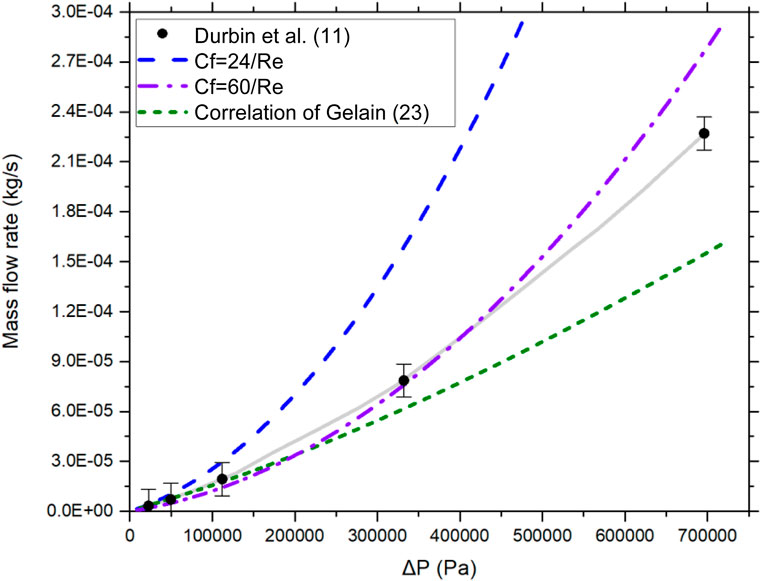
FIGURE 6. Flow rate vs. pressure differential using various friction factor correlations (pre-aerosol measurements).
The following observations can be made from Figure 6:
• A flow rate based on laminar friction factor significantly overestimates the flow rate. It can be stated that the flow is not laminar, despite Reynolds number being less than 2,300.
• The Gelain and Vendel model that captures the laminar to transition region at Re = 5–10 underestimates the flow rate.
• Trials with existing friction factor correlations were unsuccessful to capture the experimental measurements and a new friction factor correlation is needed.
To develop a representative friction factor correlation to capture the fluid flow phenomena in a microchannel, the friction factor vs. Reynolds number as derived from measured data was plotted in Figure 7. It is observed that the friction factor is significantly different than the laminar friction factor indicating a flow regime that is not laminar (either transition or turbulent). A slope change is also evident around Re = 300. Thus, parameter tuning was applied on the friction factor Cf within the model to obtain the best fit because of the complexities of determining flow regimes in microchannels. An empirical correlation was developed that matches the measured friction factor:
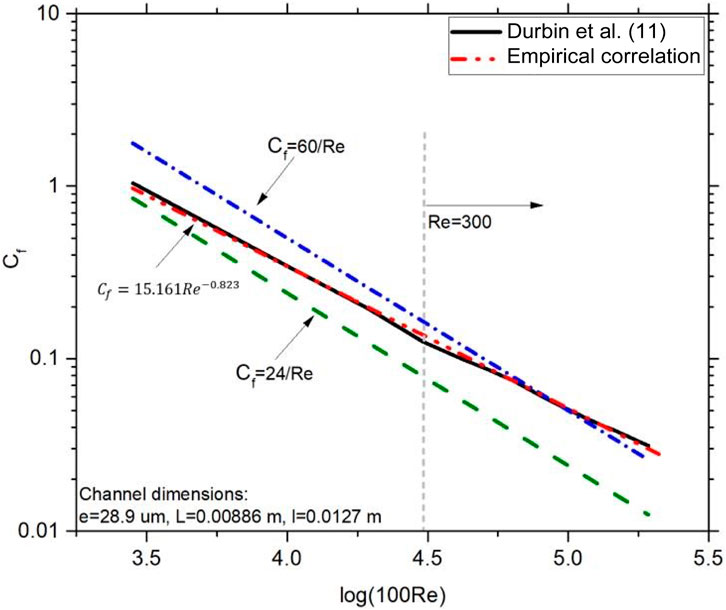
FIGURE 7. Friction factor vs. Reynolds number for pre-aerosol measurements from Durbin et al. (2018) and the present model using empirical friction factor correlations.
The updated flow rate estimates based on the new friction factor are in good agreement with the experimental pre-aerosol measurements.
Aerosol tests in the experimental setup by Durbin et al. involved pressurizing the tank and loading it with a measured amount of aerosols. For modeling the mass flow rate in this scenario, a friction factor was plotted as a function of Reynolds number and an empirical correlation was developed to capture the correct flow regime. Figure 8 shows the friction factor vs. Reynolds number. It can be observed that the slope change occurs at Re = 70 and that the flow cannot be represented using a laminar flow friction factor. The calculated friction factor is:
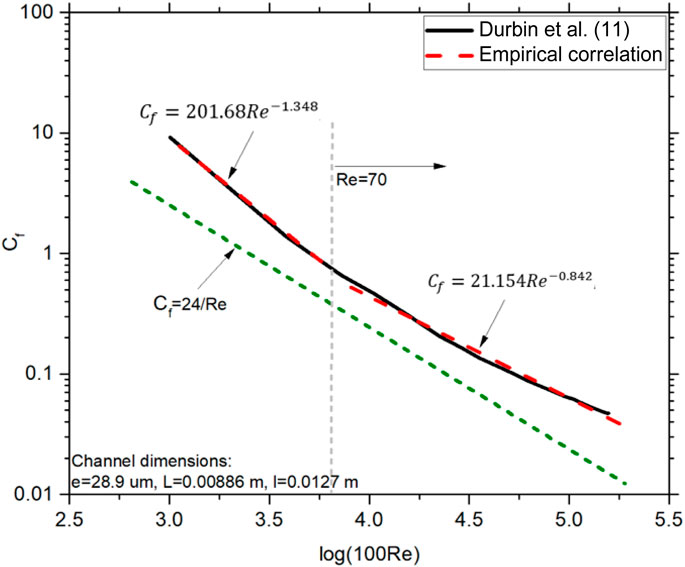
FIGURE 8. Friction factor vs. Reynolds number for aerosol tests from Durbin et al. (2018) and the present model using empirical friction factor correlations.
The results using the updated friction factor are shown in Figure 9. Good agreement is observed with experimental measurements.
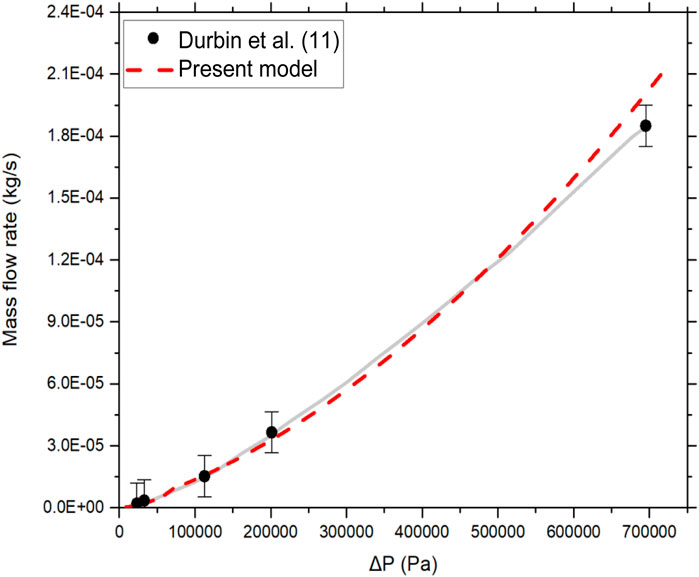
FIGURE 9. Flow rate vs. pressure differential in the aerosol measurements by Durbin et al. (2018) compared to the model predictions.
Using the empirical friction factor correlations mentioned above, the depressurization equation (Eq. 5) was used to predict the mass flow rate over time (Figure 10). Given the simplicity of the depressurization equation, the results are in good agreement with the experimental measurements although the difference appears to be larger as time progresses. This can be partially attributed to the simplifying assumptions that were made during the derivation of the depressurization equation. The deposited mass due to coagulation was modelled with Eq. 1, using a coagulation constant of 2 × 10⁻⁷ cm3/s. The present aerosol model was in good agreement with the experimental measurements and correctly predicted the aerosol concentration within the source container (upstream) due to coagulation as shown in Figure 11.
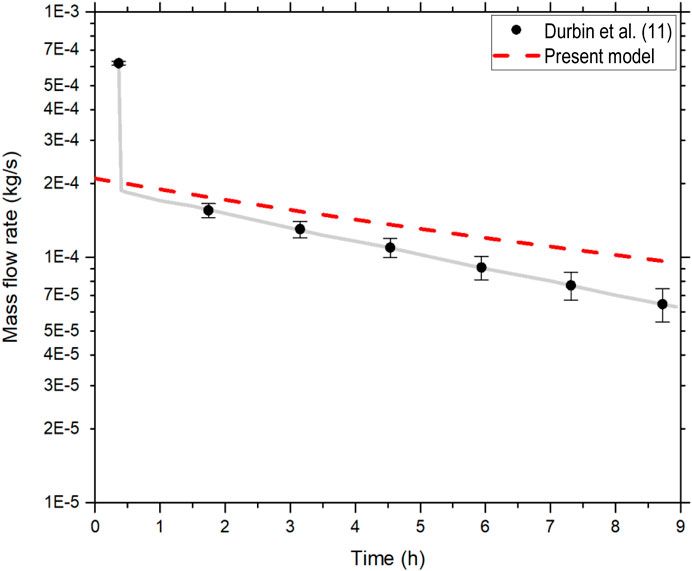
FIGURE 10. Flow rate vs. time during depressurization of the tank from Durbin et al. (2018) compared to the model predictions.
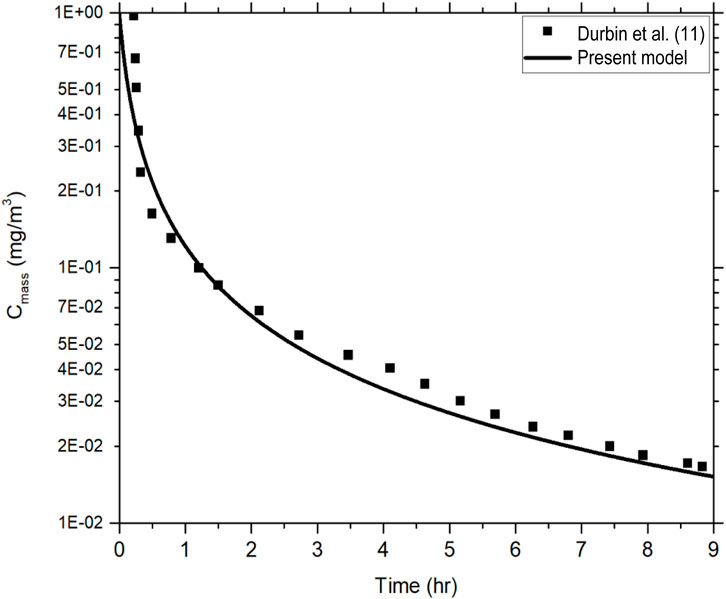
FIGURE 11. Upstream aerosol mass concentration as a function of time from Durbin et al. (2018) compared to the model predictions.
The model was also validated against experiment results from Tian et al. who studied penetration efficiencies of fine aerosol particles (sized <0.3 μm) through capillaries under pressure differences ranging from 60 to 450 kPa (Tian et al., 2017). The capillary bore sizes ranged from 5 to 20 μm and its lengths ranged from 10 mm tο 80 mm respectively. The results showed the aerosol penetration efficiency to decrease significantly with increased capillary length although it was identical for capillaries of different bore sizes. Further, it was also observed that the penetration efficiency correlates strongly with average flow velocity than with the air leakage rate. The present aerosol model was in good agreement with the experimental measurements and correctly predicted the reduction in aerosol concentration as a function of time, within the source container, due to coagulation at a coagulation constant: 2 × 10⁻⁹ cm3/s (Figure 12). It was also found that coagulation was the most dominant mechanism in the early stages of the experiment which can be attributed to the second order nature of coagulation in Eq. 1. After the initial coagulation period, the other two deposition processes, Brownian and gravitational, start to dominate more and more as a result of their first order kinetics nature. However, in this work and given the short-term period of the experimental data only coagulation was used. This approach is confirmed by the good agreement with the experimental measurements and supported by theoretical analysis explained by van de Vate (Mosley et al., 2001). The magnitude of the coagulation constant depends on the particle size and is in agreement with earlier work (Mosley et al., 2001).
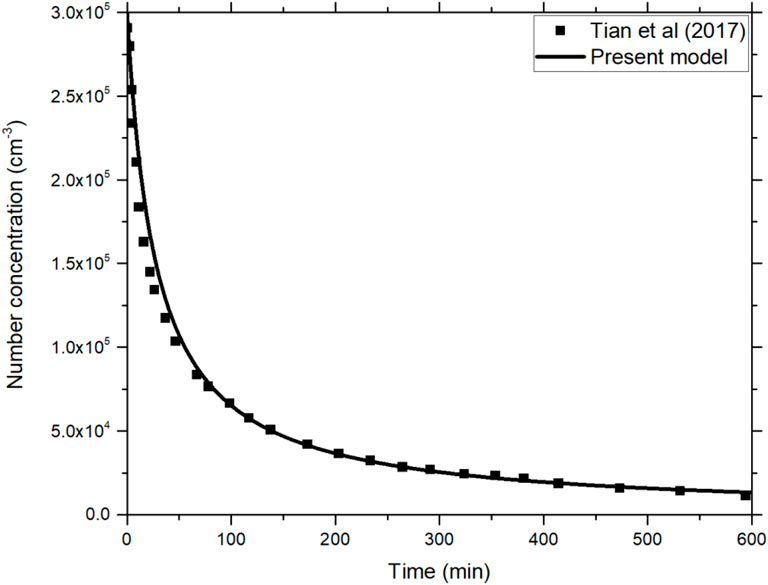
FIGURE 12. Aerosol concentration in the source container at 300 kPa as a function of time observed by Tian et al. (2017) compared to model predictions.
In comparison to the coagulation constant used in the previous section, the difference in magnitude is attributed to the much larger particle size used in the experiments by Durbin et al. Further, the model results accurately capture the behavior of aerosol penetration efficiency for various bore sizes as a function of flow velocities obtained by Tian et al. (Tian et al., 2017) (Figure 13).
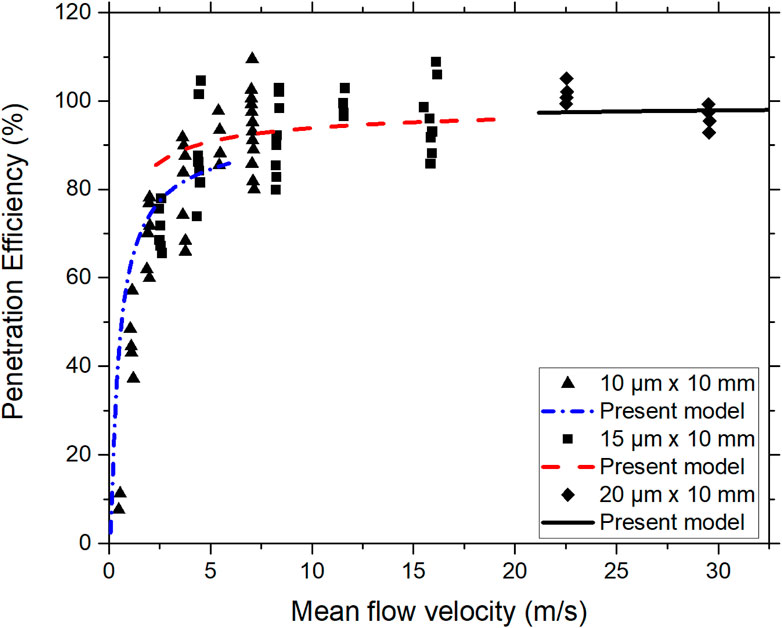
FIGURE 13. Aerosol penetration efficiency vs. average flow velocity in capillaries of various bore sizes obtained by Tian et al. (13) compared with model predictions.
The paper presents a dynamic numerical model developed to predict radioactive aerosol transport and retention through hypothetical stress corrosion cracks in spent nuclear fuel canisters during long-term storage. The model assumes a one-dimensional flow through a hydraulically equivalent leak path and accounts for changing geometry due to plugging from aerosol retention in the cracks. The approach is Eulerian, and it relies on the numerical solution of the aerosol transport equation in one dimension using finite differences. However, it is essential to acknowledge that cracks can exhibit irregular and intricate shapes, thus necessitating a 3D modeling approach to fully understand the flow. As of now, there is no existing 3D model capable of simultaneously simulating gas flow and aerosol deposition within complex crack geometries while encompassing all deposition mechanisms. Within the current scope and constraints, our proposed model addresses this gap by accurately simulating gas flow and aerosol transport while allowing for comparisons between various deposition mechanisms. Our ongoing research efforts are dedicated to expanding the model’s capabilities, particularly to encompass intricate crack geometries, further bridging this critical gap in the field.
A simple GUI platform was also developed to make the model better accessible to stakeholders. Even though the original body of code will be accessible and editable by all users, the GUI will allow those without a strong knowledge of the specifics of the internal code to quickly make changes to inputs and perform estimations without needing to search through the code to edit variable values.
An extensive validation exercise of the model was conducted by comparing predictions to experimental and theoretical data. Previous work (Chatzidakis and Scaglione, 2019b) highlighted the model’s benchmarking efforts for predicting particle penetration and plugging in leak paths under a variety of conditions (particle diameters: 0.01–10 μm and pressure difference up to 12 kPa) from literature (Liu and Nazaroff, 2003; Gelain and Vendel, 2008). Current validation work compares the model predictions against two experiment series (Tian et al., 2017; Durbin et al., 2018), focusing on depressurization (transient state) and aerosol release (summing penetration, retention and coagulation) through crack geometries at various pressure differentials and flow conditions. A phenomenological approach was used to obtain friction factor correlations and model transient flow conditions where laminar to turbulent transition occurs at lower Reynold’s numbers than usual. There was good agreement between the model predictions and the experimental results.
In addition to accurately predicting the aerosol diffusion and blowdown phenomenon, the model is also able to highlight the significant contributions of different deposition mechanisms as a function of particle size and leak path characteristics. This will help improve the accuracy of consequence assessments by providing insight into the expected values of aerosol release through SCC and the physical factors that affect it. Future work is aimed towards expanding the code to model complex crack geometries and include realistic aerosol source terms, as we approach more realistic scenarios.
The original contributions presented in the study are included in the article/supplementary materials, further inquiries can be directed to the corresponding author.
SC, YS, and RM contributed to the conception and overall direction of the study. YS and SC worked on the model and ZD developed the GUI. The SNL experiments were conducted by SD and the validation work was done by SC and ZD. YS wrote the manuscript. All authors contributed to the article and approved the submitted version.
This research was sponsored by the Spent Fuel and Waste Science and Technology Program of the US Department of Energy and was conducted at Oak Ridge National Laboratory under contract DE-AC05-00OR22725 with UT-Battelle, LLC.
The authors would like to thank all collaborators at Sandia National Laboratories, Pacific Northwest National Laboratory and Oak Ridge National Laboratory for their guidance and support to the project and this modelling work. This manuscript has been authored by UT-Battelle, LLC, under contract DE-AC05-00OR22725 with the US Department of Energy (DOE). The US government retains and the publisher, by accepting the article for publication, acknowledges that the US government retains a non-exclusive, paid-up, irrevocable, worldwide license to publish or reproduce the published form of this manuscript, or allow others to do so, for US government purposes. DOE will provide public access to these results of federally sponsored research in accordance with the DOE Public Access Plan (http://energy.gov/downloads/doe-public-access-plan).
The authors declare that the research was conducted in the absence of any commercial or financial relationships that could be construed as a potential conflict of interest.
All claims expressed in this article are solely those of the authors and do not necessarily represent those of their affiliated organizations, or those of the publisher, the editors and the reviewers. Any product that may be evaluated in this article, or claim that may be made by its manufacturer, is not guaranteed or endorsed by the publisher.
Bryan, C. R., and Enos, D. G. (2014). Analysis of dust samples collected from spent nuclear fuel interim storage containers at Hope Creek, Delaware, and Diablo Canyon, California. Available from: https://www.osti.gov/servlets/purl/1174230/ (Accessed January 25, 2023).
Chatzidakis, S. (2018). SCC aerosol transport model summary report. Available from: http://www.osti.gov/servlets/purl/1492159/ (Accessed January 29, 2022).
Chatzidakis, S. (2020). Progress report on model development for the transport of aerosol through microchannels. Available from: https://info.ornl.gov/sites/publications/Files/Pub143085.pdf.
Chatzidakis, S., and Scaglione, J. M. (2019a). “A mechanistic description of aerosol transport and deposition in stress corrosion cracks,” in Proceedings of global/TopFuel 2019 (Seattle, Washington, United States of America: Global Top Fuel), 1033–1039.
Chatzidakis, S., and Scaglione, J. M. (2019b). A phenomenological model for the transport and plugging of aerosol through stress corrosion cracks. Available from: https://www.osti.gov/servlets/purl/1819623/ (Accessed January 29, 2022).
Crowe, C. T. (2005). “Multiphase flow handbook,” in Multiphase flow handbook. Editors C. T. Crowe,, and C. T. Crowe (Boca Raton: CRC Press), 390–447.
Dahm, Z., Sasikumar, Y., Chatzidakis, S., and Montgomery, R. (2022). “A simple user interface for aerosol transport and deposition in spent nuclear fuel dry storage casks,” in International High-Level Radioactive Waste Management Conference Proceedings, Phoenix, AZ, November 13-17, 2022.
Drossinos, Y., and Housiadas, C. (2016). “Aerosol flows,” in Multiphase flow handbook. Editors E E Michaelides, C T Crowe, and J D Schwarzkopf. 2nd Edition (Boca Raton, FL: CRC Press). doi:10.1201/9781315371924
Durbin, S., Pulido, R., Perales, A., Lindgren, E., Jones, P., Mendoza, H., et al. (2021). Continued investigations of respirable release fractions for stress corrosion crack-like geometries. Available from: https://www.osti.gov/servlets/purl/1817839/ (Accessed January 28, 2022).
Durbin, S. G., Lindgren, E. R., and Pulido, R. J. M. (2018). Measurement of particulate retention in microchannel flows. Available from: https://www.osti.gov/servlets/purl/1761926/ (Accessed January 29, 2022).
Enos, D., and Bryan, C. R. (2016). Final report: characterization of canister mockup weld residual stresses. Available at: https://www.osti.gov/servlets/purl/1335756/ (Accessed January 25, 2023).
EPRI (2023). Dry cask storage welded stainless steel canister breach consequence analysis scoping study. Available at: https://www.epri.com/research/products/3002008192 (Accessed January 25, 2023).
Gelain, T., and Vendel, J. (2008). Research works on contamination transfers through cracked concrete walls. Nucl. Eng. Des. 238 (4), 1159–1165. doi:10.1016/j.nucengdes.2007.08.007
Gilkey, L., Brooks, D., Katona, R., Bryan, C., and Schaller, R. (2022). FY22 status update: a probabilistic model for stress corrosion cracking of SNF dry storage canisters. Available from: https://www.osti.gov/servlets/purl/1884916/ (Accessed January 25, 2023).
Hinds Wc, C. W. (1982). Aerosol technology: properties, behavior, and measurement of airborne particles. Available at: https://ui.adsabs.harvard.edu/abs/1982wi.bookQ.H/abstract (Accessed December 16, 2020).
Lewis, S. (1995). Solid particle penetration into enclosures. J. Hazard Mater 43 (3), 195–216. doi:10.1016/0304-3894(95)00037-u
Liu, D. L., and Nazaroff, W. W. (2001). Modeling pollutant penetration across building envelopes. Atmos. Environ. 35 (26), 4451–4462. doi:10.1016/s1352-2310(01)00218-7
Liu, D. L., and Nazaroff, W. W. (2003). Particle penetration through building cracks. Aerosol Sci. Technol. 37 (7), 565–573. doi:10.1080/02786820300927
Mitrakos, D., Chatzidakis, S., Hinis, E. P., Herranz, L. E., Parozzi, F., and Housiadas, C. (2008). A simple mechanistic model for particle penetration and plugging in tubes and cracks. Nucl. Eng. Des. 238 (12), 3370–3378. doi:10.1016/j.nucengdes.2008.07.002
Montgomery, R., Sasikumar, Y., Keever, T., and Kumar, V. (2022). Sister rod destructive examinations (FY20) appendix I: SNF aerosols released during rod fracture. Available from: https://www.osti.gov/servlets/purl/1864438/ (Accessed May 16, 2022).
Mosley, R. B., Greenwell, D. J., Sparks, L. E., Guo, Z., Tucker, W. G., Fortmann, R., et al. (2001). Penetration of ambient fine particles into the indoor environment. Aerosol Sci. Technol. 34 (1), 127–136. doi:10.1080/02786820117449
NRC Library (2014). Spent fuel transportation risk assessment – final report (NUREG-2125) | NRC.gov. Available at: https://www.nrc.gov/reading-rm/doc-collections/nuregs/staff/sr2125/index.html (Accessed May 16, 2022).
NUREG/CR-7030 (2010). Atmospheric stress corrosion cracking susceptibility of welded and unwelded 304, 304L, and 316L austenitic stainless steels commonly used for dry cask storage containers exposed to marine environments (NUREG/CR-7030). Available at: www.ntis.gov (Accessed January 25, 2023).
Shah, R. K., and London, A. L. (1978). Laminar flow forced convection in ducts. Elsevier. Available from: https://linkinghub.elsevier.com/retrieve/pii/C2013006152X (Accessed December 15, 2023).
Tian, M., Gao, H., Han, X., Wang, Y., and Zou, R. (2017). Experimental study on the penetration efficiency of fine aerosols in thin capillaries. J. Aerosol Sci. 111, 26–35. doi:10.1016/j.jaerosci.2017.06.001
U.S.NRC (2021). Managing aging processes in storage (MAPS) report: final report (NUREG-2214). Available at: https://www.nrc.gov/reading-rm/doc-collections/nuregs/staff/sr2214/index.html (Accessed January 25, 2023).
Wells, A. C., and Chamberlain, A. C. (1967). Transport of small particles to vertical surfaces. Br. J. Appl. Phys. 18 (12), 1793–1799. doi:10.1088/0508-3443/18/12/317
Keywords: spent fuel storage, aerosol transport modelling, spent fuel aerosols, spent fuel disposal, predicting aerosol release through Stress Corrosion Cracks
Citation: Sasikumar Y, Chatzidakis S, Dahm Z, Durbin SG and Montgomery R (2024) Assessing the release, transport, and retention of radioactive aerosols from hypothetical breaches in spent fuel storage canisters. Front. Energy Res. 12:1229025. doi: 10.3389/fenrg.2024.1229025
Received: 25 May 2023; Accepted: 11 January 2024;
Published: 15 February 2024.
Edited by:
Shoaib Usman, Missouri University of Science and Technology, United StatesReviewed by:
Yacine Addad, Khalifa University, United Arab EmiratesCopyright © 2024 Sasikumar, Chatzidakis, Dahm, Durbin and Montgomery. This is an open-access article distributed under the terms of the Creative Commons Attribution License (CC BY). The use, distribution or reproduction in other forums is permitted, provided the original author(s) and the copyright owner(s) are credited and that the original publication in this journal is cited, in accordance with accepted academic practice. No use, distribution or reproduction is permitted which does not comply with these terms.
*Correspondence: Yadukrishnan Sasikumar, c2FzaWt1bWFyeUBvcm5sLmdvdg==
Disclaimer: All claims expressed in this article are solely those of the authors and do not necessarily represent those of their affiliated organizations, or those of the publisher, the editors and the reviewers. Any product that may be evaluated in this article or claim that may be made by its manufacturer is not guaranteed or endorsed by the publisher.
Research integrity at Frontiers
Learn more about the work of our research integrity team to safeguard the quality of each article we publish.