 Chang Wang
 Cheng Yin1
- 1School of Geosciences and Technology, Southwest Petroleum University, Chengdu, China
- 2Shale Gas Research Institute, Petrochina Southwest Oil and Gasfield Company, Chengdu, China
- 3Shale Gas Evaluation and Exploitation Key Laboratory of Sichuan Province, Chengdu, China
The exploration and development potential of shale gas reservoirs in the Sichuan Basin is enormous; however, it also faces difficulties such as complex structures, strong heterogeneity, and unclear geophysical response characteristics. Fine prediction of geostress is an important part of shale gas exploration and development, which directly affects the implementation effect of reservoir evaluation, well trajectory design, and fracture reconstruction. The existing geostress prediction techniques lack high-precision seismic data constraints, making it difficult to accurately reflect the planar distribution characteristics of geostress in the block with rapid changes in complex tectonic zones. At the same time, the geophysical response characteristics of geostress in the Sichuan Basin are unknown, and the geostress seismic prediction technology lacks theoretical basis. This paper combines numerical simulation and physical experiments and defines the characteristics of the geophysical response of shale gas reservoirs in the Sichuan Basin changing with the stress field, and technical countermeasures for geostress seismic prediction have been established to provide technical means for accurate prediction of the geostress field in the shale gas block. Based on the geostress sensitive parameters obtained from prestack seismic inversion, the geostress field prediction of a shale gas work area in the Sichuan Basin is realized.
1 Introduction
For geostress, many theories, methods, and applications are still in the exploratory stage (Yang et al., 2013; Song et al., 2017; Song et al., 2020; Liu et al., 2023). Geostress is a key factor affecting shale hydraulic fracturing design (Huang et al., 2019; Zheng et al., 2022; Huang et al., 2023a; He et al., 2023; Tan et al., 2023). Meanwhile, understanding geostress is a prerequisite for successful development of shale gas (Tan et al., 2017; Luo et al., 2022; Zhang et al., 2022; Huang et al., 2023b). The predecessors have carried out in-depth research on geostress logging calculation, geostress numerical simulation, and geostress seismic prediction methods and obtained a series of achievements (Karadeniz, 2019; Wu et al., 2023). However, due to various factors, it is difficult to make a major breakthrough in geophysical response characteristics and geostress seismic prediction methods under the condition of a natural fracture geostress-coupling medium.
First, the deep shale gas area in the southern Sichuan Basin is subject to multi-stage tectonic evolution, and the geostress changes rapidly (Craig, 2014; Huang et al., 2017). This study area mainly develops northeast structural groups, and small faults are developed in synclines between structures, with complex geological conditions. The geostress changes between different structural units are complex. The existing geostress prediction technology is mainly based on the theory of geomechanics and is obtained by finite element simulation using the calculation results of single-well geostress. This technology does not fully consider the lateral variation characteristics of the reservoir and lacks planar data constraints, resulting in low prediction accuracy between larger well spacing (Schoenball and Ellsworth, 2017; Wang et al., 2022). Seismic waves contain the stress and strain characteristics of reservoirs. Combining the advantages of seismic lateral resolution, starting from the constitutive equation of the reservoir, the geostress field seismic topological relationship is established to form a set of geostress prediction methods based on seismic data.
Second, the geophysical response of deep shale reservoirs in southern Sichuan to geostress is unclear. The underground structure and stress are key factors affecting the seismic anisotropy of shale reservoirs (Xu et al., 2019). Deep shale reservoirs have complex geological stresses, natural fractures are developed, and the geophysical response under the coupling conditions of geological stress field and natural fractures is unclear (Ji et al., 2015; Huang et al., 2018; Huang et al., 2022; Song et al., 2022). Therefore, it is considered to establish a deep shale reservoir structure stress equivalent model; explore the acoustic expression patterns of rock masses under different fault levels, fault properties, and stress conditions; clarify the seismic azimuth anisotropy response characteristics under natural fracture geostress coupling conditions; and provide theoretical support for geostress azimuth prediction.
Third, the seismic prediction technology of geostress in a deep shale reservoir is immature. The magnitude and orientation of geostress are the main factors for predicting the geostress field (Hayavi and Abdideh, 2016). The geostress azimuth prediction technology based on wide-azimuth seismic data is immature, and the seismic prediction technology for geostress size has not fully considered the reservoir heterogeneity, making the prediction accuracy low. Therefore, based on experimental research results, we will conduct research on seismic anisotropy characteristics based on wide-azimuth seismic data, clarify the dominant orientation of anisotropy, and achieve the prediction of geostress orientation. In terms of the magnitude of geostress, a rock physical model containing saturated fluid and fractured media is constructed based on linear sliding theory, and a prestack seismic inversion objective function based on anisotropy is constructed. By deriving the constitutive equation, the transformation from elastic waves to geostress magnitude is achieved.
Accurate prediction of geostress field is an internationally recognized problem in the industry today, but it is also an urgent problem in the field of shale gas exploration and development (Huang et al., 2020; Detournay et al., 2022; Dontsov, 2022; Zhang et al., 2023). This paper has confirmed the seismic wave response characteristics of deep shale reservoirs in southern Sichuan under the condition of natural fracture and geostress coupling, established the identification mode of deep shale reservoir geostress geophysical response, and integrated anisotropic petrophysical modeling, prestack seismic inversion, prestack seismic attribute, and other technical means to realize the seismic prediction technical method of deep shale reservoir geostress in southern Sichuan, which is of great significance to support the rapid and beneficial production of deep shale gas.
2 Physical model test of geophysical response to deep shale reservoir geostress
2.1 Preparation of core samples
The test pieces for rock mechanic parameter testing are obtained from surface outcrops and underground cores. According to the ISRM standard, each specimen is processed into a standard small cylinder with a diameter of 25 mm and a length of 50 mm, as shown in Figure 1, and the parallelism of the upper and lower end faces is controlled to be less than 0.01 mm.
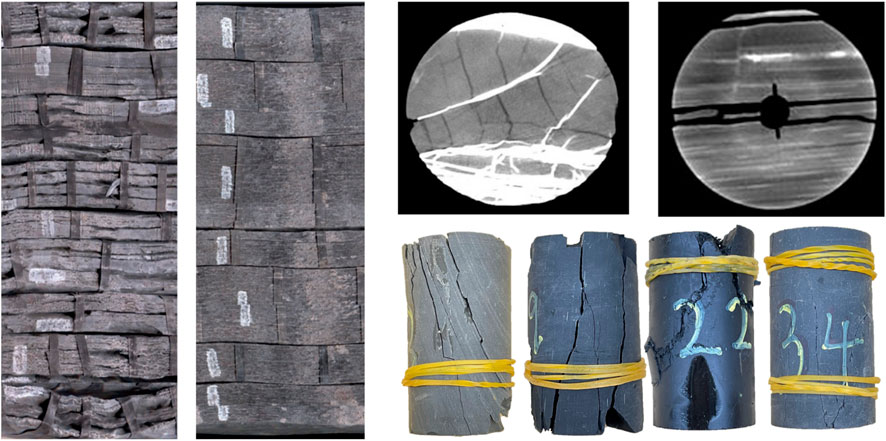
FIGURE 1. Field outcrop preparation core and underground core.
Since shale often presents a certain degree of anisotropy under the compaction of perennial geological structures when it is formed, to have a more complete understanding of the mechanical properties of this batch of outcrops, with a bedding plane as a reference, we will drill cores from shales at different angles and test shale samples drilled from the same angle by applying different confining pressure values to observe the changes of shale strength of material parameters.
The test results of rock mechanics behavior in the outcrop are shown on the left side of Figure 2, and the rock cores are shown on the right side. There is less difference in the rock mechanics behavior between the rock sample of the proposed crop model specimen and the deep shale rock sample under different confining pressures, and the selected outcrop has good representativeness.
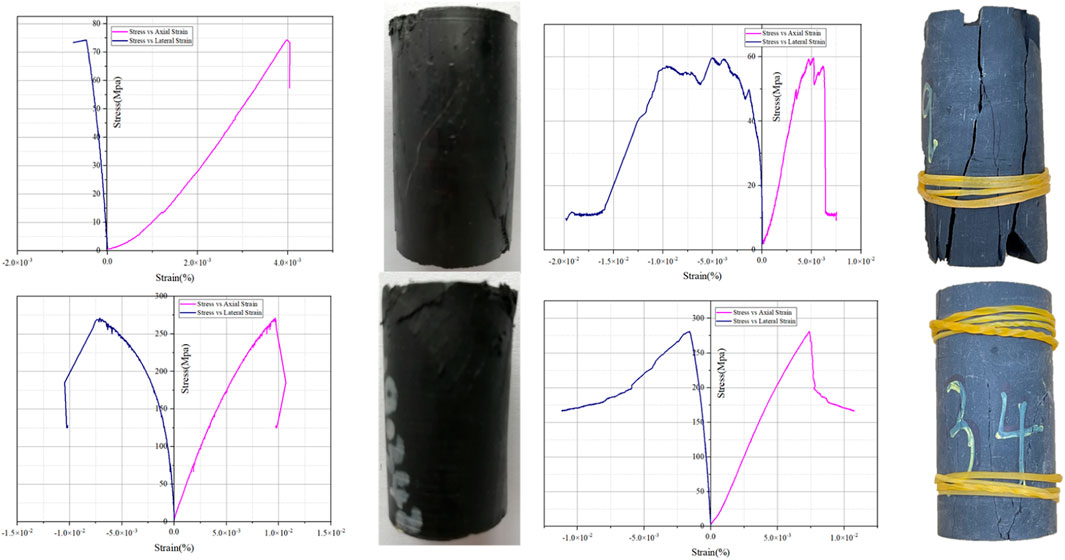
FIGURE 2. Stress–strain curve based on triaxial stress testing. Outdoor outcrop (left) and underground core (right).
2.2 Preparation of shale models containing faults
For the geological body model containing faults, we used field shale as the basic material, cut at different angles, and used cement slurry materials with different lime sand ratios as the filling material for simulating faults. After being formed by casting and curing, we will reform physical model for geophysical testing, as shown in Figure 3. A fracturing physical model test plan was constructed under different stresses, fault dip angles, and filling materials, and the parameters of those model are shown as Table 1.

FIGURE 3. Production of shale rock samples containing filled faults after molding.
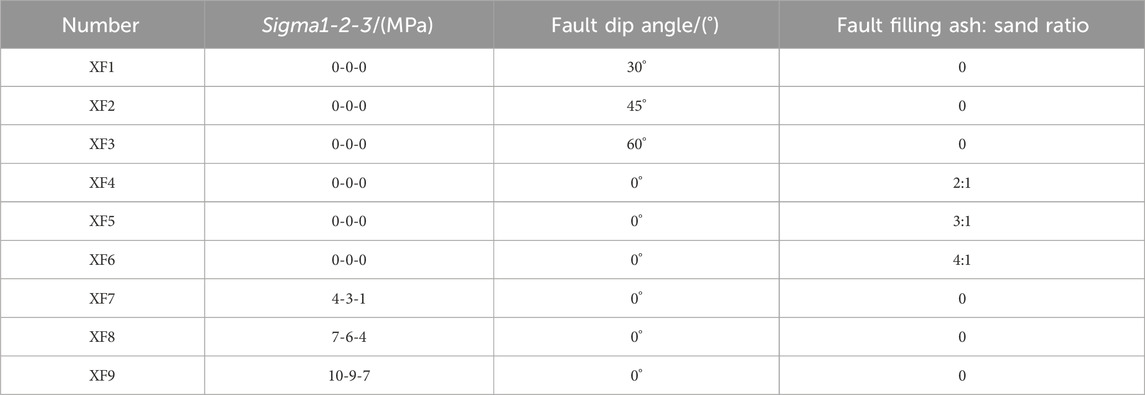
TABLE 1. Physical model test plans under different stresses, fault dip angles, and different filling materials.
2.3 Experimental methods
Experimental schemes for P-wave anisotropy were constructed under different stresses, fault dip angles, and filling materials, as shown in Figure 4 and Figure 5. Active source probes and several passive acquisition probes are arranged on both sides of the cube specimen, when considering both sides of the fault. The receiving probes are arranged in a fixed grid array, and their positions are sequentially changed. The amplifier and acoustic acquisition system are connected, and the active source probe is activated to emit excitation waves. The acoustic response of the receiving acquisition probe at each position is observed.
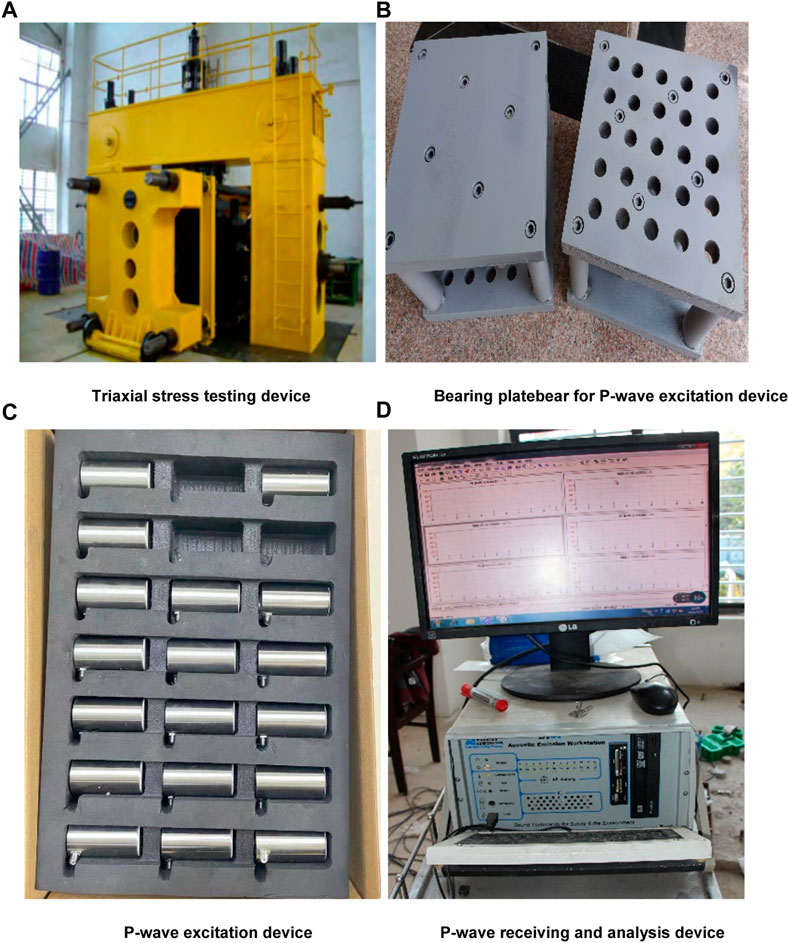
FIGURE 4. Comprehensive device for detecting the anisotropy of P-waves under three-dimensional stress (A) Triaxial stress testing device (B) Bearing platebear for P-wave excitation device (C) P-wave excitation device (D) P wave receiving and analysis device.
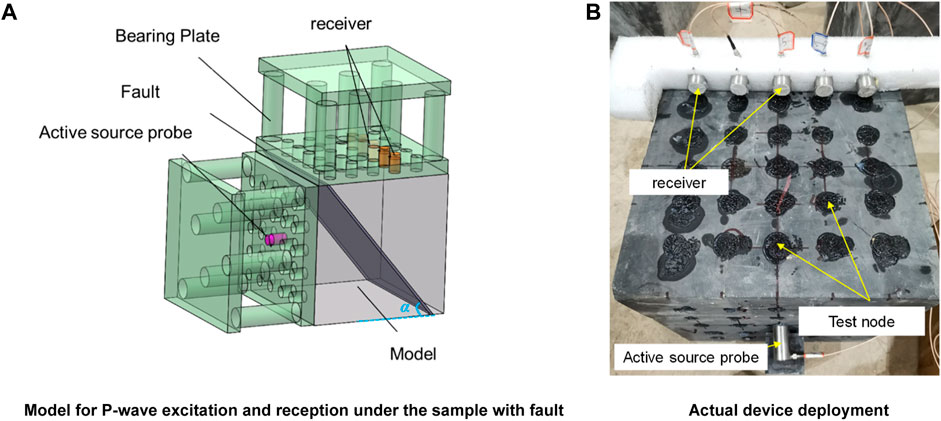
FIGURE 5. Acoustic testing model for rock samples containing faults.
The data collection scheme adopts a multi-point excitation, multi-point reception, and extraction scheme. In order to improve the coverage frequency, wide-azimuth transmission reception is adopted. After theoretical wavelet excitation, amplitude compensation and consistency processing are carried out on the collected data to ensure uniform energy of each receiving channel. Environmental noise and high-frequency random noise are suppressed, and the K-means algorithm is used to extract the first arrival of P-waves, as shown in Figure 6.
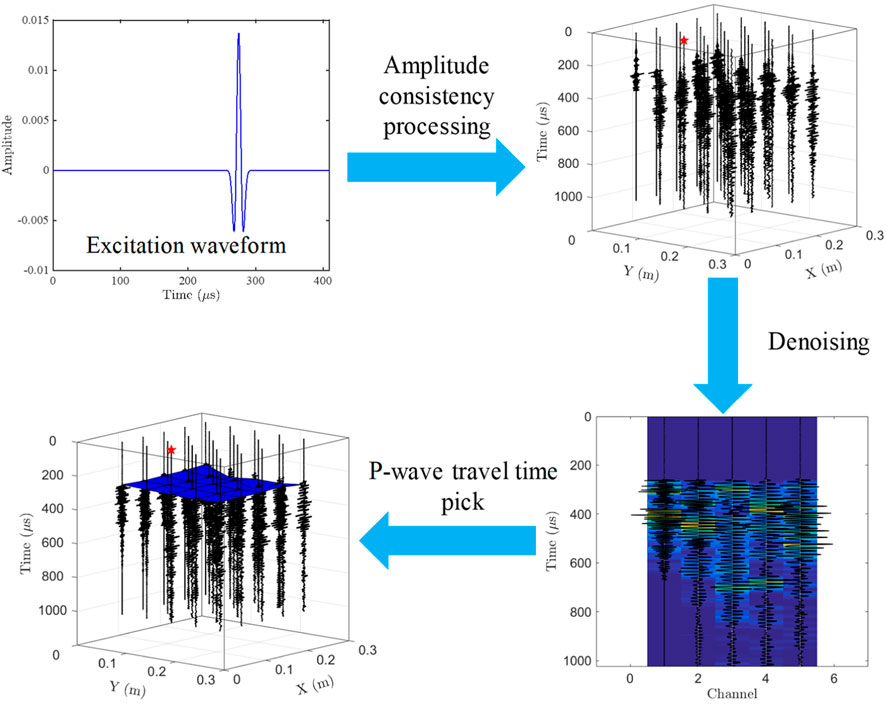
FIGURE 6. Method of P-wave travel time extraction.
As observed from the experimental data, as the dip angle of the fault increases, the receiving velocity first decreases and then increases; as the density and stress of the filling material increase, the receiving speed increases, the detailed results of which are shown in Table 2.
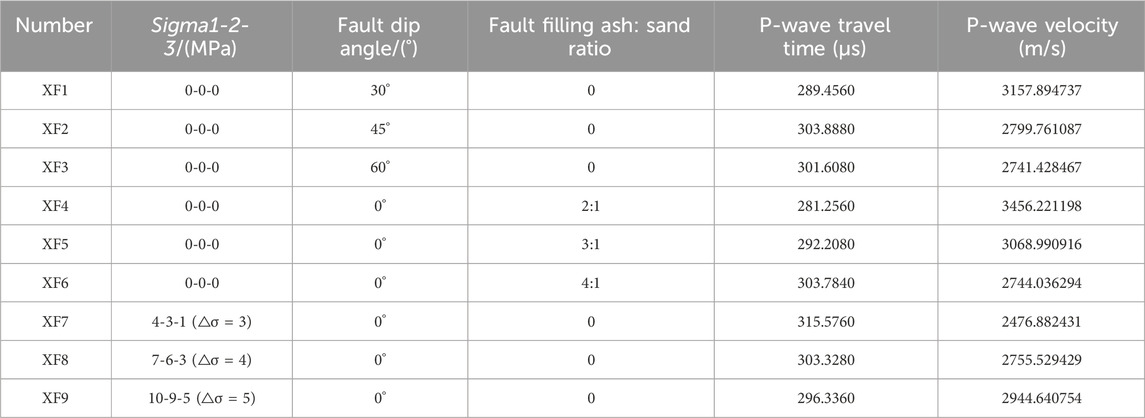
TABLE 2. P-wave travel time extraction results under different stresses, fault dip angles, and filling materials.
After a series of AVAZ seismic data processing techniques such as bandpass filtering, channel equalization, and partial stacking, azimuth geophysical data are obtained. After extracting and analyzing the amplitude of the first arrival seismic wave data, the transmitted wave AVAZ response of the acoustic experiment under different stress states was obtained. The amplitude energy of the first arrival wave was extracted to obtain the projected wave AVAZ response, as shown in Figure 7. Subtracting the energy of isotropic transmitted waves (0 directional projected wave energy) yields the anisotropic transmitted energy, as shown in Figure 8. By comparison, it can be found that when the vertical principal stress is fixed, the AVAZ response of the transmitted wave gradually decreases with the increase in the geostress difference; with the decrease in the geostress difference, the transmitted wave AVAZ response gradually increases, indicating that the P-wave velocity exhibits anisotropic characteristics under different stress conditions, laying the foundation for subsequent research.
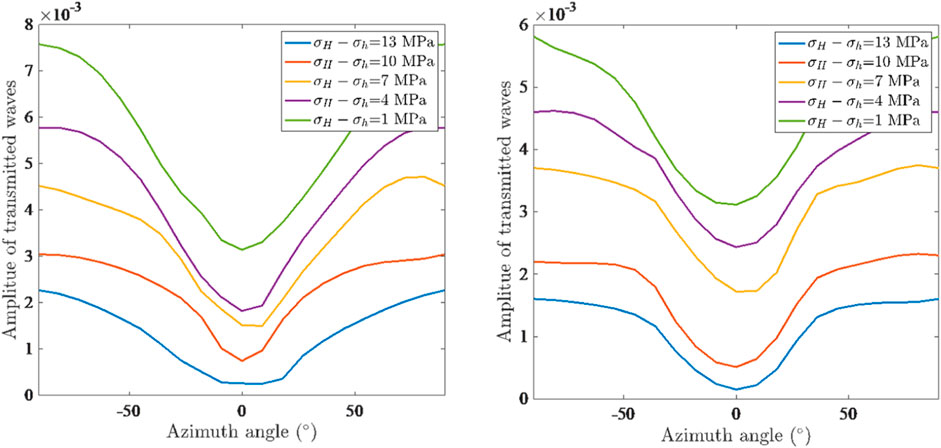
FIGURE 7. AVAZ response of the P-wave under different stresses.
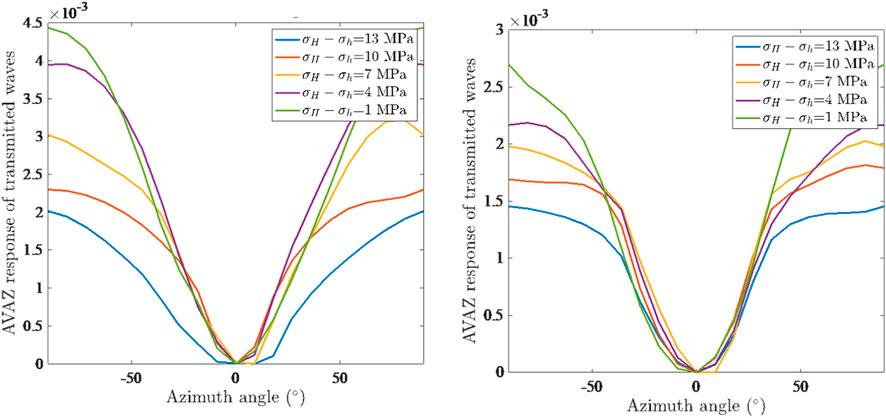
FIGURE 8. Anisotropic AVAZ response of the P-wave under different stresses.
The geostress orientation is fixed, the transmission wave AVAZ feature detection of different strike fault models is carried out, and the influence of the geostress orientation on the seismic wave AVAZ feature is studied, as shown in Figure 9. By using the rose plot for transmitted wave amplitude, the AVAZ characteristics of transmitted waves have been found to have good consistency with the fault strike. When faults or fractures have already been formed, applying principal stress from other azimuths has a very little impact on seismic AVAZ, and it is difficult to observe the effect of stress orientation on seismic AVAZ through experiments. The rose plot direction is basically consistent with the fault orientation.
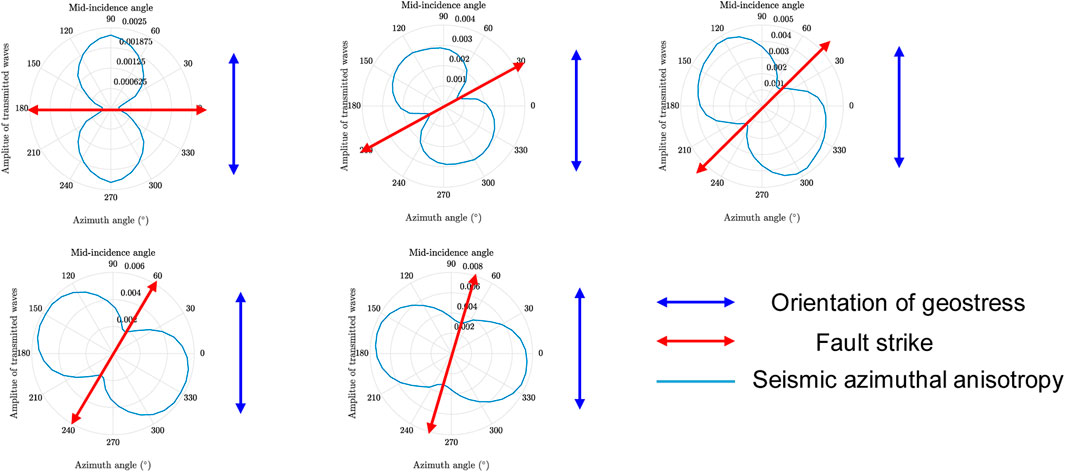
FIGURE 9. Rose plot of the relationship between seismic azimuth anisotropy and geostress orientation.
3 Numerical simulation of geophysical response to deep shale reservoir geostress
3.1 Analysis of the influence of geostress on the elastic parameters of shale reservoirs
For deep fractured shale, the in situ geological conditions of high temperature and pressure have put forward higher requirements for shale exploration and fracture development (Zhang et al., 2022). Therefore, after completing the establishment of the rock physical model of shale, it is necessary to consider the influence of pressure on elastic parameters and then study the influence of pressure on the geophysical response. David and Zimmerman proposed the DZ model in 2012 to study the variation of rock stiffness parameters with pressure. In rock media without fractures, the equivalent bulk modulus and equivalent shear modulus obey the following expressions:
where
Based on the linear sliding theory of Schoenberg and Sayers (1995), the equivalent flexibility tensor S of fractured reservoirs is approximately equivalent to the sum of the flexibility tensor of the background media without fractures and the fracture disturbance flexibility tensor as follows:
The variation of the flexibility coefficient of the background medium with pressure and the variation of the fracture flexibility coefficient with pressure can be calculated separately, ultimately obtaining the stiffness coefficient of fractured shale under different pressures. Figure 7 shows the pressure-dependent curves of C33 and C55 parameters of the background medium obtained using the DZ model, where the stiffness coefficients C33 and C55 are important parameters in the VTI medium:
where
We explore the variation law of the stiffness coefficient based on the influence of pressure on velocity anisotropy. C33 and C55 will continue to increase with increasing pressure. At the beginning of applying of stress, the stiffness coefficient will rapidly increase with the increase of pressure, and when the pressure increases to a certain threshold value, it will increase extremely slowly until the limit state, and the results are shown in Figure 10.
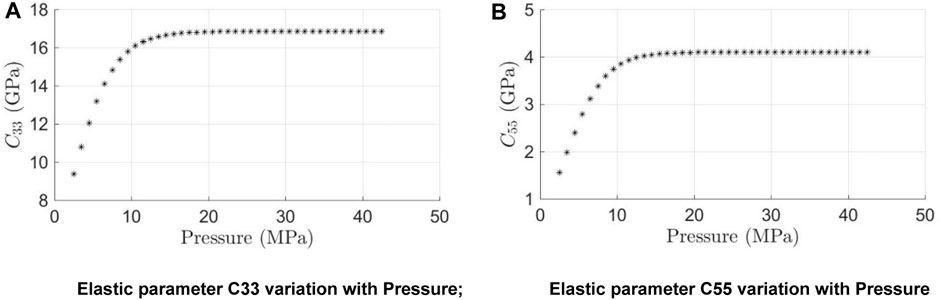
FIGURE 10. Elastic parameters of fractured shale background medium and their variation characteristics with pressure.
Similarly, the variation of fracture flexibility parameters with stress can be obtained. The fracture flexibility parameter represents the elastic parameter of the compressibility of the fracture, and the smaller its value, the smaller the transverse-to-longitudinal ratio of the fracture, which is close to the compacted state. From Figure 11, it can be observed that as the stress increases,
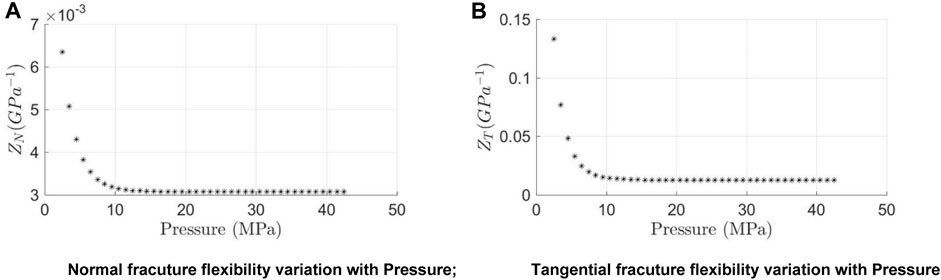
FIGURE 11. Variation characteristics of fracture flexibility with varying pressure.
By using the fracture flexibility parameter, we can convert the distribution of geostress and provide a guarantee for the application of stress in subsequent experiments. The relationship between the maximum horizontal principal stress and the minimum horizontal principal stress is shown in Figure 12, while ensuring that the rock maintains its current fracturing condition.
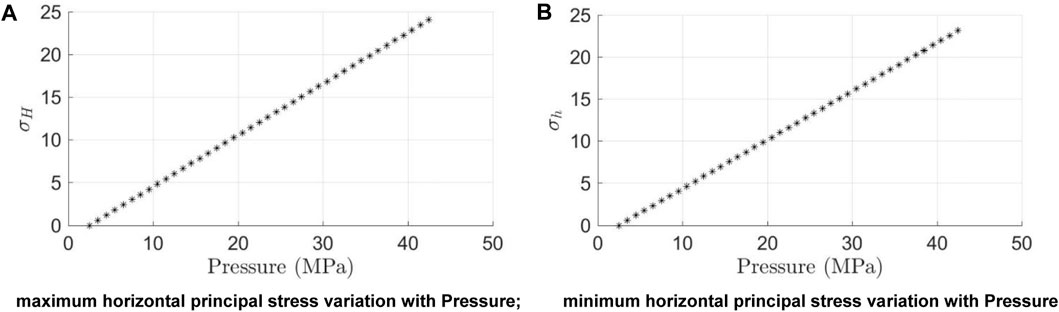
FIGURE 12. Variation characteristics of maximum and minimum horizontal principal stresses with varying pressure.
Through calculation, it can be obtained that the maximum and minimum horizontal principal stresses will basically increase with the increase of stress, and the relationship is close to linear growth. The differential horizontal stress ratio (DHSR) obtained using geostress is an important brittleness index indicating fracturing, and its expression is as follows:
The DHSR is not related to
Figure 13 shows the variation of DHSR parameters with pressure, and it can be observed that shale gradually increases the difficulty of fracturing with increasing pressure, mainly controlled by the compaction degree of the background medium. However, the presence of fractures can effectively improve the effectiveness of fracturing, so, theoretically, accurate prediction of fractures can provide a very good indicator for fracturing.
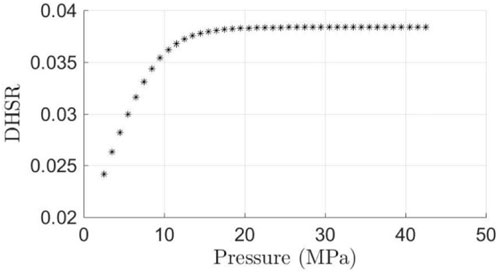
FIGURE 13. Characteristics of changes in the DHSR under pressure.
3.2 Geophysics response simulation of geostress in shale reservoirs
Based on the previous rock physics modeling, we can obtain the stiffness coefficient and density of the deep fractured shale rock physics model. When we set this stratum as the underlying stratum, we can obtain the geophysics response of the reflection interface through the above formula by changing the different upper media. Here, we define the overlying strata as isotropic sandstone and non-fractured shale and discuss them separately.
3.2.1 The overlying strata are sandstone
According to the perturbation principle, seismic wave propagates in weakly anisotropic media, and the reflection coefficient can be expressed as an isotropic part and anisotropic perturbation part.
The isotropic part can be expressed using the Zoeppritz formula or Aki–Richard formula as follows:
The anisotropic part can be expressed as follows:
Among them,
The influence of different fracture azimuth angles on AVAZ data is shown in Figure 14, in which the blue line represents the seismic AVAZ. It can be found that the AVAZ rose plot can be used to determine the orientation of faults and fractures.
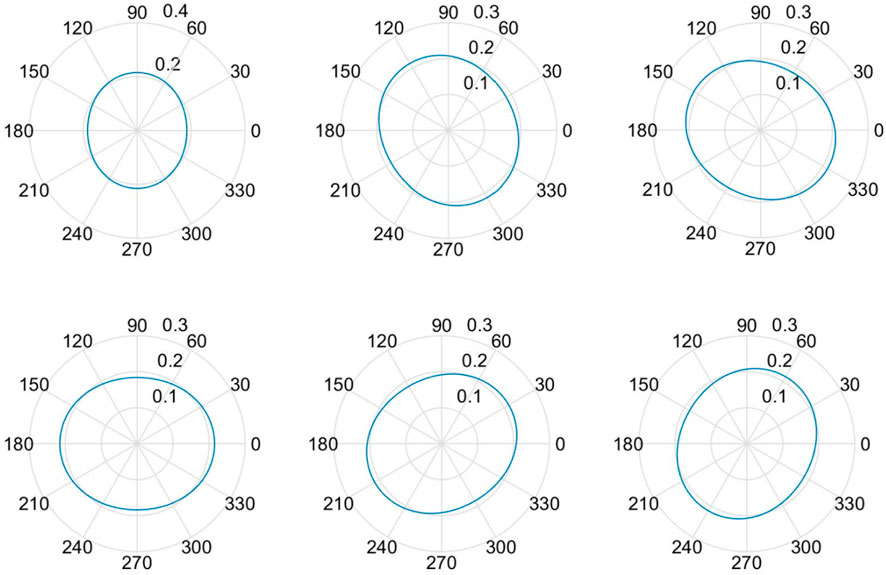
FIGURE 14. Influence of fracture azimuth on seismic AVAZ.
3.2.2 The overlying strata are non-fractured shale
When the overlying strata are non-fractured shale, the reflection coefficient is expressed as follows:
The anisotropic part of VTI can be expressed using Graebner’s exact formulation or Ruger’s approximate formula:
The anisotropic part can be expressed as follows:
Here, we assume that both the overlying and underlying strata are shale with consistent backgrounds, except for the development of fractures in the lower layer. Therefore, through formula derivation and numerical simulation, the variation of reflection coefficient Rpp with incident angle and azimuth angle can be obtained. Because the background is completely consistent, the difference is mainly reflected in the anisotropic perturbation part.
We compare the changes in reflection coefficients with incident angle and azimuth angle under different pressure states, as shown in Figure 15. Through comparison, it was found that fracture parameters can affect the variation of seismic amplitude with the incident angle and azimuth angle. Therefore, in conventional seismic exploration, directional anisotropy difference data can be used to extract fracture parameters, such as fracture strength and anisotropy parameters. Then, the obtained anisotropic parameters are brought into the conventional AVA/AVO inversion algorithm to obtain conventional linear elasticity parameters, such as Young’s modulus and Poisson’s ratio, to characterize the reservoir brittleness.
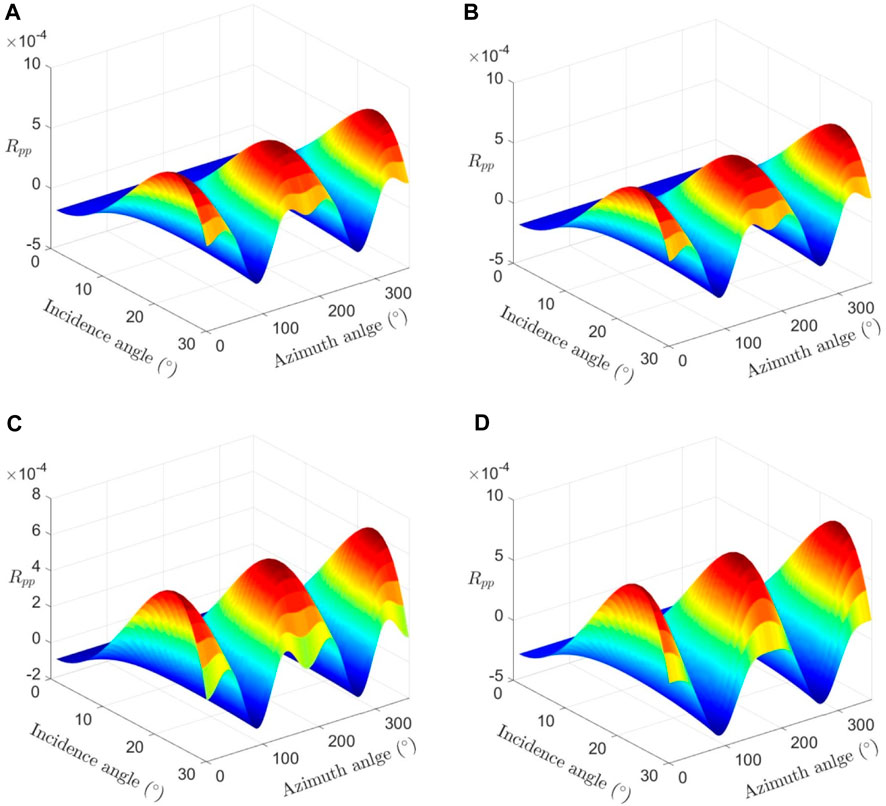
FIGURE 15. Variation of the seismic reflection coefficient with incident angle and azimuth under different stress conditions: (A) 0 MPa, (B) 10 MPa, (C) 20 MPa, and (D) 30 MPa.
When the azimuth or incidence angle is fixed, the influence of seismic wave amplitude on the incidence angle and formation pressure can be studied, as shown in Figure 15. It can be observed that the reflection coefficient changes with changes in pressure. During the initial process of applying of pressure, the elastic parameters of the rock will undergo significant changes, resulting in significant changes in the geophysical response; when the pressure is applied to a certain extent, the changes of linear elasticity parameters reach a certain threshold value and are in a relatively balanced state.
Overall, the influence of stress on seismic reflection coefficients is relatively small, and the main contribution is reflected in the anisotropic part.
As observed from the numerical simulation results of step-by-step pressurization, the seismic reflection coefficient changes significantly when the stress difference is less than 20 MPa, and the seismic reflection coefficient is sensitive to the change of stress difference, which verifies the reliability and effectiveness of seismic prediction of geostress, as shown in Figure 16.
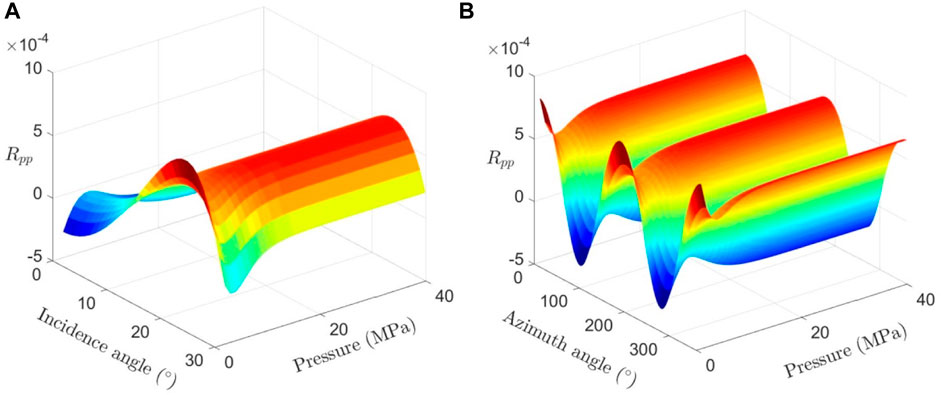
FIGURE 16. (A) Variation of the seismic reflection coefficient with stress and incident angle; (B) variation of the seismic reflection coefficient with stress and azimuth angles.
4 Research on prediction technology of geostress based on azimuth anisotropy inversion
Thomson (1986) proposed Thomson weak anisotropy parameters to obtain the seismic reflection coefficient in anisotropy media. Gary (2013) established the relationship between Thomson weak anisotropy parameters with the geostress sensitive parameter DHSR to describe the favorable areas for shale gas reservoir fracturing, as shown in Figure 17. Because the DHSR cannot be obtained by well logging directly, we consider the mineral components, pores and fracture, and fluid characteristics of shale gas reservoirs in the Sichuan Basin to establish the rock physical model to estimate the Thomson weak anisotropy parameter and the workflow of rock physical modeling.
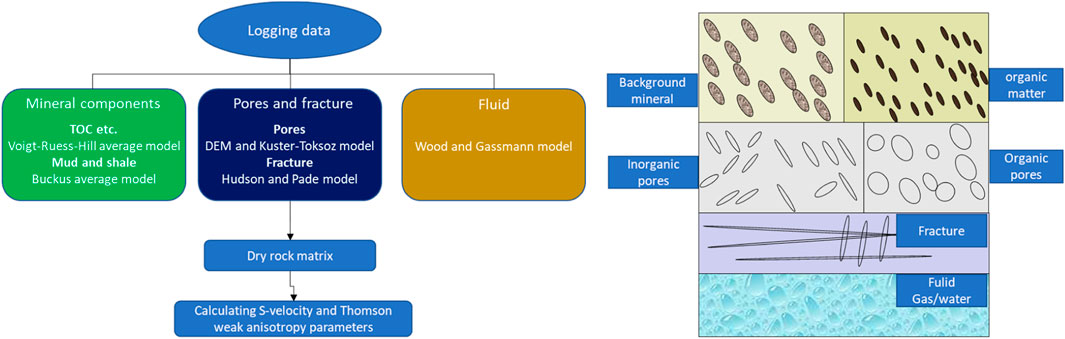
FIGURE 17. Rock physical modeling for Thomson weak anisotropy parameters.
Estimation of Thomson weak anisotropy parameters based on the rock physics model: the calculation results of longitudinal and shear waves are highly consistent with logging data, and the estimation of anisotropic parameters is reliable, as shown in Figure 18.
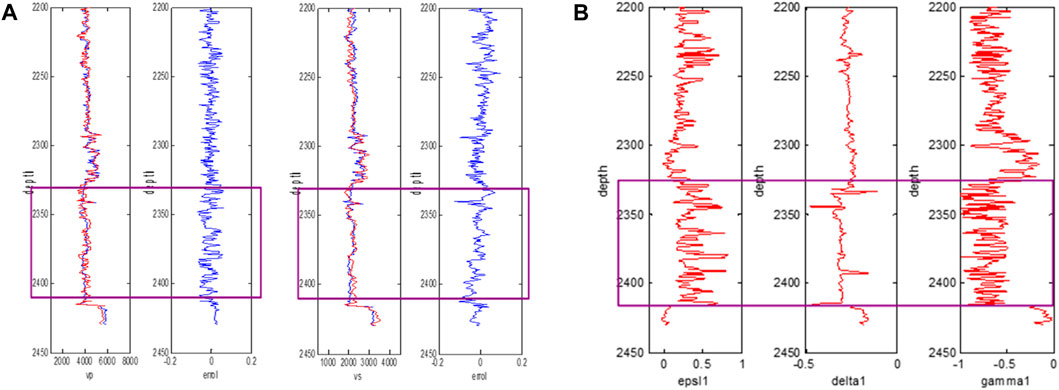
FIGURE 18. (A) Comparison between predicted Vp and Vs with actual well logging data; (B) calculation of Thomson weak anisotropy parameters by well logging data.
Ruger (1997) provided the reflection coefficient equation based on first-order perturbation theory, with the specific form as follows:
where
According to Connolly (1999) and Martin (2001), the above equation is transformed into an azimuthal anisotropic elastic impedance form:
In the above formula, the six coefficients that form a trigonometric functions relationship with azimuth and incident angles are expressed as follows:
By using the formula of azimuthal anisotropic elastic impedance for predicting geostress, the impedance value of azimuthal elastic impedance is shown to often decrease sharply with the change of the incident angle, which is not conducive to the analysis of geostress changes. Normalization of azimuthal anisotropic elastic impedance is performed to obtain the normalized elastic impedance form:
To obtain six anisotropic elastic parameters, six elastic resistance antibodies with different orientations and incidence angles are required. Substituting multiple azimuth and multiple incidence angles into the above equation, we obtain the following equation system:
Based on the regression calculation of the elastic impedance of the well bypass and logging data, the coefficient matrix is obtained. By multiplying the data for inverted elastic impedance from different angles at each sampling point by the inverse of the coefficient matrix, the anisotropic elastic parameters at each point can be obtained. According to the wide-azimuth seismic inversion technology, necessary parameters can be obtained, which can then be used to calculate the DHSR.
Figure 19 shows the DHSR prediction results of a shale gas work area in the Sichuan Basin. The prediction results are highly consistent with the core test results, verifying the effectiveness of the method. This achievement has been successfully applied to the shale gas well location deployment and fracturing scheme design in the work area, realizing the fine evaluation of the “sweet spot” of the project.
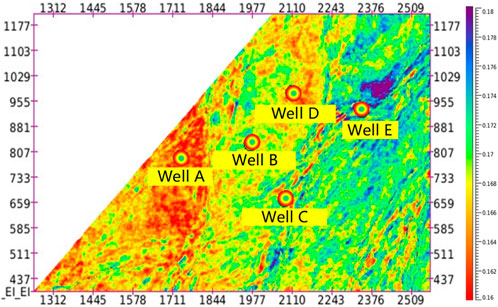
FIGURE 19. DHSR prediction plan of a shale gas work area in the Sichuan Basin.
5 Conclusion
Under the condition of horizontal two-way geostress clamping in a faultless geological body, the propagation speed of longitudinal wave velocity along the maximum horizontal principal stress direction is the highest. For a stress difference less than 20 MPa, the greater the stress difference, the more obvious the AVAZ characteristics of the longitudinal wave, laying a theoretical foundation for conducting geostress prediction based on prestack seismic inversion.
The geostress orientation inside the geological body is greatly affected by geostress shielding. When the geological body has a fault, the geostress orientation only shows a certain deflection at the end of the fault. The internal principal stress orientation is almost consistent with the geostress orientation. The prediction of the geostress orientation based on seismic anisotropy needs to be further carried out by comprehensively considering the geostress and structural characteristics.
The theory of seismic prediction technology for geostress difference is solid, and the technology is mature, which can be further applied.
Data availability statement
The data analyzed in this study are subject to the following licenses/restrictions: dataset will not be publicly available without PetroChina permission. Requests to access these datasets should be directed to Wang Cen, d2FuZ2MyMDE4QHBldHJvY2hpbmEuY29tLmNu.
Author contributions
CW: conceptualization, data curation, formal analysis, methodology, software, writing–original draft, and writing–review and editing. CY: supervision and writing–review and editing. XS: funding acquisition, resources, and writing–review and editing. DZ: project administration, validation, and writing–review and editing. ML: investigation and writing–review and editing. RZ: data curation and writing–review and editing.
Funding
The author(s) declare that no financial support was received for the research, authorship, and/or publication of this article.
Acknowledgments
The authors are grateful for the financial support from the following institutions: Scientific research project fund of PetroChina Southwest Oil and Gasfield Company, “20210304-02”.
Conflict of interest
Authors CW, XS, DZ, ML, and RZ were employed by PetroChina Southwest Oil and Gasfield Company.
The remaining author declares that the research was conducted in the absence of any commercial or financial relationships that could be construed as a potential conflict of interest.
Publisher’s note
All claims expressed in this article are solely those of the authors and do not necessarily represent those of their affiliated organizations, or those of the publisher, the editors, and the reviewers. Any product that may be evaluated in this article, or claim that may be made by its manufacturer, is not guaranteed or endorsed by the publisher.
References
Craig, D. P. (2014). “New type curve analysis removes limitations of conventional after-closure analysis of DFIT data. SPE 168988-MS,” in Proceedings of the Paper presented at the SPE Unconventional Resources Conference, The Woodlands, TX, April 2014.
Detournay, C., Damjanac, B., Torres, M., Cundall, P., Ligocki, L., and Gil, I. (2022). Heat advection and forced convection in a lattice code–Implementation and geothermal applications. Rock Mech. Bull. 1 (1), 100004. doi:10.1016/j.rockmb.2022.100004
Dontsov, E. V. (2022). Analysis of a constant height hydraulic fracture driven by a power-law fluid. Rock Mech. Bull. 1 (1), 100003. doi:10.1016/j.rockmb.2022.100003
Hayavi, M. T., and Abdideh, M. (2016). Estimation of insitu horizontal stresses using the linear poroelastic model and minifrac test results in tectonically active area. Russ. J. Earth Sci. 16 (4), 1–9. doi:10.2205/2016es000576
He, R., Yang, J., Li, L., Yang, Z., Chen, W., Zeng, J., et al. (2023). Investigating the simultaneous fracture propagation from multiple perforation clusters in horizontal wells using 3D block discrete element method. Front. Earth Sci. 11, 1115054. doi:10.3389/feart.2023.1115054
Huang, J., Shahri, M. P., and Perez, O. (2017). “An integrated approach to constrain geostress field: comprehensive geomechanical analysis,” in Proceedings of the Paper presented at the 51st US Rock Mechanics/Geomechanics Symposium held in San Francisco, California, USA, June 2017, 25–28.
Huang, L., Dontsov, E. V., Fu, H., Lei, Y., Weng, D., and Zhang, F. (2022). Hydraulic fracture height growth in layered rocks: perspective from DEM simulation of different propagation regimes. Int. J. Solids Struct. 238, 111395. doi:10.1016/j.ijsolstr.2021.111395
Huang, L., He, R., Yang, Z., Tan, P., Chen, W., Li, X., et al. (2023b). Exploring hydraulic fracture behavior in glutenite formation with strong heterogeneity and variable lithology based on DEM simulation. Eng. Fract. Mech. 278, 109020. doi:10.1016/j.engfracmech.2022.109020
Huang, L., Liu, J., Ji, Y., Gong, X., and Qin, L. (2018). A review of multiscale expansion of low permeability reservoir cracks. Petroleum 4, 115–125. doi:10.1016/j.petlm.2017.09.002
Huang, L., Liu, J., Zhang, F., Dontsov, E., and Damjanac, B. (2019). Exploring the influence of rock inherent heterogeneity and grain size on hydraulic fracturing using discrete element modeling. Int. J. Solids Struct. 176, 207–220. doi:10.1016/j.ijsolstr.2019.06.018
Huang, L., Liu, J., Zhang, F., Fu, H., Zhu, H., and Damjanac, B. (2020). 3D lattice modeling of hydraulic fracture initiation and near-wellbore propagation for different perforation models. J. Petroleum Sci. Eng. 191, 107169. doi:10.1016/j.petrol.2020.107169
Huang, L., Tan, J., Fu, H., Liu, J., Chen, X., Liao, X., et al. (2023a). The non-plane initiation and propagation mechanism of multiple hydraulic fractures in tight reservoirs considering stress shadow effects. Eng. Fract. Mech. 292, 109570. doi:10.1016/j.engfracmech.2023.109570
Ji, Y., Wang, J., and Huang, L. (2015). Analysis on inflowing of the injecting Water in faulted formation. Adv. Mech. Eng. 7, 1–10.
Karadeniz, K. E. (2019). Geostress magnitude and orientation determination of Ankara Kazan district from FMI log. Ankara, Türkiye: Middle East Technical University.
Liu, Q., Li, J., Liang, B., Liu, J., Sun, W., He, J., et al. (2023). Complex wettability behavior triggering mechanism on imbibition: a model construction and comparative study based on analysis at multiple scales. Energy 275, 127434. doi:10.1016/j.energy.2023.127434
Luo, H., Xie, J., Huang, L., Wu, J., Shi, X., Bai, Y., et al. (2022). Multiscale sensitivity analysis of hydraulic fracturing parameters based on dimensionless analysis method. Lithosphere 2022, 9708300. doi:10.2113/2022/9708300
Schoenball, M., and Ellsworth, W. L. (2017). A systematic assessment of the spatiotemporal evolution of fault activation through induced seismicity in Oklahoma and southern Kansas. JGR Solid Earth 122 (12), 10189–10206. doi:10.1002/2017jb014850
Song, R., Liu, J., and Cui, M. (2017). A new method to reconstruct structured mesh model from micro-computed tomography images of porous media and its application. Int. J. Heat Mass Transf. 109, 705–715. doi:10.1016/j.ijheatmasstransfer.2017.02.053
Song, R., Liu, J., Yang, C., and Sun, S. (2022). Study on the multiphase heat and mass transfer mechanism in the dissociation of methane hydrate in reconstructed real-shape porous sediments. Energy 254, 124421. doi:10.1016/j.energy.2022.124421
Song, R., Wang, Y., Ishutov, S., Zambrano-Narvaez, G., Hodder, K. J., Chalaturnyk, R. J., et al. (2020). A comprehensive experimental study on mechanical behavior, microstructure and transport properties of 3D-printed rock analogs. Rock Mech. Rock Eng. 53, 5745–5765. doi:10.1007/s00603-020-02239-4
Tan, P., Chen, Z., Fu, S., and Zhao, Q. (2023). Experimental investigation on fracture growth for integrated hydraulic fracturing in multiple gas bearing formations. Geoenergy Sci. Eng. 231, 212316. doi:10.1016/j.geoen.2023.212316
Tan, P., Jin, Y., Han, K., Hou, B., Chen, M., Guo, X., et al. (2017). Analysis of hydraulic fracture initiation and vertical propagation behavior in laminated shale formation. Fuel 206, 482–493. doi:10.1016/j.fuel.2017.05.033
Wang, C., Yin, C., Shi, X., Pan, S., Gou, Q., Zhang, D., et al. (2022). Direct prediction method of fracturing ability in shale formations based on pre-stack seismic inversion. J. seismic Explor.
Wu, M., Jiang, C., Song, R., Liu, J., Li, M., Liu, B., et al. (2023). Comparative study on hydraulic fracturing using different discrete fracture network modeling: insight from homogeneous to heterogeneity reservoirs. Eng. Fract. Mech. 284, 109274. doi:10.1016/j.engfracmech.2023.109274
Xu, S., Singh, A., and Zoback, M. D. (2019). “Variation of the least principal stress with depth and its effect on vertical hydraulic fracture propagationduring multi-stage hydraulic fracturing,” in Proceedings of the Paper presented at the 53rd U.S. Rock Mechanics/Geomechanics Symposium, New York, New York, USA, June 2019.
Yang, M., Liu, X., Jiao, D., et al. (2013). “Hydraulic fracture design flaws- proppant selection. Presented at the SPE western regional and AAPG pacific section meeting,” in Proceedings of the Paper presented at the SPE Western Regional and AAPG Pacific Section Meeting 2013 Joint Technical Conference, Monterey, California, USA, April 2013.
Zhang, F., Huang, L., Yang, L., Dontsov, E., Weng, D. W., Liang, H. B., et al. (2022). Numerical investigation on the effect of depletion-induced stress reorientation on infill well hydraulic fracture propagation. Petroleum Sci. 19 (1), 296–308. doi:10.1016/j.petsci.2021.09.014
Zhang, T., Luo, S., Zhou, H., Hu, H., Zhang, L., Zhao, Y., et al. (2023). Pore-scale modelling of water sorption in nanopore systems of shale. Int. J. Coal Geol. 273, 104266. doi:10.1016/j.coal.2023.104266
Keywords: shale gas, geostress, geophysical response, seismic inversion, differential horizontal stress ratio
Citation: Wang C, Yin C, Shi X, Zhang D, Liao M and Zhang R (2024) Research on geophysical response analysis and prediction technology of geostress in the shale gas area of the southern Sichuan Basin. Front. Energy Res. 11:1328236. doi: 10.3389/fenrg.2023.1328236
Received: 26 October 2023; Accepted: 22 December 2023;
Published: 22 January 2024.
Edited by:
Xiaojin Zheng, Princeton University, United StatesReviewed by:
Jun Liu, Sichuan University, ChinaGuangtan Huang, Chinese Academy of Sciences (CAS), China
Guiyun Gao, Ministry of Emergency Management, China
Copyright © 2024 Wang, Yin, Shi, Zhang, Liao and Zhang. This is an open-access article distributed under the terms of the Creative Commons Attribution License (CC BY). The use, distribution or reproduction in other forums is permitted, provided the original author(s) and the copyright owner(s) are credited and that the original publication in this journal is cited, in accordance with accepted academic practice. No use, distribution or reproduction is permitted which does not comply with these terms.
*Correspondence: Chang Wang, MzA2MDAxNzU5QHFxLmNvbQ==