- 1State Grid Sichuan Electric Power Company Electric Power Science Research Institute, Chengdu, China
- 2Sichuan Key Laboratory of Power Internet of Things, Chengdu, China
- 3Leshan Power Supply Company of State Grid Sichuan Electric Power Company, Leshan, China
- 4College of Electrical and Information Engineering, Hunan University, Changsha, China
Introduction: Phasor measurement is crucial for the monitoring and management of power grids. Traditional hardware-based phasor measurement units (PMUs) are effective but often complex and expensive. This paper introduces a software-based phasor measurement method that utilizes soft synchronization with temporal pulse signals from GPS and mobile communication stations, offering a simpler and cost-effective alternative.
Methods: The proposed method synchronizes the local oscillator with Pulse Per Second (PPS) signals from GPS and primary synchronization signals from mobile communication bases. Raw data affected by the local oscillator’s instability are transformed into calibrated data using B-Spline interpolation to emulate an ideal sampling rate. The calibrated data are then subjected to a Recursive Discrete Fourier Transform (RDFT) algorithm for synchronized phasor measurement.
Results: The method’s performance was assessed in compliance with the C37.118.1 standard. Key performance indicators, such as frequency, phase, and Total Vector Error (TVE), were evaluated. The proposed software-based approach demonstrated high accuracy in synchronized phasor measurements.
Discussion: The results confirm that the proposed method can serve as a highly accurate and simpler alternative to conventional hardware-based solutions. Its application promises to advance synchronized phasor measurement practices in power grid monitoring, enhancing reliability and reducing complexity and costs.
1 Introduction
Synchronized sampling is fundamental in power grid monitoring and is crucial for applications such as situational awareness (Appasani et al., 2021), fault location (Dashtdar et al., 2023), and oscillation monitoring (Almunif and Fan, 2019). This technique works by aligning the clocks in analog-to-digital converters (ADCs) with a universal time reference. Most often, this reference comes from Pulse Per Second (PPS) signals provided by Global Positioning Systems (GPS) (Pardo-Zamora et al., 2020), the IEEE 1588 Precision Time Protocol (PTP) (Ahmad Khan and Hayes, 2020), or the Network Time Protocol (NTP) (Park H. et al., 2021). Recently, synchronization signals from 5G networks have also been used (Xiao et al., 2021).
However, a persistent and yet unresolved challenge is observed in achieving consistent synchronization accuracy for all sampled data points within each standard 1-s timing interval (Qiu et al., 2021). While synchronization of the first sample in each interval across different monitoring devices is generally successful, subsequent samples exhibit diminished accuracy (Yao et al., 2016a). This degradation in synchronization is attributed to the inherent asynchrony between the local oscillators that govern the ADCs and the universal time references such as PPS signals (Jiang et al., 2000). The resultant Sampling Time Errors (STEs) not only accumulate but also significantly impair the performance and reliability of applications that are contingent upon high-fidelity synchronized data (Yao et al., 2016b). Thus, the motivation for this study is to explore an economical and effective solution to this pressing issue.
Various methods have been tried to improve the accuracy of synchronized sampling in power grids. One notable approach uses an external Phase Locked Loop (PLL) (Mellino et al., 2017). While this method improves time resolution, it has downsides such as high costs and long setup times, limiting its practical use (Gentile, 2009; Bondarev et al., 2022).
Another technique, called Variable Sampling Interval Control with Operating Frequency Monitoring (VSI-OFM), directly adjusts the ADC’s sampling times (Yao et al., 2016b). This approach does reduce errors but makes the system more complicated, limiting its applications.
Lastly, high-precision clocks like chip-scale atomic clocks (CSACs) (Zhan et al., 2016) and Double-Oven Controlled Oscillators (DOXO) (Yao et al., 2019) have been explored. These provide stable frequencies but come with challenges like high costs and complexity, and in the case of DOXO, higher power consumption, making them less practical for wide use.
In summary, traditional hardware-focused methods like PLL, VSI-OFM, CSAC, and DOXO have their merits but also come with challenges such as cost, complexity, and limited applicability. These issues make it important to explore other, more flexible and cost-effective solutions.
One such promising alternative is soft synchronized sampling. This approach corrects timing errors between two consecutive PPS signals using interpolation techniques, eliminating the need for frequent adjustments of the ADC. While earlier methods like two-point interpolation (Ge and Zhang, 2021) and polynomial interpolation (Park S. H. et al., 2021) have been tried, they often fall short in terms of flexibility and accuracy. That’s where this study comes in. We use B-Spline interpolation (Taghipour and Aminikhah, 2022) for its benefits like better curve fitting, smoothness, and low computational needs (Greco and Cuomo, 2013). This makes it ideal for real-time applications that demand both accuracy and efficiency. Therefore, our paper introduces a new soft synchronized sampling method based on B-Spline interpolation. The contributions of this paper are summarized as follows:
(1) A streamlined yet effective sampling methodology based on B-Spline interpolation is introduced. The need for frequent adjustments to the ADC is thus eliminated, resulting in a simplified sampling process.
(2) A comprehensive analysis is provided that illustrates the advantages of B-Spline interpolation over traditional interpolation methods. Its suitability for high-fidelity synchronized sampling in power grid monitoring is thereby demonstrated.
(3) The proposed methodology is rigorously validated against the C37.118.1 standard. Key performance indicators, such as frequency, phase, and Total Vector Error (TVE), are evaluated, confirming the method’s practicality and advanced capabilities.
The remainder of this paper is organized as follows: Section 1 delves into the theoretical underpinnings of the proposed soft synchronized sampling scheme, elucidating the mechanics of B-Spline interpolation in the context of STE correction. Section 2 presents the experimental setup and methodology employed to validate the proposed approach, adhering to the C37.118.1 standard. Section 3 discusses the results obtained from both simulation and hardware experiments, evaluating key performance indicators such as frequency, phase, and Total Vector Error (TVE). Finally, Section 4 offers concluding remarks and outlines potential avenues for future research.
2 Methodology
2.1 Characteristics of PPS signals and local oscillator monitoring
Pulse Per Second (PPS) signals, commonly generated by systems such as Global Positioning Systems (GPS) and Precision Time Protocol (PTP), serve as a universal time reference for achieving synchronized sampling. These square-wave signals typically operate at a frequency of 1 Hz and have a pulse width ranging from 100 ms to 200 ms. The level type for these signals is generally TTL (Transistor-Transistor Logic). The mathematical representation of the PPS signal can be expressed as:
where
The PPS signal serves as a critical reference for monitoring the local oscillator, which drives the Analog-to-Digital Converter (ADC) during the sampling process. Accurate sampling is contingent upon the precise frequency of this local oscillator. To monitor the local oscillator’s frequency, a microcontroller unit (MCU) typically controls a timer, which counts the number of oscillations between two consecutive PPS signals. The frequency of the local oscillator is then calculated as:
where
By using the PPS signal as a reference, the MCU can accurately determine the frequency of the local oscillator, setting the stage for subsequent calibration steps to mitigate Sampling Time Errors (STEs).
2.2 Sampling data correction based on B-spline interpolation
Upon obtaining the actual frequency
B-spline interpolation was chosen for its capacity to produce smooth curves while allowing local control over curve shape, thus offering a balance between accuracy and flexibility. This method is also computationally less intensive compared to others such as kriging, making it well-suited for handling the large datasets that were critical for this study. Its computational efficiency is complemented by its robustness to noise, an essential feature given the noisy nature of the data used in our experiments. Furthermore, B-spline interpolation provides the versatility required for our study, as it can be adapted to handle both one-dimensional and two-dimensional data efficiently. Alternative methods like cubic interpolation and kriging were initially considered but were ruled out due to their computational intensity and lower robustness to noise.
The actual to ideal sampling interval ratio
Here,
The control points
where
where
In this equation,
2.3 Phasor measurement based on corrected sampled data
To validate the effectiveness of the proposed algorithm, this study employs the calibrated samples to perform synchronized phasor computation in the power grid. The method chosen for this purpose is the Recursive Discrete Fourier Transform (DFT) algorithm. The principal theory behind this algorithm is as follows:
Where
Subsequently, the synchronized phasor
To quantify the accuracy of the phasor estimation, the concept of Total Vector Error (TVE) is introduced as a technical indicator for the subsequent experimental section. TVE is defined as:
Here,
By employing the Recursive DFT algorithm on the calibrated samples obtained through B-spline interpolation, the system achieves high-accuracy phasor estimation, thereby enhancing the reliability and effectiveness of power grid monitoring systems.
3 Performance evaluation
To substantiate the efficacy of the proposed B-spline interpolation technique coupled with Recursive DFT for synchronized phasor estimation, a series of simulation experiments were conducted. The experiments were designed to emulate real-world scenarios encountered in power grid monitoring.
The simulation experiments are performed using a dedicated experimental setup to ensure the study’s reproducibility and credibility. The hardware and software configurations are explicitly stated as follows:
• Software Environment: The simulations are conducted using MATLAB/Simulink, which incorporates the IEEE C37.118.1 standard for performance evaluation.
• Hardware Configuration: While the specific hardware setup is not critical for the MATLAB/Simulink-based simulations, it is noted that a computer with at least an Intel Core i7 processor and 16 GB RAM is used to ensure smooth execution of the simulations.
• Signal Specifications: A 50 Hz sinusoidal signal serves to simulate the voltage and current waveforms in the power grid.
• Local Oscillator Frequency: The local oscillator frequency is adjusted to vary within a range of ±100 ppm to emulate the frequency drift commonly observed in real-world applications.
For comparative analysis, the proposed B-spline interpolation technique is rigorously benchmarked against traditional interpolation methods, including two-point interpolation and polynomial interpolation.
For comparative analysis, the proposed B-spline interpolation technique was benchmarked against traditional interpolation methods, specifically two-point interpolation and polynomial interpolation.
3.1 Steady-state conditions testing
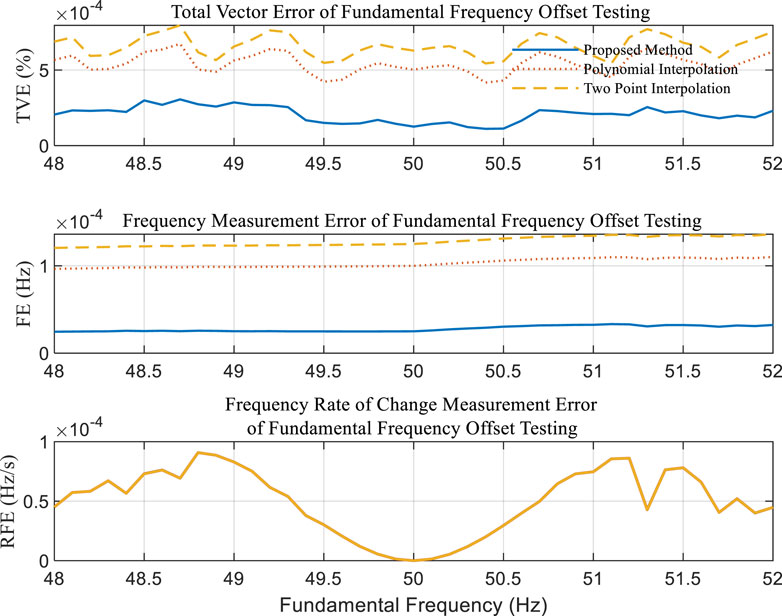
Fundamental Frequency Offset Testing: In the conducted experiment, the frequency setting range for the power system is established between 45 Hz and 55 Hz, with an incremental step of 0.1 Hz. The thresholds for Total Vector Error (TVE), Frequency Error (FE), and Rate of Frequency Error (RFE) are set at 1%, 5 mHz, and 0.01 Hz/s, respectively.
As evidenced by Figure 1, all three algorithms under investigation satisfy the criteria delineated by the C37.118.1 standard. Notably, the proposed algorithm demonstrates superior performance in terms of both total phasor error and frequency measurement error, with average values recorded at 2 × 10⁻⁴% and 2.5 × 10⁻⁵ Hz, respectively. In the context of measuring the rate of frequency change, the performance across the three algorithms is observed to be comparable, with errors not exceeding 1E-4 Hz/s.
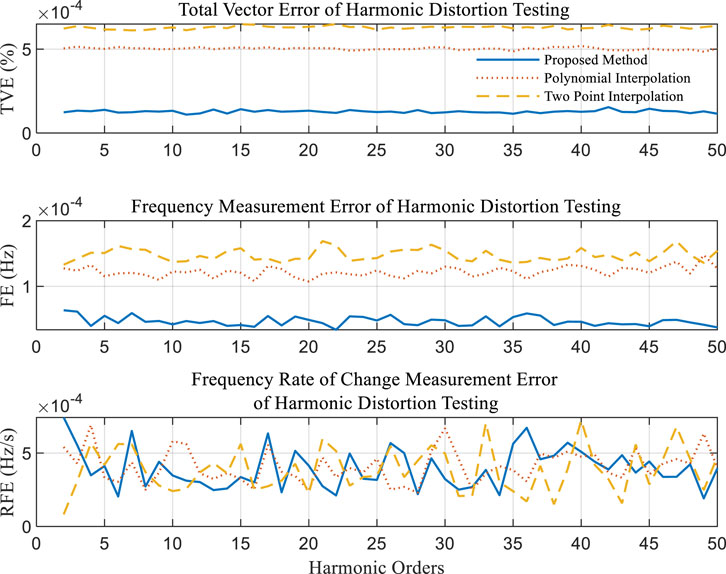
Harmonic Distortion Test: In the present experiment, the focus is on evaluating the algorithm’s measurement performance under the influence of harmonic interference. Harmonics ranging from the second to the 50th are added to the fundamental component for this purpose. According to the standard, the maximum allowable Total Vector Error (TVE) is set at 1%, while the thresholds for Frequency Error (FE) and Rate of Frequency Error (RFE) are established at 25 mHz and 0.1 Hz/s, respectively.
As corroborated by Figure 2, all three algorithms under scrutiny successfully meet the stipulated standard criteria. Importantly, the proposed algorithm exhibits superior performance in both TVE and FE metrics when compared to the other two algorithms under investigation.
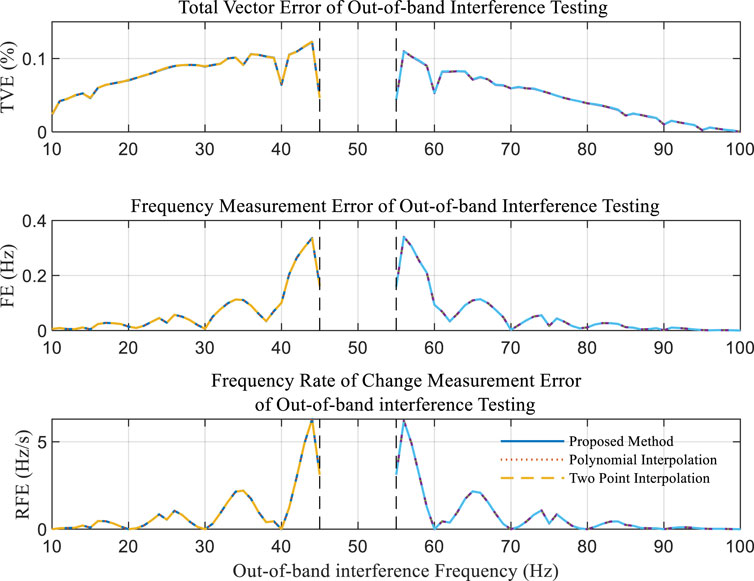
Out-of-band interference test: In the experiment focused on out-of-band interference (OOBI), OOBI signals are superimposed onto the test signal within the frequency ranges of 10–45 Hz and 55–100 Hz. The frequency is incremented in steps of 0.1 Hz, and the amplitude of the interference is set at 10% of the fundamental component. According to the IEEE standard, the allowable limits for Total Vector Error (TVE), Frequency Error (FE), and Rate of Frequency Error (RFE) are defined as 1.3%, 10 mHz, and 0.1 Hz/s, respectively.
As substantiated by Figure 3, the performance metrics for all three algorithms under evaluation are nearly identical. This uniformity in performance is attributed to the significant degradation in measurement accuracy induced by OOBI. In this specific scenario, the error resulting from sampling rate offset is markedly overshadowed by the error introduced by OOBI. Consequently, any efforts to enhance measurement accuracy should primarily focus on refining the synchronized phasor measurement algorithm.
3.2 Dynamic conditions testing
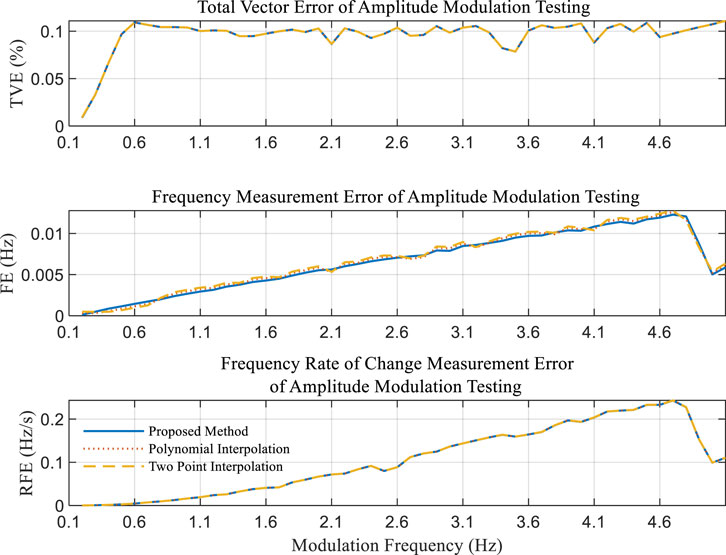
Amplitude Modulation Test: For the purpose of evaluating the efficacy of the proposed method in the context of small oscillations within power systems, tests are conducted under both amplitude-modulated and phase-modulated conditions. The modulated signal employed for these tests is represented in its general form as follows:
where
From the results in Figure 4, it is observed that the measurement error exhibits a proportional increase with the escalation of modulation frequency. Notably, the proposed algorithm maintains commendable measurement performance even under amplitude modulation testing conditions at a modulation frequency of 5 Hz. Furthermore, when evaluated against the Frequency Error (FE) index, the proposed algorithm demonstrates a marked superiority over the other two algorithms employed for comparative analysis.
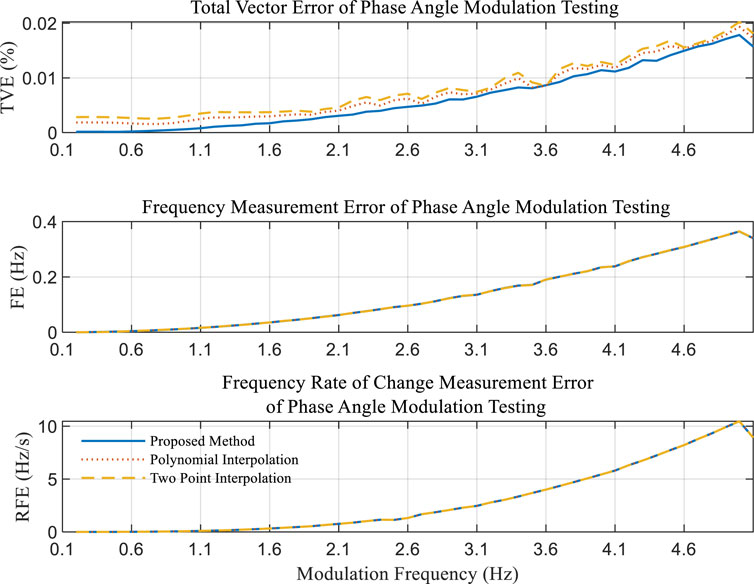
Phase Modulation Test: To assess the performance of the proposed method under small oscillations in power systems, behaviors under either amplitude or phase-modulated conditions are:
The parameters delineated in Eq. 1.14 bear identical significance to those in Eq. 1.12. Correspondingly, the phasor associated with the input signal is represented as follows:
Based on the experimental data shown in the Figure 5, it is evident that the performance disparities among the three algorithms are minimal in the context of phase modulation testing. However, the proposed algorithm exhibits a marginal superiority when assessed against the Total Vector Error (TVE) index.
Frequency Ramp Test: Given that the frequency of the power system is inherently variable, it becomes imperative to evaluate the measurement performance of the methods under conditions of frequency fluctuations. For this analysis, the system frequency is still assumed to be 50 Hz; however, any alteration in frequency is mathematically considered as a change in the phase angle. The input signals for this scenario can be mathematically represented as follows:
where
The IEEE Standard limits for this test are 1%, 10 mHz, and 0.1 Hz/s, respectively. Clearly, the proposed method fully satisfies the IEEE Standard requirements. Furthermore, based on the Total Vector Error (TVE) outcomes, it is evident that the proposed algorithm is more effective in mitigating the sampling time error within the collected data. In contrast, the other two algorithms under evaluation exhibit inadequate efficacy in eliminating such errors, thereby leading to residual sampling time errors. This observation is substantiated by the results presented in Figure 6.
4 Conclusion
In the realm of power grid monitoring, this study introduces a pioneering soft synchronization-based phasor measurement method. Leveraging time pulse signals from GNSS or mobile stations, the local oscillator is meticulously observed. This is followed by the B-spline interpolation which refines the raw data, bringing it in line with an ideal sampling rate. Subsequently, the synchrophasor is extracted using a recursive DFT algorithm.
Beyond the technical advancements, the practical significance of this research lies in its potential to seamlessly integrate into existing power grid systems. By validating the method against the C37.118.1 standard and juxtaposing it w both two-point and polynomial interpolations, it has been demonstrated that the proposed approach not only simplifies the phasor measurement process but also augments accuracy. This suggests a shift towards a more cost-effective and efficient means of monitoring, reducing the reliance on more complex hardware-based solutions. As power grid infrastructures continue to evolve, this method holds promise in enhancing the reliability and efficiency of real-world applications.
Data availability statement
The original contributions presented in the study are included in the article/Supplementary Material, further inquiries can be directed to the corresponding author.
Author contributions
JZ: Conceptualization, Formal Analysis, Funding acquisition, Investigation, Methodology, Validation, Writing–original draft. CT: Data curation, Methodology, Visualization, Writing–review and editing. CL: Software, Writing–review and editing. HW: Validation, Writing–review and editing. DJ: Data curation, Writing–review and editing. ST: Writing–review and editing.
Funding
The author(s) declare financial support was received for the research, authorship, and/or publication of this article. This work was funded by the Science and Technology Project of State Grid Co., Ltd. Project Name: Research on key technologies and prototype development based on timing pulse characteristics of 5G communication network (No. 52199723008).
Conflict of interest
Authors JZ, CT, and HW were employed by State Grid Sichuan Electric Power Company Electric Power Science Research Institute. Author CL was employed by Leshan Power Supply Company of State Grid Sichuan Electric Power Company.
The authors declare that this study received funding from the Science and Technology Project of State Grid Co., Ltd. The funder had the following involvement in the study: Conceptualization, Formal Analysis, Funding acquisition, Investigation, Methodology, Validation, and Writing–original draft.
The remaining authors declare that the research was conducted in the absence of any commercial or financial relationships that could be construed as a potential conflict of interest.
Publisher’s note
All claims expressed in this article are solely those of the authors and do not necessarily represent those of their affiliated organizations, or those of the publisher, the editors and the reviewers. Any product that may be evaluated in this article, or claim that may be made by its manufacturer, is not guaranteed or endorsed by the publisher.
Abbreviations
ADC, Analog-to-digital converters; C37.118.1, IEEE standard for Synchrophasor measurements; CSACs, Chip-scale atomic clocks; DFT, Discrete Fourier transform; DOXO, Double-Oven controlled oscillators; FE, Frequency error; GNSS, Global navigation satellite system; GPS, Global positioning systems; NTP, Network time protocol; PLL, Phase locked loop; PPS, Pulse per second; PTP, Precision time protocol; RDFT, Recursive discrete Fourier transform; RFE, Rate of frequency error; STE, Sampling time error; TVE, Total vector error; VSI-OFM, Variable sampling interval control with operating frequency monitoring.
References
Ahmad Khan, M., and Hayes, B. (2020). PTP-based time synchronisation of smart meter data for state estimation in power distribution networks. IET Smart Grid 3 (5), 705–712. doi:10.1049/iet-stg.2020.0034
Almunif, A., and Fan, L. (2019). “Pmu measurements for oscillation monitoring: connecting prony analysis with observability,” in 2019 IEEE Power and Energy Society General Meeting (PESGM), Atlanta, GA, USA, 04-08 August 2019.
Appasani, B., Jha, A. V., Mishra, S. K., and Ghazali, A. N. (2021). Communication infrastructure for situational awareness enhancement in WAMS with optimal PMU placement. Prot. Control Mod. Power Syst. 6, 9–12. doi:10.1186/s41601-021-00189-9
Bondarev, A., Prystaj, A., and Pronenko, V. (2022). “GPS-Synchronization optimization process of autonomous data collection systems,” in 2022 IEEE 16th International Conference on Advanced Trends in Radioelectronics, Telecommunications and Computer Engineering, Lviv-Slavske, Ukraine, 22-26 February 2022.
Dashtdar, M., Hussain, A., Al Garni, H. Z., Mas’ud, A. A., Haider, W., AboRas, K. M., et al. (2023). Fault location in distribution network by solving the optimization problem based on power system status estimation using the PMU. Machines 11 (1), 109. doi:10.3390/machines11010109
Ge, Q., and Zhang, X. (2021). Numerical solution for third-order two-point boundary value problems with the barycentric rational interpolation collocation method. J. Math. 2021, 1–6. doi:10.1155/2021/6698615
Greco, L., and Cuomo, M. (2013). B-spline interpolation of Kirchhoff-love space rods. Comput. Methods Appl. Mech. Eng. 256 (1), 251–269. doi:10.1016/j.cma.2012.11.017
Jiang, J. A., Lin, Y. H., Yang, J. Z., Too, T. M., and Liu, C. W. (2000). An adaptive PMU based fault detection/location technique for transmission lines. II. PMU implementation and performance evaluation. IEEE Trans. Power Deliv. 15 (4), 1136–1146. doi:10.1109/61.891494
Mellino, J. A. Z., Messina, F., Marchi, P., and Galarza, C. (2017). “PLL based implementation of a PMU,” in 2017 XVII Workshop on Information Processing and Control (RPIC), Mar del Plata, Argentina, 20-22 September 2017, 1–6.
Pardo-Zamora, O. N., Romero-Troncoso, R. D. J., Millan-Almaraz, J. R., Morinigo-Sotelo, D., and Osornio-Rios, R. A. (2020). Methodology for power quality measurement synchronization based on gps pulse-per-second algorithm. IEEE Trans. Instrum. Meas. 70, 1–9. doi:10.1109/tim.2020.3036691
Park, H., Wee, S., and Park, L. (2021a). “Learning-based frequency synchronization with NTP for low-cost phasor measurement units,” in 2021 International Conference on Information Networking (ICOIN), Jeju Island, Korea (South), 13-16 January 2021, 805–807.
Park, S. H., Lim, H., Bae, B. K., Hahm, M. H., Chong, G. O., Jeong, S. Y., et al. (2021b). Robustness of magnetic resonance radiomic features to pixel size resampling and interpolation in patients with cervical cancer. Cancer Imaging 21 (1), 19–11. doi:10.1186/s40644-021-00388-5
Qiu, W., Yin, H., Zhang, L., Luo, X., Yao, W., Zhu, L., et al. (2021). Pulsar-calibrated timing source for synchronized sampling. IEEE Trans. Smart Grid 13 (2), 1654–1657. doi:10.1109/tsg.2021.3127396
Taghipour, M., and Aminikhah, H. (2022). A difference scheme based on cubic b-spline quasi-interpolation for the solution of a fourth-order time-fractional partial integro-differential equation with a weakly singular kernel. Sadhana Acad. Proc. Eng. Sci. 47, 253. doi:10.1007/s12046-022-02005-y
Xiao, M., Wang, S., and Ullah, Z. (2021). D-PMU and 5G-network-based coordination control method for three-phase imbalance mitigation units in the LVDN. Energies 14 (10), 2754. doi:10.3390/en14102754
Yao, W., Liu, Y., Zhou, D., Pan, Z., Till, M. J., Zhao, J., et al. (2016a). Impact of GPS signal loss and its mitigation in power system synchronized measurement devices. IEEE Trans. Smart Grid 9 (2), 1141–1149. doi:10.1109/tsg.2016.2580002
Yao, W., Zhan, L., Liu, Y., Till, M. J., Zhao, J., Wu, L., et al. (2016b). A novel method for phasor measurement unit sampling time error compensation. IEEE Trans. Smart Grid 9 (2), 1063–1072. doi:10.1109/tsg.2016.2574946
Yao, W., Zhan, L., Yin, H., and Liu, Y. (2019). PMU holdover performance enhancement using double-oven controlled oscillator. IEEE Trans. Power Deliv. 34 (6), 2260–2262. doi:10.1109/tpwrd.2019.2912524
Keywords: B-spline interpolation, synchronized sampling, synchrophasor estimation, temporal pulse, sampling time error
Citation: Zhang J, Tang C, Liu C, Wang H, Junfeng D and Tang S (2023) Phasor measurement method based on soft synchronized sampling with temporal pulse signal reference. Front. Energy Res. 11:1302869. doi: 10.3389/fenrg.2023.1302869
Received: 27 September 2023; Accepted: 31 October 2023;
Published: 15 November 2023.
Edited by:
Yuqing Dong, The University of Tennessee, Knoxville, United StatesReviewed by:
Haoasn Yang, Hong Kong Polytechnic University, Hong Kong SAR, ChinaLiang Zhang, Southwest Petroleum University, China
Copyright © 2023 Zhang, Tang, Liu, Wang, Junfeng and Tang. This is an open-access article distributed under the terms of the Creative Commons Attribution License (CC BY). The use, distribution or reproduction in other forums is permitted, provided the original author(s) and the copyright owner(s) are credited and that the original publication in this journal is cited, in accordance with accepted academic practice. No use, distribution or reproduction is permitted which does not comply with these terms.
*Correspondence: Sihao Tang, dGFuZ3NpaGFvQGhudS5lZHUuY24=
 Jie Zhang1,2
 Sihao Tang