 Lei Zhu
 Shutan Wu
 Qi Wang
- School of Electrical Engineering, Southeast University, Nanjing, China
The wide distribution of data centers and the delay tolerance of computing tasks endow data center loads with adjustable characteristics in both temporal and spatial dimensions. Due to the characteristics of abundant spatiotemporal flexibility, data centers can participate in the optimization of power system operation and regulation. To quantify this flexibility, this paper proposes a spatiotemporal load migration potential evaluation model. Meanwhile, a data center energy management strategy is combined with the characteristics of spatiotemporal load migration, which deeply exploits the migration potential through the spatiotemporal redistribution of delay-tolerant tasks, as well as server ON/OFF scheduling and CPU operating frequency scaling across different spatial locations. A case study demonstrates that adopting the proposed approach considering an energy management strategy can effectively improve the load migration potential of data centers. The migration characteristics of data centers have great application prospects in reducing carbon emissions and enhancing operational flexibility.
1 Introduction
The gradual replacement of traditional thermal power sources with high-penetration renewable energy sources poses a significant challenge to power systems in dealing with multidimensional uncertainties. The inadequate regulation capacity on the power generation side necessitates the participation of flexible resources on the load side in power dispatching, thereby improving the flexibility of power systems (Han et al., 2022). For example, energy storage systems (Ma et al., 2022) and temperature-controlled loads (Song et al., 2022) are commonly used to adjust the temporal distribution of loads to alleviate peak power demand and decrease the power supply pressure on the power generation side. With the continuous advancement of digital infrastructure construction, new types of spatially distributed resources (e.g., data centers (DCs), communication base stations, and electric vehicles) have emerged to provide novel solutions for power load adjustment. These resources can intercommunicate through various wide-area networks (i.e., computation networks (Chen et al., 2021a), communication networks (Fan et al., 2021) and transportation networks (Yuan et al., 2022)) to indirectly realize the spatial migration of power energy.
The surge in demand for data processing is prompting cloud service operators to build more geographically distributed DCs, with the aim of achieving low-latency and highly reliable services, which makes DCs emerge as major electricity consumers (Martijn and Fons, 2021). According to reports, the electricity consumption of DCs reached approximately 3% of the total amount globally in 2016 (Danilak, 2017), and it is still doubling every 4 years (Long et al., 2022). In some metropolises, such as Beijing in China, the power load capacity occupied by DCs has already accounted for 8% of the total power load capacity in 2021. Given the rapid expansion of data centers at the spatiotemporal scale and migration level, it is of great importance to fully exploit the adjustment potential of DC loads in power systems.
Current research on utilizing the adjustment capability of DCs can be primarily categorized into two levels. That is, temporal level and spatial level. At the temporal level, the workloads of DCs with low delay sensitivity can be shifted to alternate working hours to alleviate the power load pressure at a specific time. This characteristic enables DCs to be integrated into demand response (Kwon, 2020) to improve frequency quality (Fu et al., 2020) or smooth power fluctuation (Yang et al., 2018), similar to traditional interruptible power loads.
What sets DCs apart is their capacity to migrate workloads spatially, thereby reducing power loads in specific locations to achieve regulation objectives (Wang et al., 2022). Therefore, the spatial load migration capability of geo-distributed data centers is more effective in power dispatch. There have been relevant studies on the application of spatial load migration by DCs for power system regulation purposes. In terms of operational stability, DCs can flexibly adjust the spatial distribution of power loads to diminish voltage violations (Chen et al., 2021b), relieve network congestion (Chen et al., 2021c) and reduce peak loads (Guo et al., 2021a). In terms of operational economy, existing studies achieved the optimal comprehensive operation cost of power systems (Gu et al., 2015) and renewable energy consumption (Yang et al., 2022) through spatial scheduling in DCs. In terms of resilience enhancement, DCs can be dispatched in pre-event prevention (Liu et al., 2022), during-event emergency control (Yu et al., 2015) and post-event restoration (Liu et al., 2019) to reduce power loss after extreme events. The benefits of DCs as spatiotemporal flexible resources for participating in power grid scheduling have been demonstrated in the abovementioned literature. However, the differentiation of the spatiotemporal load migration (STLM) potential of DCs in different scenarios has not been considered. It is imperative to quantitatively evaluate the STLM potential of DCs to devise more effective grid regulation strategies tailored to different scenarios, but this issue remains unexplored in current research.
The STLM potential of DCs is primarily derived from the redistribution of workloads, which is heavily influenced by the energy management strategies implemented within the DCs. By employing energy management strategies, internal equipment in data centers can effectively reduce energy consumption and thereby enhance the STLM potential of DCs. Some energy-saving technologies and strategies have been studied, such as dynamic voltage/frequency scaling (DVFS) (Wang et al., 2017), dynamic cluster server configuration (DCSC) (Li et al., 2012), and the collaborative control method of information technology (IT) systems and cooling systems (Fu et al., 2020; Lyu et al., 2021), achieving the optimization goal of minimum total energy consumption. However, there is a paucity of research that integrates internal energy management strategies with external migration schemes. Inadequate energy management strategies can amplify the burden on DC task processing and increase the power supply pressure on the power systems, ultimately resulting in a significant reduction in the STLM potential of DCs.
This paper proposes a quantitative approach for evaluating the STLM potential of DCs, which provides a basis for devising diverse power scheduling strategies. Meanwhile, the DVFS-DCSC technique, coupled with an energy management mechanism, is adopted to further enhance the STLM potential of DCs. Then, an application model of a day-ahead scheduling strategy considering the STLM potential of DCs is proposed, and the flexibility and economic efficiency of power systems are significantly improved. The major contributions of this paper are as follows.
1) An STLM potential evaluation model is established to quantify the migration loads of urban DCs in different scenarios, which evaluates the STLM potential by spatiotemporal workload redistribution.
2) An energy management strategy is applied in the proposed potential evaluation model to further exploit the STLM potential of DCs, and server ON/OFF scheduling and CPU operating frequency selection are optimized to maximize the STLM potential.
3) A workload optimization scheduling strategy considering customer satisfaction is established to ensure the quality of service (QoS) of DCs and avoid workload accumulation. The STLM ability of tasks with different service-level agreements (SLAs) is also analyzed in this case.
4) A day-ahead scheduling method that integrates the STLM of DCs with DVFS-DCSC technology is proposed based on the proposed evaluation model. The carbon emissions and the CPU utilization are better optimized compared with the conventional scheduling strategy.
The remainder of this paper is organized as follows. The theoretical basis of DCs’ spatiotemporal flexibility is introduced in Section 2. The DC model and STLM potential evaluation model are established in Sections 3, 4, respectively. In Section 5, case studies on the STLM potential evaluation of DCs and day-ahead scheduling strategies considering energy management strategies are carried out, and the results are displayed and discussed accordingly. Section 6 gives a brief conclusion.
2 Theoretical basis of DC STLM potential
The coupling architecture of the computation network and power system is shown in Figure 1. The DC load exhibits high flexibility in both the temporal and spatial dimensions. The prioritization of workloads and the emerging trend of cloud interconnectivity among DCs endow them with the capability of STLM. Therefore, the spatiotemporal workload redistribution among DCs is the basis for them to participate in the STLM of power loads.
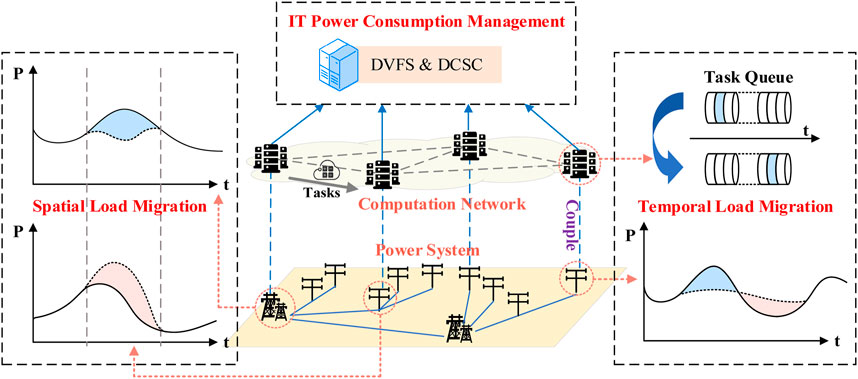
FIGURE 1. Coupling architecture of the computation network and power network.
Many studies have been performed on temporal load migration, which will not be discussed in detail. This section focuses on spatial load migration, which refers to a scheduling method that involves either shedding loads at some locations or migrating loads that ought to exist in one center to other centers (Wang et al., 2022). The migration potential of spatially flexible loads can be assessed quantitatively from various perspectives, including the temporal scale, spatial scale, and migration level. The temporal scale determines the response speed of load migration, the spatial scale determines the coverage range of load migration, and the migration level determines the extent to which migration scheduling can contribute to overall system performance. Regional DCs achieve spatial interconnection via backbone optical networks, whose extremely high transmission speeds and minimal delay rates of merely 0.02 ms/km (Zhou et al., 2016) enable rapid load migration across timescales ranging from seconds to hours. In addition, the optical fiber network also has the characteristics of high bandwidth and strong reliability, facilitating the interconnection not only of local distribution network DCs but also of transnational DCs. Hence, the spatial range of data load migration can span several kilometers to several thousand kilometers. To accommodate the ever-increasing data business requirements, modern large-scale DCs must be capable of sustaining loads that can measure in the tens of megawatts, thereby necessitating migration levels spanning from hundreds of kilowatts to tens of megawatts.
The STLM potential of DCs is related to many factors, including the number and capacity of fiber links connected to them, their workload processing capacity, and the number of tasks assigned to each time period. However, the potential relying on only the spatiotemporal redistribution of workloads is relatively limited, and the STLM potential of DCs can be further enhanced through optimization of their energy management strategies. DVFS is an efficient and feasible energy management technology for DCs, improving the utilization of a server via discrete adjustments to CPU operating voltage or frequency, thereby reducing the power consumption. Meanwhile, DCSC reduces total cluster power consumption by consolidating the load on a subset of machines and turning off the rest during low workload periods (Guo et al., 2021b). Adopting the DVFS-DCSC energy management strategy, as seen in Figure 2, can not only reduce the target DCs’ energy consumption but also improve the ability of other DCs to undertake workloads, thus further enhancing the STLM potential of the target DC.
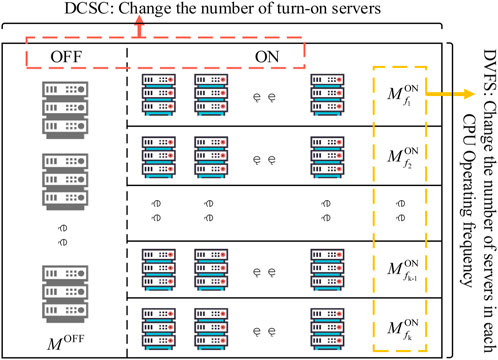
FIGURE 2. DVFS-DCSC energy management strategy.
3 Modeling and characteristics of DCs
Considering the factors affecting the DCs’ STLM, the models of DC power consumption, DVFS technology, DCSC technology, optical network power consumption, workloads and QoS are established in this section.
3.1 Power consumption model of DC
The DC is mainly composed of IT equipment, cooling equipment and distribution equipment, and the energy consumption of DC can be expressed as (1). Among them, the IT equipment energy consumption accounts for the largest proportion of the total energy consumption, which has the widest range of changes. As the core element of IT equipment, servers are the key equipment for massive data computing and processing, which accounts for the largest proportion of IT equipment energy consumption. Therefore, it can be used to represent the total energy consumption of IT equipment, as shown in (2). In the typical server power consumption model, the part of the CPU changes the most, and the power consumption of other components, such as memory, hard disk and network, can be regarded as approximately constant (Jin et al., 2020). Therefore, the power consumption model of a single server can be represented by the superposition of fixed power and dynamic power, which is expressed as (3).
where PDC denotes the power consumption of the DC; PIT denotes the power consumption of IT equipment; PCO denotes the power consumption of cooling equipment; and PEL denotes the power consumption of distribution equipment. Mser is the number of servers owned by the data center; Pser is the power consumption of the servers.
The cooling energy consumption PCO depends on the amount of heat generated by servers, and the heat is almost entirely derived from the computing energy consumption (Liu et al., 2018). In DCs, the energy consumption of cooling and distribution systems can be estimated based on the typical power usage effectiveness (PUE). PUE is defined as the energy consumption ratio of the entire DC to the IT equipment, so PDC can be expressed as (4).
3.2 DVFS model of DC
For the status of DC operation, there are many DCs with redundant server configurations and low CPU utilization in most time periods. DVFS changes the power consumption of the DC by discretely adjusting the CPU operating voltage or frequency. To facilitate actual operation, this paper only considers the adjustment of the CPU operating frequency f and sets several suitable frequencies for selection, as shown in (5). Each operating frequency has a corresponding server processing capacity, which is proportional to this frequency. The dynamic power of the server is related to the third power of the CPU operating frequency. The higher the CPU operating frequency is, the stronger the ability to process the workloads, although the consequence of energy consumption greatly increases. The CPU utilization can be calculated by the ratio of the capacity needed for task processing to the server processing capacity, as shown in (6–8). When f is constant,
where f CPU denotes the working frequency of the CPU. U is the CPU utilization rate; λ is the tasks processed by a server during unit time; μ is the processing capacity of a server. Aser denotes the dynamic power consumption coefficient of a server; L denotes the total load that the DC needs to process;
According to the abovementioned analysis, DVFS can be applied to enhance the STLM potential of DCs. The DCs to which migration terminates can increase f to undertake more tasks, while the DCs from which migration originates can decrease f to reduce energy consumption, which can further expand the DC migration load. Given that DVFS can be executed within a few milliseconds (Li et al., 2012), it represents a viable strategy for scheduling within temporal scales ranging from seconds to hours.
3.3 DCSC model of DCs
On the one hand, adjusting the dynamic power of the server has a good energy-saving effect on the DC. On the other hand, the fixed power of the server is also a part that cannot be ignored. The spatial migration of power loads in DCs is achieved through the spatiotemporal redistribution of workloads. This part has limited migration potential and cannot cope well with extreme situations such as large power shortages in power systems. Although the fixed power cannot freely change the spatial distribution of power loads through data load redistribution among DCs such as the dynamic power, local DCs can shut down the current idle servers while simultaneously activating new servers elsewhere within the network to tackle increased workload demand. Therefore, it can be considered that the fixed power of servers also has the ability of spatial migration. In other words, the ON/OFF operation of geographically distributed servers transforms fixed power into a schedulable spatial resource. Since the cooling energy consumption of the DC depends on the heat generated by the IT equipment, it will also change with the regulation of the IT equipment for a constant PUE, thereby reducing the total energy consumption and greatly improving the STLM potential of DCs.
To prolong the service life of the servers as much as possible, the servers should avoid frequent ON/OFF operation, thereby setting a minimum ON/OFF time to force them to maintain at least for a period before becoming another state, as shown in (10). The ON/OFF operation of a server is a second-level delay process, so DCSC is more suitable as a minute-level or hour-level scheduling method.
where It denotes the operating state of a server at time t, 1 represents ON, 0 represents OFF, and MD denotes the minimum ON/OFF time of a server.
3.4 Power consumption model of optical networks
The interconnection communication network that DCs rely on is generally composed of backbone optical networks, which have large transmission capacity, extremely fast transmission speed and much lower delay. For typical optical networks, the energy consumption can be generated by an IP layer, an optical–electric–optical layer and a wavelength-division multiplexing layer (Zhang et al., 2015). The networks’ energy consumption is jointly borne by the source node and destination node (Deylamsalehi et al., 2018), assuming that the source node and the destination node bear half of the network energy consumption.
Referring to the power consumption model of the server, a simplified power consumption model of the optical network can also be expressed as the superposition of fixed power and dynamic power (Dayarathna et al., 2016). The fixed power is the elementary energy consumption of the communication equipment, which is unrelated to network traffic. The dynamic power is the energy consumption of the network transmission and is related to the network traffic (Sun et al., 2013). Furthermore, the bandwidth and traffic within optical networks can be likened to the processing capacity and workload demand of CPUs in servers. The power consumption of the optical fiber link (i, j) is shown in (11), and (12) represents the power consumption of network element (NE) node i.
where
3.5 Models of workloads and QoS
When exploring the DCs’ STLM potential, it is necessary to find an appropriate trade-off strategy between adjusting the power consumption of IT equipment and meeting the users’ requirements for QoS. The workload can be divided into delay-sensitive tasks and delay-tolerant tasks according to the SLA (Cupelli et al., 2018). Delay-sensitive tasks, such as live broadcast, real-time payment and real-time measurement, need to be processed immediately after the arrival of the tasks at tar, and thus, they are not suitable to be migrated to other DCs for processing as spatially flexible resources. In contrast, delay-tolerant tasks, such as image processing and scientific computing, only need to be completed before the deadline tmax. The QoS constraints are shown in (13), where ∆ttr,qu denotes the queuing waiting time for migration, ∆ttr denotes the needed time for task migration, ∆tpro,qu denotes the waiting time for processing in the queue, and ∆tpro denotes the needed time for task processing. As shown in Figure 3, different types of tasks have different SLAs for the deadline of completion, which can vary from a few minutes to several hours, so they have great spatiotemporal flexibility. After migration to other DCs at tar’, the tasks can be stored in the hard disk without immediate processing. Consequently, the time points tmig and tst for migration and processing can be freely selected to achieve the optimal operation strategy.
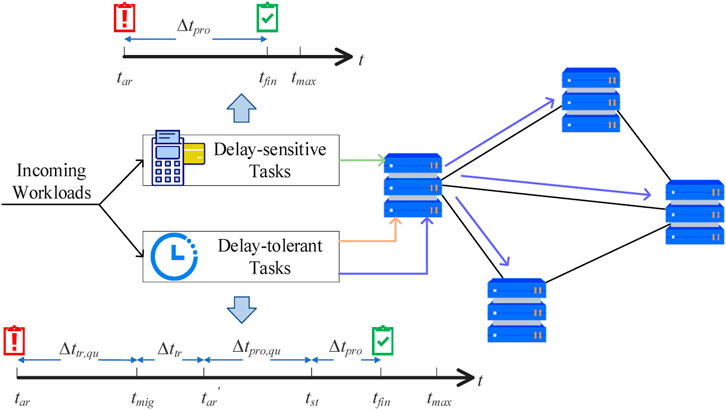
FIGURE 3. IT workload models with different delay tolerances.
To avoid the backlogs being processed near tmax, a task-scheduling optimization strategy considering customer satisfaction is established. The variation in customer satisfaction with waiting time is not completely linear but rather a nonlinear curve. Prolonged wait times lead to reduced customer perception, ultimately resulting in a diminishing marginal rate of satisfaction. Positive values denote satisfaction, whereas negative values imply dissatisfaction. Since all tasks need to be strictly processed before tmax according to the SLA, the negative part of the curve is not considered. The cosine distributed time satisfaction function is truncated from the part of the cosine function curve, which is expressed as (14). The curve changes little around the thresholds Li and Ui, and the slope of the middle part of the curve is larger. Let Ui be tmax, and let Li be set as a reasonable value. To enable the tasks to be completed under the conditions of achieving high time satisfaction, the average customer satisfaction can be set to be greater than a certain fixed value.
To clarify the completion of each batch task in each time period, matrix A is established as shown in (15). A is a T-order sparse matrix, and its lower-left corner and upper-right corner are composed of zero elements. The zero elements in the lower-left corner indicate that the tasks arriving at t cannot be processed ahead of t, and the zero elements in the upper-right corner indicate that the number of tasks violating SLAs is none, which meets the maximum response time constraints of QoS. The average value of customer satisfaction
where
4 Potential evaluation model of the DCs’ STLM
The above models can be applied to the STLM potential evaluation of DCs, and the corresponding objective functions and constraints are set in the section.
4.1 Objective function of STLM potential evaluation
Considering the energy management strategy, optical network allocation, and QoS, the potential evaluation model of the DCs’ STLM is established. To obtain the maximum STLM of region i, the minimum sum of the power consumption of the DC and NE in region i at time T is taken as the objective function, as expressed in (18) and (19).
where
4.2 Constraints of STLM potential evaluation
4.2.1 Constraint of power balance
(20) and (21) ensure that the regional power systems meet the real-time balance of power, and the power supply of the grid is less than its maximum output.
where
4.2.2 Constraint of DCSC in DCs
(22) and (23) indicate that the number of servers ON cannot exceed the total number of servers owned by DCs, and to handle the tasks beyond the plan well, maintaining a certain minimum number of active servers is imperative. (24) and (25) calculate the number of newly ON/OFF servers at time t. (26–29) calculate the number of servers that can be turned ON/OFF at time t based on the minimum ON/OFF time, thus providing (30) and (31) with the upper limit of the number of servers that can be turned ON/OFF, avoiding the loss of serving life of servers due to the frequent ON/OFF operation.
for
for
for
where
4.2.3 Constraint of DVFS in DCs
(32) represents the number of servers operating at each operating frequency after adopting DVFS technology. (33) forces the average CPU utilization of servers at each operating frequency to be less than an upper limit, which avoids CPU saturation and is conducive to stable hardware operation.
where
4.2.4 Constraint of QoS
To reduce the impact on the processing plans of other DCs, this part only redistributes the receiving tasks of the source DC i temporally and spatially. (34–36) enforce that all types of tasks must be completed within a designated maximum response time according to the SLAs while dictating the relationship between the number of tasks received by and processed at destination DCs.
for
for
where
(37) makes the average customer satisfaction of each type of task greater than a preestablished threshold, which not only shortens the waiting time for processing tasks but also avoids the accumulation of unprocessed workloads.
where
4.2.5 Constraints of optical network transmission
(38–40) explain the condition that task migration should satisfy for optical network traffic. (38) is the constraint of NE node traffic conservation, which represents the number of tasks that the network switching equipment i transmits to node j. When the tasks migrate from DC i to DC j, if node i is the migration destination, the net number of tasks received by DC i is
where
4.3 Day-ahead scheduling model considering the STLM potential of DCs
The proposed spatiotemporal migration model of DCs considering DVFS-DCSC technology can be applied to not only the potential evaluation but also the day-ahead scheduling strategy of multi-DCs. The day-ahead scheduling takes the minimum carbon emissions of all DCs and NEs as the objective function, and the tasks in each DC can be redistributed temporally and spatially. Therefore, the constraint can be adjusted as (41):
where C is the total carbon emissions of all DCs and NEs in time period T and e is the CO2 emission density.
5 Case study
As shown in Figure 4, the urban distribution network with six DCs is used for the case study. Region 1 is a light-industrial area, regions 2 and 6 are residential areas, region 3 is a heavy-industrial area, and regions 4 and 5 are commercial areas. The weather conditions of each region are the same, and the loads and PV generation are shown in Figure A1 in the Appendix. The number of tasks allocated to each DC in each time period is shown in Figure A2 in the Appendix. The delay-tolerant tasks handled by DCs account for 60% of the total tasks, and there are seven types of tasks. The capacity needed for processing, the bandwidth needed for migration, the proportion and the maximum response time for each type of task are shown in Figure A3 in the Appendix. Each DC adopts the same type of server, and the relevant parameters of the DC are presented in Table 1. Each DC must maintain the activation of a minimum of 50% of its servers. A case study of the STLM potential evaluation and day-ahead scheduling of DCs is solved in MATLAB 2021a using Gurobi 9.5.1 to demonstrate the validity of the proposed model.
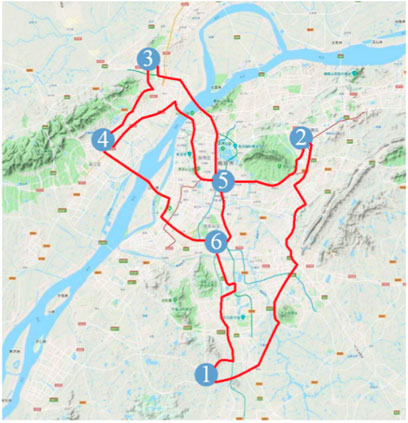
FIGURE 4. The urban DC network with six DCs.
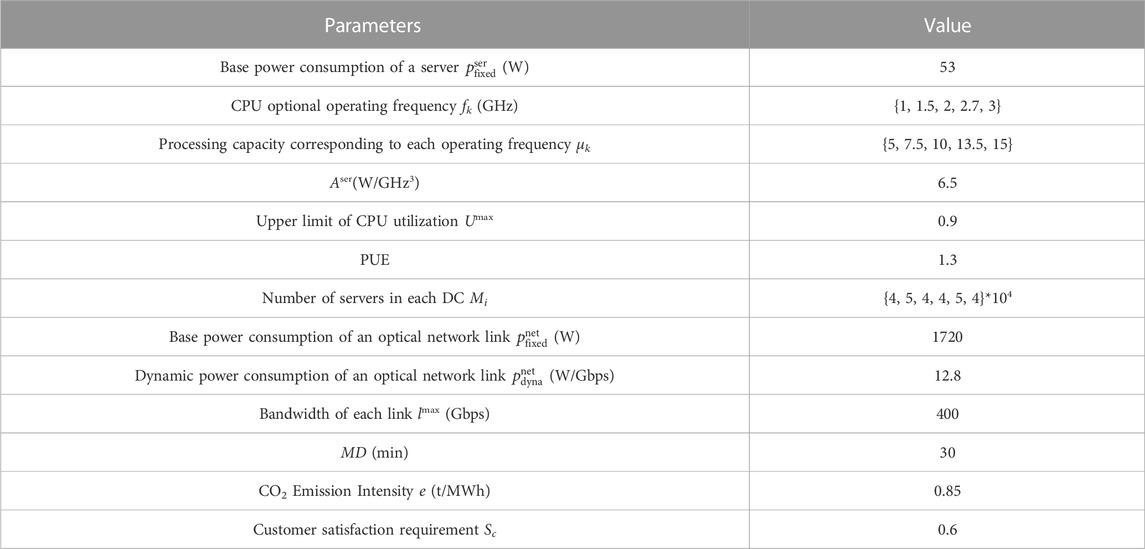
TABLE 1. Parameters of DC.
5.1 STLM potential evaluation of DCs considering the DVFS-DCSC energy management strategy
To quantify the maximum STLM potential of the DC to deal with certain emergency situations such as load shortages, the proposed method is used to evaluate the STLM potential.
5.1.1 Migration results
The power spatiotemporal changes in each DC before and after migration are shown in Figures 5A, B. Without loss of generality, the STLM characteristics and effects of DC1 are discussed in detail, and the following conclusions can be drawn:
1) After adopting the DVFS-DCSC STLM method, the migration effect of DC1 is obvious. During the valley period of task processing, DC1 operates with the minimum number of needed activated servers, resulting in minimal power variation. Conversely, during the peak period of task processing, the migration capacity of DC1 is limited by the optical network capacity and the processing capacity of other DCs, resulting in small power peaks.
2) The total number of tasks processed by all DCs before and after migration adheres to conservation. However, the power consumption reduction of DC1 is nonconservative with the power consumption increase of other DCs responsible for processing the migrated tasks. This is because the server’s dynamic power is proportional to the cube of the CPU operating frequency. Given identical processing tasks, higher frequencies result in greater power consumption.
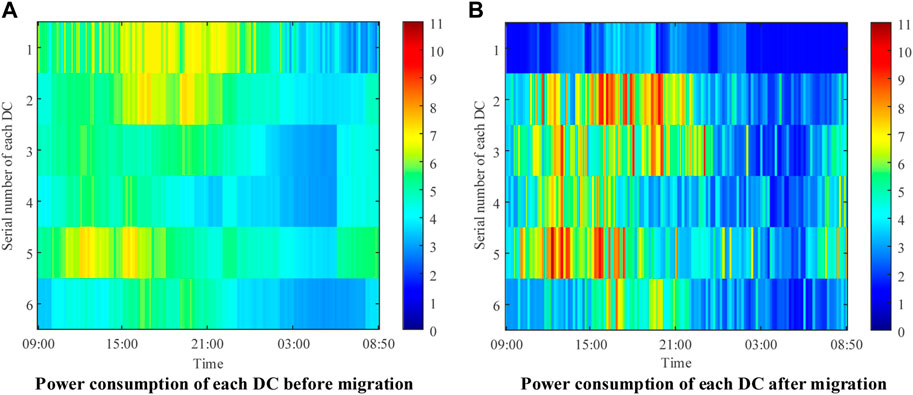
FIGURE 5. Comparison results before and after migration.
The case study compares the migration effect of three scheduling strategies: time-domain migration, STLM and STLM considering the DVFS-DCSC energy management strategy. Figure 6 shows the power curve of DC1 after adopting various control strategies. The results show that the power consumption of DC1 with the STLM mechanism is reduced by 32.83% compared to that of only time-domain migration. However, the DVFS-DCSC method not only reduces the power consumption of DC1 but also improves the ability to bear the workload of other DCs. As shown in this figure, adopting the STLM mechanism considering the DVFS-DCSC energy management strategy proposed in this paper, compared with the STLM mechanism and time-domain migration mechanism alone, the power consumption of DC1 is reduced by 37.96% and 58.33%, respectively. Therefore, the STLM potential of DCs can be significantly enhanced through the proposed method.
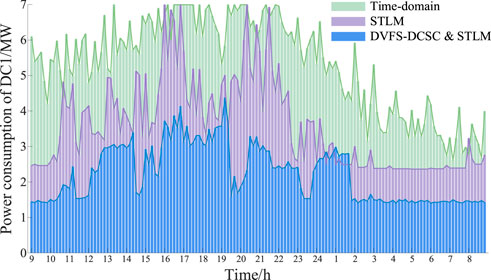
FIGURE 6. Comparison results under different migration methods.
5.1.2 Migration and processing of delay-tolerant tasks
Figures 7A, B display the migration and processing plans of DC1’s delay-tolerant tasks. The comparison between the two figures reveals some incongruities in the tasks processed and received by destination DCs during the same time period. This difference arises due to the tasks' inherent tolerance for delays, whereby they may be temporarily stored in the hard disks of servers with no immediate processing needed and subsequently dispatched for processing at an optimal time. Figure 7A shows that the number of tasks migrated from DC1 in each period changes roughly according to its original plan of task arrival, but the overall change is not large. This is because DC1 has only two links connected to other DCs, and its migration potential is limited by the bandwidth of links (1,2) and (1,6). For example, at 14:50, the tasks are almost all migrated to DC2 and DC3. At this time, links (1,2) and (1,6) have no idle transmission capacity, with the consequence that more tasks cannot be migrated outside. DC5 has four links connected to other DCs, so its STLM potential is more considerable than that of DC1.
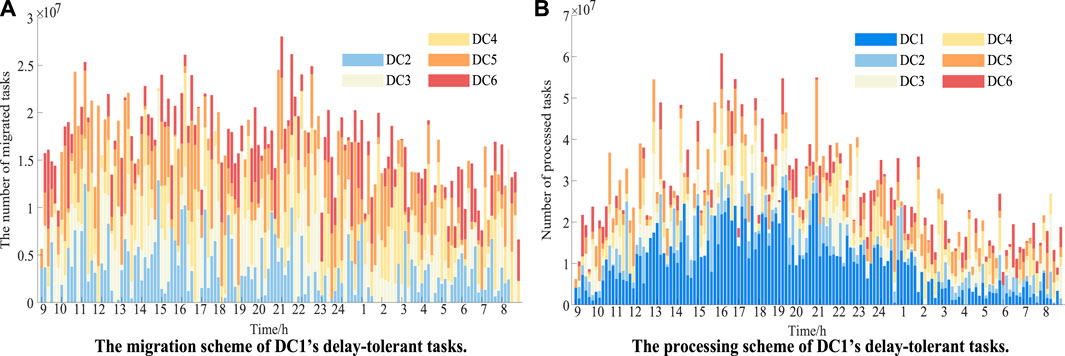
FIGURE 7. The migration and processing schemes of DC1’s delay-tolerant tasks.
5.1.3 Influence of migration on the server operating state
For a single DC, the change in the operating state of each server is the direct cause of the change in the power consumption. The DVFS-DCSC STLM mechanism changes the CPU operating frequency and the number of active servers in each DC to enhance the STLM potential of DCs. The number of servers turned on by each DC is shown in Figure 8. As exemplified by DC1 and DC5, their server operating status and frequency are shown in Figures 9A, B, respectively. At the peak time of task processing, almost all servers are turned on by each DC. At the valley of task processing, to reduce power consumption, the servers turned on by DC1 and 5 are mostly under operating frequency f1, and a small part is under other frequencies. During peak hours, the migration capacity of DC1 is limited, and some tasks that cannot be migrated outside need to be handled locally. Therefore, more servers are turned on and operate under the operating frequency f2. DC5 is in a heavy-load state after receiving the tasks migrated from DC1, and many servers are under operating frequency f5, which makes its power consumption at a rather high level.
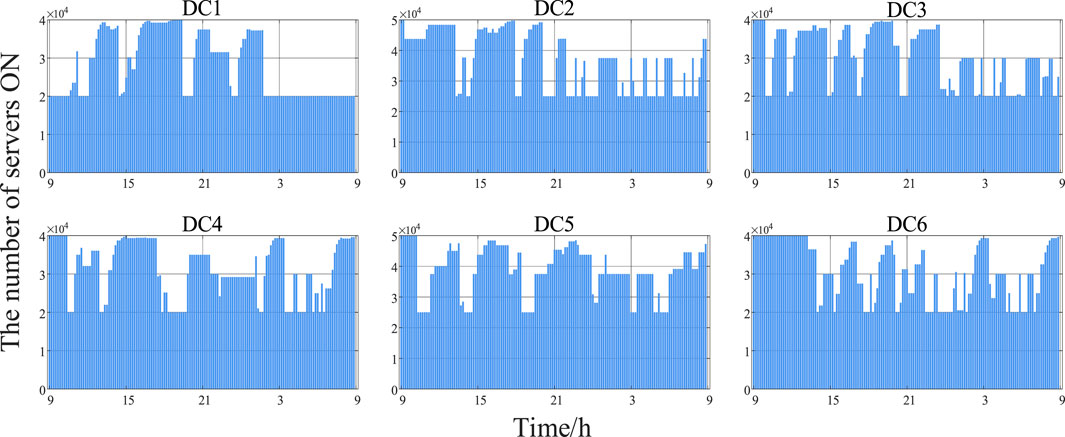
FIGURE 8. The number of active servers in each DC in each period.
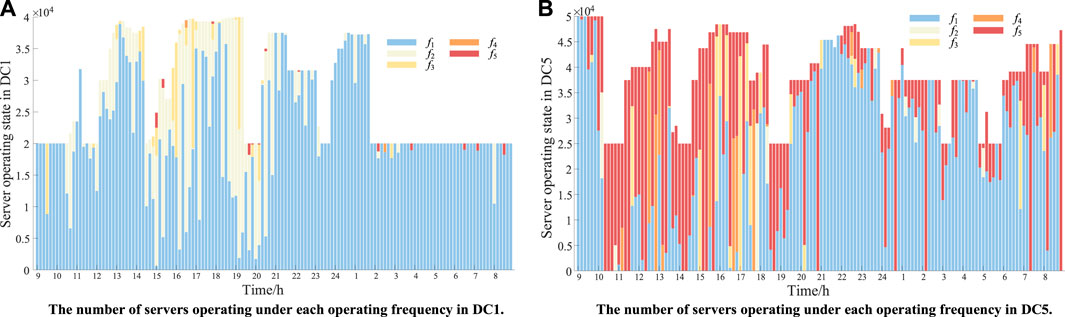
FIGURE 9. The number of servers operating under each operating frequency in DC1 and DC5.
5.1.4 Total power consumption before and after load migration
As shown in Figure 10, after adopting this method to maximize the STLM potential of DC1 (as shown by the blue line), the total power consumption of all DCs and NEs decreases compared to the pre-migration stage without an energy management strategy, depicted by the pink line. This reduction occurs because the energy consumption modes of all DCs are optimized during the migration process. However, if all DCs have already adopted the DVFS-DCSC method for energy consumption optimization before migration (as shown by the yellow line), the total power consumption after migration will be considerably higher than that before migration. This implies that maximizing the STLM potential of DCs will involve certain economic sacrifices and may lead to increased carbon emissions within the entire DC network. This is because in the peak period of task processing, the destination DCs are already heavily burdened with their own processing workloads. At this time, to continue processing tasks from DC1, more servers must be turned on, and the CPU operating frequency must be scaled to a higher level. The tasks that can be processed by DC1 under a lower operating frequency can only be completed under a higher operating frequency in other destination DCs, which explains why the overall energy consumption will increase after migration. Therefore, to ensure the overall economy and low-carbon emissions, grid operators should retain part of the STLM potential when formulating the demand response scheme. The remaining STLM potential can be exploited and applied in emergency dispatching scenarios.

FIGURE 10. The total power consumption of DCs and NEs before and after migration.
5.2 Day-ahead scheduling strategy for minimum carbon emissions
5.2.1 Scheduling results
The total carbon emissions of all DCs and optical networks before and after DVFS-DCSC & STLM scheduling are compared, as shown in Figure 11. Compared with the time-domain migration method and DVFS-DCSC technology alone, the total carbon emissions are reduced by 32.92% and 10.21%, respectively, after adopting the proposed method.
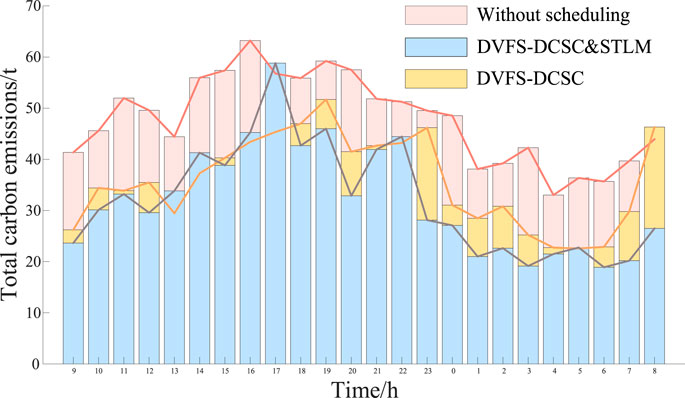
FIGURE 11. Comparison results of total carbon emissions before and after migration.
As displayed in Figure 12, after scheduling with the DVFS-DCSC STLM, the average utilization rate of the CPU is increased from 39.89% to 83.14%, which effectively reduces the number of redundant servers and total power consumption. Most of the time after migration, the average utilization rate of CPU has reached more than 70%. For the moment of low utilization, even if there are fewer workloads allocated for processing, the number of servers each DC turns on must exceed the minimum requirement.
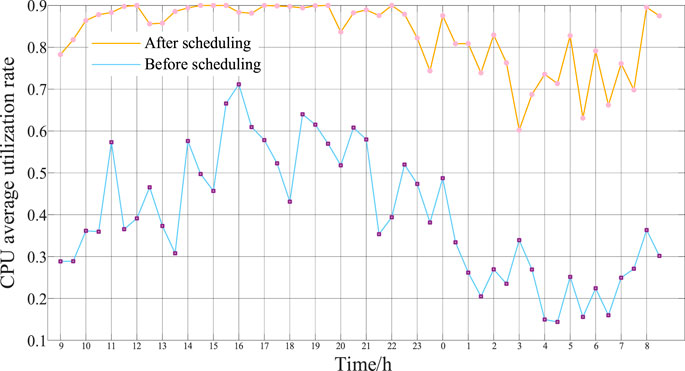
FIGURE 12. Comparison results of the CPU average utilization rate before and after scheduling.
5.2.2 Influence of migration on the server operating state
To illustrate the impact of the proposed scheduling scheme on the operating state of the server, we take the 7th type of task (with the maximum response time of 8 h shown in Figure A3 in Appendix) as an example and obtain the processing results in each time period according to matrix An in Eq. 13, which is shown in Figure 13. In this figure, each row represents the batch processing plan of the incoming tasks at one point, and each column represents the number and composition of tasks completed at each time, which indicates that this type of task has a great ability for temporal migration. That is, we can intuitively obtain the temporal migration results of different delay-tolerant tasks in this scheduling scheme.
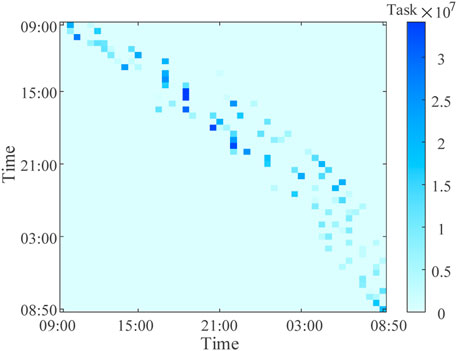
FIGURE 13. Processing results of the 7th type of task in each time period.
However, the delay-tolerant tasks with a long time of tmax, such as 4 h or 8 h, account for a small proportion. That is, the overall ability for time-domain (temporal) migration of all tasks is relatively weak. Meanwhile, due to the unobvious spatiotemporal differences in the task arrangement among DCs, the purpose of the STLM in day-ahead scheduling is to spread the tasks handled by each DC equitably, thereby minimizing the number of active servers and maintaining low-frequency server operation as much as possible. In each time period, the number of active servers in each DC is shown in Figure 14. As exemplified by DC1 and DC5, in contrast to the case study of potential evaluation, the server operating states of these two DCs are relatively close, are shown in Figures 15A, B, respectively. Since the task allocation plan of DC1 has more tasks than those of other DCs and other DCs are already in heavy loads during the peak of task processing, it is not necessary to migrate more tasks but to process them locally.

FIGURE 14. The number of active servers in each DC in each time period.
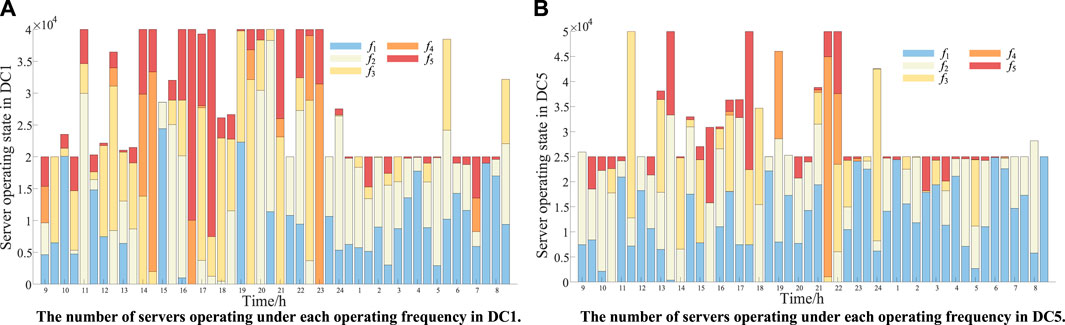
FIGURE 15. The number of servers operating under each operating frequency in DC1 and DC5.
6 Conclusion
Due to the great spatiotemporal flexibility of data loads, this paper proposes an approach to evaluate the STLM potential of DCs. The proposed model is further applied to the day-ahead scheduling of urban DCs, minimizing daily carbon emissions. The case study verifies the effectiveness of the STLM model and energy management strategy. The following conclusions are drawn:
1) The spatiotemporal redistribution of delay-tolerant tasks, as well as server ON/OFF scheduling and CPU operating frequency scaling in different spatial locations, provides DCs with STLM potential.
2) Due to the operating characteristics of the servers, the utilization of STLM potential is often accompanied by increased energy consumption, which comes at the cost of the economy of the entire system. However, in an emergency, DCs need to provide power support with maximum STLM potential, regardless of the economy.
3) In the day-ahead scheduling of urban DCs, in contrast to emergency control, the purpose of the STLM is to spread the tasks handled by each DC evenly in space, reducing the number of servers turned on and increasing the proportion of servers that operate under low frequencies.
The STLM potential evaluation model of DCs and the proposed day-ahead scheduling scheme provide a novel approach to exploring spatiotemporal flexible resources. Considering the significant differences between DCs and other forms of spatially flexible loads, subsequent research must be undertaken to devise a collaborative scheduling strategy for managing diverse spatially flexible loads.
Data availability statement
The original contributions presented in the study are included in the article/supplementary material, further inquiries can be directed to the corresponding author.
Author contributions
LZ: Conceptualization, Data curation, Formal Analysis, Writing–original draft. SW: Data curation, Investigation, Methodology, Validation, Writing–original draft. HL: Methodology, Resources, Software, Visualization, Writing–original draft. QW: Methodology, Project administration, Supervision, Writing–review and editing. YT: Supervision, Writing–review and editing.
Funding
The author(s) declare that no financial support was received for the research, authorship, and/or publication of this article.
Conflict of interest
The authors declare that the research was conducted in the absence of any commercial or financial relationships that could be construed as a potential conflict of interest.
Publisher’s note
All claims expressed in this article are solely those of the authors and do not necessarily represent those of their affiliated organizations, or those of the publisher, the editors and the reviewers. Any product that may be evaluated in this article, or claim that may be made by its manufacturer, is not guaranteed or endorsed by the publisher.
References
Chen, M., Gao, C., Li, Z., Shahidehpour, M., Zhou, Q., Chen, S., et al. (2021a). Aggregated model of data network for the provision of demand response in generation and transmission expansion planning. IEEE Trans. Smart Grid 12 (1), 512–523. doi:10.1109/tsg.2020.3015475
Chen, M., Gao, C., Shahidehpour, M., and Li, Z. (2021c). Incentive-compatible demand response for spatially coupled internet data centers in electricity markets. IEEE Trans. Smart Grid 12 (3), 3056–3069. doi:10.1109/tsg.2021.3053433
Chen, S., Li, P., Ji, H., Yu, H., Yan, J., Wu, J., et al. (2021b). Operational flexibility of active distribution networks with the potential from data centers. Appl. Energy 293, 116935. doi:10.1016/j.apenergy.2021.116935
Cupelli, L., Schütz, T., Jahangiri, P., Fuchs, M., Monti, A., and Müller, D. (2018). Data center control strategy for participation in demand response programs. IEEE Trans. Ind. Inf. 14 (11), 5087–5099. doi:10.1109/tii.2018.2806889
Danilak, R. (2017). Why energy is a big and rapidly growing problem for data centers. Boston, MA, USA: Forbes Technology Council.
Dayarathna, M., Wen, Y., and Fan, R. (2016). Data center energy consumption modeling: a survey. IEEE Commun. Surv. Tut 18 (1), 732–794. doi:10.1109/comst.2015.2481183
Deylamsalehi, A., Davis, D. A. P., Afsharlar, P., Bahrami, M., Chen, W., and Vokkarane, V. M. (2018). Using machine learning to balance energy cost and emissions in optical networks. J. Opt. Commun. Netw. 10 (10), D72–D83. doi:10.1364/jocn.10.000d72
Fan, H., Wang, H., Xia, S., Li, X., Xu, P., and Gao, Y. (2021). Review of modeling and simulation methods for cyber physical power system. Front. Energy Res. 9, 642997. doi:10.3389/fenrg.2021.642997
Fu, Y., Han, X., Baker, K., and Zuo, W. (2020). Assessments of data centers for provision of frequency regulation. Appl. Energy 277, 115621. doi:10.1016/j.apenergy.2020.115621
Gu, L., Zeng, D., Barnawi, A., Guo, S., and Stojmenovic, I. (2015). Optimal task placement with QoS constraints in geo-distributed data centers using DVFS. IEEE Trans. Comput. 64 (7), 2049–2059. doi:10.1109/tc.2014.2349510
Guo, C., Luo, F., Cai, Z., Dong, Z.-Y., and Zhang, R. (2021a). Integrated planning of internet data centers and battery energy storage systems in smart grids. Appl. Energy 281, 116093. doi:10.1016/j.apenergy.2020.116093
Guo, C., Xu, K., Shen, G., and Zukerman, M. (2021b). Temperature-aware virtual data center embedding to avoid hot spots in data centers. IEEE Trans. Green Commun. Netw. 5 (1), 497–511. doi:10.1109/tgcn.2020.3015234
Han, H., Wei, T., Wu, C., Xu, X., Zang, H., Sun, G., et al. (2022). A low-carbon dispatch strategy for power systems considering flexible demand response and energy storage. Front. Energy Res. 10, 883602. doi:10.3389/fenrg.2022.883602
Jin, C., Bai, X., Yang, C., Mao, W., and Xu, X. (2020). A review of power consumption models of servers in data centers. Appl. Energy 265, 114806. doi:10.1016/j.apenergy.2020.114806
Kwon, S. (2020). Ensuring renewable energy utilization with quality of service guarantee for energy-efficient data center operations. Appl. Energy 176, 115424. doi:10.1016/j.apenergy.2020.115424
Li, J., Li, Z., Ren, K., and Liu, X. (2012). Towards optimal electric demand management for internet data centers. IEEE Trans. Smart Grid 3 (1), 183–192. doi:10.1109/tsg.2011.2165567
Liu, H., Liu, B., Yang, L. T., Lin, M., Deng, Y., Bilal, K., et al. (2018). Thermal-aware and DVFS-enabled big data task scheduling for data centers. IEEE Trans. Big Data 4 (2), 177–190. doi:10.1109/tbdata.2017.2763612
Liu, S., Zhao, T., Liu, X., Li, Y., and Wang, P. (2022). Proactive resilient day-ahead unit commitment with cloud computing data centers. IEEE Trans. Ind. Appl. 58 (2), 1675–1684. doi:10.1109/tia.2022.3145761
Liu, Y., Lei, S., and Hou, Y. (2019). Restoration of power distribution systems with multiple data centers as critical loads. IEEE Trans. Smart Grid 10 (5), 5294–5307. doi:10.1109/tsg.2018.2880255
Long, S., Li, Y., Huang, J., Li, Z., and Li, Y. (2022). A review of energy efficiency evaluation technologies in cloud data centers. Energy Build. 260, 111848. doi:10.1016/j.enbuild.2022.111848
Lyu, J., Zhang, S., Cheng, H., Yuan, K., Song, Y., and Fang, S. (2021). Optimal sizing of energy station in the multienergy system integrated with data center. IEEE Trans. Ind. Appl. 57 (2), 1222–1234. doi:10.1109/tia.2021.3054607
Ma, M., Huang, H., Song, X., Peña-Mora, F., Zhang, Z., and Chen, J. (2022). Optimal sizing and operations of shared energy storage systems in distribution networks: a bi-level programming approach. Appl. Energy 307, 118170. doi:10.1016/j.apenergy.2021.118170
Martijn, K., and Fons, W. (2021). Usage impact on data center electricity needs: a system dynamic forecasting model. Appl. Energy 291, 116798. doi:10.1016/j.apenergy.2021.116798
Song, Y., Chen, F., Xia, M., and Chen, Q. (2022). The interactive dispatch strategy for thermostatically controlled loads based on the source-load collaborative evolution. Appl. Energy 309, 118395. doi:10.1016/j.apenergy.2021.118395
Sun, G., Anand, V., Liao, D., Lu, C., Zhang, X., and Bao, N. H. (2013). Power-efficient provisioning for online virtual network requests in cloud-based data centers. IEEE Syst. J. 9 (2), 427–441. doi:10.1109/jsyst.2013.2289584
Wang, H., Wang, Q., Tang, Y., and Ye, Y. (2022). Spatial load migration in a power system: concept, potential and prospects. Int. J. Electr. Power Energy Syst. 140, 107926. doi:10.1016/j.ijepes.2021.107926
Wang, S., Qian, Z., Yuan, J., and You, I. (2017). A DVFS based energy-efficient tasks scheduling in a data center. IEEE Access 5, 13090–13102. doi:10.1109/access.2017.2724598
Yang, T., Jiang, H., Hou, L., and Geng, Y. (2022). Study on carbon neutrality regulation method of interconnected multi-datacenter based on spatio-temporal dual-dimensional computing load migration. Proc. CSEE 42 (1), 164–177. doi:10.13334/j.0258-8013.pcsee.210485
Yang, T., Zhao, Y., Pen, H., and Wang, Z. (2018). Data center holistic demand response algorithm to smooth microgrid tie-line power fluctuation. Appl. Energy 231, 277–287. doi:10.1016/j.apenergy.2018.09.093
Yu, L., Jiang, T., and Cao, Y. (2015). Energy cost minimization for distributed Internet data centers in smart microgrids considering power outages. IEEE Trans. Parallel Distrib. Syst. 26 (1), 120–130. doi:10.1109/tpds.2014.2308223
Yuan, Q., Ye, Y., Tang, Y., Liu, Y., and Strbac, G. (2022). A novel deep-learning based surrogate modeling of stochastic electric vehicle traffic user equilibrium in low-carbon electricity-transportation nexus. Appl. Energy 315, 118961. doi:10.1016/j.apenergy.2022.118961
Zhang, J., Zhao, Y., Yu, X., Zhang, J., Song, M., Ji, Y., et al. (2015). Energy-efficient traffic grooming in sliceable-transponder-equipped IP-Over-Elastic optical networks [invited]. J. Opt. Commun. Netw. 7 (1), 142–152. doi:10.1364/jocn.7.00a142
Zhou, Z., Liu, F., Zou, R., Liu, J., Xu, H., and Jin, H. (2016). Carbon-aware online control of geo-distributed cloud services. IEEE Trans. Parall Distr Syst. 27 (9), 2506–2519. doi:10.1109/tpds.2015.2504978
Appendix

FIGURE A1. PV generation and loads of an urban power system.
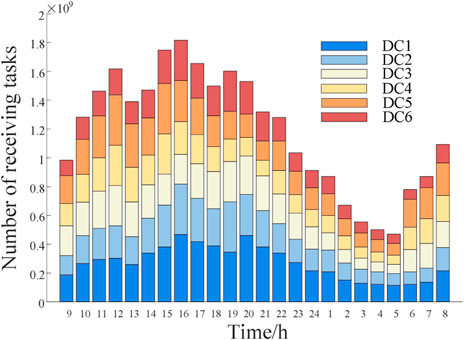
FIGURE A2. Number of workloads in each DC in each time period.
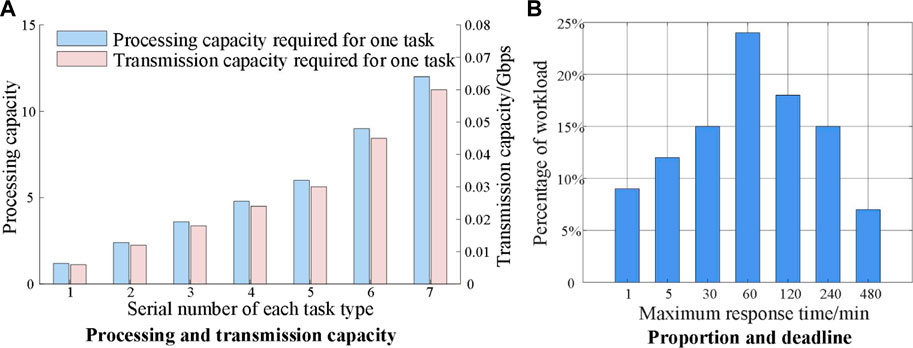
FIGURE A3. Parameters of each type of task.
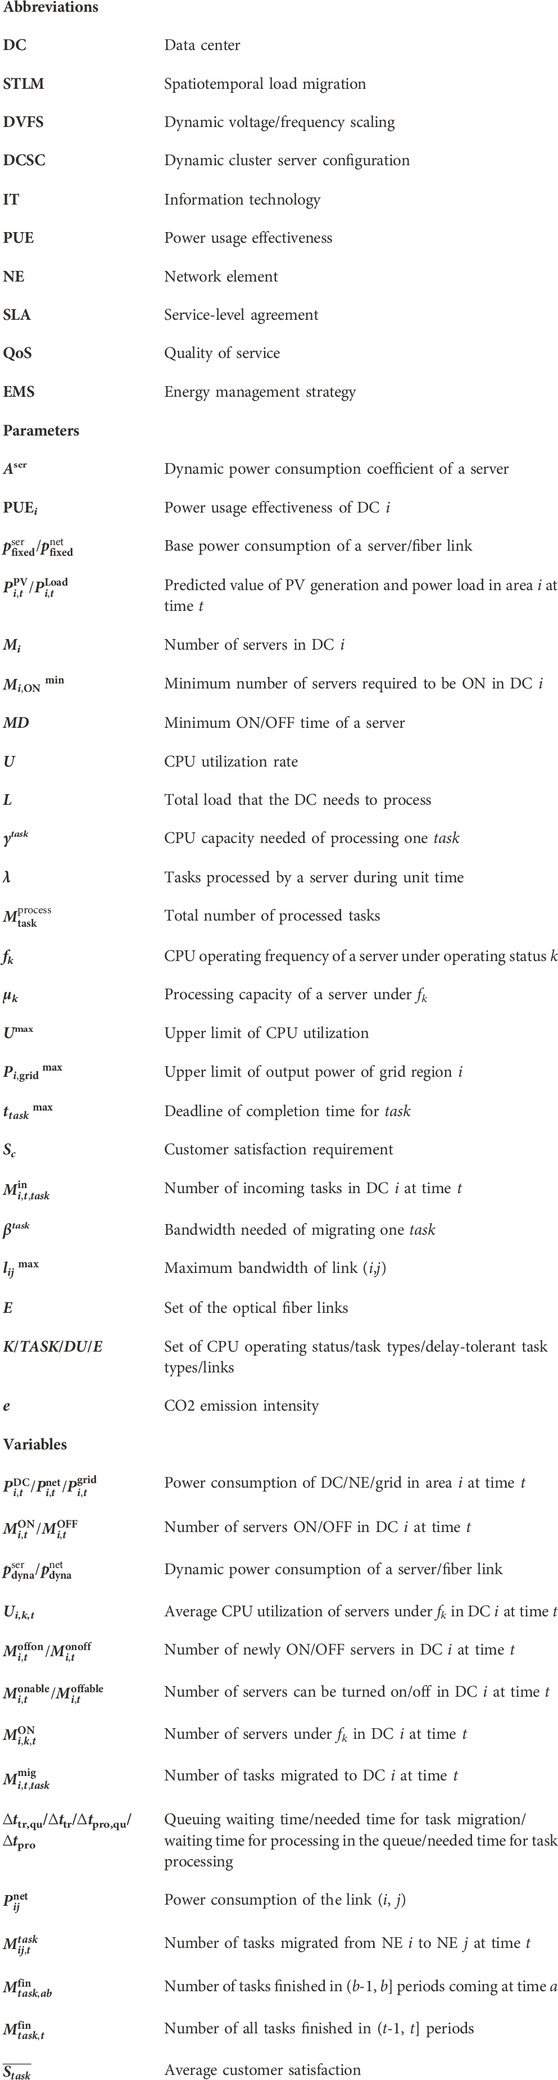
Nomenclature
Keywords: data centers, spatio-temporal load migration, potential evaluation, energy management strategy, flexibility
Citation: Zhu L, Wu S, Liu H, Wang Q and Tang Y (2023) Spatio-temporal load migration potential of data centers: Evaluation and application. Front. Energy Res. 11:1289275. doi: 10.3389/fenrg.2023.1289275
Received: 05 September 2023; Accepted: 16 October 2023;
Published: 08 November 2023.
Edited by:
Shuai Yao, Cardiff University, United KingdomCopyright © 2023 Zhu, Wu, Liu, Wang and Tang. This is an open-access article distributed under the terms of the Creative Commons Attribution License (CC BY). The use, distribution or reproduction in other forums is permitted, provided the original author(s) and the copyright owner(s) are credited and that the original publication in this journal is cited, in accordance with accepted academic practice. No use, distribution or reproduction is permitted which does not comply with these terms.
*Correspondence: Shutan Wu, wushutan@seu.edu.cn