 Jianhua Liu
 Tianle Shi
 Zhengmeng Hou3,4
 Liangchao Huang
- 1School of Management, Zhengzhou University, Zhengzhou, China
- 2Yellow River Institute for Ecological Protection & Regional Coordinated Development, Zhengzhou University, Zhengzhou, China
- 3Sino-German Research Institute of Carbon Neutralization and Green Development, Zhengzhou University, Zhengzhou, China
- 4Institute of Subsurface Energy Systems, Clausthal University of Technology, Clausthal-Zellerfeld, Germany
This study employs DMSP-OLS and NPP-VIIS nighttime light remote sensing data to develop a carbon emission regression model based on energy consumption, analyzing the spatiotemporal evolution of carbon emissions in 57 cities within the Yellow River Basin from 2012 to 2021. The analysis uses a quantile regression model to identify factors affecting carbon emissions, aiming to enhance the basin’s emission mechanism and foster low-carbon development. Key findings include: 1) Carbon emissions from energy consumption increased in this period, with a decreasing growth rate. 2) Emissions were concentrated along the Yellow River and its tributaries, forming high-density carbon emission centers. 3) The Yellow River Basin has mainly formed a “high-high” agglomeration area centered on resource-based cities such as Shanxi and Inner Mongolia’s coal, and a “low-low” agglomeration area centered on Gansu and Ningxia. The standard deviation ellipse of carbon emissions in the Yellow River Basin generally extends from east to west, and its center of gravity tends to move northward during the study period. 4) Technological innovation, economic development, and population agglomeration suppressed emissions, with digital economy and foreign investment increasing them in certain cities. Urbanization correlated positively with emissions, but adjusting a single industrial structure showed insignificant impact.
1 Introduction
The environmental issues caused by greenhouse gas emissions are becoming increasingly severe, and the development of a low-carbon economy has reached a consensus (Jia et al., 2019; Liu P. et al., 2023; Hou et al., 2023). The Chinese government continues to plan and design low-carbon development paths and strategies, clearly incorporating the carbon peak carbon neutrality target into the overall layout of ecological civilization construction(Ding et al., 2019; Pan, 2021). At this stage, there are obvious regional differences in China’s economic development, population size, energy consumption, and industrial structure, and the requirements for carbon emissions and energy conservation and emission reduction are also different (Yang et al., 2020; Liu et al., 2022a). The Yellow River Basin is an important ecological barrier, economic zone, energy and chemical base, and food production base in China, and it is of great significance for the overall realization of ecological protection, economic and social development, and ecological civilization construction in China (Deng et al., 2019a). However, the economic development of the Yellow River Basin mainly relies on the energy and chemical industry, the scale of high-knowledge-content strategic emerging industries is small, and in addition, the contradiction between ecological environment protection and high-quality development in this region is prominent, making it one of the typical regions for carbon reduction in China (Deng et al., 2019b). How to achieve green and low-carbon development, transform the economic development mode, and improve the energy consumption structure in the Yellow River Basin should be the essence of realizing high-quality development in the entire basin. Therefore, under the “dual carbon” goal, accurately grasping the temporal and spatial evolution characteristics of carbon emissions in the prefecture-level cities of the Yellow River Basin and its influencing factors, and then formulating more reasonable carbon reduction countermeasures, can provide an important basis for the construction of a low-carbon ecological basin.
At present, many scholars have conducted extensive research on carbon emissions and their driving mechanisms, with research areas involving multiple scales such as global, national, provincial, and city levels (Zhang et al., 2022; Zhou et al., 2022; Liu et al., 2023; Shi et al., 2023). The research content mainly includes the measurement of carbon emissions, temporal and spatial dynamic evolution, and analysis of influencing factors (Du et al., 2021; Ji et al., 2022; Song et al., 2023). In terms of research methods, carbon emissions are often estimated by carbon emission inventory estimation, input-output models, and panel data models (Su and Ang, 2015; Guo et al., 2016; Chen et al., 2020), while spatial differences in carbon emissions are explored using Gini coefficients, variation coefficients, Theil indexes, etc., (Chen et al., 2016; Liu et al., 2020; He et al., 2022). Based on this, the driving mechanism of carbon emissions is discussed using DID double-difference models, LMDI decomposition methods, Tapio decoupling models, STIRPAT models, and geographically weighted regressions (Jia et al., 2009; Wang et al., 2017; Ma and Cai, 2019; Liu, 2022). However, the validity of regional statistical data has always been a core issue in the study of carbon emission methods. The rapid development of global nighttime light image data has effectively addressed the lack of related regional statistical data. Some scholars have conducted research on economic development, population estimation, energy consumption, resource utilization, etc., based on nighttime light remote sensing data (Xiao et al., 2018; Du et al., 2021). Other scholars have used nighttime light remote sensing data to explore carbon emissions and their spatiotemporal evolution characteristics, but there are problems with the goodness of fit and simulation effects of linear regression models estimating carbon emissions using nighttime light remote sensing data (Jiang et al., 2023; Yang et al., 2023).
While the aforementioned research has provided valuable references for simulating carbon emissions with nighttime light remote sensing data, there are still some deficiencies: 1) Carbon emissions research based on traditional statistical data is often limited to the national or provincial level due to data limitations, making it difficult to refine to the spatial scale, which in turn is unable to provide more robust support for the formulation of regional and differentiated carbon reduction policies. 2) A river basin, as a natural-social integrated system formed by the connection of rivers, has interrelated resources and environments within it. However, existing research on carbon emissions at the basin scale is relatively rare, overlooking the relevance of low-carbon development of basin geographical units and the importance of systematic emission reduction. Therefore, this study calibrates and fits DMSP-OLS and NPP-VIIS annual nighttime light remote sensing data to obtain a long-time series of nighttime light remote sensing data from 2012 to 2021. It constructs a carbon emission regression estimation model based on energy consumption, and systematically analyzes the temporal and spatial evolution patterns of carbon emissions in 57 prefecture-level cities in the Yellow River Basin. Using a quantile regression model, the study explores the factors influencing carbon emissions, in the hope of providing a reference for further enhancing and improving the basin’s emission mechanism and promoting high-quality low-carbon development in the basin.
This paper makes contributions resides in several aspects: 1) The application of nighttime light data to the measurement of energy-related carbon emissions, which addressed the lack of statistical carbon emission data accuracy; 2) Carried out carbon emission-related research from the perspective of river basins, which contributed useful supplement to the correlation of low-carbon development in geographical units of river basin, thus reflecting the importance of systematic emission reductions; 3) Through methods such as spatial autocorrelation and, standard deviation ellipses, the spatial and temporal evolution of carbon emissions is more precisely depicted at the municipal scale, while the understanding of the differences in the spatial and temporal distribution patterns of carbon emissions is improved; 4) Based on the Stochastic Impacts by Regression on Population, Affluence and Technology (STIRPAT) model framework and the Environmental Kuznets Curve (EKC) hypothesis, the panel quantile regression model is used to quantify the nonlinear impact of socioeconomic factors on carbon emissions, to reveal the differences in the implementation effects of energy-saving and emission-reduction measures under different carbon emission levels, and provide a theoretical basis for the implementation of stage-specific carbon emission reduction measures.
2 Materials and methods
2.1 Study area and data source
The Yellow River, the mother river of the Chinese nation, and its basin constitute a crucial economic corridor for China’s “Belt and Road” initiative. This basin is an essential economic link covering eastern, central, and western provinces and plays a vital role in national economic and social development and ecological protection. The Yellow River Basin includes nine provinces and regions, namely, Qinghai, Sichuan, Gansu, Ningxia, Inner Mongolia, Shanxi, Shaanxi, Henan, and Shandong (Liu et al., 2022b). This study delineates the scope of the Yellow River Basin based on the natural river basin’s support, considering the integrity of regional research units and the direct association of regional economies with the Yellow River. The study focuses on 57 prefecture-level cities located in the core areas of the main stream and major tributaries of the Yellow River Basin, as shown in Figure 1.
(1) The non-radiometrically calibrated DMSP-OLS nighttime stable light data have a pixel grayscale value range of 0–63 and a spatial resolution of 30″. The NPP-VIIRS nighttime light remote sensing data have a spatial resolution of 15″and are monthly scale data. Both types of nighttime light remote sensing data are sourced from the official website of the National Geophysical Data Center (NGDC) of the National Oceanic and Atmospheric Administration (NOAA) of the United States.
(2) The various statistical data mainly come from city (state) urban statistical yearbooks, city (state) national economic and social development statistical bulletins, and bulletins from relevant units of city (state) statistical bureaus and environmental protection bureaus, “China Energy Statistical Yearbook,” and “China City Statistical Yearbook.” Some missing data have been filled using mean values of adjacent years or interpolation methods.
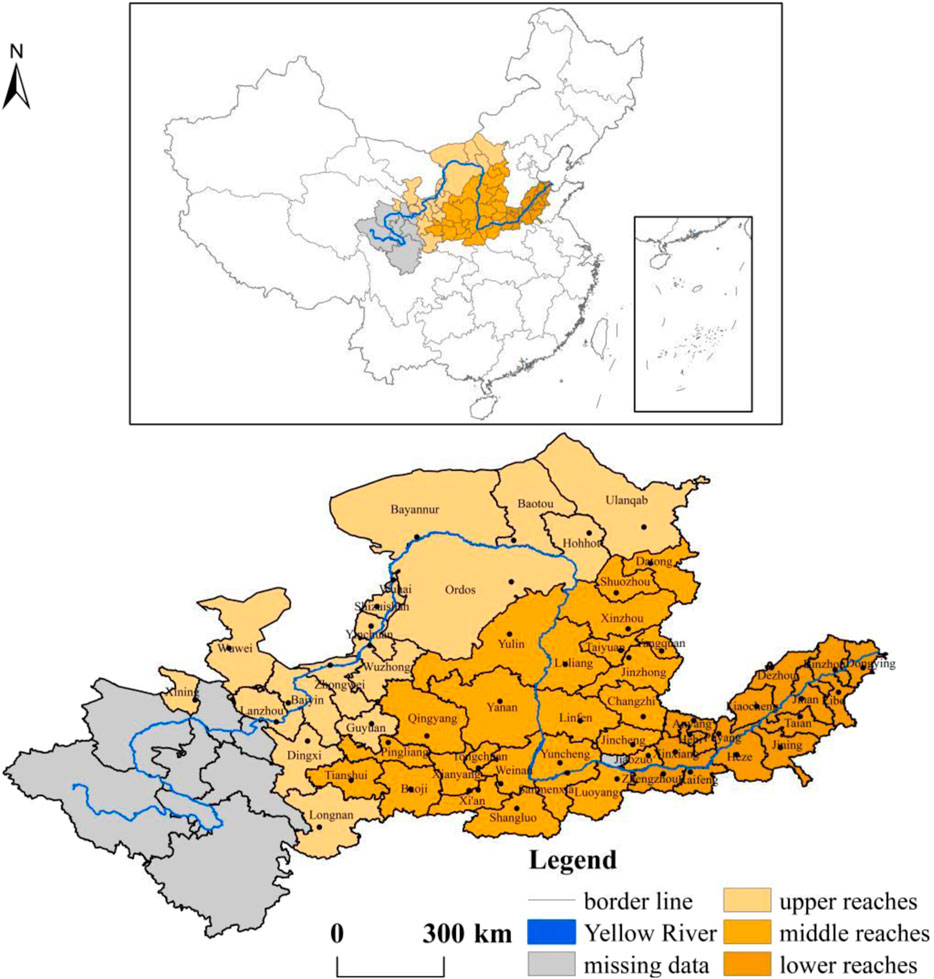
FIGURE 1. Map of the study area.
2.2 Calibration and processing of nighttime light remote sensing data
(1) DMSP-OLS data preprocessing. Firstly, the image reprojection, resampling, and cropping of 2012–2013 DMSP-OLS data were performed (Ash and Mazur, 2020), yielding light data within the administrative boundary of the Yellow River Basin. Secondly, inter-image mutual calibration was performed. The city of Zhengzhou, Henan Province, which has relatively stable socio-economic development, was selected as the invariant target area. The 2011 data was selected as the reference dataset, and a quadratic regression model was constructed with other years for the second in-year fusion calibration, aiming to resolve the issue of inconsistency among nighttime light images from different satellites (Ma et al., 2020). After temporal sequence calibration, the corrected DMSP-OLS nighttime light remote sensing data for the Yellow River Basin from 2012 to 2013 were obtained.
(2) NPP-VIIRS data preprocessing. Firstly, the image annual synthesis, reprojection, resampling, and cropping of 2012–2021 NPP-VIIRS data were performed to match the spatial resolution of DMSP-OLS data (Liu et al., 2022). Secondly, stability calibration and outlier removal were performed for the invariant area. The stable light-emitting area of the 2016 synthesized data was chosen as the invariant area, and the 2012–2021 data underwent stability calibration. After temporal sequence calibration, the corrected NPP-VIIRS nighttime light remote sensing dataset for the Yellow River Basin from 2012 to 2021 was obtained.
(3) Fusion calibration of DMSP-OLS and NPP-VIIRS data. Firstly, the 2012–2013 data of DMSP-OLS and NPP-VIIRS at the city scale were statistically processed to yield two sets of light data. Secondly, a regression relationship was established between the 2012–2013 data of DMSP-OLS and NPP-VIIRS at the city scale. The parameters and goodness of fit of the regression for the two datasets are shown in Table 1.
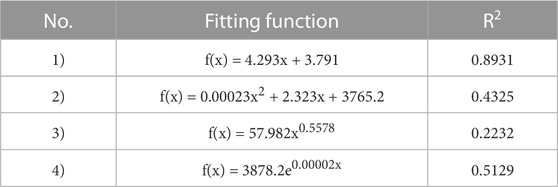
TABLE 1. Fitting parameter values for 2012 DMSP-OLS and NPP-VIIRS.
Among the models, model 1) has an R2 value of 0.8931, which is higher than that of the other models and indicates good accuracy. Therefore, model 1) was selected as the fitting equation for the dataset. The corrected formula is:
In the equation, f(x) represents the 2012–2013 annual data of DMSP-OLS nighttime light remote sensing, and x represents the 2012–2013 annual data of NPP-VIIRS nighttime light remote sensing. Based on this, downscaling grid correction was performed on the 2013–2021 NPP-VIIRS data. This method reconstructed a long-term, comparable dataset of DMSP-OLS and NPP-VIIRS nighttime light remote sensing, providing excellent data support for the long-term dynamic monitoring of carbon emissions characteristics.
2.3 Energy-related carbon emission estimation and accuracy verification
Given the types and distribution of energy in the Yellow River Basin, this study uses the calculation formula of the Intergovernmental Panel on Climate Change (IPCC) to estimate CO2 emissions (Monteiro et al., 2022). Coal, coke, crude oil, and other energy sources are used as representatives of the main consumed energy. The specific calculation method is as follows:
In the equation, CO2 represents carbon emissions, Ei represents the consumption of various types of energy, NCi represents the average low calorific value of the ith type of energy, CCi represents the carbon level per unit heat, and COFi represents the oxidation factor of the ith type of energy. 12 and 44 are the molecular weights of carbon and carbon dioxide, respectively. The energy consumption coefficients are as shown in Table 2.
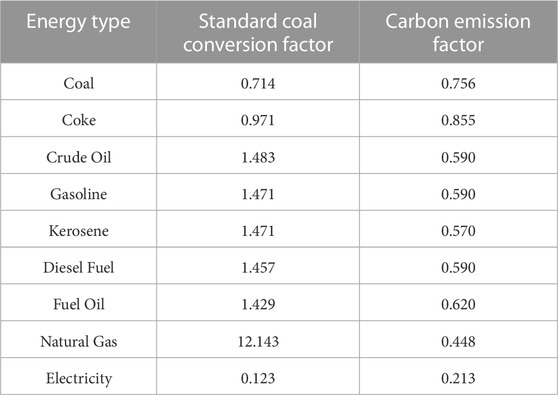
TABLE 2. Standard coal conversion degree and carbon emission degree of different energy sources.
Furthermore, the carbon emissions estimation model assumes that there is a linear relationship between DN values and carbon emissions; the larger the DN value, the larger the carbon emissions (Huang et al., 2023). There is a consistent correlation at the provincial, city, and county scales with the pixel scale. The estimation model is as follows:
In the equation,
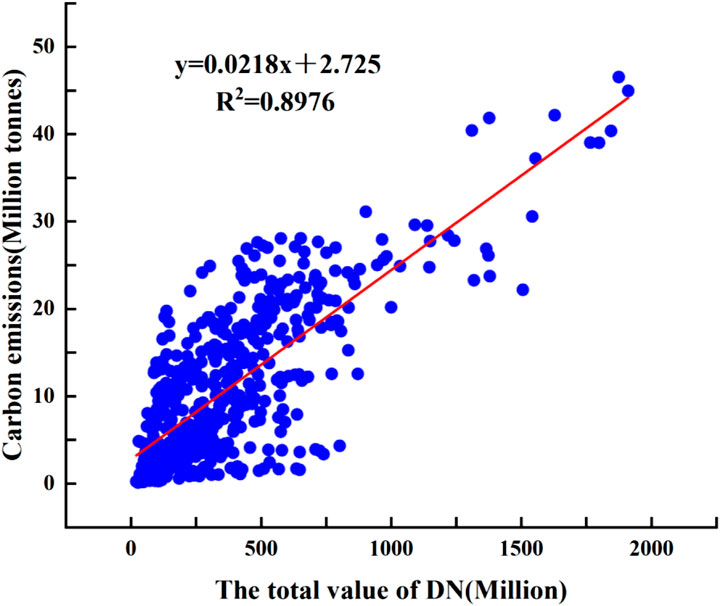
FIGURE 2. Fitting of statistical carbon emissions and DN values.
In the equation, Cp represents the carbon emissions of city p, and Dp represents the DN value of city p.
Due to limited available statistical data, many studies, such as those by Yu et al. (2022) and Xu et al. (2021), could not evaluate the accuracy of their estimation models at the city level. Based on the availability of data in this study, the accuracy of the estimation results at the city scale is evaluated. Correlation testing shows that the estimated carbon emissions have a significant correlation with the statistical values, with a coefficient of determination R2 of 0.9127. To verify the reliability of this result, the relative error between the estimated value of carbon emissions and the statistical value needs to be calculated. The result shows that the sample size with a relative error less than 20% exceeds 85%, meeting the estimation accuracy requirement. Therefore, the accuracy of estimation at the city scale is high, satisfying the research needs.
2.4 Moran’s index
Moran’s I is an important indicator to measure the spatial correlation of correlated variables (Liu et al., 2022). This study explores the spatial correlation and spatial agglomeration characteristics of carbon emissions in the Yellow River Basin by calculating the Global Moran’s I and Local Moran’s I.
2.4.1 Global Moran’s index
In the equation, n is the number of cities,
2.4.2 Local Moran’s index
Although the global Moran’s index can indicate whether there is spatial autocorrelation in carbon emissions in the Yellow River Basin, it cannot reveal the spatial agglomeration mode of carbon emissions in various cities (Lemmerz et al., 2023). Therefore, the local Moran’s index is used for further analysis.
In the equation, the meanings of
2.5 Standard deviation ellipse
The standard deviation ellipse can intuitively analyze the spatial expansion form of carbon emissions in the Yellow River Basin. The center of the ellipse can represent the center of carbon emissions distribution in the entire area, the area of the ellipse can characterize the concentration or dispersion of the city, and the azimuth angle can analyze the main driving direction of the city’s carbon emissions expansion in the entire area (Zhao et al., 2022). The formulas for calculating the area and azimuth angle of the ellipse center are as follows:
In the equation, xi and yi are the position coordinates of the ith feature, ai is the weight of the ith feature,
In the equation,
In the equation, θ is the azimuth angle of the standard deviation ellipse, rotating clockwise from the north direction is positive.
2.6 Panel quantile regression
The general panel regression follows the principle of ordinary least squares (OLS) estimation, essentially a conditional mean regression (Vélez-Henao et al., 2019). When the random error term of the regression conforms to economic assumptions such as normal distribution and zero mean, OLS satisfies the condition of the minimum variance unbiased estimate (Fu et al., 2022). When the data distribution is non-normal or the regression coefficients fluctuate greatly at different quantiles, quantile regression can capture the extent to which the explained variable y is affected at different quantile levels, making the estimation results more robust (Williamson et al., 2023).
Combining the relevant literature, this study selects seven factors - digital economy, technological innovation, industrial structure adjustment, economic development, population, foreign investment, and urbanization - to study their impact on carbon emissions (Liu et al., 2023; Rönkkö et al., 2023; Sun and Wu, 2023). The panel data of 57 prefecture-level cities in the Yellow River Basin from 2012 to 2021 are statistically analyzed, and the entropy method is used to process the influencing factors (see Table 3 for specific indicators). Considering the unity of dimensions and symmetry, all variables are log-transformed. Based on the STIRPAT model and the EKC theory hypothesis, this paper uses the panel quantile regression with fixed effects, and the specific expression is as follows:
In the formula: QklnCi represents the carbon emissions at the kth quantile; β is the coefficient of the control variable; lnDE represents the degree of digital economic development; lnTI represents technological innovation; lnIS represents the degree of industrial structure optimization, for specific indicators see Table 9; lnGDP represents the regional economic development situation; lnPOP represents the total population of the region; lnTrade represents the degree of foreign investment; lnUrb represents the urbanization rate. i = 1, … ,n.
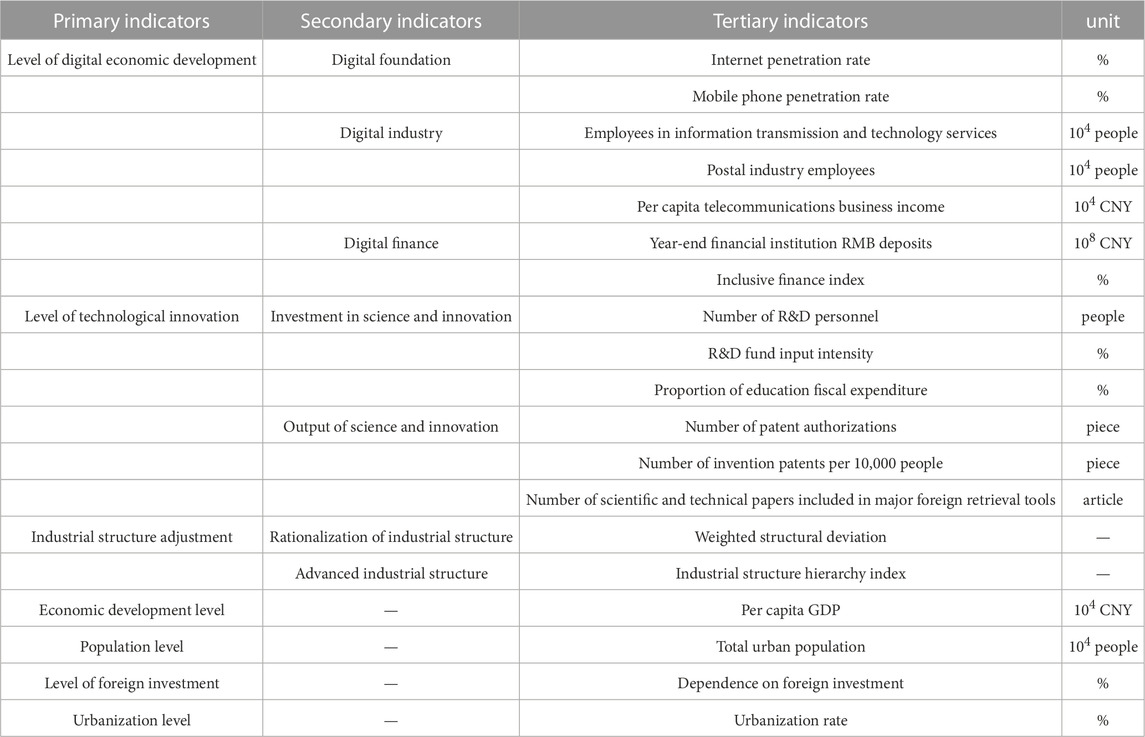
TABLE 3. Control variable indicators.
3 Manuscript formatting
3.1 Time series characteristics
As shown in Figure 3, from 2012 to 2021, the carbon emissions in the Yellow River Basin were on a growth trend, increasing from 558.85 million tonnes in 2012 to 1,685.49 million tonnes in 2021, with an average growth rate of 14.69%. The growth of carbon emissions was relatively slow from 2012 to 2014. In 2015, the carbon emissions in the Yellow River Basin decreased by 2.7% from the previous year, indicating that the emission reduction targets and tasks established by China at the 2015 Paris Climate Conference had some impact on the carbon emission reduction in the Yellow River Basin in the post-Kyoto era. After 2016, carbon emissions grew rapidly, but as time went on, the growth rate of carbon emissions slowed down. From 2019 to 2021, the average growth rate of carbon emissions was 4.19%, 71.45% lower than the average growth rate during the research period, indicating that the strategy of ecological protection and high-quality development in the Yellow River Basin has achieved remarkable results (Chen et al., 2023).
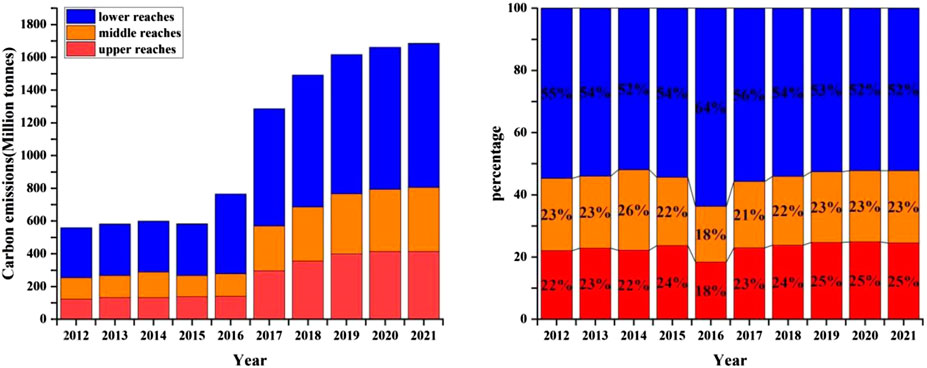
FIGURE 3. The trend of carbon emissions in the Yellow River Basin from 2012 to 2021.
Specifically, from 2012 to 2016, apart from the higher growth rate of carbon emissions in the downstream of the Yellow River Basin, the growth of carbon emissions in the middle and upper reaches was slow, and the carbon emissions in the middle reaches showed a negative growth trend. After 2016, carbon emissions in the upper, middle and lower reaches of the Yellow River Basin all showed significant growth. From the perspective of proportion, the proportion of downstream carbon emissions during the research period was always higher than 52%, indicating that the downstream has always been in the stage of pursuing rapid economic development, and the energy consumption brought about by this has driven the growth of carbon emissions. The proportion of carbon emissions in the middle and upper reaches did not significantly rise, and the middle and upper reaches have a strong dependence on energy. Although the implementation of energy-saving and emission-reduction policies has to some extent curbed the growth trend of carbon emissions, there is still a large space for carbon emission reduction.
3.2 Spatial distribution characteristics
Figure 4 is a spatial distribution map of carbon emissions in the Yellow River Basin from 2012 to 2021, simulated based on night-time light remote sensing data. From 2012 to 2021, the carbon emissions in the Yellow River Basin were distributed in series along the main stream of the Yellow River and its major tributaries (such as the Fen River, Wei River, etc.), relying on provincial capitals such as Taiyuan, Xi’an, Zhengzhou, Jinan, and major industrial cities such as Baotou, Datong, Zibo, etc., presenting a co-existing situation of central agglomeration and peripheral diffusion, and forming a number of high-density carbon emission centers of varying sizes and scales.
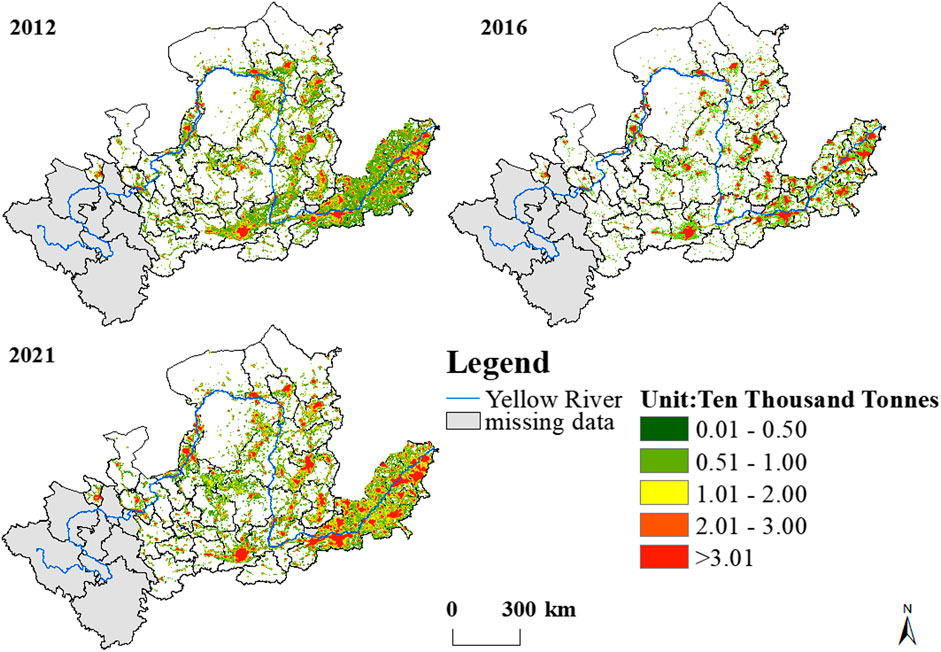
FIGURE 4. Spatial distribution of carbon emissions in the Yellow River Basin in 2012, 2016, and 2021.
Specifically, in 2012, the overall carbon emissions in the Yellow River Basin were at a relatively low level, but the distribution range was wide, and the carbon emissions were mostly concentrated in the downstream and the eastern part of the middle stream, showing a belt-like distribution. In the upstream, the carbon emissions of Yinchuan and Lanzhou were connected in series and spread to the surrounding areas, with the orientation of the main stream of the Yellow River in cities like Shizuishan, Wuhai, Bayannur, Baotou; in the middle stream, cities like Linfen, Taiyuan, and Datong took the Wei River as the orientation, while Xi’an, Xianyang, Baoji, and Weinan took the Fen River, a major tributary of the Yellow River, as the orientation; in the downstream, cities like Zhengzhou, Jinan, and Binzhou took the main stream of the Yellow River as the orientation, and the central carbon emissions increased and gradually spread from the periphery, but there were fewer high-density carbon emission centers. In 2016, the scale of the carbon emission area decreased, but there was a more concentrated trend, the area and number of high-density carbon emission aggregation areas increased, forming a point-like distribution with high density as the core. In 2021, the area and number of high-density carbon emission areas continued to increase, and the carbon emission area showed a scale distribution, basically forming and establishing the center-periphery pattern of carbon emissions, eventually forming high-density carbon emission areas of various scales from large to small from provincial capitals to small and medium-sized cities. The distribution range of carbon emissions is basically consistent with the city level and city location.
3.3 Spatial correlation analysis
First, the global Moran’s I is used to analyze the spatial effect of carbon emissions in the Yellow River Basin. The global Moran’s I of carbon emissions in the Yellow River Basin is obtained by calculating the panel data through GeoDa software, and its significance is verified using the MCMC method, as shown in Table 4. The global Moran’s I of carbon emissions in the Yellow River Basin changes dynamically over time and is significantly positive at the 5% level, indicating that there is a positive correlation in the level of carbon emissions in the Yellow River Basin, i.e., the level of carbon emissions in each city will be affected by neighboring cities. Looking at the trend of change, the Moran’s I index shows a trend of rising in fluctuations over time, indicating that the spatial aggregation characteristics of carbon emissions are strengthening, and the correlation between regions within the basin is still increasing.
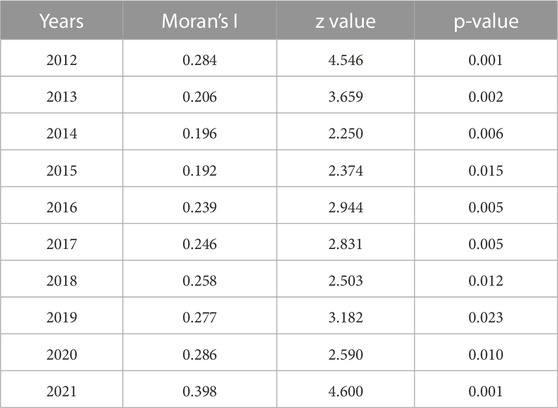
TABLE 4. Moran’s I value of carbon emissions in the Yellow River Basin.
To further explore the relationship between carbon emissions in the cities of the Yellow River Basin and neighboring cities, the LISA cluster map of carbon emissions in the Yellow River Basin is drawn based on the calculation results of the local Moran index, as shown in Figure 5. It can be seen that: 1) The aggregation degree of carbon emissions among the 57 cities in the Yellow River Basin is mainly dominated by “high-high” aggregation and “low-low” aggregation, with high spatial stability, indicating that there is a certain degree of polarization in the level of carbon emissions in the Yellow River Basin. 2) The “high-high” aggregation area has a large change, with the number increasing from 9 in 2012 to 20 in 2021. The “high-high” aggregation area in 2012 is mainly concentrated in the Shandong Peninsula and around some provincial capitals, and then extends to the northern part of Shanxi and Shaanxi, and the central part of Inner Mongolia, forming a “high-high” aggregation with resource-based cities such as Shaanxi and Inner Mongolia as the core. The middle and upper reaches of the Jinsha-Mongolia region is a major energy base in China, and the “energy golden triangle” led by Yulin, Ordos, and Yinchuan is the coal reserve base after Shanxi Province (Chen et al., 2023). With the rapid development of the coal industry and its extensive operation mode and backward technology level, it leads to high energy consumption and “high-high” aggregation of carbon emissions. 3) The “low-low” aggregation area has a small change and always shows a scale distribution, and the spatial distribution range is relatively stable, mainly distributed in Gansu and Ningxia, forming a “low-low” contiguous area with cities such as Zhongwei, Baiyin, and Dingxi as the main body. The Ganning region is mainly located on the east side of the Qinghai-Tibet Plateau and the southwest side of the Loess Plateau. This region has strong ecological environment constraints, inconvenient transportation and sparse population, and the central cities have insufficient self-development and weak contact with neighboring cities. The economy relies on the primary industry, resulting in “low-low” aggregation of its carbon emissions. 4) Lanzhou, as a major industrial city in the northwest, has carbon emissions far higher than other cities, belonging to a long-term stable state of “high-low” aggregation. The “low-high” aggregation has a certain spatial mobility and is relatively dispersed. In 2012, the “low-high” aggregation included three prefecture-level cities: Bayannur, Ulanqab, and Liaocheng, while in 2016 and 2021, only Bayannur, a prefecture-level city, was included.
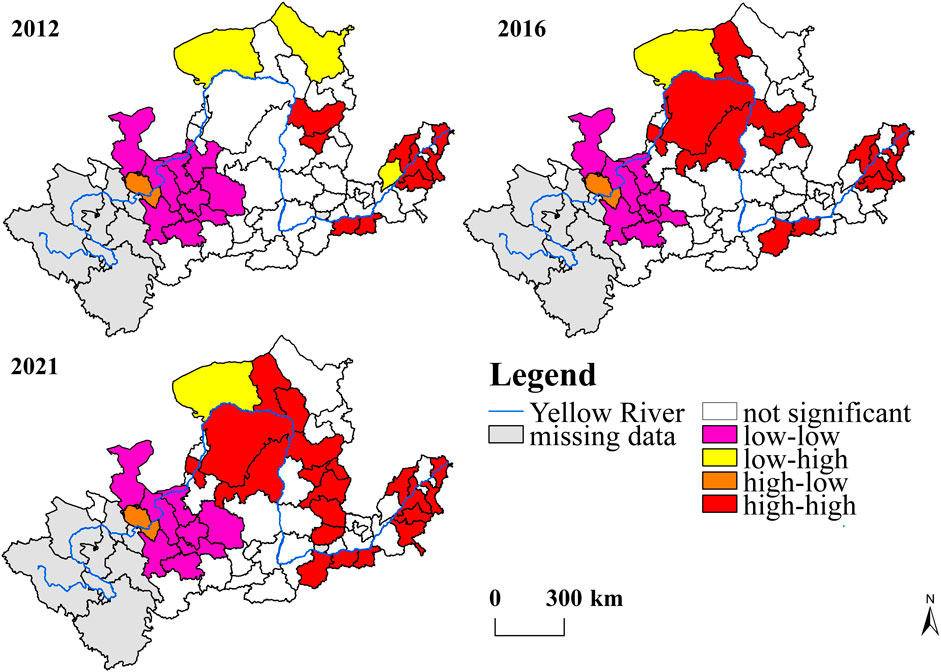
FIGURE 5. LISA clustering map of carbon emissions in the Yellow River Basin in 2012, 2016, and 2021.
3.4 Standard deviation ellipse analysis
Figure 6 shows the standard deviation ellipse and the moving trajectory of the centroid of carbon emissions in the Yellow River Basin in 2012, 2016, and 2021. It can be seen from the figure that the standard deviation ellipse of carbon emissions in the Yellow River Basin is roughly east-west oriented, and its centroid shows a trend of moving north over a period of 10 years. From the perspective of the coverage area of the standard deviation ellipse (Table 5), its value has risen from 57.75 × 10⁴km2 in 2012 to 58.39 × 10⁴km2 in 2021, with a growth rate of 1.1%, indicating that the carbon emissions in the Yellow River Basin are gradually expanding. From the perspective of the azimuth angle of the standard deviation ellipse, its value has changed from 94.64° in 2012 to 94.08° in 2021, indicating that the overall carbon emissions in the Yellow River Basin are showing a trend of concentrating and expanding to the north, which is inseparable from the increase in carbon emissions in the “Energy Golden Triangle” region and Shanxi Province, and also verifies the related conclusions in the spatial correlation analysis.
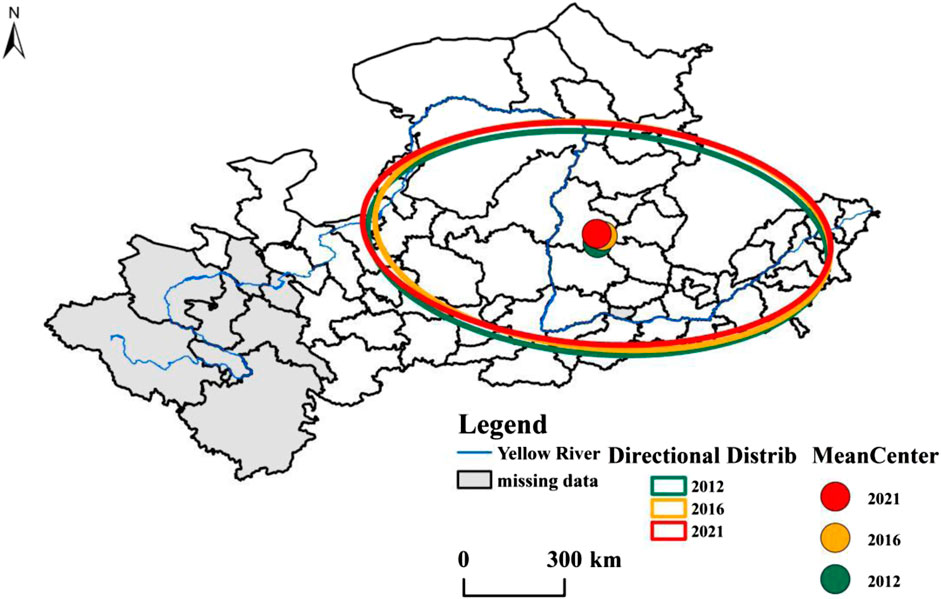
FIGURE 6. Standard deviation ellipse of carbon emissions in the Yellow River Basin in 2012, 2016, and 2021.
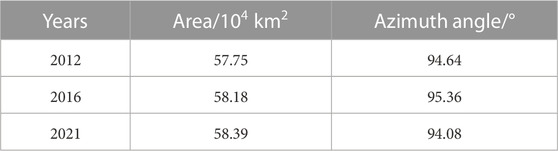
TABLE 5. Area and azimuth angle of the standard deviation ellipse of carbon emissions in the Yellow River Basin in 2012, 2016, and 2021.
3.5 Analysis of influencing factors
First, this paper conducts descriptive statistics for each variable (Table 6). At the same time, in order to avoid the occurrence of spurious regression, this paper adopts three unit root test methods: LLC test, IPS test, and HT test. The results of the unit root test obtained through Stata16.0 show (Table 7) that the P values of all data are less than 0.05, that is, they pass the 5% significance test, and the validity of the estimation results is verified.
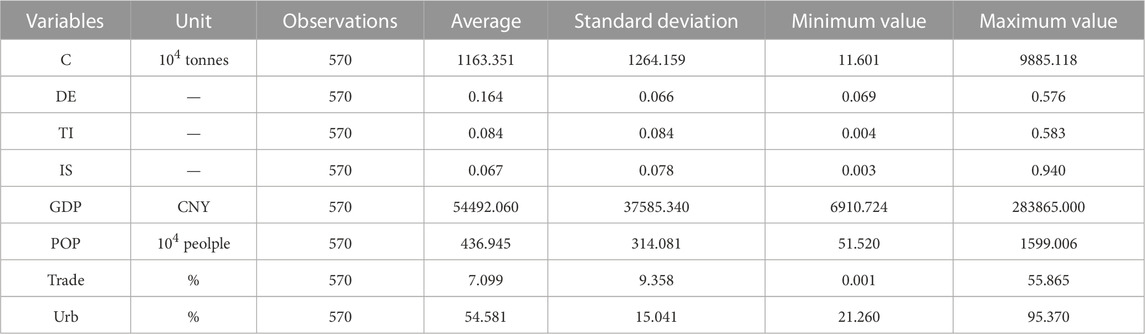
TABLE 6. Descriptive statistics of each variable.
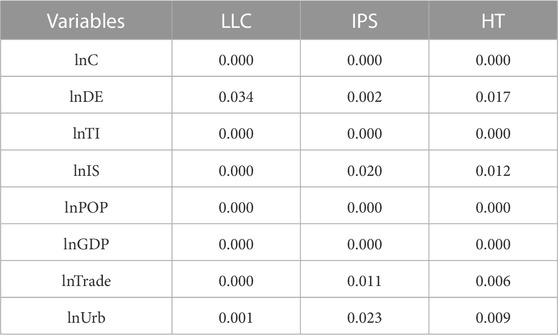
TABLE 7. Unit root test results for each variable.
After the unit root test, it is necessary to test the correlation and multicollinearity of the variables to ensure the robustness of the model and the credibility of the regression results (Table 8). The maximum value of the variance inflation factor (VIF) between variables is 2.62, and the average value is 1.65, which is lower than the warning value of 10, indicating that there is no serious collinearity problem.
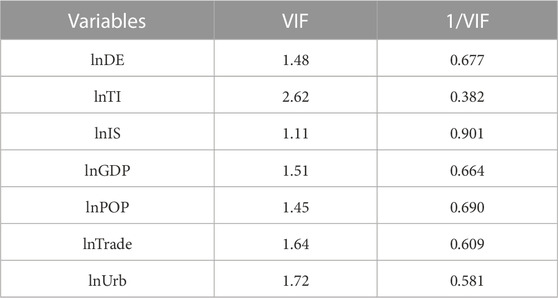
TABLE 8. VIF values of each variable.
Following the research of Dai et al. (2023), this paper sets 5 quantile indices: 10th, 25th, 50th, 75th, and 90th to assess the influencing factors of carbon emissions and their distribution under different conditions. Table 9 presents the panel quantile regression results of the influencing factors of carbon emissions in the Yellow River Basin, and Figure 7 shows the distribution of the elasticity coefficients of the influencing factors. The following conclusions can be drawn:
(1) The digital economy can significantly promote the increase of carbon emissions in medium and high quantile cities. At present, the digital economy in the Yellow River Basin has a short development time, and its infrastructure industry still lacks large-scale application of renewable energy, which has limited effect on carbon emissions. However, enterprises, as the main body of digital economy development, increase coordination costs and risk control costs in the process of large-scale production customization due to the increase of factor suppliers, leading to an increase in carbon emissions.
(2) The regression coefficient of technological innovation is negative, and except for the 10th point, all other points pass the significance test. With the increase of the point, the energy-saving and emission-reducing effect of technological innovation is stronger. The possible explanation is that the improvement of the level of technological innovation can broaden the sources of energy, improve the level of waste gas treatment, reduce energy consumption, and thus reduce carbon dioxide emissions.
(3) The regression coefficient of economic development level is negative and significant, which indicates that economic development can significantly inhibit carbon emissions. Industrial agglomeration has positive externalities. The rapid development of emerging industries and energy-saving and environmental protection technologies forces the transformation of economic development and the updating of enterprise production technologies, which shows a suppressing effect on carbon emissions.
(4) The regression coefficient of population level is negative and significant at the 1% confidence level, indicating that population agglomeration has a suppressing effect on carbon emissions. Compared with medium and low quantile cities, the inhibitory effect of population on carbon emissions is more significant in high quantile cities. Urbanization drives the agglomeration of population and other resources. The agglomeration of population changes energy use and transportation modes, and reduces marginal emission reduction costs through scale effects.
(5) Foreign investment can significantly increase carbon emissions in medium and high quantile cities. The Yellow River Basin is richer in natural resources compared to coastal cities, but its degree of openness is lower. Foreign investors in this region are more inclined to invest in resource-intensive industries, and high-energy-consuming, high-pollution foreign enterprises eliminated by coastal cities migrate to the Yellow River Basin, causing a certain “pollution haven” effect.
(6) The regression coefficient of urbanization is positive and significant, indicating that urbanization has a promoting effect on carbon emissions. With the rapid expansion of the process of urbanization and the continuous increase of infrastructure, the energy consumption has risen sharply, leading to an increase in carbon emissions.
(7) The adjustment of industrial structure has no significant impact on carbon emissions, indicating that the process of industrial structure optimization in the Yellow River Basin is relatively slow, and the level of resource allocation and service-oriented industrial structure urgently needs to be further improved.
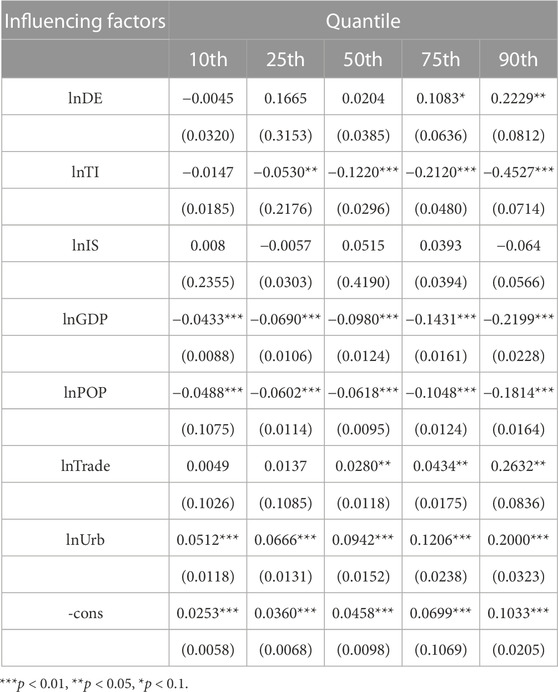
TABLE 9. Regression results of panel data of quantile.
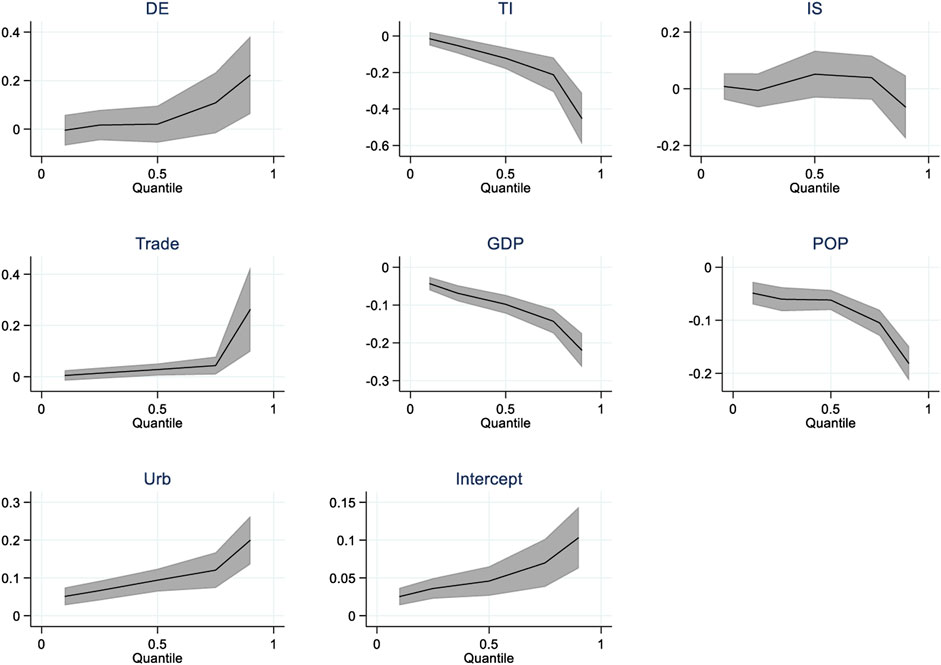
FIGURE 7. Distribution of regression elasticity coefficients.
4 Conclusions and recommendations
4.1 Conclusions
Based on the calibration of the 2012–2013 DMSP-OLS and 2012–2021 NPP-VIIRS global nighttime light remote sensing data, this paper adopts the four-step method for fusion correction, and obtains the long-time series nighttime light remote sensing dataset of the Yellow River Basin from 2012 to 2021. Through ArcGIS visualization, Moran’s Index, and standard deviation ellipse, we analyze the spatio-temporal evolution characteristics of carbon emissions in the Yellow River Basin, and finally use quantile regression to explore its influencing factors, and draw the following conclusions:
(1) From 2012 to 2021, the total energy consumption and carbon emissions in the Yellow River Basin have been continuously increasing, but the growth rate has been decreasing. The total amount has increased from 558.85 million tonnes in 2012 to 1,685.49 million tonnes in 2021. The average annual growth rate from 2019 to 2021 is only 4.19%, which is 71.45% lower than the average annual growth rate during the entire research period. This shows a converging trend, but it has not yet reached the carbon peak. The carbon emissions in the lower reaches of the Yellow River always account for more than 52%, which is the main source of carbon emissions in the Yellow River Basin.
(2) From 2012 to 2021, the carbon emissions in the Yellow River Basin are distributed along the main stream of the Yellow River and the main tributaries (such as the Fen River and the Wei River). They rely on provincial capital cities such as Taiyuan, Xi’an, Zhengzhou, Jinan and major industrial cities such as Baotou, Datong, and Zibo, showing a situation where centripetal agglomeration and peripheral diffusion coexist, forming several high-density carbon emission centers of different sizes and scales.
(3) The Yellow River Basin is mainly dominated by ‘high-high’ clustering and ‘low-low’ clustering. The ‘high-high’ clustering extends from the Shandong Peninsula to the north of Shanxi and Shaanxi, and the middle of Inner Mongolia, forming a ‘high-high’ aggregation area centered on resource-based cities such as Jin-Meng coal. The ‘low-low’ aggregation area is mainly distributed in Gansu and Ningxia regions, forming a ‘low-low’ continuous area dominated by cities such as Zhongwei, Baiyin, and Dingxi. The standard deviation ellipse of carbon emissions in the Yellow River Basin roughly extends in the east-west direction, and its center of gravity shows a trend of moving towards the northeast during the research period, showing a gradually expanding situation.
(4) Technological innovation, economic development, and population agglomeration can significantly inhibit carbon emissions, and the higher the city quantile, the stronger its impact. The digital economy and foreign investment can significantly increase carbon emissions in medium and high quantile cities. The level of urbanization is significantly positively correlated with carbon emissions, but the adjustment of a single industrial structure does not have a significant effect on carbon emissions.
4.2 Suggestions
(1) Strengthen the application of remote sensing technology. Government departments should consider combining remote sensing technology with statistical data to establish a more refined, multi-scale carbon emission database, which is convenient for dynamically monitoring the carbon emissions of various regions and cities, providing important data support for government relevant departments to implement carbon emission reduction policies, and providing more systematic and differentiated schemes to assist China’s carbon peaking and neutralization actions at the regional and city scale.
(2) Break through the traditional economic development path dominated by coal and heavy industry, particularly focusing on typical cities like Hohhot, Baotou, E’erduosi, Yulin, Lvliang, and Shuozhou. Promote the transformation and upgrading of high-energy-consuming industries such as chemical industry, power, and steel, and improve energy utilization efficiency. Promote the spillover and drive of technology and capital from developed cities in the east to underdeveloped cities in the northwest, and achieve coordinated development of socio-economic and ecological environment between regions.
(3) As a basin life community connected by rivers, the Yellow River Basin needs to develop in coordination and plan as a whole. According to the characteristics of the upper, middle, and lower reaches, formulate carbon emission reduction policies and carbon trading quotas, strive to reach the carbon peak as soon as possible through the implementation of systematic and differentiated emission reduction policies.
(4) In production activities, it is necessary to accelerate the transformation and upgrading of traditional energy utilization technologies and increase the proportion of clean energy in the energy composition. In addition, actively guide foreign investment towards low-energy consumption and high-output industries to avoid the ‘pollution haven’ effect. As it is difficult to change the coal-based energy structure in the short term, reducing carbon emissions by leveraging the advantages of technology, economy, and population agglomeration and scale effects is the main path for carbon reduction in the Yellow River Basin.
Data availability statement
The raw data supporting the conclusion of this article will be made available by the authors, without undue reservation.
Author contributions
Conceptualization, JL and TS; investigation, TS and LP; methodology, TS and ZH; supervision, JL and ZH; data curation, LP; writing—original draft, TS and LH; writing—review and editing, JL and ZH. All authors contributed to the article and approved the submitted version.
Funding
This study was funded by the Henan Institute for Chinese Development Strategy of Engineering and Technology (Grant No. 2022HENZDA02), the Soft Science Major Project of Henan Province (Grant No. 212400410002), and the National Social Science Foundation of China (21FGLB092).
Conflict of interest
The authors declare that the research was conducted in the absence of any commercial or financial relationships that could be construed as a potential conflict of interest.
Publisher’s note
All claims expressed in this article are solely those of the authors and do not necessarily represent those of their affiliated organizations, or those of the publisher, the editors and the reviewers. Any product that may be evaluated in this article, or claim that may be made by its manufacturer, is not guaranteed or endorsed by the publisher.
References
Ash, K., and Mazur, K. (2020). Identifying and correcting signal shift in DMSP-OLS data. Remote Sens.12 (14), 2219. doi:10.3390/rs12142219
Chen, J., Cheng, S., Song, M., and Wang, J. (2016). Interregional differences of coal carbon dioxide emissions in China. Energy Policy96, 1–13. doi:10.1016/j.enpol.2016.05.015
Chen, S., Ding, Y., Song, Y., Zhang, M., and Nie, R. (2023a). Study on China's energy system resilience under the scenarios of long-term shortage of imported oil. Energy270, 126831. doi:10.1016/j.energy.2023.126831
Chen, X. N., Li, F., Wu, F. P., Xu, X., and Zhao, Y. (2023b). Initial water rights allocation of Industry in the Yellow River basin driven by high-quality development. Ecol. Model.477, 110272. doi:10.1016/j.ecolmodel.2022.110272
Chen, Y., Kershaw, J. A., Hsu, Y. H., and Yang, T. R. (2020). Carbon estimation using sampling to correct LiDAR-assisted enhanced forest inventory estimates. For. Chron.96 (1), 9–19. doi:10.5558/tfc2020-003
Dai, Z., Zhang, X., and Yin, Z. (2023). Extreme time-varying spillovers between high carbon emission stocks, green bond and crude oil: Evidence from a quantile-based analysis. Energy Econ.118, 106511. doi:10.1016/j.eneco.2023.106511
Deng, Y., Li, Z., Li, Z., and Wang, J. (2019a). The experiment of fracture mechanics characteristics of Yellow River Ice. Cold Regions Sci. Technol.168, 102896. doi:10.1016/j.coldregions.2019.102896
Deng, Y., Li, Z., Wang, J., and Xu, L. (2019b). The microstructure of yellow river ice in the freezing period. Crystals9 (9), 484. doi:10.3390/cryst9090484
Ding, S., Zhang, M., and Song, Y. (2019). Exploring China's carbon emissions peak for different carbon tax scenarios. Energy Policy129, 1245–1252. doi:10.1016/j.enpol.2019.03.037
Du, Q., Pang, Q., Bao, T., Guo, X., and Deng, Y. (2021a). Critical factors influencing carbon emissions of prefabricated building supply chains in China. J. Clean. Prod.280, 124398. doi:10.1016/j.jclepro.2020.124398
Du, X., Shen, L., Wong, S. W., Meng, C., and Yang, Z. (2021b). Night-time light data based decoupling relationship analysis between economic growth and carbon emission in 289 Chinese cities. Sustain. Cities Soc.73, 103119. doi:10.1016/j.scs.2021.103119
Fu, Z., Ahmad, I., Fenta, A., Dar, M. A., Teka, A. H., Belew, A. Z., et al. (2022). Identification of potential dam sites using OLS regression and fuzzy logic approach. Environ. Sci. Eur.34 (1), 105. doi:10.1186/s12302-022-00660-w
Guo, X., Ren, D., and Shi, J. (2016). Carbon emissions, logistics volume and GDP in China: Empirical analysis based on panel data model. Environ. Sci. Pollut. Res.23, 24758–24767. doi:10.1007/s11356-016-7615-z
He, W., Liu, D., and Wang, C. (2022). Are Chinese provincial carbon emissions allowances misallocated over 2000–2017? Evidence from an extended gini-coefficient approach. Sustain. Prod. Consum.29, 564–573. doi:10.1016/j.spc.2021.11.007
Hou, Z., Huang, L., Xie, Y., Wu, L., Fang, Y., Wang, Q., et al. (2023). Economic analysis of methanating CO2 and hydrogen-rich industrial waste gas in depleted natural gas reservoirs. Energies16 (9), 3633. doi:10.3390/en16093633
Huang, L., Hou, Z., Fang, Y., Liu, J., and Shi, T. (2023). Evolution of CCUS technologies using LDA topic model and derwent patent data. Energies16 (6), 2556. doi:10.3390/en16062556
Ji, Y., Dong, J., Jiang, H., Wang, G., and Fei, X. (2022). Research on carbon emission measurement of Shanghai expressway under the vision of peaking carbon emissions. Transp. Lett., 1–15. doi:10.1080/19427867.2022.2091669
Jia, J., Deng, H., Duan, J., and Zhao, J. (2009). Analysis of the major drivers of the ecological footprint using the STIRPAT model and the PLS method—a case study in henan province, China. Ecol. Econ.68 (11), 2818–2824. doi:10.1016/j.ecolecon.2009.05.012
Jia, J., Jian, H., Xie, D., Gu, Z., and Chen, C. (2019). Multi-scale decomposition of energy-related industrial carbon emission by an extended logarithmic mean divisia index: A case study of jiangxi, China. Energy Effic.12, 2161–2186. doi:10.1007/s12053-019-09814-x
Jiang, F., Chen, B., Li, P., Jiang, J., Zhang, Q., Wang, J., et al. (2023). Spatio-temporal evolution and influencing factors of synergizing the reduction of pollution and carbon emissions-Utilizing multi-source remote sensing data and GTWR model. Environ. Res.229, 115775. doi:10.1016/j.envres.2023.115775
Lemmerz, T., Herlé, S., and Blankenbach, J. (2023). Geostatistics on real-time geodata streams—an extended spatiotemporal moran’s I index with distributed stream processing technologies. ISPRS Int. J. Geo-Information12 (3), 87. doi:10.3390/ijgi12030087
Liu, F. (2022). The impact of China’s low-carbon city pilot policy on carbon emissions: Based on the multi-period DID model. Environ. Sci. Pollut. Res., 1–15. doi:10.1007/s11356-022-20188-z
Liu, J., Shi, T., and Huang, L. (2022a). A study on the impact of industrial restructuring on carbon dioxide emissions and scenario simulation in the yellow River Basin. Water14 (23), 3833. doi:10.3390/w14233833
Liu, J., Wang, H., Ho, H., and Huang, L. (2022b). Impact of heterogeneous environmental regulation on manufacturing sector green transformation and sustainability. Front. Environ. Sci.933, 938509. doi:10.3389/fenvs.2022.938509
Liu, P., Qin, Y., Luo, Y., Wang, X., and Guo, X. (2023a). Structure of low-carbon economy spatial correlation network in urban agglomeration. J. Clean. Prod.394, 136359. doi:10.1016/j.jclepro.2023.136359
Liu, S., Jia, J., Huang, H., Chen, D., Zhong, Y., and Zhou, Y. (2023b). China’s CO2 emissions: A thorough analysis of spatiotemporal characteristics and sustainable policy from the agricultural land-use perspective during 1995–2020. Land12, 1220. doi:10.3390/land12061220
Liu, S., Zhao, X., Zhang, F., Qiu, A., Chen, L., Huang, J., et al. (2022c). Spatial downscaling of NPP-viirs nighttime light data using multiscale geographically weighted regression and multi-source variables. Remote Sens.14 (24), 6400. doi:10.3390/rs14246400
Liu, X. J., Jin, X. B., Luo, X. L., and Zhou, Y. K. (2023c). Multi-scale variations and impact factors of carbon emission intensity in China. Sci. Total Environ.857, 159403. doi:10.1016/j.scitotenv.2022.159403
Liu, X., Liu, Z., Lin, K. C., Huang, Z. L., Ling, M. Y., Chen, P. Q., et al. (2022d). Evaluation of the operation process of medical equipment to enhance ergonomic reliability based on FRAM–moran’s I and CREAM. Appl. Sci.12 (1), 200. doi:10.3390/app12010200
Liu, X., Yang, X., and Guo, R. (2020). Regional differences in fossil energy-related carbon emissions in China’s eight economic regions: Based on the Theil index and PLS-VIP method. Sustainability12 (7), 2576. doi:10.3390/su-12072576
Ma, J., Guo, J., Ahmad, S., Li, Z., and Hong, J. (2020). Constructing a new inter-calibration method for DMSP-OLS and NPP-VIIRS nighttime light. Remote Sens.12 (6), 937. doi:10.3390/rs12060937
Ma, M., and Cai, W. (2019). Do commercial building sector-derived carbon emissions decouple from the economic growth in tertiary industry? A case study of four municipalities in China. Sci. Total Environ.650, 822–834. doi:10.1016/j.scitotenv.2018.08.078
Monteiro, A., Ankrah, J., Madureira, H., and Pacheco, M. O. (2022). Climate risk mitigation and adaptation concerns in urban areas: A systematic review of the impact of IPCC assessment reports. Climate10 (8), 115. doi:10.3390/cli-10080115
Pan, J. (2021). Lowering the carbon emissions peak and accelerating the transition towards net zero carbon. Chin. J. Urban Environ. Stud.9 (03), 2150013. doi:10.1142/S2345748121500135
Rönkkö, T., Saarikoski, S., Kuittinen, N., Karjalainen, P., Keskinen, H., Järvinen, A., et al. (2023). Review of black carbon emission factors from different anthropogenic sources. Environ. Res. Lett.18 (3), 033004. doi:10.1088/1748-9326/acbb1b
Shi, Y., Sorrell, S., and Foxon, T. (2023). The impact of teleworking on domestic energy use and carbon emissions: An assessment for England. Energy Build.287, 112996. doi:10.1016/j.enbuild.2023.112996
Song, W., Yin, S., Zhang, Y., Qi, L., and Yi, X. (2023). Spatial-temporal evolution characteristics and drivers of carbon emission intensity of resource-based cities in China. Resour. Effic. Environ. Impact Assess.67, 16648714. doi:10.3389/fenvs.2022.972563
Su, B., and Ang, B. W. (2015). Multiplicative decomposition of aggregate carbon intensity change using input–output analysis. Appl. Energy154, 13–20. doi:10.1016/j.apenergy.2015.04.101
Sun, J., and Wu, X. (2023). Research on the mechanism and countermeasures of digital economy development promoting carbon emission reduction in jiangxi province. Environ. Res. Commun.5 (3), 035002. doi:10.1088/2515-7620/acbd8b
Vélez-Henao, J. A., Vivanco, D. F., and Hernández-Riveros, J. A. (2019). Technological change and the rebound effect in the STIRPAT model: A critical view. Energy Policy129, 1372–1381. doi:10.1016/j.enpol.2019.03.044
Wang, S., Liu, X., Zhou, C., Hu, J., and Ou, J. (2017). Examining the impacts of socioeconomic factors, urban form, and transportation networks on CO2 emissions in China’s megacities. Appl. energy185, 189–200. doi:10.1016/j.apenergy.2016.10.052
Williamson, J. M., Lin, H. M., and Lyles, R. H. (2023). A censored quantile regression approach for relative survival analysis: Relative survival quantile regression. Biometrical J.65, 2200127. doi:10.1002/bimj.202200127
Xiao, H., Ma, Z., Mi, Z., Kelsey, J., Zheng, J., Yin, W., et al. (2018). Spatio-temporal simulation of energy consumption in China's provinces based on satellite night-time light data. Appl. Energy231, 1070–1078. doi:10.1016/j.apenergy.2018.09.200
Xu, K., Kang, H., Wang, W., Jiang, P., and Li, N. (2021). Carbon emission estimation of assembled composite concrete beams during construction. Energies14 (7), 1810. doi:10.3390/en14071810
Yang, J., Li, W., Chen, J., and Sun, C. (2023). Refined carbon emission measurement based on NPP-viirs nighttime light data: A case study of the pearl river delta region, China. Sensors23 (1), 191. doi:10.3390/s23010191
Yang, Y., Jia, J., and Chen, C. (2020). Residential energy-related CO2 emissions in China’s less developed regions: A case study of jiangxi. Sustainability12 (5), 2000. doi:10.3390/su12052000
Yu, Y., Sun, R., Sun, Y., and Shu, Y. (2022). Integrated carbon emission estimation method and energy conservation analysis: The port of los angles case study. J. Mar. Sci. Eng.10 (6), 717. doi:10.3390/jmse10060717
Zhang, F., Wang, X., and Liu, G. (2022). Allocation of carbon emission quotas based on global equality perspective. Environ. Sci. Pollut. Res.29 (35), 53553–53568. doi:10.1007/s11356-022-19619-8
Zhao, Y., Wu, Q., Wei, P., Zhao, H., Zhang, X., and Pang, C. (2022). Explore the mitigation mechanism of urban thermal environment by integrating geographic detector and standard deviation ellipse (SDE). Remote Sens.14 (14), 3411. doi:10.3390/rs14143411
Keywords: energy-related carbon emissions, DMSP-OLS, NPP-VIIS, spatiotemporal evolution, influencing factors
Citation: Liu J, Shi T, Hou Z, Huang L and Pu L (2023) Analysis of spatiotemporal patterns and determinants of energy-related carbon emissions in the Yellow River basin using remote sensing data. Front. Energy Res. 11:1231322. doi: 10.3389/fenrg.2023.1231322
Received: 30 May 2023; Accepted: 22 June 2023;
Published: 06 July 2023.
Edited by:
Zequn Yang, Central South University, ChinaReviewed by:
Junsong Jia, Jiangxi Normal University, ChinaQian Zhou, Zhongnan University of Economics and Law, China
Copyright © 2023 Liu, Shi, Hou, Huang and Pu. This is an open-access article distributed under the terms of the Creative Commons Attribution License (CC BY). The use, distribution or reproduction in other forums is permitted, provided the original author(s) and the copyright owner(s) are credited and that the original publication in this journal is cited, in accordance with accepted academic practice. No use, distribution or reproduction is permitted which does not comply with these terms.
*Correspondence: Tianle Shi, c3RsQGdzLnp6dS5lZHUuY24=; Liangchao Huang, bGlhbmdjaGFvLmh1YW5nQHR1LWNsYXVzdGhhbC5kZQ==