 Jiangnan Liu
 Chenguo Yao
 Liang Yu
 Shoulong Dong
95% of researchers rate our articles as excellent or good
Learn more about the work of our research integrity team to safeguard the quality of each article we publish.
Find out more
ORIGINAL RESEARCH article
Front. Energy Res. , 27 July 2023
Sec. Smart Grids
Volume 11 - 2023 | https://doi.org/10.3389/fenrg.2023.1175808
This article is part of the Research Topic High Quality and Reliability of Transformers View all 8 articles
There is no doubt that transformer plays a fundamental role in power system. At the same time, transformer winding fault diagnosis is an important topic. Many works put the most emphasis on the identification of fault type and degree, while ignoring the fault location. However, fault location is an urgent problem to be solved, which is worth studying and discussing. The contribution of this paper lies in the location of Disk space variation (DSV) fault. The introduction of digital twin can solve the problem of insufficient fault cases, and pave the way for the intellectualization of fault diagnosis. In this paper, the digital twin of transformer winding is established based on double ladder network, in which the distributed parameters are calculated by finite element method. Frequency response analysis (FRA) is one of the most widely accepted methods for transformer winding mechanical deformation fault diagnosis. Aiming at the interpretation code of FRA, this paper disproves the view that phase information is useful. Then, by extracting the mathematical index of FRA, multi-layer perceptron (MLP) is trained and DSV fault location is realized. In addition, the popular support vector machine is also compared with the MLP model in this paper, which further highlights the advantages of MLP. The proposed method is verified by an actual transformer, and the results are satisfactory.
Power transformer is one of the most essential apparatuses in power system (Wu et al., 2021; Jia et al., 2022), which are installed in various stages of power systems like generation, transmission and distribution factory sub-stations, near load points, etc. In view of its important role in the electricity supply chain, its failure not only imposes a substantial amount of cost on utility but also degrades reliability (Sun et al., 2022). To avoid crucial damage, it is necessary to detect the winding deformation at an early stage (Deng et al., 2023).
Many scholars all over the world devote themselves to the research of transformer winding deformation fault diagnosis. Different methods have been developed and applied to the transformer fault diagnosis program, and achieved good results. Due to its own advantages, frequency response analysis (FRA) has become the most widely accepted transformer winding deformation fault method among many commercial technologies. FRA relies on the fact that the transformer winding is equivalent of an electrical network consisting of resistance, capacitance and inductance in high frequency range, and its frequency response signature can represent the status of the winding (Portilla et al., 2014). The proposal of ladder network provides a good framework for modeling the high frequency response of transformer windings (Abeywickrama et al., 2008). Many attempts have been made to model transformer windings through ladder circuits (Mondal et al., 2018). It is still the mainstream to determine the value of circuit parameters (denoted by R, L, M and C) by using the finite element method (FEM) (Abeywickrama et al., 2006; Zhang et al., 2014). This method is adopted in this paper.
In recent years, the concept of Digital Twin (DT) technology has developed vigorously and gradually spread to various fields. DT technology was proposed by Professor Michael grieves of Schengen University in 2003. It was initially defined as “virtual digital expression equivalent to physical model” (Grieves, 2015). In the electrical power industry, people hope to use DT technology to promote the digitization and intelligence of electrical equipment. At present, the relevant research is in the preliminary development stage. Reference (Zhou et al., 2020) propose to build a model of defect text mining and transformer asset status evaluation based on Long Short-Term Memory (LSTM), which provides a basis for the establishment of DT system. The DT is constructed to realize the real-time monitoring of the medium voltage winding of distribution transformer in (Moutis and Alizadeh-Mousavi, 2021). An approach establishes a DT model of power transformer and acquires the sample data and labels from the simulation process and state evaluation under various condition is also developed (Yang et al., 2019). These sample data and labels will guide the decision making of state evaluation in the real situation. These forward-looking work have made great contributions to the development of DT technology of transformer, which have great referential significances. For the topic of transformer winding deformation, it is impractical to stage various fault types with different levels on operating transformers to examine their effects on the FRA signature (Abu-Siada et al., 2020). And it is costly to carry out destructive experiments on an actual transformer. As a result, transformer winding failure cases has always been hard to obtain. Further, the lack of fault data samples leads to the intellectualization of transformer fault diagnosis is blocked and remain stagnant. However, with the help of DT technology, this problem will no longer be a problem. In a virtual space, any destructive simulation can be carried out at almost zero cost. This paper will also try to introduce the DT technology into the winding deformation diagnosis, establish the DT model of transformer, and obtain more data for analysis through the simulation experiment of DT.
It is a general trend that artificial intelligence is introduced into transformer fault diagnosis. As a popular way to realize artificial intelligence (AI), machine learning (ML) has been widely recognized in many application areas. Neural network, one of many machine learning algorithms, is a highly complex nonlinear system with strong classification ability, which can solve very complex classification problems. It is naturally used to realize the diagnosis of transformer windings. In the previous work of transformer winding fault diagnosis, due to the lack of fault cases, only some neural network classifiers suitable for small sample classification can be used, of which the most typical case in point is support vector machine (SVM). SVM is a small sample learning method with solid theoretical foundation. It has been partially successfully applied in transformer fault diagnosis. However, with the introduction of DT technology, the problem of data has been solved, and then other neural networks can also shine on this topic. Over the past few years, deep neural network (DNN) has indeed proved its ability, and been a real hit in the academic community. Recently, Google’s work has brought multi-layer perceptron (MLP) back to people’s vision (Tolstikhin et al., 2021). MLP is not a new concept, and MLP’s return to the spotlight just proves its strength. This paper also attempts to use MLP to locate winding deformation fault, and compares it with some other tools.
In the existing literature on transformer fault diagnosis, most of them focus on the task of fault classification. Due to the difficulty of fault location task, only a few scientific researchers make efforts to overcome this problem. V S B Chaitanya Duvvury presents an innovative FRA measurement technique to identify the faulty phase (whether the middle or either of the two outer phases) in ‘delta-connected’ HV windings (Duvvury and Pramanik, 2021). However, this paper can only identify the fault phase, the more specific location range of the fault cannot be further spot. In (Ma et al., 2021), a test optical fiber is mounted on the outside surface of the power transformer windings to achieve the purpose of fault location. The operation of the proposed method is complex, and it is basically impossible to realize for a large number of transformers that have been put into operation. And such an avant-garde approach has a long way to go before it is widely accepted by the traditional electrical appliance manufacturing industry. Therefore, to avoid such complex operation, this work will realize fault location in a data-driven way.
In view of the above background, the work flow of this study is as follows. The design parameters of a transformer are used for 3D modeling, and the distributed parameters of windings are obtained through the calculation of FEM. On this basis, the ladder network of transformer winding is constructed. Through the circuit analysis of the ladder network, the FRA signature of the transformer can be obtained. It is worth mentioning that the ladder network is essentially the DT of the transformer winding. Failure cases can be collected by fault simulation of DTs. After that, some artificial intelligence methods are introduced and compared. By using the data to train the neural network, the winding fault location model is constructed to realize the fault location. The proposal proposed in this paper is finally verified on an actual transformer. The relevant work was disclosed in ICHVE-2022 (Liu et al., 2022), but due to the length limit of the conference paper, the technical details were not presented. Additionally, this paper provides a detailed mathematical derivation to prove that the phase spectrum does not provide more information about the winding condition.
The rest of this paper is organized as follows. Section 2 describes the construction of DT and fault simulation settings. The theoretical support of un-tenability of phase-based FRA interpretation and the whole process of fault location model establishment are illustrated in Section 3. Section 4 is the case verification of the proposed method. Section 5 concludes the outcome of this work.
Ref (Wu et al., 2021) mentioned that, according to the data interaction mode between DTs and physical entities, the current definition of DT can be divided into three levels. The primary DT mainly emphasizes the mirror model of a physical object. And there is no automatic data exchange between the physical. At present, it is in the early stage of the development of DT technology related to transformer winding, so this work only takes the construction of the primary level of DT as a challenge.
The idea of the proposed methodology is based on characterizing transformer winding with ladder network. Based on the design parameters of an actual transformer, the modeling can be carried out. See Table 1 for detailed design parameters of transformer object. The constructed model is shown in Figure 1.
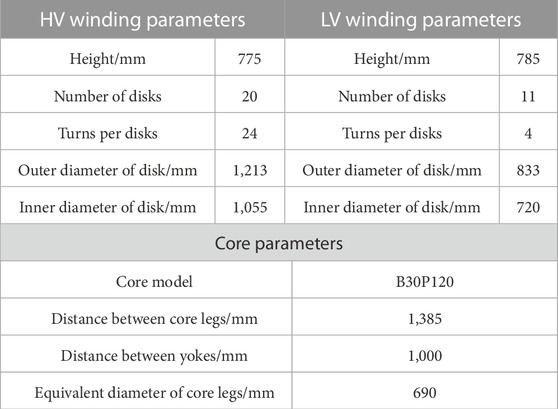
TABLE 1. Detailed design parameters of transformer.
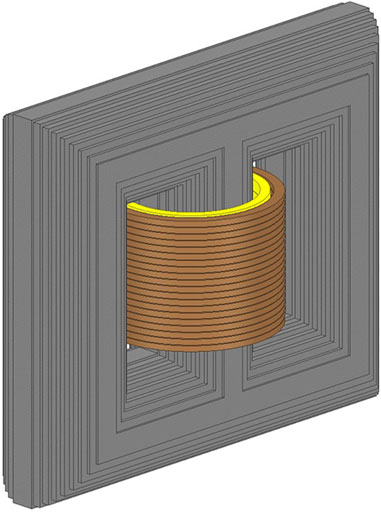
FIGURE 1. 3D view of the constructed transformer model.
Many literature have reported the calculation of winding distributed parameters by FEM (Hashemnia et al., 2015a; Hashemnia et al., 2015b), which will not be described too much in this paper. By solving Maxwell equations and using energy balance method, the distributed parameters of the winding in healthy condition can be calculated. The numerical solution can be seen in Table 2.
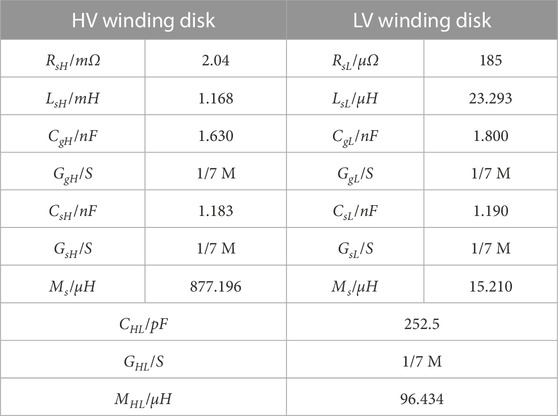
TABLE 2. Distributed parameter value of winding.
The specific physical meaning of parameters in Table 2 is explained as follows. RsH and LsH represent the resistance and the self-inductance of each HV winding disk respectively. Obviously, RsL and LsL represent the corresponding physical quantity of each LV winding disk respectively. CHL and GHL mean the capacitance and conductance between the HV winding disk and the corresponding LV winding disk. CgH, CgL, GgH, GgL are the capacitance and conductance to the ground of HV winding disks and LV winding disks respectively. CsH, GsH, CsL, GsL on behalf of the capacitance and conductance between adjacent disks in HV winding and LV winding. MS and MHL represent mutual inductance within and between HV and LV windings respectively.
After obtaining the distributed parameters, the ladder network can be built successfully. The equivalent double-ladder network is presented in Figure 2. So far, the construction of transformer winding DT is completed.
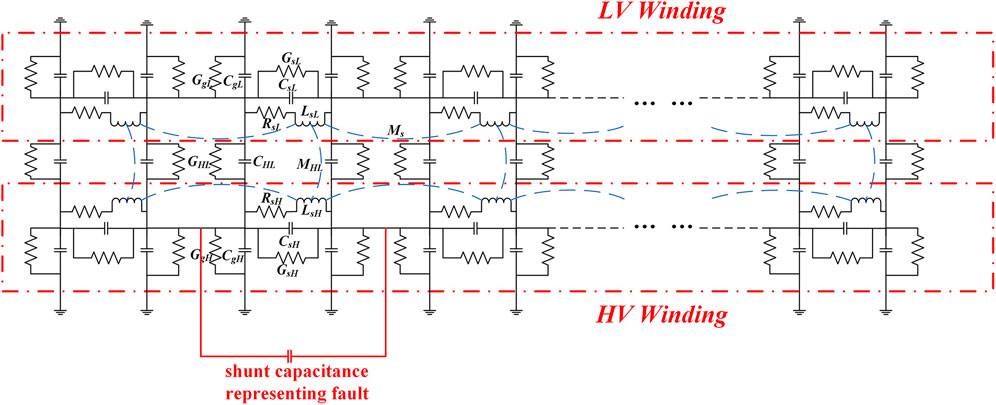
FIGURE 2. The constructed equivalent double-ladder network and shunt capacitance representing DSV Fault.
Disk space variation (DSV) is one of the most common deformation faults of transformer windings. It is of great significance to successfully locate DSV fault. As the FRA traces of transformer winding has different characteristics under different types of faults, in order to eliminate the influence of fault types on fault location, this study pay all attention to DSV fault location. For the DSV fault concerned in this paper, it has been pointed out that the DSV fault has been revealed that the capacitance parameter dominates the effect and this fault could be emulated by changing the inter-disk capacitance parameter (Abu-Siada et al., 2013). Therefore, this study achieves the purpose of DSV fault simulation by paralleling capacitors with different capacitance values at different positions, so as to obtain a large number of frequency response data under fault conditions.
As seen in Table 1, the high voltage winding is composed of 20 disks. When simulating DSV fault, 19 different fault positions can be simulated by paralleling capacitance between two adjacent winding disks. In order to obtain sufficient fault cases, the shunt capacitance of each fault location sweeps from 50pF to 1 nF (the sweep step is 50 nF), so as to achieve the effect of simulating different degrees of faults. Figure 2 shows the shunt capacitance representing DSV fault; Figure 3 gives the FRA curves at different fault positions under the same fault degree (The capacitance value of shunt capacitors are both 1 nF).

FIGURE 3. FRA curves at different fault positions.
There are two main directions for the FRA interpretation code. One is based on the mathematical statistical indicators of frequency response data. Many studies have adopted this method and reported good results. The other is to start with the image information of FRA signature, combined with digital image processing (DIP) technology to extract image features, finally realize the interpretation of FRA. Researchers following the latter method hold the views that, the most of the current work only focuses on the amplitude information of frequency response, and introducing the phase information of frequency response can provide more mechanical state information of the winding. Based on this opinion, some related work is derived. In fact, the above two interpretation methods have been used in previous contributions (Liu et al., 2019; Liu et al., 2020). The accuracy of fault type classification achieved by using traditional mathematical statistical indicators (96.3%) (Liu et al., 2019) is almost the same as that by using FRA signature texture features (97.8%) (Liu et al., 2020). It turns out like the introduction of phase information cannot provide more information. The explanation combined with the linear system theory will be given below to prove that the introduction of phase information is not of additional help.
In the frequency range of more than 1kHz, the influence of core can be ignored. FRA regards the transformer winding as a linear system composed of RLC. It should be highlighted that linear system is the foundation of FRA theory. In the theories of linear systems, causality is defined as follows:
For any input signal, if the output signal value of the system at any time only depends on the input signal value at that time and before that time, and has nothing to do with the input signal value at the future time, the system has causality.
Causality can be explained by the following mathematical expression:
where y(t) is the output of system, and x(t) represents the system input. Eq. 1 means that the output of the system is determined by and only by the current and previous inputs.
As transformer winding is a physical real system, the system must meet the definition of causality. Therefore, from the perspective of FRA, the transformer winding is a causal linear system. Furthermore, in linear system theory, it can be proved that the real and imaginary parts of the causal linear systems frequency response satisfy Hilbert transform.
Let f(t) be the impulse response of the system, then its Fourier transform is the frequency response of the system. Its Fourier transform is expressed as real part R (ω) and imaginary part I (ω):
Because of the causality of the system, f(t) satisfies:
Where u(t) is the step signal.
Taking Fourier transform on both sides of Eq. 3, we can get:
The real and imaginary parts on both sides of Eq. 5 are equal respectively. It should be noted that the "*" in the equation represents a convolution operation, which denotes the integral of the product of the overlapping portions of two functions after one of them has been flipped and shifted with respect to the other, over the range of overlap.
In a word, the real part and imaginary part of the frequency response of the transformer winding are not independent of each other. Naturally, it means that the amplitude spectrum and phase spectrum of frequency response are not independent of each other either. The phase spectrum can be calculated from the amplitude spectrum, and the converse is equally true, the amplitude spectrum can be expressed from the phase spectrum.
In summary, the phase information is not of additional help. Therefore, this paper extracts the mathematical statistical indicators of frequency response data to characterize the samples. Figure 4 shows the flow chart of this work.
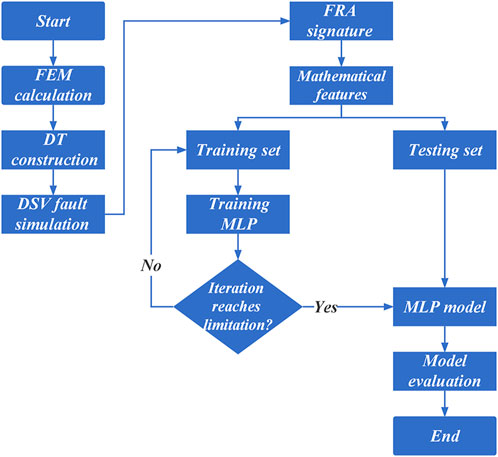
FIGURE 4. Flow chart of this work.
The mathematical statistical indicators have the advantages of simple and fast calculation, and the calculation result is not sensitive to noise. This paper selects 8 indicators, which are listed in Table 3.
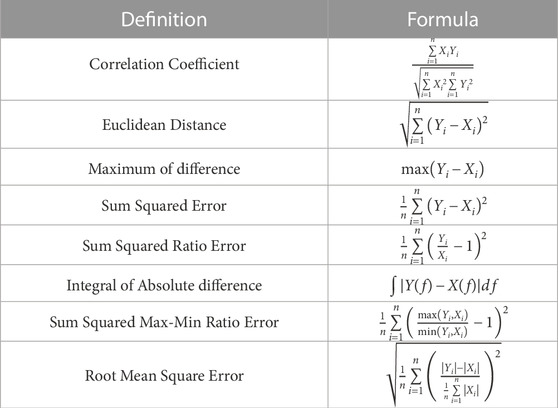
TABLE 3. Indicators used in this paper.
As mentioned above, this paper expects to be able to locate the fault location, so the fault location is set as three categories, namely, top, middle and bottom. The 120 samples with the fault located ranging from the first to seventh winding disc are labelled as ‘Top’. And flag the 120 samples with the fault located ranging from the 14th to 20th winding disc as ‘Bottom’. The remain 140 samples marked as ‘Middle’. After labeling each sample, the dataset is formed.
The re-popularity of MLP is closely related to the development of computing resources. Previous work has tried to add a priori knowledge to the network topology to reduce the resources required for parameter optimization (Tolstikhin et al., 2021). Thanks to the upgrading of hardware, the current trend is to let this part of priori knowledge can be learned through a large amount of data. Figure 5 depicts a typical structure of the MLP. It can be seen from Figure 5 that the full-connected structure makes MLP have far more parameters to be adjusted through learning compared with other neural networks This also means that the potential mapping ability of MLP is stronger than other neural networks. Recent studies (Tolstikhin et al., 2021) have shown the potential ability of MLP.

FIGURE 5. Typical structure diagram of MLP.
A three-layer MLP was involved in this study. After receiving the input, the input layer is connected to the hidden layer, and the hidden layer outputs to a softmax classifier to classify the fault location. The input layer is composed of 8 neurons, while the hidden layer is composed of 133 neurons. It is a common sense in the field of neural network that, the width of neural network determines its ability of feature extraction, while the depth determines its ability of nonlinear mapping. Such a wide network structure enables the model to extract rich information from the input for fault location. The nonlinear mapping between FRA features and fault location may not require a very deep neural network structure. So the hidden layer structure of MLP constructed in this study prefers width rather than depth. The activation function is set to Rectified Linear Unit (Relu), which not only enhances the nonlinear expression ability of the network, but also speeds up the training of the network and prevents the gradient from disappearing. The number of iterations is set to 2,500.
In order to evaluate the performance of the model more objectively, the dataset is divided into two parts: training set and testing set. 30 samples are randomly selected from the dataset as the testing set, and then the rest constitute the training set. In addition, in order to reduce the generalization error, the k-fold cross validation method is also introduced. The value of k is 10, so the size of the validation set is one-10th of the training set.
As mentioned earlier, the training and testing sets are randomly selected from the dataset. Due to the randomness in the division process of training set and test set, 10 repeated experiments were carried out in this paper to rule out chance as the cause. Table 4 offers the performance of the model in training set, verification set and testing set.
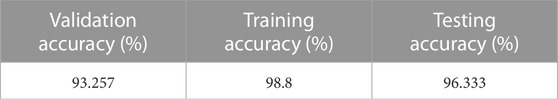
TABLE 4. Average performance of MLP model in 10 repeated experiments.
From the above results, it can be seen that the model has been well trained and really learned the mapping relationship between fault location and FRA features. Figure 6 is the confusion matrix obtained by testing the trained MLP model with the testing set. In Figure 6, labels 1, 2 and 3 represents the top, middle and bottom respectively. The labels at the bottom of Figure 6 are the actual labels of the winding fault, which are the targets of the model. The left labels in Figure 6 are the labels output by the model. Taking the output and target of the model as the index, the classified number of corresponding samples and their percentage to the total number of samples is also displayed in the box. If the classification result is correct, the box is displayed in green; if incorrect, the box is displayed in red. The correct classification rate and error classification rate of corresponding classes are calculated in the Silver box. The final statistical results of the correct classification rate and the error classification rate of all samples are shown in the gray box. From the confusion matrix, the model can achieve very good results in the testing set. Only a few samples cannot be accurately located, which proves the generalization ability of the MLP model.
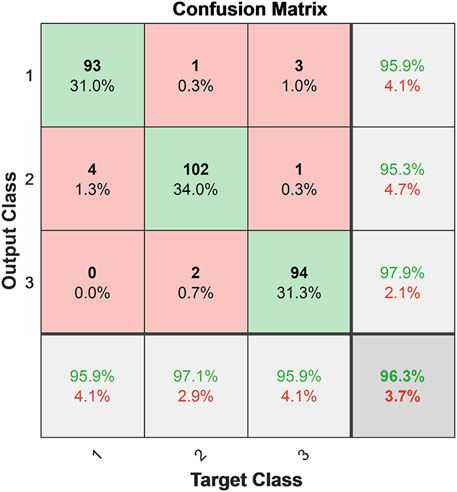
FIGURE 6. The confusion matrix on testing set.
For a specific fault class X, the expressions of recall and precision are shown in Eqss 8, 9 (Li, Hou, and Sheng, 2020):
Where λrecall is recall and λprecision is precision. NTP is the number of true positive cases, that is, the number of samples with predicted class X and actual class X. NFN is the number of false negative cases (NTP + NFN) refers to the total number of samples with actual class X. NFP is the number of false positive cases (NTP + NFP) refers to the total number of samples with predicted class X.
The recall and precision of the model for each category are listed on the bottom and right of the confusion matrix in Figure 6. It can be seen that no matter where the fault occurs, the model can locate it with an accuracy of more than 95.9%. For the output results of the model, the judgment of the model can be agreed with the reliability of 95.3% at least.
In the field of transformer fault diagnosis, SVM remains a hot topic. Its principle is introduced in many papers, which will not be expanded in this paper. In this paper, the same repeated randomized trial is also used to train SVM to compare with the MLP in this paper. The confusion matrix of SVM and average performance in 10 repeated experiments is provided in Table 5 and Figure 7. The results show that SVM is far inferior to MLP.

TABLE 5. Average performance of SVM model in 10 repeated experiments.

FIGURE 7. The confusion matrix of SVM.
The essence of MLP and SVM is to map the problem to high-dimensional space, and then complete the classification task in high-dimensional space. In principle, the effect of classification is directly affected by the mapping method. If the patterns show obvious differences in high-dimensional space, good classification results can be achieved. On the contrary, the effect will be poor. In this sense, the result of MLP must be better than SVM. Because MLP is finding effective mapping mode in an active way, while SVM are in a passive way. For SVM, once the kernel function is fixed, the mapping method is uniquely determined, unless the kernel function is changed. Therefore, it is a hit-and-miss affair whether the chosen kernel function is suitable, so the performance is worse than MLP.
In order to verify whether the MLP-based fault location model proposed in this paper is competent for DSV fault location of actual transformer, DSV fault simulation is carried out on an actual transformer. And the effectiveness of the proposed method is verified by the obtained frequency response data.
The simulation of DSV fault is also completed by paralleling a certain capacitance between two adjacent disks. All experiments were carried out using FRA end-to-end open circuit connection. Refer to Figure 8 for the actual photographic of transformer and the DSV fault simulation real-taken image. More detailed descriptions of this transformer can be found in (Zhao et al., 2018).
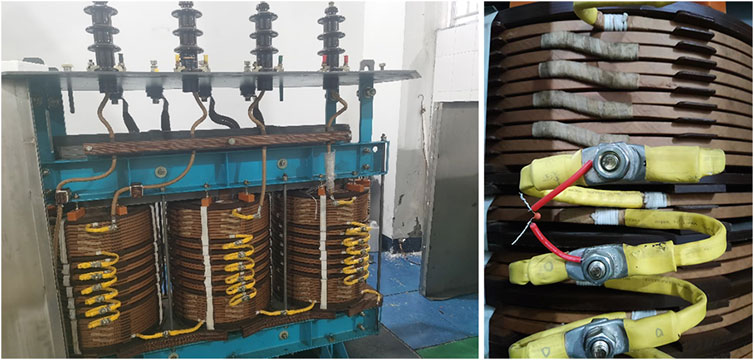
FIGURE 8. The actual photographic of transformer and the DSV fault simulation real-taken image.
Three fault locations are fully considered and simulated with the fault degree represented by the capacitance of 50pF, 67pF, 100pF, 200pF, 400pF, 600pF, 800 pF. The frequency response dataset obtained under DSV fault consists of 42 cases, and some of them are put in Figure 9.
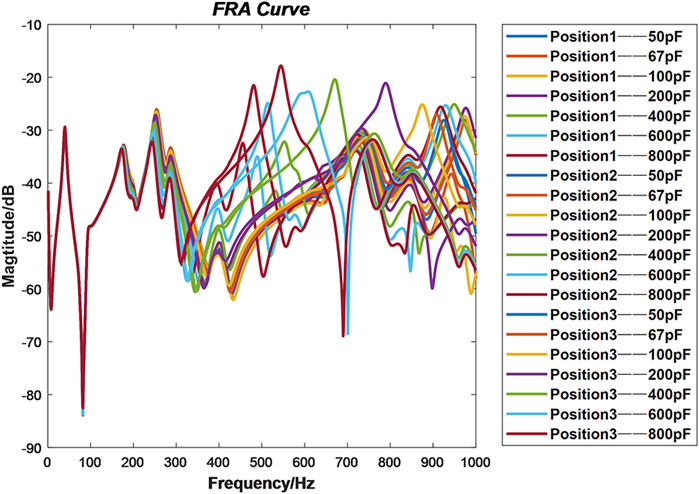
FIGURE 9. Some FRA curves of the transformer under DSV fault.
The method proposed in this paper is applied to the frequency response data set of actual transformer. Similarly, the data set is divided into training set and test set, 30 samples are included in the training set, and the remaining 12 samples form the test set. After 10 repeated random experiments, the confusion matrix of MLP fault location model on the testing set is finally got and placed in Figure 10.
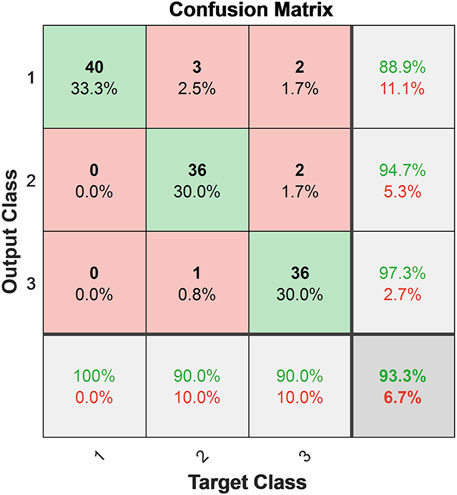
FIGURE 10. The confusion matrix of MLP fault location model on the testing set.
As shown in Figure 10, it can be seen that the MLP-based DSV fault location model can work out well on the actual transformer, and the results are satisfactory. It can be noted from Figure 10 that the number of misjudged samples above the diagonal of the confusion matrix is much more than that below the diagonal of the confusion matrix. This phenomenon illustrates that the trained MLP model tends to locate the fault closer to the top area. Through comprehensive observation of Figure 6 and Figure 10, it is found that class 3 has the lowest recall and the highest precision. This also proves the above speculation about the judgment tendency of the model.
The main contributions of this paper are as follows.
1) DT of transformer winding is constructed based on double ladder network. Through the fault simulation of DT, the fault samples are obtained, which solves the dilemma of insufficient fault data to a certain extent.
2) This paper proves that the phase information of transformer frequency response does not provide additional winding deformation information.
3) The mathematical indexes of the frequency response data are extracted, and the MLP model is trained to locate the DSV fault The superiority of MLP is demonstrated by comparison with SVM.
4) The proposed method has been verified on an actual transformer, and its excellent performance tells the potential of MLP in fault location.
Future work can focus on modeling DT more accurately. More frequency response data can be obtained through DT to strive for further spot the fault location. Moreover, the diagnosis of fault degree can also be studied and discussed.
The original contributions presented in the study are included in the article/Supplementary Material, further inquiries can be directed to the corresponding author.
JL: designed and wrote this manuscript. CY, LY, SD, and YL: investigated and revised this manuscript. All authors contributed to the article and approved the submitted version.
This work was supported by the Science and Technology Project of China Southern Power Grid Corporation (Project’s number [036100KK52200047{GDKJXM20202009}]).
The authors declare that the research was conducted in the absence of any commercial or financial relationships that could be construed as a potential conflict of interest.
All claims expressed in this article are solely those of the authors and do not necessarily represent those of their affiliated organizations, or those of the publisher, the editors and the reviewers. Any product that may be evaluated in this article, or claim that may be made by its manufacturer, is not guaranteed or endorsed by the publisher.
Abeywickrama, K. G. N. B., Serdyuk, Y. V., and Gubanski, S. M. (2006). Exploring possibilities for characterization of power transformer insulation by frequency response analysis (FRA). IEEE Trans. Power Deliv. 21 (3), 1375–1382. doi:10.1109/TPWRD.2006.875855
Abeywickrama, N., Serdyuk, Y. V., and Gubanski, S. M. (2008). High-frequency modeling of power transformers for use in frequency response analysis (FRA). IEEE Trans. Power Deliv. 23 (4), 2042–2049. doi:10.1109/TPWRD.2008.917896
Abu-Siada, A., Hashemnia, N., Islam, S., and Masoum, M. A. S. (2013). Understanding power transformer frequency response analysis signatures. IEEE Electr. Insul. Mag. 29 (3), 48–56. doi:10.1109/MEI.2013.6507414
Abu-Siada, A., Mosaad, M. I., Kim, D., and El-Naggar, M. F. (2020). Estimating power transformer high frequency model parameters using frequency response analysis. IEEE Trans. Power Deliv. 35 (3), 1267–1277. doi:10.1109/TPWRD.2019.2938020
Deng, X., Zhang, Z., Zhu, H., and Kang, Y. (2023). Early fault diagnosis of transformer winding based on leakage magnetic field and DSAN learning method. Front. Energy Res. 10. doi:10.3389/fenrg.2022.1058378
Duvvury, V. S. B. C., and Pramanik, S. (2021). An attempt to identify the faulty phase in three-phase transformer windings using an advanced FRA measurement technique. IEEE Trans. Power Deliv. 36 (5), 3162–3171. doi:10.1109/TPWRD.2020.3035361
Hashemnia, N., Abu-Siada, A., and Islam, S. (2015a). Improved power transformer winding fault detection using FRA diagnostics – part 1: Axial displacement simulation. IEEE Trans. Dielectr. Electr. Insulation 22 (1), 556–563. doi:10.1109/TDEI.2014.004591
Hashemnia, N., Abu-Siada, A., and Islam, S. (2015b). Improved power transformer winding fault detection using FRA diagnostics – part 2: Radial deformation simulation. IEEE Trans. Dielectr. Electr. Insulation 22 (1), 564–570. doi:10.1109/TDEI.2014.004592
Jia, J., Fu, H., Wang, B., Li, Y., Yue, Y., Yuan, C., et al. (2022). Acoustic-electrical joint localization method of partial discharge in power transformer considering multi-path propagation impact. Front. Energy Res. 10. doi:10.3389/fenrg.2022.851299
Li, Y., Hou, H., and Sheng, G. (2020). “Data expansion method of transformer oil chromatogram based on generative adversarial net model,” in Proceedings of the 2020 8th International Conference on Condition Monitoring and Diagnosis (CMD), Phuket, Thailand, October 2020, 25–28.
Liu, J., Yao, C., Yu, L., Dong, S., and Liu, Y. (2022). “An attempt of transformer winding fault location based on digital twin,” in Proceedings of the 2022 IEEE International Conference on High Voltage Engineering and Applications (ICHVE), Chongqing, China, September 2022, 25–29.
Liu, J., Zhao, Z., Pang, K., Wang, D., Tang, C., and Yao, C. (2020). Improved winding mechanical fault type classification methods based on polar plots and multiple support vector machines. IEEE Access 8, 216271–216282. doi:10.1109/ACCESS.2020.3041298
Liu, J., Zhao, Z., Tang, C., Yao, C., Li, C., and Islam, S. (2019). Classifying transformer winding deformation fault types and degrees using FRA based on support vector machine. IEEE Access 7, 112494–112504. doi:10.1109/ACCESS.2019.2932497
Ma, G., Liu, Y., Li, Y., Fan, X., Xu, C., and Qin, W. (2021). Optical frequency-response analysis for power transformer. IEEE Trans. Power Deliv. 36 (3), 1562–1570. doi:10.1109/TPWRD.2020.3011422
Mondal, M., Kumbhar, G. B., and Kulkarni, S. V. (2018). Localization of partial discharges inside a transformer winding using a ladder network constructed from terminal measurements. IEEE Trans. Power Deliv. 33 (3), 1035–1043. doi:10.1109/TPWRD.2017.2683560
Moutis, P., and Alizadeh-Mousavi, O. (2021). Digital twin of distribution power transformer for real-time monitoring of medium voltage from low voltage measurements. IEEE Trans. Power Deliv. 36 (4), 1952–1963. doi:10.1109/TPWRD.2020.3017355
Portilla, W. H., Mayor, G. A., Guerra, J. P., and Gonzalez-Garcia, C. (2014). Detection of transformer faults using frequency-response traces in the low-frequency bandwidth. IEEE Trans. Industrial Electron. 61 (9), 4971–4978. doi:10.1109/TIE.2013.2282605
Sun, Chenhao, Zhou, Zhuoyu, Zhang, Yongxi, Jia, Zhiwei, Huang, Jingjie, and Huang, Chenyang (2022). A dissolved gas assessment model for power transformers according to weighted association rule mining. Front. Energy Res. 10. doi:10.3389/fenrg.2022.879869
Tolstikhin, I., Houlsby, N., Alexander, K., Beyer, L., Xiaohua Zhai, T. U., Jessica, Yung, et al. (2021). MLP-Mixer: An all-MLP architecture for vision.
Wu, Y., Zhang, K., and Zhang, Y. (2021a). Digital twin networks: A survey. IEEE Internet Things J. 8 (18), 13789–13804. doi:10.1109/JIOT.2021.3079510
Wu, Z., Zhou, M., Lin, Z., Chen, X., and Huang, Y. (2021b). Improved genetic algorithm and XGBoost classifier for power transformer fault diagnosis. Front. Energy Res. 9. doi:10.3389/fenrg.2021.745744
Yang, Y., Chen, Z., Yan, J., Xiong, Z., Zhang, J., Yuan, H., et al. (2019). “State evaluation of power transformer based on digital twin,” in Proceedings of the 2019 IEEE International Conference on Service Operations and Logistics, and Informatics (SOLI), Zhengzhou, China, November 2019, 6–8.
Zhang, Z. W., Tang, W. H., Ji, T. Y., and Wu, Q. H. (2014). Finite-element modeling for analysis of radial deformations within transformer windings. IEEE Trans. Power Deliv. 29 (5), 2297–2305. doi:10.1109/TPWRD.2014.2322197
Zhao, Z., Yao, C., Li, C., and Islam, S. (2018). Detection of power transformer winding deformation using improved FRA based on binary morphology and extreme point variation. IEEE Trans. Industrial Electron. 65 (4), 3509–3519. doi:10.1109/TIE.2017.2752135
Keywords: transformer, winding, frequency response, fault location, multi-layer perceptron
Citation: Liu J, Yao C, Yu L, Dong S and Liu Y (2023) Using MLP to locate transformer winding fault based on digital twin. Front. Energy Res. 11:1175808. doi: 10.3389/fenrg.2023.1175808
Received: 28 February 2023; Accepted: 12 July 2023;
Published: 27 July 2023.
Edited by:
Sunil Kumar, GIK Institute, PakistanReviewed by:
Hidayat Zainuddin, Technical University of Malaysia Malacca, MalaysiaCopyright © 2023 Liu, Yao, Yu, Dong and Liu. This is an open-access article distributed under the terms of the Creative Commons Attribution License (CC BY). The use, distribution or reproduction in other forums is permitted, provided the original author(s) and the copyright owner(s) are credited and that the original publication in this journal is cited, in accordance with accepted academic practice. No use, distribution or reproduction is permitted which does not comply with these terms.
*Correspondence: Jiangnan Liu, eGp5NzY0MUBzaW5hLmNvbQ==
Disclaimer: All claims expressed in this article are solely those of the authors and do not necessarily represent those of their affiliated organizations, or those of the publisher, the editors and the reviewers. Any product that may be evaluated in this article or claim that may be made by its manufacturer is not guaranteed or endorsed by the publisher.
Research integrity at Frontiers
Learn more about the work of our research integrity team to safeguard the quality of each article we publish.