- 1Beijing Smart-Chip Microelectronics Technology Co., Ltd., Beijing, China
- 2The Power System Wide-Area Measurement and Control Sichuan Provincial Key Laboratory, School of Mechanical and Electrical Engineering, University of Electronic Science and Technology of China, Chengdu, China
A detailed circuit model is discussed in this paper for the operation of magnetic energy harvesters with field shaping capacitors (FSC) feeding constant voltage load. First an equivalent circuit with nonlinear inductance, current source and a diode bridge was given based on the physical analysis of the harvester. Then detailed analysis of the circuit operation and state transitions under various FSC are provided. A mathematical model is established to replace the circuit model so that the optimization of the system parameters, such as number of turns, load voltage, could be carried out directly. Simulation and experimental results are given in the paper to prove the effectiveness of the proposed circuit analysis method.
1 Introduction
The smart grid requires distributed real-time monitoring network to actively sense the states, to define the problems of the power system, to discover knowledge, and to solve the problems Zhang et al. (2021). This means that more and more smart sensor grids need to be integrated into the power system and its apparatus. Even though the power consumption of both the sensors and the microelectronic chips has decreased in the last decades, life long energy supply is still one of the biggest challenges for the widely distributed and wirelessly enabled sensor systems Moon et al. (2013). A cost-effective and self-sustained smart sensing node system uses energy harvesting to convert ambient energy sources into electric power to supply the electronic systems (Sudevalayam and Kulkarni, 2011; Tang et al., 2018). A variety kinds of energy sources Tang et al. (2018), for example, vibrations Ottman et al. (2002), RF energy Facen and Boni (2006), corona current Shi et al. (2023), thermal and solar Tan and Panda (2011), could be utilized with different techniques, but magnetic energy harvesters based on electromagnetic induction is still the most reliable and cost-effective way to extract energy from the power system itself (Moon et al., 2013; White et al., 2018). The power line goes through the center of a magnetic core and the 50 or 60 Hz alternating current in the power line will induce voltage on the secondary side, similar manner with a current transformer. What is different with a current transformer is that the output of the secondary winding is feeding a low impedance load to extract energy. Usually a rectifier is followed to converter the AC voltage to DC so that it can power the sensors and microelectronics.
One of the most challenging problems for the magnetic energy harvester is the magnetic saturation when the transmission line current is high. Reference Moon and Leeb (2015a) and Moon and Leeb (2015b) have developed a circuit model incorporating the nonlinear behaviour of the core to model and predict the harvester system performance. In the analysis of Moon and Leeb (2015a) and Moon and Leeb (2015c), a constant voltage load other than a pure resistor was used as the load of the energy harvester system, which is of much more practical meaning since the energy harvested is usually used to charge a battery or supercapacitor load. Several groups continued to research on utilizing the saturation region of the core Park et al. (2021) and Gruber et al. (2021). Reference Moon and Leeb (2016) and Moon and Leeb (2014) proposed two methods to increase the energy harvested for a constant voltage load without significantly increasing circuit complexity. One method called transfer window alignment (TWA) is to change the energy harvesting timing while another is to increase the time to reach saturation by shaping the core voltage with a field shaping capacitor (FSC) in series connection with the core. A detailed analysis and control strategy of TWA was given in Moon and Leeb (2015b) and the energy extracting capability improved considerably. However, no detailed circuit analysis was done on FSC technology.
In this paper, a comprehensive circuit analysis for the FSC method is introduced based on the nonlinear model of the magnetic core. The optimization of the core and system design parameters are presented. Simulation and experimental results are given as verifications.
2 Materials and methods
2.1 Circuit model of the magnetic core
The primary side could be viewed as a current source iP = IP sin ωt where IP is the peak amplitude of the wire current. The secondary side of the core has current iS. From Ampere’s Law, the magnetic field intensity H at radius r is:
where N is the number of turns of the secondary side. The induced AC voltage is rectified to DC voltage by a full bridge rectifier. The full bridge rectifier could be implemented by Schottky diodes or MOSFETs. The rectified DC voltage usually charges an energy storage device, such as a supercapacitor or a battery. Since the charging of an energy storage device is much slower compared with the voltage rectifying dynamics, the load of the harvester could be modelled as a voltage source VL.
For a ring shape core, B is almost constant across the range under the assumption that H(r) changes little between the outer and inner radius. The flux linkage in the core is:
where A is the cross section area of the core. The induced voltage of the harvester vcore is the time derivative of the flux linkage:
H is calculated from the primary and secondary currents as shown in 1. Using the equations above, the flux linkage is:
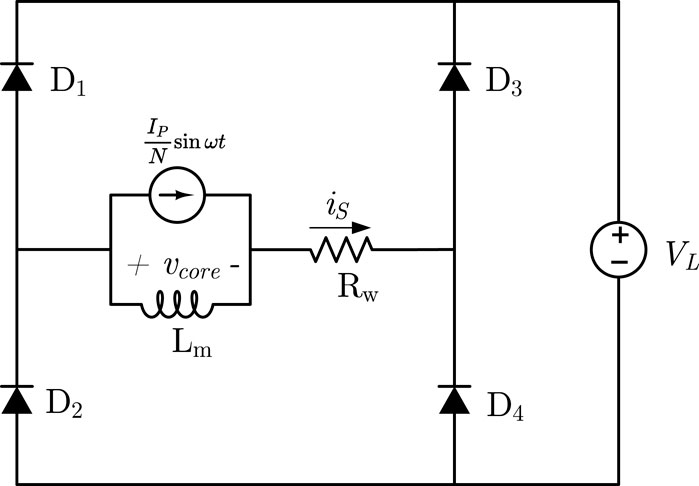
Where B = f(H) is the magnetizing curve. This equation means that the flux linkage in the core relates with the difference between the primary current and the secondary current. Therefore the current transformer of the magnetic energy harvester could be modelled as an ideal current source in parallel with a non-linear magnetizing inductance Lm, as shown in Figure 1.
The complicated relationship between B and H determines the harvesting capability of the harvester. In the linear region where B = μH, Lm is:
where μ is the permeability of the core material and l is the effective flux length of the core. Since N is very large, Lm is large enough so that almost no current flows through it in the linear region. The leakage inductance of the harvester could also be ignored since it is much smaller compared to Lm.
In the saturation region, B ≈ Bsat. From 2, Γ ≈ NABsat. Eq. 3 shows that the saturation of B or Γ is directly caused by accumulating voltage-seconds which is the time integral of vcore. When feeding a constant voltage load, the time it takes to saturate the core is:
The effective permeability of the core decreases dramatically and most of the induced current iS is bypassed by the magnetizing inductor. Much less energy is harvested at this region. However, crudely dividing the magnetizing curve into linear/non-linear regions is far from accurately predicting the harvested energy. There are several methods to establish mathematical model for a non-linear magnetic core. In Vos (2020) the model is established by treating the core permeance as a complex parameter that includes loss. Kuang et al. (2021) used finite element method in both electromagnetic and electrical system. In Moon and Leeb (2015a), the “arctan” function was used to model the saturation where there was one fitting parameter α. In this research, the Chan model Chan et al. (1991) was chosen since it is relatively easy to implement in circuit simulation tools and provides relatively more freedom to emulate the saturation behavior. The Chan model was defined by three parameters:
where Bsat is the saturation flux density; Br is the remnant flux density and Hc is coercive force.
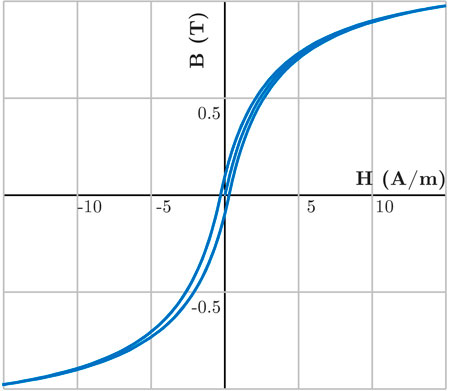
A high permeability amorphous non-crystalline core VITROPERM 500F VacuumSchmelze (2022) was used as the magnetic core. The fitted parameters for this core material are: Bsat = 1.19 T, Br = 0.1 T, Hc = 0.3 A/m. The simulated B-H curve using the Chan model is shown in Figure 2, which is very close to the curve given in the datasheet. Note that the H of the core starts from 0 and is swept forward and backward. The hysteresis of the material is relatively small so the iron loss of the core is ignored in this paper.
2.2 Circuit model of the magnetic energy harvester
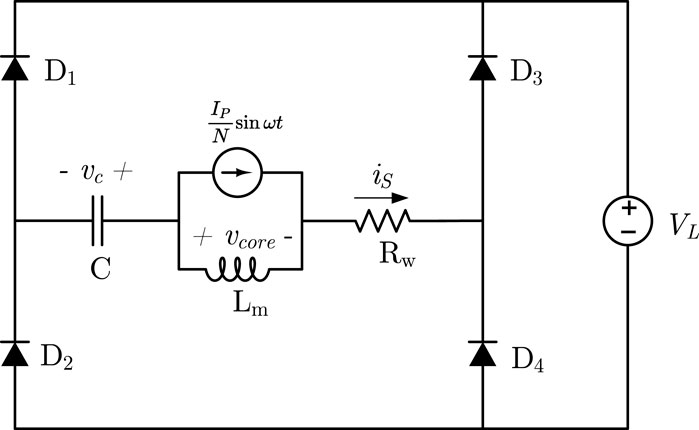
In the circuit of Figure 1, the voltage of the core vcore equals to the load voltage VL during the linear region when neglecting the voltage drop across diodes. For the rectifier circuit with an FSC as shown in Figure 3, vcore is not constant any more due to the capacitor voltage vC. SincevC lags iS, vC might be negative at the start of one period. vcore could be less than VL at the beginning of the energy transfer. Therefore the total energy transfer time Tsat may extend after adding an FCS.
The voltage and current waveforms of the harvester with and without FSC are shown in Figure 4. The peak value of the primary current is 14 A, the secondary side has N = 200 turns and the load voltage VL = 7 V. The value of the FSC is 20 μF. The rectifying diodes are Schottky diodes 1N5819 from DIODES whose forward voltage VF is 0.2 V. As expected, with FSC vcore is smaller than VL at the beginning of the energy transfer. Tsat is 0.5 ms wider, which means more energy is harvested with FSC. The power harvested at different FSC value (5, 15, and 25 μF) is 80, 125, and 87 mW respectively. The power extracted from the core under a certain operating point does not increase monotonically with the value of FSC. There should be an optimal value for FSC. The waveforms of vcore and vc are shown in Figure 5. Even though the peak value of vC and vcore increases as FSC decreases, Tsat first increases and then decreases. The shape of vC also becomes different at 5 μF. In order to find out the optimized FSC and load voltage VL under a specified design, a detailed circuit analysis should be carried out.
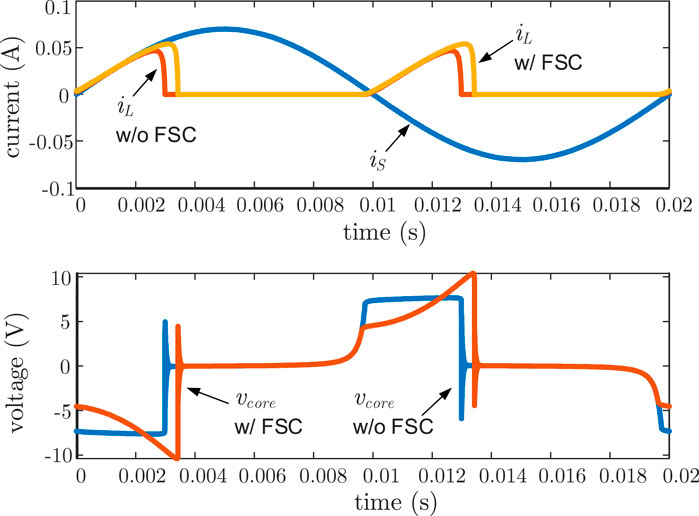
FIGURE 4. Comparison of voltage and current waveforms of the energy harvesters with and without FSC: the waveforms with longer transfer window is with FSC.
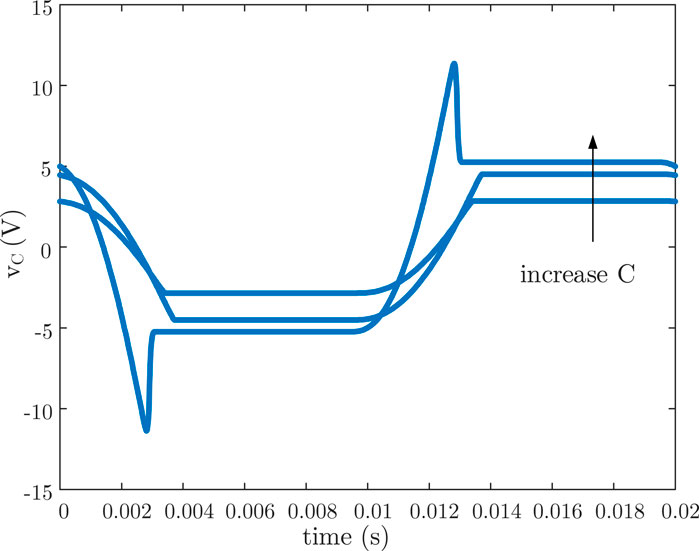
FIGURE 5. Capacitor voltage waveforms of the energy harvesters with different FSC: 5, 15, and 25 μF.
2.3 Circuit analysis of the magnetic energy harvester with FSC
Since the circuit behaves symmetrically at ω ∈ [0, π] and [π, 2π], the analysis will be focused on the first half of the period. At the beginning of a new sinusoidal period, Lm is in its linear region and it is so large that iS entirely flows through FSC. Diodes D2 and D3 turn on. From KVL:
where vC and vR are the voltages of FSC and wire resistance respectively, as shown in Figure 3. By integrating iS, vC is:
where VC0 is initial voltage of the FSC at t = 0. Apparently the capacitor voltage at t = Tsat depends on the value of FSC. Therefore, the circuit operation could be divided into two scenarios depending on the value of FSC.
2.3.1 Large FSC
At t = Tsat, Lm enters into saturation region. Its value decreases dramatically and iS flows entirely into Lm. Based on the reference direction definition in Figure 3, the voltage-seconds accumulating in the core drive it from positive saturation to negative saturation:
Diodes D2 and D3 turn off at Tsat. vC keeps unchanged during the rest of the half period since there is no current flowing through it. vC(Tsat) will be the capacitor voltage initial value for [π, 2π]. From the principle of symmetry:
Solving Eqs 8, 10, 11 numerically, the value of Tsat and VC0 could be obtained. The average power harvested is:
2.3.2 Small FSC
From Figure 5, the capacitor voltage vC is not continuous when C = 5 μF. The capacitor discharges rapidly once the core enters saturation. Therefore the relationship in Eq. 11 is no longer valid. To solve Tsat and VC0, the discharging process of the FSC should be examined. At t = Tsat, the current source is bypassed by the magnetizing inductance Lm and diodes D2 and D3 turn off. In view of the fact that the value of iS and Lm is small, the voltage drop on Lm is very small compared to vC(Tsat). If the absolute value of vC(Tsat) is larger than VL, diodes D1 and D4 will turn on to discharge the capacitor through the voltage source VL, magnetizing inductance Lm and wire resistance Rw. This is a classical RLC transient process. The resonance between C and Lm will end when iC goes back to zero and diode D1 and D4 will turn off then. Since the resonant frequency of C and Lm is large compared with the line frequency so the discharging time of the capacitor is very short. After discharging process, vC stays unchanged since all the diodes are off.
After solving the 2nd order ODE of the RLC circuit, the capacitor voltage during discharging is:
where α is the damping coefficient and ωd is the oscillation frequency. They could be calculated as:
The discharging time for the capacitor is half of the RLC oscillation period π/ωd. vC drops to −VC0 according to the principle of symmetry. Together solving Eqs 10, 13, 14 numerically, the value of Tsat and VC0 could be obtained. The average power harvested during D2 and D3 on is still based on Eq. 12 while the average power harvested during D1 and D4 on is:
It is worth noting that the value of L used in Eqs 13–15 comes from calculation by Eqs 5, 7.
A comparison of the harvested power calculated by the mathematical model presented above and circuit simulation is shown in Figure 6. The simulation condition is the same as Section 2.3: Ip = 14 A, N = 200, C = 15 μF. The two methods output very similar results and the biggest difference is less than 5%. Therefore it is more convenient to use the numerical model to optimize the system design.
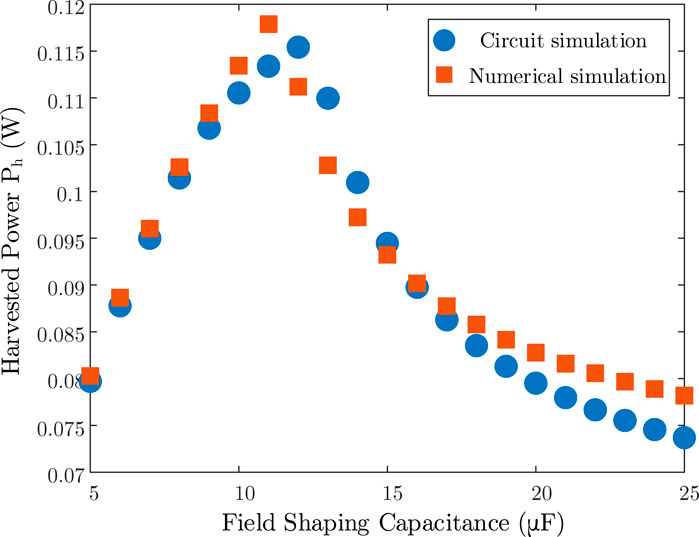
FIGURE 6. Comparison of the harvest power of the harvester with different FSC from SPICE simulation and numerical model.
3 Results
In this section, the optimized field shaping capacitor value C and the harvester core design will be investigated. This equation is valid as long as the primary current is not high enough so the voltage drop on the wire resistance could be ignored. The optimized FSC value with different VL under the condition (Ip = 14 A, N = 200) is shown in Figure 7. The optimal FSC decreases as the load voltage VL increases. Note that the optimal power harvested with FSC under different VL is 0.124, 0.125, 0.118, and 0.111 W respectively. Without FSC, the power harvested is 0.109, 0.099, 0.090, and 0.082 W respectively from 6. A proper FSC can improve the energy extraction capability significantly, especially when the load voltage is high. Since higher VL results in shorter Tsat, the harvester will extract less power as the load voltage increases if no special voltage shaping techniques are used. Higher VL also means a stronger voltage shaping, which means a smaller FSC is needed.
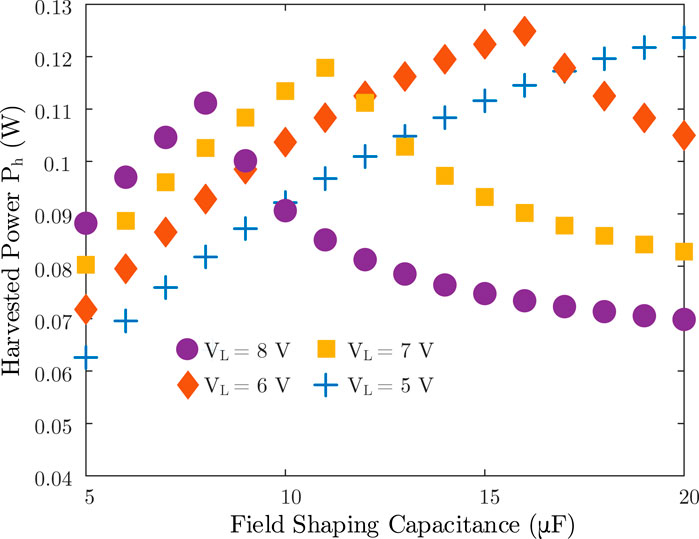
FIGURE 7. Numerical simulation of the harvested power vs. FSC value (Ip = 14 A, N = 200) with different VL: 5, 6, 7, and 8 V.
The optimized FSC value with different N under the condition (Ip = 14 A, VL = 6 V) is shown in Figure 8. Figure 8 reveals the fact that N has a very complicated impact on the energy harvesting efficiency. When the number of turns is low, the core is easier to get saturated based on 6 while the secondary current would be too small to effectively charge the load if N is large.
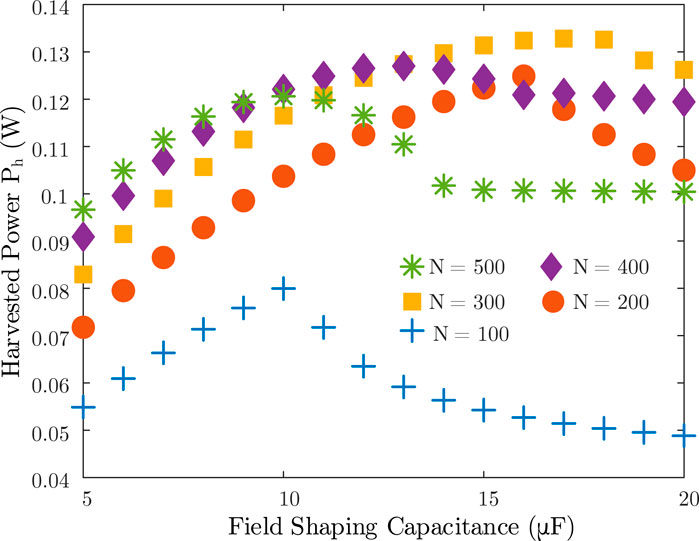
FIGURE 8. Numerical simulation of the harvested power vs. FSC value (Ip = 14 A, VL = 6 V) with different N: 100, 200, 300, and 400.
The optimized FSC value with different primary current peak value IP under the condition (VL = 6 V, N = 200) is shown in Figure 9. The maximum amount of energy harvest is proportional to Ip, as predicted by 12. The optimal FSC changes rapidly as Ip increases, from 5 to 20 μF as Ip increases from 3 to 20 A. This is owing to the fact that small FSC could be easily charged up by large IP based on Eq. 9, which results a stronger field shaping effect. Figure 10 is the power vs. current plot. The power monotonically increases with primary current, as indicated in Eq. 12.
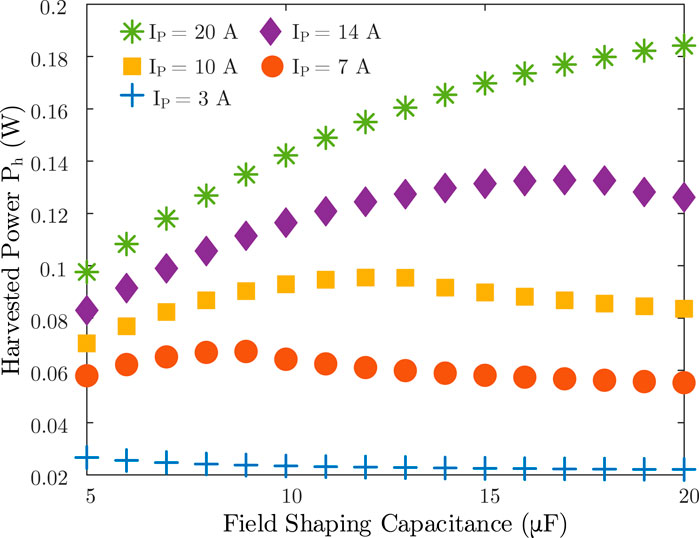
FIGURE 9. Numerical simulation of the harvested power vs. FSC value (VL = 6 V, N = 200) with different Ip: 3, 7, 10, 14, and 20 A.
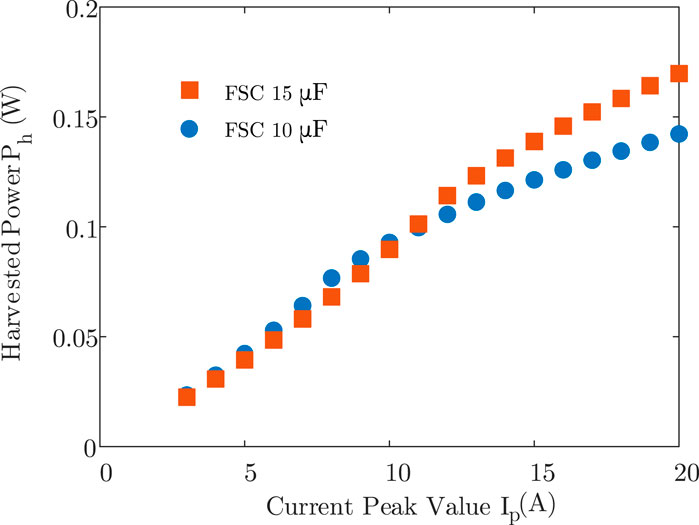
FIGURE 10. Numerical simulation of the harvested power vs. peak current value (VL = 6 V, N = 200) with different FSC: 10, 15 μF.
An experimental prototype was built to verify the analysis. Figure 11 shows the current/voltage waveforms of the harvester with different FSC. The current of the constant voltage load was measured through a current sensing resistor and differential amplifier. Figures 11A, B show that the power transfer time increases significantly with a 14.7 μF FSC. For small FSC, 4.7 μF for example, as in Figure 11C, the current peak is the result of RLC discharging explained in Eq. 13.
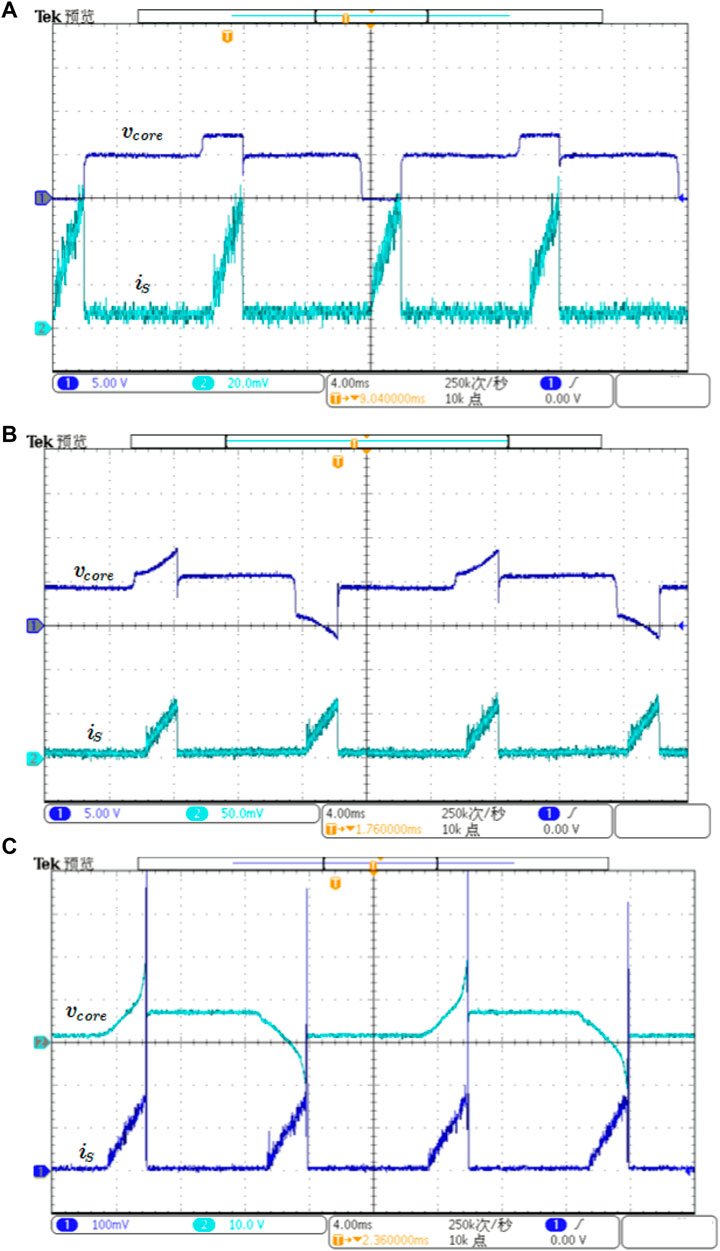
FIGURE 11. Comparison of the voltage/current waveforms of the harvester: (A) without FSC, (B) with 14.1 μF FSC and (C) 4.7 μF FSC.
The harvested power from experiments and numerical calculation with different FSC is shown in Figure 12. The experiment condition is: IP = 14 A, N = 200, VL = 5 V. Simulation and experimental results show the same trend. The difference between the experiments and numerical calculation mainly comes from the discrepancies between the piecewise assumption of the magnetic core’s B-H curve in the numerical model and its real saturation curve.
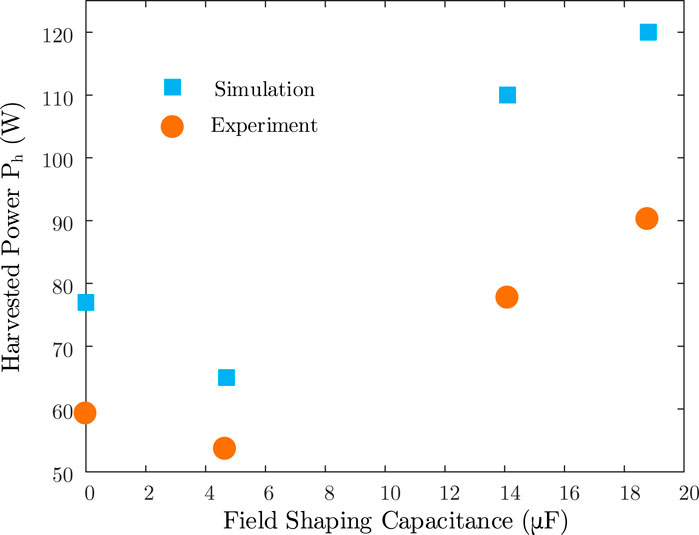
FIGURE 12. Comparison of the harvest power of the harvester with different FSC from numerical model calculation and experiments.
4 Discussion
This paper discusses the modeling and optimization process for the magnetic energy harvester with field shaping capacitors in order to enhance its energy extracting capability. The Chan model is used to emulate the saturation of the magnetic core. Then a circuit model is given to study the behaviour of the harvester system feeding a constant voltage load. Based on the circuit model, a detailed mathematical model is developed based on the value of FSC so that the fast calculation and optimization of the system performance is possible through numerical software. Optimization of the harvester parameters under various operating conditions are discussed. The optimal FSC is sensitive to the operation conditions of the energy harvester: load voltage, number of turns and primary side current. Therefore FSC is especially suitable for applications with almost constant current, for example, harvesting energy on the cable of an induction machine. With the model introduced in this paper, designers could maximize the output power through an optimum design of the harvester: number of turns, size of the core and field shaping capacitors.
Data availability statement
The datasets presented in this article are not readily available because the dataset are not available to the public due to authors’ organization policies. Requests to access the datasets should be directed to bWluc3VuQHVlc3RjLmVkdS5jbg==.
Author contributions
YM, MS, MZ, and JL contributed to conception and design of the study. GC contributes to the theoretical part. YM designed the experiments. ML and MZ performed simulation and experiments. YM wrote the first draft of the manuscript. MS wrote sections of the manuscript. All authors contributed to the article and approved the submitted version.
Funding
Research reported in this publication was partially supported by the Laboratory Open Fund of Beijing Smart-Chip Microelectronics Technology Co., Ltd., under contract No. SGTYHT/21-JS-223. The funder was not involved in the study design, collection, analysis, interpretation of data, the writing of this article, or the decision to submit it for publication.
Conflict of interest
Author YM was employed by Beijing Smart-Chip Microelectronics Technology Co., Ltd.
The remaining authors declare that the research was conducted in the absence of any commercial or financial relationships that could be construed as a potential conflict of interest.
Publisher’s note
All claims expressed in this article are solely those of the authors and do not necessarily represent those of their affiliated organizations, or those of the publisher, the editors and the reviewers. Any product that may be evaluated in this article, or claim that may be made by its manufacturer, is not guaranteed or endorsed by the publisher.
References
Chan, J., Vladimirescu, A., Gao, X.-C., Liebmann, P., and Valainis, J. (1991). Nonlinear transformer model for circuit simulation. IEEE Trans. Computer-Aided Des. Integr. Circuits Syst.10, 476–482. doi:10.1109/43.75630
Facen, A., and Boni, A. (2006). “Power supply generation in cmos passive uhf rfid tags,” in 2006 Ph.D. Research in microelectronics and electronics, 33–36. doi:10.1109/RME.2006.1689889
Gruber, G., Neumayer, M., Bretterklieber, T., Siegl, A., and Felsberger, R. (2021). “Miniaturized magnetic energy harvester: Lightweight and safe transformer design,” in 2021 IEEE international instrumentation and measurement technology conference (I2MTC), 1–6. doi:10.1109/I2MTC50364.2021.9460033
Kuang, Y., Chew, Z. J., Ruan, T., and Zhu, M. (2021). Magnetic field energy harvesting from current-carrying structures: Electromagnetic-circuit coupled model, validation and application. IEEE Access9, 46280–46291. doi:10.1109/ACCESS.2021.3068472
Moon, J., Donnal, J., Paris, J., and Leeb, S. B. (2013). “Vampire: A magnetically self-powered sensor node capable of wireless transmission,” in 2013 twenty-eighth annual IEEE applied power electronics conference and exposition (APEC), 3151–3159. doi:10.1109/APEC.2013.6520751
Moon, J., and Leeb, S. B. (2015a). Analysis model for magnetic energy harvesters. IEEE Trans. Power Electron.30, 4302–4311. doi:10.1109/TPEL.2014.2357448
Moon, J., and Leeb, S. B. (2015b). “Enhancement on energy extraction from magnetic energy harvesters,” in 2015 IEEE energy conversion congress and exposition (ECCE), 427–433. doi:10.1109/ECCE.2015.7309720
Moon, J., and Leeb, S. B. (2016). Power electronic circuits for magnetic energy harvesters. IEEE Trans. Power Electron.31, 270–279. doi:10.1109/TPEL.2015.2401336
Moon, J., and Leeb, S. B. (2014). “Power flow control and regulation circuits for magnetic energy harvesters,” in 2014 IEEE 15th workshop on control and modeling for power electronics (COMPEL), 1–8. doi:10.1109/COMPEL.2014.6877207
Moon, J., and Leeb, S. B. (2015c). “Power loss analysis with high primary current in magnetic energy harvesters,” in 2015 IEEE 16th workshop on control and modeling for power electronics (COMPEL), 1–8. doi:10.1109/COMPEL.2015.7236503
Ottman, G., Hofmann, H., Bhatt, A., and Lesieutre, G. (2002). Adaptive piezoelectric energy harvesting circuit for wireless remote power supply. IEEE Trans. Power Electron.17, 669–676. doi:10.1109/TPEL.2002.802194
Park, B., Huh, S., Kim, J., Kim, H., Shin, Y., Woo, S., et al. (2021). The magnetic energy harvester with improved power density using saturable magnetizing inductance model for maintenance applications near high voltage power line. IEEE Access9, 82661–82674. doi:10.1109/ACCESS.2021.3085989
Shi, Y., Cui, X., Qi, L., Zhang, X., Li, X., and Shen, H. (2023). A novel energy harvesting method for online monitoring sensors in hvdc overhead line. IEEE Trans. Industrial Electron.70, 2139–2143. doi:10.1109/TIE.2022.3158028
Sudevalayam, S., and Kulkarni, P. (2011). Energy harvesting sensor nodes: Survey and implications. IEEE Commun. Surv. Tutorials13, 443–461. doi:10.1109/SURV.2011.060710.00094
Tan, Y. K., and Panda, S. K. (2011). Energy harvesting from hybrid indoor ambient light and thermal energy sources for enhanced performance of wireless sensor nodes. IEEE Trans. Industrial Electron.58, 4424–4435. doi:10.1109/TIE.2010.2102321
Tang, X., Wang, X., Cattley, R., Gu, F., and Ball, A. D. (2018). Energy harvesting technologies for achieving self-powered wireless sensor networks in machine condition monitoring: A review. Sensors18, 4113. doi:10.3390/s18124113
Vos, M. J. (2020). A magnetic core permeance model for inductive power harvesting. IEEE Trans. Power Electron.35, 3627–3635. doi:10.1109/TPEL.2019.2933133
White, R. M., Nguyen, D.-S., Wu, Z., and Wright, P. K. (2018). Atmospheric sensors and energy harvesters on overhead power lines. Sensors18, 114. doi:10.3390/s18010114
Keywords: magnetic energy harvester, magnetic saturation, field shaping capacitor, advanced sensing, magnetic saturation analysis
Citation: Ma Y, Liu M, Chen G, Sun M, Zhang M and Li J (2023) Analysis and modeling magnetic energy harvester with field shaping capacitors. Front. Energy Res. 11:1127198. doi: 10.3389/fenrg.2023.1127198
Received: 19 December 2022; Accepted: 22 June 2023;
Published: 10 July 2023.
Edited by:
Mohammed Haj Ahmed, The University of Jordan, JordanReviewed by:
Andrea Toscani, University of Parma, ItalyHussam Khasawneh, The University of Jordan, Jordan
Copyright © 2023 Ma, Liu, Chen, Sun, Zhang and Li. This is an open-access article distributed under the terms of the Creative Commons Attribution License (CC BY). The use, distribution or reproduction in other forums is permitted, provided the original author(s) and the copyright owner(s) are credited and that the original publication in this journal is cited, in accordance with accepted academic practice. No use, distribution or reproduction is permitted which does not comply with these terms.
*Correspondence: Min Sun, bWluc3VuQHVlc3RjLmVkdS5jbg==; Yan Ma, bWF5YW5Ac2djaGlwLnNnY2MuY29tLmNu
 Yan Ma1*
 Min Sun
 Jian Li