 Xiangxi Duan
 Qi Huang1,3*
94% of researchers rate our articles as excellent or good
Learn more about the work of our research integrity team to safeguard the quality of each article we publish.
Find out more
ORIGINAL RESEARCH article
Front. Energy Res., 30 August 2022
Sec. Smart Grids
Volume 10 - 2022 | https://doi.org/10.3389/fenrg.2022.990509
This article is part of the Research TopicPlanning, Operation and Control of Modern Power System with Large-scale Renewable Energy GenerationsView all 11 articles
This paper focuses on the problems of frequent wildfire occurrences along the transmission corridor and the lack of accurate and timely monitoring means for early warnings. Furthermore, this paper evaluates the rapid warning method for wildfire occurrences along the transmission corridor driven by power system monitoring data. First, we established the relationship between the historical data of wildfires along the transmission corridor and the operating state information of a power grid based on the Apriori association rule algorithm; the characteristic signals of the transmission line when wildfires occur were mined. Second, based on the characteristics of the time distribution of wildfire occurrences along the transmission corridor, a nonlinear regression model was created to further improve the prediction accuracy. Finally, by combining the characteristic signals and time distribution characteristics, we developed an early warning method. This method not only addresses the challenges faced by meteorological satellite remote sensors caused by the weather, the long transit time interval, and the high cost of adding sensors, but it also realizes the remote and rapid early warning of wildfires along the transmission corridor. Finally, a case study of practical data of a certain area in southwest China is used to verify the proposed method. The results show the high accuracy and timeliness of the proposed method.
Most renewable energy sources are concentrated in areas far from load centers and transported over long distances by transmission lines. These renewable energy transmission corridors are prone to wildfires. The safe and stable operation of those transmission lines is related to power grid security and people’s livelihoods. However, as those transmission lines often cross vegetation-rich areas, the transmission corridor is prone to outbreaks of wildfires due to the combined effects of human activities and meteorological factors, which in turn threaten the safety of the power grid in the area and affect the normal power supply (Lu et al., 2017; Liu et al., 2018). Under wildfire conditions, the breakdown voltage of the transmission line will be significantly reduced. This dielectric strength reduction of the transmission line gap is the result of the combined action of the flame temperature, electrons and ions, and solid particles (Wu et al., 2011; Antonov, 2021). When the transmission line is grounded, short-circuited, or disconnected, it may also induce wildfires. For example, the direct cause of the March.30 forest fire in Liangshan, Sichuan Province in China is that wires reserved for connecting wires on both sides of the tower overlapped with the hoop of the pole cross-arm support frame under the action of the specific wind direction. This resulted in a permanent grounding discharge fault, causing the aluminum metal of the wire body to melt. The insulating material caught fire and burned, resulting in a significant loss of life and property (Accident investigation team, 2021). In another example, the wildfires in California were mainly caused by the failure of the power transmission equipment (Muhs et al., 2020).
The traditional transmission line wildfire warning mainly relies on manual inspections, which require considerable manpower and material resources. Currently, the research on early warnings for transmission line wildfires mainly focuses on the installation of smoke and fire detection devices at fixed locations, the installation of video surveillance devices for transmission lines, meteorological radar monitoring, and meteorological satellite remote sensing image recognition. Based on polar-orbiting satellite and geostationary satellite images, researchers (Liang et al., 2020) improved the threshold conditions, and adaptive dynamic threshold conditions were used for fire spot identification. In one study (Liu et al., 2020), the authors proposed a transmission line wildfire fault detection method based on millimeter-wave radar technology that combined infrared multi-spectral technology with millimeter-wave radar technology. In another study (Dian et al., 2019), a cellular automata model based on the principle of disaster geography was used to predict the spatiotemporal process of wildfires, and the proposed line interruption model was used to illustrate the mechanism of wildfire damage to transmission lines. A spatiotemporal context algorithm based on Himawari-8 geostationary satellite data was proposed in the literature (Chen et al., 2019). Other researchers (Muhs et al., 2021) proposed a probabilistic statistics-based hot spot identification algorithm for transmission lines. The automatic identification algorithm of wildfires in transmission lines was studied based on the weather radar echo database and the network monitoring of a new generation weather radar (Shu et al., 2020). Melnikov et al. (Melnikov et al., 2008) used S-band dual-polarization radar to analyze the radar polarization parameter characteristics of a forest fire echo in Oklahoma, United States. In another work (Beltramone et al., 2017), researchers used three risk factors of transmission line historical faults, real-time monitoring data, and meteorological forecast information, to develop an early warning evaluation model for transmission line fire prevention based on AHP.
Meteorological satellite remote sensing is the most widely used wildfire monitoring technology, which has the advantages of a wide monitoring range, short monitoring period, and high spatial resolution. However, there are disadvantages, such as a long time interval for satellite transit, blind spots in the scanning coverage, and easy interference in image recognition. Fires cannot be usually found at first, especially in the case of wildfires caused by transmission line faults. Installation of smoke and fire detection devices at fixed locations is costly, and maintenance costs are considerable. The use of weather radar to detect wildfires is still in its infancy, and it is susceptible to clutter interference, such as that from factories and wind power. Currently, the power grid has a relatively complete information monitoring system, and it is possible to carry out fire warning and analysis based on the information of the power grid monitoring system. In this paper, we propose a rapid early warning method for wildfires along the transmission corridors based on power grid monitoring information. Then the mechanism’s relationship between wildfires along the transmission corridors and warning signals is investigated. The characteristic signals were mined using the Apriori association rule algorithm based on historical event records and related alarm signals of wildfires along the transmission corridor. Early warnings based on characteristic signals are susceptible to interference from similar warning signals caused by other power grid equipment failures. To further improve early warning accuracy, this paper analyzes the time distribution of regional wildfires along the transmission corridor. A nonlinear regression model of time distribution was established, and the optimization of the probability early warning value was carried out. Finally, by combining the characteristic signals and time distribution nonlinear regression model, the early warning method based on the characteristic signals and time distribution nonlinear regression model was created, and the remote and rapid early warning of wildfires along the transmission corridor was realized. This work eliminate the interference of meteorological conditions on meteorological satellite remote sensing without additional installment of sensors. It greatly contributes to manpower and financial reduction. Meanwhile the safe and stable delivery of large-scale renewable energy power is guaranteed.
In the first section of this paper, the mechanism’s relationship between the transmission corridor fire and alarm signal is studied, and the Apriori association rule algorithm is introduced. In the second section, the nonlinear regression model of the time distribution of the wildfire along the transmission corridor is introduced to solve the problem of easy interference and low accuracy of the warnings based on the characteristic signals alone. In the third section, the probability warning value optimization of the time distribution nonlinear regression model is introduced. The early warning method based on the characteristic signal of wildfires and the time distribution nonlinear regression model is formed, and the remote and rapid early warning of wildfire is realized. In the fourth section, the feasibility of the method is verified by numerical examples. Based on the calculations for Example 1, and using the Liangshan forest fire (30 March) as an example, the high accuracy and timeliness are demonstrated by comparing the satellite image recognition method with the method described in this paper without considering the temporal distribution characteristics of mountain fires. In the fifth section, we discuss our conclusions, summarize the advantages of our method compared with the existing methods, and suggest the applications of the method.
A wildfire is a kind of multiphase weak plasma containing solid and liquid particles with different particle sizes at high temperatures. When a wildfire spreads to the vicinity of the transmission line, the insulation strength of the transmission line decreases, and it is easy to cause the trip of the line due to the phase-to-phase fault and ground fault. The reasons for the decline of transmission line insulation strength caused by wildfire are as follows: 1) The high temperature of the flame reduces the air density, which leads to the decrease of the insulation level; 2) the electric field near the transmission line is distorted by the charge in the flame; and 3) particle contact leads to a discharge (Wu et al., 2011). Figure 1 shows the signal generation mechanism of a transmission line failure caused by a wildfire using the transmission lines of various voltage levels in southwest China as an example.
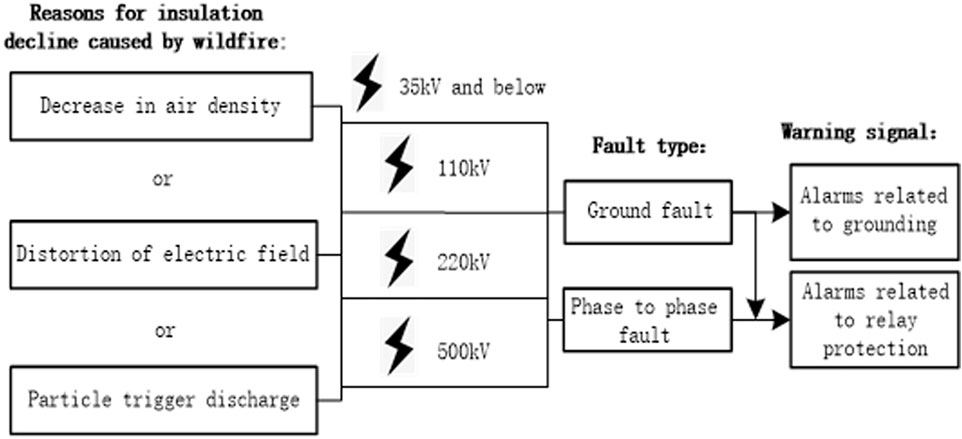
FIGURE 1. Mechanism of generating alarm signals.
Most transmission lines of 35 kV and below are non-effective grounded systems. When a single-phase grounding fault occurs, the transmission lines will not trip directly and can still run for approximately 2 h. If a grounding fault occurs on transmission lines of 35 kV and below, alarms related to grounding will be triggered. When the ground fault and phase-to-phase fault occur on transmission lines of 110 kV and above, the relay protection machine action will be triggered and a trip will be caused.
In the actual operation of transmission lines, faults such as grounding, short circuits, and transmission line disconnections may occur due to aging, substandard processes, wind action, lightning strikes, and other factors. As shown in Figures 2, 3, the transmission lines were broken by a lightning strike, and the installation process was not up to standard: these occurrences may both cause a wildfire.
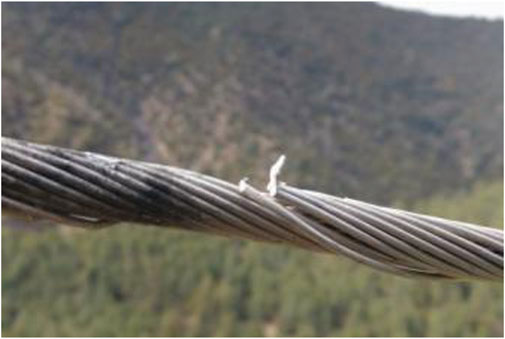
FIGURE 2. The transmission lines were broken by a lightning strike.
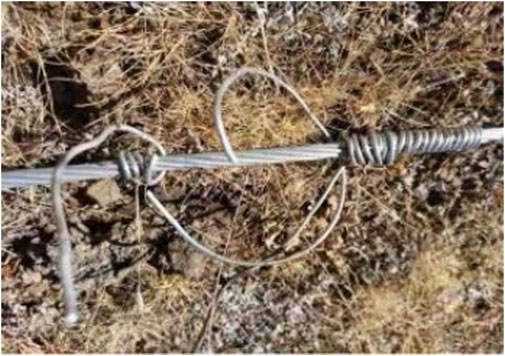
FIGURE 3. Substandard tying process.
When a wildfire is caused by a transmission line fault, the triggering mechanism of the alarm signals occurs as shown in Figure 4.
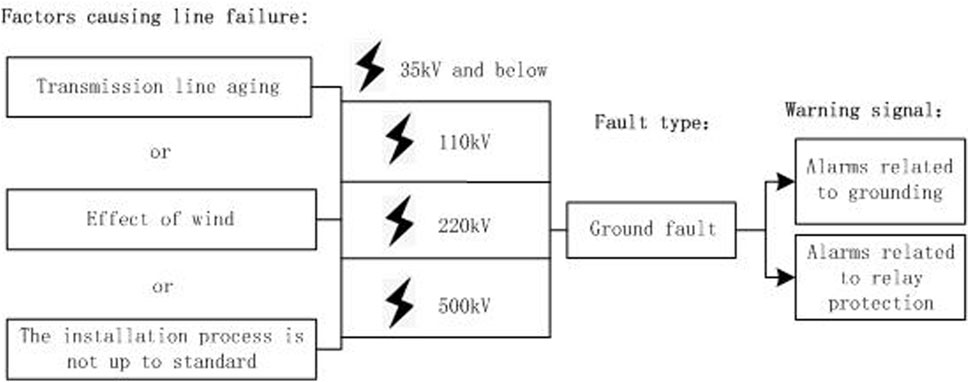
FIGURE 4. Mechanism of generating alarm signals.
As shown in Figure 4, when the above factors cause a ground fault of the transmission line, the relevant alarm signals will be triggered. Similar to the alarm signals of a power grid failure caused by wildfire, alarms related to grounding and relay protection will be triggered. These alarm signals are sent to the power grid dispatch center or centralized control station through the remote devices in the substation. Therefore, it is possible to use the alarm signal of the control center for the rapid warning for wildfires.
The analysis of the signal triggering mechanism and the characteristics of the power grid equipment in southwest China revealed the related alarms that may be triggered. These are listed in Table 1. To further mine the data for the characteristic signals of wildfires in the transmission corridor during the actual operation of the power grid, it is necessary to match the recorded data of wildfires in the transmission corridor with the substation or power plant on both sides of the line, and associate the alarm data from 5 h before the start of wildfire to the end of wildfire in the transmission corridor.
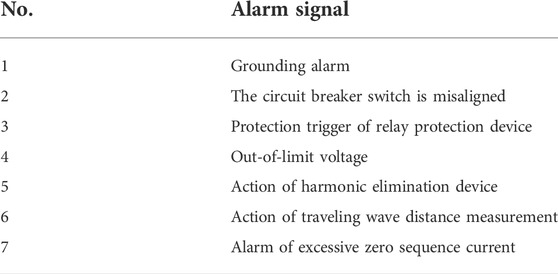
TABLE 1. Related alarm signals.
The Apriori association rule algorithm is used to mine characteristic signals of transmission lines with different voltage levels, and the characteristic signals are mined from a large number of historical alarm data related to wildfire occurrence along the transmission line. The Apriori association rule algorithm is an iterative method of the layer-by-layer search. Its core idea is to generate candidate items and their support through connection and then generate frequent itemsets through pruning. The algorithm flow is shown in Figure 5.
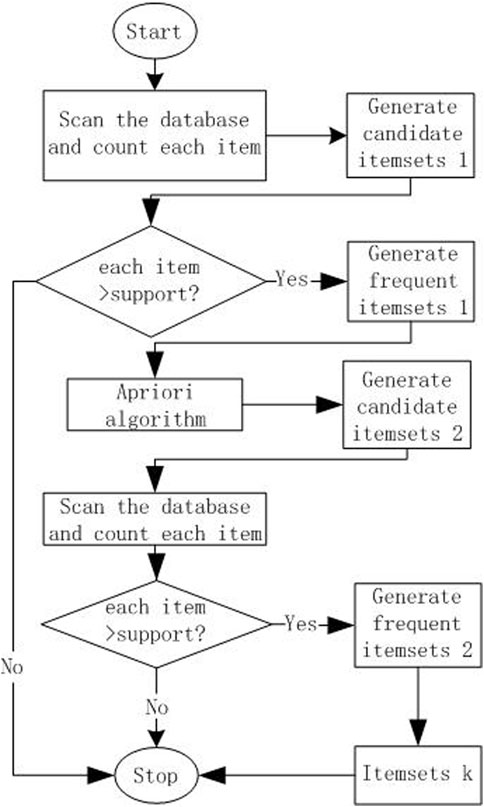
FIGURE 5. The computational process of the Apriori association rule algorithm.
The Apriori association rule algorithm is used to mine characteristic signals of transmission lines with different voltage levels. This is mined from a large number of historical alarm data related to wildfire occurrence along the transmission corridor. The Apriori association rule algorithm is a layer-by-layer iterative search method that generates candidate items and their support by concatenation and then generates frequent itemsets by pruning (Tian et al., 2020).
The alarm signal is expressed as follows:
where i is the serial number of a characteristic signal.
Support =
Confidence =
Itemset k: If an event contains k elements, the event is called itemset k.
Frequent itemset k: The event met the minimum support threshold.
Strong association rules: The k-dimensional data itemset is a necessary condition for a frequent itemset, which is the set of all its k − 1 dimensional subitems, and is also a frequent itemset. These are rules that meet both minimum support thresholds and minimum confidence thresholds.
The computational process of the Apriori association rule algorithm is shown in Figure 5.
As shown in Figure 5, the one-dimensional itemset is scanned, and the one-dimensional frequent itemset is generated if the minimum support is satisfied. The one-dimensional itemset that satisfies the minimum support continues the minimum support calculation for the two-dimensional itemset until the k itemsets do not satisfy the minimum support. In the frequent itemset k − 1, the itemsets that do not meet the minimum support have been eliminated. If the remaining itemset meets the minimum confidence requirement through the confidence calculation, then the strong association rule in the itemset is obtained, and the itemset that meets the strong association rule is the characteristic signal.
The analysis of the signal generation mechanism of a transmission corridor wildfire in the previous section indicated that the characteristic signal can realize the remote and rapid early warning of a transmission corridor wildfire. However because the grid equipment operation fault or abnormality will also trigger a similar signal, relying only on the characteristic signal will trigger the early warning frequently and the accuracy of early warning is low. However, due to seasonal climate changes, vegetation changes, human activities, and other factors, the transmission corridor wildfires have the characteristics of time distribution and an auxiliary feature signal for judgment, which can improve the accuracy of the early warning.
A nonlinear regression model was established by polynomial (Lamich et al., 2017). The frequency of wildfires distribution in each month is expressed as follows:
where i indicates a month in a year.
The monthly probability distribution of wildfires in this region is as follows:
Similarly, i indicates an hour in a day, and the hourly probability distribution of wildfires in this region is
Equations 3, 4 were used to calculate the probability distribution, and then curve fitting was carried out to establish a nonlinear regression model, which was represented by polyfit (x,y,n). x represents the number of months or hours, y represents the probability value of the corresponding months or hours, and n represents the order of the fitting curve function. Since the occurrence probability of a wildfire near the transmission line is a low-probability event, to ensure that the accuracy of the model reaches 0.001, the order of fitting curve function is first determined by the successive increment method. The monthly distribution of wildfires in the transmission corridors can serve as an example; the calculation process of order determination is shown in Figure 6.
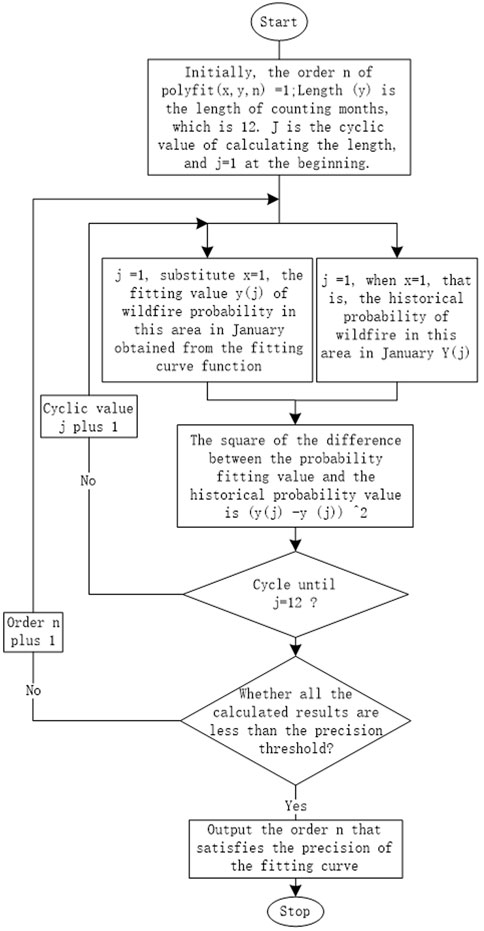
FIGURE 6. The calculation process of the order determination of fitting curve function.
The expression of polyfit (x,y,n) for the fitting curve function is as follows:
Initially, the order n of polyfit (x,y,n) is 1, Length (y) is the length of counting months, which is 12. J is the cyclic value of calculating the length, and j = 1 at the beginning.
The square of the difference between the probability fitting value and the historical probability value is (y(j) -y (j)) ^2. When all the calculated results are less than the precision threshold, the order n that satisfies the precision of the fitting curve is output.
Combined with the calculation process, the calculation is cyclic from the time when the order n is 1, and finally the order n when the required precision is obtained.
Similarly, we take the monthly probability distribution of wildfires along the transmission corridor as an example; after determining the order n that meets the accuracy requirement, the sample point is
To minimize the loss function L, the partial derivative of each coefficient of the loss function is taken so that the value of the partial derivative is 0, which can be calculated using Eq. 7:
By solving these equations, we obtain the regression coefficient that minimizes the loss function L, that is, the regression coefficient of the fitting curve function polyfit (x,y,n), and finally have the nonlinear regression model with the required accuracy.
Here, we elucidate the early warning method by combining the characteristic signals mined based on the Apriori association rule algorithm and the established nonlinear regression model of the time distribution of wildfires in the transmission corridor in the previous section.
The probability warning value of the nonlinear regression model is set as
To ensure that no correct early warning is missed, the target value is the probability of the minimum number of early warning corresponding to the maximum number of correct early warning. The calculation process is shown in Figure 7, where 1 hour is taken as a step.
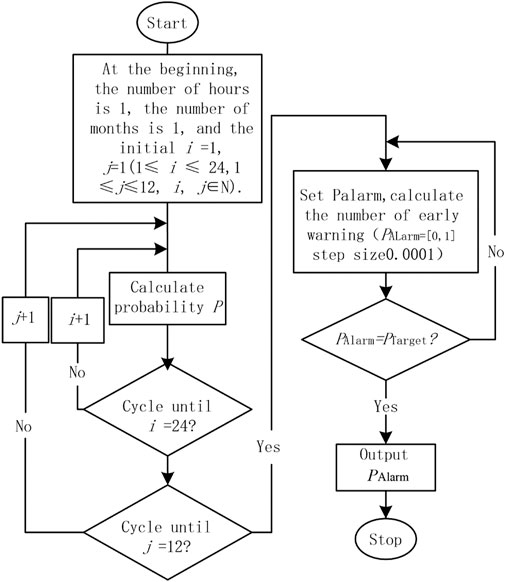
FIGURE 7. Optimization process of probability warning value.
As shown in Figure 7, the probability warning value of each time point of the year
The probability of the early warning process of wildfire along transmission corridor based on the characteristic signals and time distribution nonlinear regression model is shown in Figure 8.
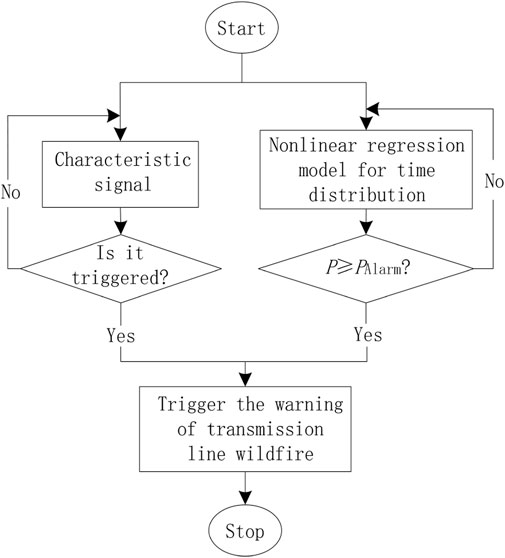
FIGURE 8. Warning model based on the characteristic signal and time distribution nonlinear regression.
Figure 8 and Eq. 9 show that, among the characteristic signals of transmission lines with different voltage levels, the output Boolean quantity is 1 when the characteristic signals are detected. Otherwise, the output Boolean quantity is 0:
As shown in Eq. 10, the warning value of the nonlinear regression of the time distribution is set as
When both the characteristic signal and the nonlinear regression warning of the time distribution meet the conditions, the warning will be output to realize the estimation of the wildfire occurrences along the power grid driven by the power system monitoring data.
We take the states with the most serious wildfire hazards in southwest China as an example: 277 wildfire incidents occurred in 2020, including 57 directly affecting the power grid. The records of the wildfire incidents along the transmission corridor are shown in Table 2.

TABLE 2. Manual record of wildfires.
The events include the fire start time, fire end time, and the name of the transmission line. The start time is the time when the fire is discovered and reported, and the end time is the time when the fire is confirmed to be over.
There were 31 events involving transmission lines of 110 kV and above. The recorded data of the wildfires in the transmission corridor with the substation or power plant on both sides of the line are matched, and the alarm data from 5 h before the transmission corridor fire starts to the end of the fire are associated to form a dataset. Based on the alarm signals in Table 1 and the process in Figure 5, the dataset was scanned to obtain the support of each candidate, and the minimum support threshold was set to 0.1. By comparing the candidate support count with the minimum support,

TABLE 3. Transaction dataset of 110 kV and above transmission lines.
Similarly, there are 26 events in 35 kV and below lines, and the dataset is scanned to obtain the support of each candidate item. Since the data are relatively dense, the minimum support threshold is set to 0.9. Compared to the candidate support count with the minimum support,
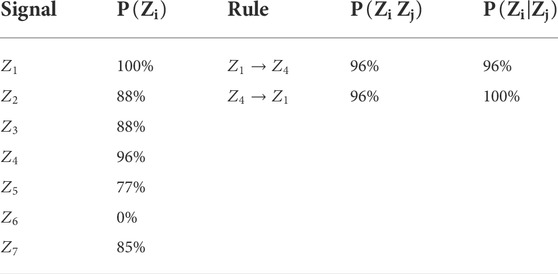
TABLE 4. Transaction dataset of 35 kV and below transmission lines.
Using the calculation results for 35 kV and below lines, the grounding alarm signal
The distribution probability of the hours and months was obtained through the processing of the historical record data, as shown in Tables 5, 6.
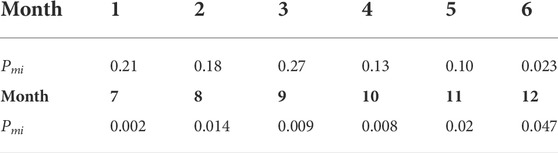
TABLE 5. Monthly distribution probability of wildfires.
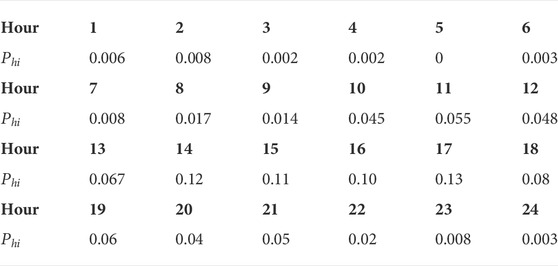
TABLE 6. Hourly distribution probability of wildfires.
Using the calculation process of fitting the order of the curve function in Figure 6, the order is determined as 5 by substituting the data in Tables 5, 6, that is, n = 5.
Using the monthly distribution probability of wildfires in Table 5, the nonlinear regression model of the monthly distribution was established, as shown in Eq. 11:
By solving Eqs 6, 7, the regression coefficient of the nonlinear regression model of the monthly distribution was obtained, as shown in Eq. 12:
Using the hourly distribution probability of line mountain fire in Table 6, the nonlinear regression model of the hourly distribution was established, as shown in Eq. 13:
By solving Eqs 6, 7, the regression coefficient of the nonlinear regression model with the hourly distribution was obtained, as shown in Eq. 14:
Finally, the nonlinear regression model of time distribution is shown in Eq. 15:
The time probability of wildfires along the transmission corridor of this region was obtained by inputting the monthly hours of the whole year into the nonlinear regression model of time distribution with an hour as the step, as shown in Figure 9.
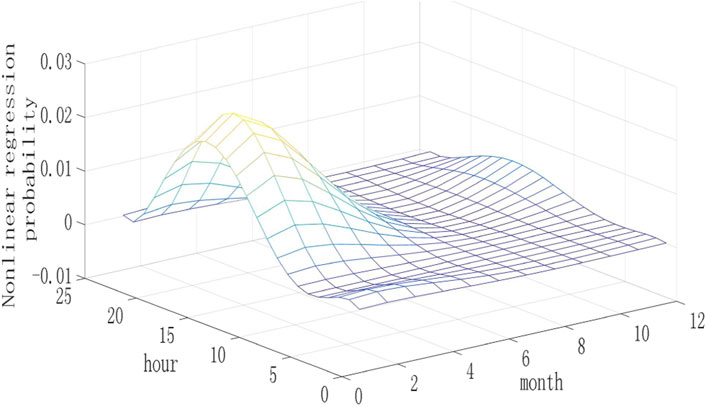
FIGURE 9. Time probability of wildfires.
It can be seen from the figure that the time distribution probability of wildfires in this area is very obvious, and it is impossible for wildfires to occur during certain times. In February at 16:00, the time probability of wildfires is the highest (0.025). From the 12-month distribution of the whole year, the frequency of wildfires is lower in the summer and autumn and higher in the winter and spring. During the Chinese New Year and Tomb-Sweeping Day, it reaches the peak (February). In the months with a high frequency of line wildfires, the probability of wildfires in 24 h presents a normal distribution.
After the time probability of wildfires is obtained, the probability warning value
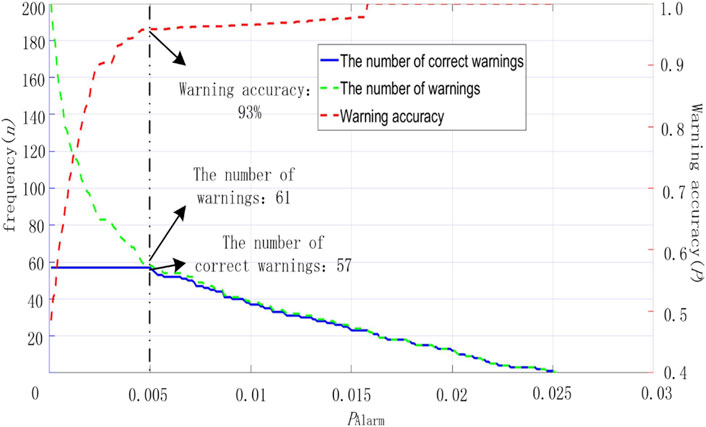
FIGURE 10. Optimization results of probability warning values.
As it can be seen in Figure 10 and according to the definition of Eq. 8, through the optimization of probability early warning value
The monitoring and alert information of the power grid in January 2021 was extracted from the database of the main power grid regulation and control station of the city and state and calculated by substituting the alert process in Figure 8. In January 2021, there were three transmission corridor wildfire events affecting the grid operation in the region. To verify the accuracy of the time distribution regression model for the transmission corridor fires, the monitoring and warning information of the power grid was also substituted into the characteristic signal model without considering the time distribution regression warning. The prediction results using satellite image recognition technology for the same period were collected and compared to obtain the results shown in Figure 11.
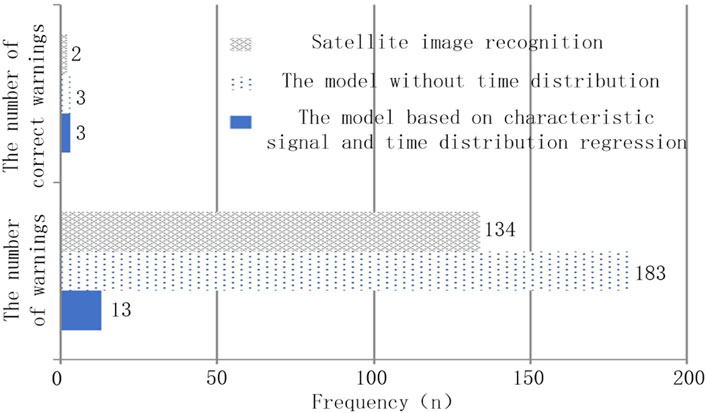
FIGURE 11. Comparison of prediction results.
Figure 11 shows that for the example of the transmission corridor wildfires affecting the power grid that occurred in the region in January 2021, the early warning model based on the characteristic signal and time distribution regression warned three times, while the satellite image recognition only warned correctly two times. There is a significant difference in the accuracy of these methods. With the proposed model, it warns 13 times with an accuracy of 23%. For the characteristic signal model without considering the time distribution regression warning, it warned 183 times with an accuracy rate of only 1.6% due to the numerous disturbing signals in the actual operation of the power grid. The satellite image recognition warned 134 times with an accuracy rate of 1.5%. Further analysis of the warning time is shown in Table 7.

TABLE 7. Warning times.
The data in Table 7 indicate the satellite image identification technique is limited by the long transit time interval, the existence of blind areas in the scanning coverage, and the influence of weather. Two warning times are later than the method described in this paper. Because of the monitoring background alarm information update time of 1 minute, the early warning model based on the feature signal and time distribution regression was 12 and 15 min earlier than the manually determined start time in events 2 and 3, respectively.
For the “30 March” forest fire in Liangshan, Sichuan in 2020, the fire was caused by a transmission line fault. Since the Liangshan region is adjacent to the above modeled area and has similar geographical and climatic conditions, the above model was used to extract the monitoring alarm information from the monitoring background for the Liangshan region in March 2020. In March 2020, there were two incidents of wildfires affecting the power grid in the Liangshan region, as shown in Table 8, among which the “3–30” forest fire is incident 2.
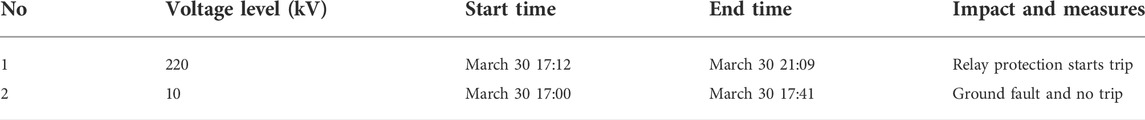
TABLE 8. Records of wildfires affecting power grid in Liangshan district in March 2020.
Our calculations show that the number of early warnings was 11, the correct number was two times, and the accuracy was 18%. The early warning results were analyzed (in March 2020, wildfire warnings based on satellite image recognition technology were not issued in this province), as shown in Table 9.
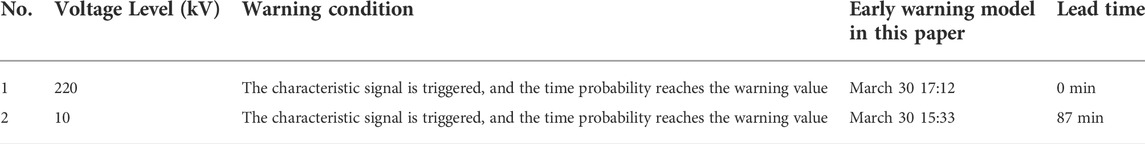
TABLE 9. Warning times.
Table 9 indicates that the warning time of the proposed method is synchronized with the start time of the manual recording for 220 kV lines. For the “30 March” forest fire incident, since a single-phase ground fault does not directly trigger a trip in the transmission lines of 35 kV or below, the method in this paper has more obvious warning timeliness and can warn of a wildfire 87 min in advance.
This paper puts forward a rapid warning method for wildfires based on state grid monitoring information. First, the characteristic signals of wildfires were determined based on the mechanism analysis of the power grid alarm signals of a transmission line wildfire. To improve the warning accuracy, the time distribution characteristics of wildfires were analyzed, and the nonlinear regression model of the time distribution was established. We combined them to develop an early warning method based on the characteristic signals and the time distribution nonlinear regression model.
The effectiveness of the method was verified through typical regional arithmetic examples. Compared with the method based on satellite image recognition technology, the method can overcome the disadvantages of a long transit time interval, areas without adequate scanning coverage, weather, and other types of interference. The accuracy rate reaches 23%, which is much higher than that of satellite image recognition, and can provide earlier warnings compared with the start time of manual recordings. The advantage is obvious for the wildfires caused by transmission line faults. For the example case of the “30 March” wildfire in Liangshan, the method could have provided a warning 87 min earlier, further proving its effectiveness and rapidity, especially for low-voltage lines.
The method proposed in this paper does not require additional sensors and can avoid the interference of satellite image identification due to meteorological conditions. By combining with existing monitoring methods, such as satellite image identification technology and sensor detection, it can provide a complementary advantage for wildfire warning systems. Thus, it can be used as a powerful supplement to the existing wildfire prevention and control measures to guarantee the security, stability, and economic operation of large power grids. Furthermore, this can be effective in protecting people’s lives and property from devastating wildfires.
The original contributions presented in the study are included in the article/supplementary material, further inquiries can be directed to the corresponding author.
This work was supported by Power system wide area measurement and control of the Key Laboratory of Sichuan Province. XD found this problem in his daily work and proposed a solution, he also collected field data. QH, ZC, and JL gave instructions on how to solve the problem, XR conduct experiment.
This work was partially supported by Science and Technology Innovation Talent Program of Sichuan Province (grant number:22CXRC100).
This work was supported by the Power system wide area measurement and control of the Key Laboratory of Sichuan Province. In addition, XD wants to thank QH, ZC, and JL for them affirmation and all those who love him.
The authors declare that the research was conducted in the absence of any commercial or financial relationships that could be construed as a potential conflict of interest.
All claims expressed in this article are solely those of the authors and do not necessarily represent those of their affiliated organizations, or those of the publisher, the editors and the reviewers. Any product that may be evaluated in this article, or claim that may be made by its manufacturer, is not guaranteed or endorsed by the publisher.
Antonov, S. (2021). “Impact of the wildfires on the power supply networks,” in 2021 IV International Conference on High Technology for Sustainable Development (HiTech), Sofia, Bulgaria, 07-08 October 2021 (IEEE). doi:10.1109/HiTech53072.2021.9614216
Beltramone, G., Alaniz, E., Ferral, A. E., Aleksinkó, A., Arijón, D. R., Bernasconi, I., et al. (2017). “Risk mapping of urban areas prone to flash floods in mountain basins using the analytic hierarchy process and geographical information systems,” in 2017 XVII Workshop on Information Processing and Control (RPIC), Mar del Plata, Argentina, 20-22 September 2017 (IEEE), 1–6. doi:10.23919/RPIC.2017.8214379
Chen, W., Zhou, Y., Chen, J., Zhou, E., Zhou, W., and Sui, S. (2019). “Wildfire monitoring technology of transmission lines based on Himawari8 geostationary meteorological satellite,” in Proc. IEEE 3rd Conf. Energy Internet Energy Syst. Integr. (EI), Changsha, China, 08-10 November 2019, 2408–2412. doi:10.13336/j.1003-6520.hve.20190498
Dian, S. Y., Cheng, P., Ye, Q., Wu, J., Luo, R., Wang, C., et al. (2019). Integrating wildfires propagation prediction into early warning of electrical transmission line outages. IEEE Access 7, 27586–27603. doi:10.1109/access.2019.2894141
Lamich, M., Balcells, J., Corbalán, M., and Griful, E. (2017). Nonlinear loads model for harmonics flow prediction, using multivariate regression. IEEE Trans. Ind. Electron. 64 (6), 4820–4827. doi:10.1109/tie.2017.2674596
Li, H., and Long, Z. (2021). Risk analysis of forest fire in Liangshan Prefecture, Sichuan Province based on Logistic model. Journal of Safety and Environment 21 (2), 498–505.
Liang, Y., Zhou, L., Chen, J., Huang, Y., Wei, R., and Zhou, E. (2020). Monitoring and risk assessment of wildfires in the corridors of high-voltage transmission lines. IEEE Access 8, 170057–170069. doi:10.1109/access.2020.3023024
Liu, H., Wang, S., Jiang, M., and Li, J. (2020). “Analysis of millimeter-wave radar for monitoring mountain fire in power grid,” in 2020 IEEE 5th Information Technology and Mechatronics Engineering Conference (ITOEC), Chongqing, China, 12-14 June 2020 (IEEE), 805–809. doi:10.1109/ITOEC49072.2020.9141870
Liu, Y., Lu, J. Z., Luo, J., Zhang, G. Y., and He, L. F. (2018). Synchronous satellite wide area monitoring for overhead transmission line wildfire and tower location. Power Syst. Technol. 42 (4), 1322–1327. doi:10.13335/j.1000-3673.pst.2017.1812
Lu, J., Zhou, T., Wu, C., Li, B., Liu, Y., and Zhu, Y. (2017). Prediction and early warning technology of wildfire nearby overhead transmission lines. High. Volt. Eng. 43 (8), 2524–2532. doi:10.13336/j.1003-6520.hve.20161227041
Melnikov, V. M., Zrnic, D. S., Rabin, R. M., and Zhang, P. (2008). Radar polarimetric signatures of fire plumes in Oklahoma. Geophys. Res. Lett. 35 (14), 148155–L15443. doi:10.1029/2008gl034311
Muhs, J. W., Parvania, M., Nguyen, H. T., and Palmer, J. A. (2021). Characterizing probability of wildfire ignition caused by power distribution lines. IEEE Trans. Power Deliv. 36 (6), 3681–3688. doi:10.1109/tpwrd.2020.3047101
Muhs, J. W., Parvania, M., and Shahidehpour, M. (2020). Wildfire risk mitigation:A paradigm shift in power systems planning and operation. IEEE Open J. Power Energy 7, 366–375. doi:10.1109/oajpe.2020.3030023
Shu, S., Zhang, S., Xu, J., Xie, W., and Fang, C. (2020). Study on automatic identification algorithm of wild fire near transmission lines based on CINRAD-net monitoring. Proc. CSEE 40 (13), 4200–4209. doi:10.13334/j.0258-8013.pcsee.190516
Tian, M., Zhang, L., Guo, P., Zhang, H., Chen, Q., Li, Y., et al. (2020). Data dependence analysis for defects data of relay protection devices based on apriori algorithm. IEEE Access 8, 120647–120653. doi:10.1109/access.2020.3006345
Keywords: wildfire occurrence along transmission corridor, nonlinear regression model, apriori association rule algorithm, monitor data, weather satellite
Citation: Duan X, Huang Q, Chen Z, Li J and Ren X (2022) A rapid warning method for wildfire occurrences along the transmission corridor driven by power system monitoring data. Front. Energy Res. 10:990509. doi: 10.3389/fenrg.2022.990509
Received: 10 July 2022; Accepted: 01 August 2022;
Published: 30 August 2022.
Edited by:
Youbo Liu, Sichuan University, ChinaReviewed by:
Miao Yu, Zhejiang University, ChinaCopyright © 2022 Duan, Huang, Chen, Li and Ren. This is an open-access article distributed under the terms of the Creative Commons Attribution License (CC BY). The use, distribution or reproduction in other forums is permitted, provided the original author(s) and the copyright owner(s) are credited and that the original publication in this journal is cited, in accordance with accepted academic practice. No use, distribution or reproduction is permitted which does not comply with these terms.
*Correspondence: Qi Huang, aHdvbmdAdWVzdGMuZWR1LmNu
Disclaimer: All claims expressed in this article are solely those of the authors and do not necessarily represent those of their affiliated organizations, or those of the publisher, the editors and the reviewers. Any product that may be evaluated in this article or claim that may be made by its manufacturer is not guaranteed or endorsed by the publisher.
Research integrity at Frontiers
Learn more about the work of our research integrity team to safeguard the quality of each article we publish.