- School of Rail Transportation, Shandong Jiao Tong University, Jinan, China
Accurately predicting the remaining useful cycle life of a lithium-ion battery is essential for health management of battery systems. Aiming at the time-varying and nonlinear problems of lithium-ion batteries, a remaining useful cycle life estimation method based on Takagi-Sugeno fuzzy model is proposed, which not only reduces the amount of data calculation, but also reduces massive data and has high accuracy. First, collect the rate of change of working voltage in the charging process, and analyze the relationship between the position of voltage rate curve and the number of cycles. Second, in order to reduce the amount of historical data, the interval with obvious mapping relationship is selected, and the recursive least square method is used to fit the curve off-line, which reduces the amount of data calculation and is easy to achieve in battery management system engineering. And then, the Takagi-Sugeno fuzzy model is applied to establish the remaining useful cycle life method based on Takagi-Sugeno fuzzy model. Finally, battery management system application shows that the proposed method can achieve high prediction accuracy and also provides a new perspective for remaining useful cycle life prediction.
1 Introduction
Many studies have been conducted on cycle-life prediction of lithium-ions in related fields (Liu et al., 2013; Dong et al., 2014; Zheng and Fang, 2015; Chang et al., 2017; Song et al., 2017; Dong et al., 2018; Guha and Patra, 2018; Song et al., 2018; Wang and Tsui, 2018; Zhang et al., 2018). In terms of research methods, remaining-useful-life (RUL) prediction methods can be roughly divided into three categories (as shown in Figure 1): 1) RUL prediction methods based on model-based method, such as physical chemistry or experience of the predicted object; 2) data-driven RUL prediction methods, which require no specific system mechanism model and are completely based on historical characteristic data; and 3) the hybrid method, in which multiple RUL prediction methods are fused in different ways.
1) The model-based method uses professional knowledge and experience to establish a mathematical model of battery life degradation, such as the physical model or electrochemical equation of the internal structure of the battery. Based on the internal structure of the battery, the mathematical mechanism and degradation law are deeply discussed. In Wu et al. (2021), the paper proposes an improved reduced-order electrochemical model (iROEM) with guaranteed observability, and the constant current and dynamic conditions are applied to evaluate the proposed battery model. The results demonstrate that the iROEM with guaranteed observability has high model fidelity and less computational complexity, which contributes to the resultant estimators for the lithium-ion battery electrochemical model. In Jiao et al. (2020), a PF (particle filter) framework and weight strategy based on a conditional variational autoencoder is used to predict the limiting range of batteries. The results show that, compared with traditional prediction methods, the new method has better prediction performance. In Pan et al. (2021) and Kim et al. (2021), a particle-wave algorithm was adopted and optimization is conducted based on the degradation data of lithium-ion batteries to improve the accuracy of prediction. In Sadabadi et al. (2021), a RUL prediction algorithm based on parameter estimation of an improved single-particle model is developed, which is realized using vehicle charging data, and the evolution of the state of health (SOH) metric was used to predict RUL. This method has the advantages of stable performance and high prediction accuracy, but its disadvantage is that it needs to know the exact physical action equation of electrochemical cell, and it is not suitable for off-line detection.
2) The data-driven method collects failure data related to battery life degradation and uses algorithms to mine data implicit information and potential connections between data. With the support of statistical analysis, regression, artificial intelligence and other methods, an approximate model of battery life degradation was established, and then the model was extrapolated to predict battery RUL. In Camargos et al. (2020), the paper proposes a novel Error Based Evolving Takagi-Sugeno Fuzzy Model (EBeTS) and a new data-driven approach to fault prognostics based on that fuzzy model. The experiments indicate that the proposed EBeTS-based prognostics approach can take advantage of both historical and new online data to estimate the Remaining Useful Life (RUL) and its uncertainties. In Liu et al. (2021), advanced machine-learning technology is applied to realize effective future capacity and RUL prediction of lithium-ion batteries. The results show that this method still has good adaptability for battery health diagnosis. In Lee et al. (2021), a robust and reliable estimation method of the remaining service life of lithium-ion batteries in electric vehicles based on a deep neural network is proposed to predict the remaining service life by monitoring the batteries’ internal resistance. A robust and reliable method based on deep neural networks is proposed in Chen et al. (2021) to estimate the RUL of lithium-ion batteries in electric vehicles. Results show that this method performs accurate adaptive detection of change points and has higher robust prediction accuracy than existing methods. This article (Afshari et al., 2022) focuses on batteries RUL early prediction using data-driven methods. The differential capacity (dQ/dV) and differential voltage (dV/dQ) curves can reveal the potential capacity and voltage of a battery, respectively, and they are known to be indicators of the battery’s degradation. The presented method is generic and can be used for RUL early prediction of different batteries. This method has the advantages of strong nonlinear processing ability, adaptability and self-learning ability, and shines in the battery life prediction problem. However, problems such as slow training, excessive resource consumption and weak generalization caused by artificial neural network also appear slowly in the application process.
3) The hybrid method gives full play to the advantages of various methods by means of model and data-driven, data-driven and data-driven hybrid methods, so as to better extract and use information and data features in data, so as to obtain more excellent network model robustness and prediction accuracy. Liu et al. (2019) propose a deep learning ensembled prediction approach based on BMA (Bayesian model averaging) and LSTMNs (long short-term memory networks). We constructed multiple LSTMN models with different sub datasets derived from the degradation of training data. The results demonstrate the effectiveness and reliability of our proposed ensemble prognostic approach. In Ren et al. (2021), a lithium-ion battery RUL prediction method based on an improved convolutional neural network (CNN) and long short-term memory (LSTM), namely, auto-CNN-LSTM, is proposed, and results show that this method is effective. The CNN-LSTM-particle-swarm-optimization (CNN-LSTM-PSO) model, advanced by combining a hybrid deep neural network with CNN-LSTM and a classical neural network, is used in Kara, (2021) to realize multi-step advance prediction. Experimental results show that the proposed CNN-LSTM-PSO model has better results than other most advanced machine-learning techniques and deep-learning methods. The RUL prediction framework based on the stacked autoencoder and Gaussian mixture regression (SAE-GMR) is proposed (Wei et al., 2022). The method is established not only to improve accuracy of RUL prediction, but also describe the reliability. Pugalenthi et al. (2022) use Neural Networks (NN) as the prediction model and an adaptive Bayesian learning approach to estimate the RUL of electronic devices. The proposed prognostic approach functions in two stages weight regularization using adaptive Bayesian learning and prognosis using NN, and RMSE values and execution time were used as metrics to evaluate the performance. In Chen L. et al. (2022), a grey neural network (GNN) model fused grey model (GM) and BPNN is proposed to estimate the capacity online with the inputs of new health indicators. The results indicate the proposed GNN algorithm can effectively estimate degradation capacity with the MAE (mean absolute error) is less than 2.2%, and the GNN-SGMPF had a remarkable ability of transfer application, practicability, and universality. Chen Z. et al. (2022) propose a sequence decomposition and deep learning integrated prognostic approach for the RUL prediction of LIBs. Complementary ensemble empirical mode decomposition and principal component analysis are applied to separate the local fluctuations and the global degradation trend from the battery aging data. The illustrative results demonstrate that the proposed approach can achieve accurate, adaptive, and robust prediction for both capacity trajectory and RUL. The hybrid method has many problems such as large computation and large data demand, which limit its application scope and generalization ability.
In this paper, a hybrid method based on TS fuzzy model is proposed, which not only reduces the amount of data calculation, but also reduces massive data and has high accuracy. Firstly, the change rate of working voltage in the charging process is collected, and the relationship between the position of voltage change rate curve and the number of cycles is analyzed. Second, in order to reduce the amount of historical data, the interval with obvious mapping relationship is selected, and the recursive least square method is used to fit the curve off-line, which reduces the amount of data calculation and is easy to achieve in BMS engineering. And then, the TS fuzzy model is applied to establish the RUCL method based on TS fuzzy model. Finally, the accuracy and advancement of the method are verified by BMS application.
The objective of this study is to propose a new method for predicting the RUCL of lithium-ion batteries and verify its validity. Four original contributions are made herein.
1) A RUCL estimation method based on TS fuzzy model is proposed, reduce the amount of historical data and its validity is verified through engineering application of BMS.
2) The mapping relationship between the number of lithium-ion battery cycles and the position of the working voltage change rate curve is revealed.
3) The proposed method can achieve high prediction accuracy, and the prediction error is less than 1.58%.
4) The recursive least square method is used to fit the curve off-line, which reduces the amount of data calculation and is easy to achieve in BMS engineering.
2 TS fuzzy model
The TS fuzzy model can be described as (Gao et al., 2008; Baranyi, 2014; Zhang et al., 2015; Zheng et al., 2018; Li et al., 2021; Li et al., 2022).
Given a generalized input variable
where,
where
The basic principle of the TS fuzzy model converts normal fuzzy rules and their reasoning into a mathematical expression. In essence, the global complex nonlinear system, through fuzzy division, establishes a number of simple (nonlinear) relations, and the output of multiple models in fuzzy reasoning and decision-making can express complex nonlinear relations. The TS fuzzy model is suitable for the method of predicting RUCL of lithium-ion batteries proposed in this paper. And, through intelligent fuzzy division, can effectively reduce the amount of data.
3 Prediction principle of RUCL
3.1 Experiment
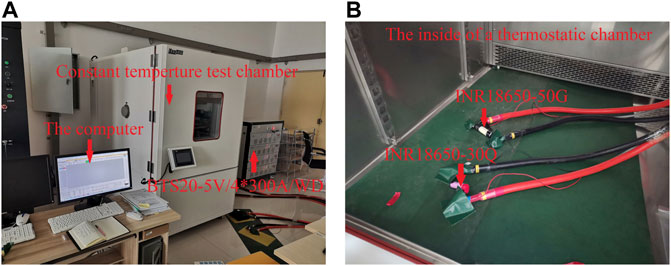
The experimental environment and equipment are shown in Figure 2.
1) Experimental conditions: temperature, 25°C, humidity, 60 ± 10%.
2) Cell model: 30Q (INR18650-30Q) and 50G (INR18650-50G) (parameters are shown in Table 1).
3) Experimental equipment: BTS20(5V/4*300A/WD), computer, thermostatic chamber.
4) Experimental process: charge cutoff voltage, 4.2 V, discharge cutoff voltage, 2.5 V, charge-discharge current, 0.3 C (capacity).
3.2 Data analysis
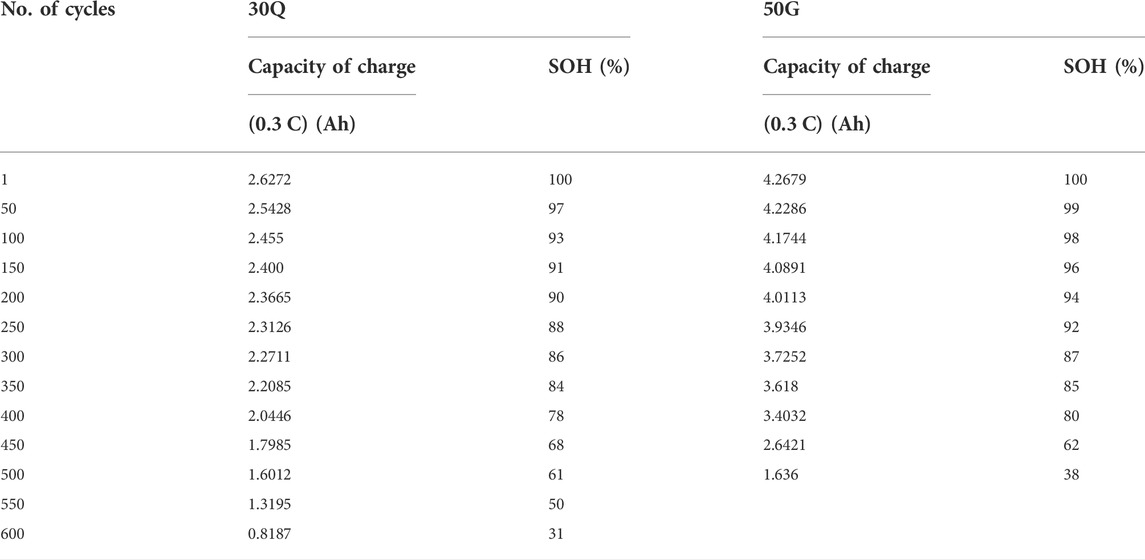
After charging and discharging cycle experiments with a current of 0.3 C, the comparison table between the cycle times and the actual capacity of the two batteries is shown in Table 2. When the 30Q cell cycle reaches 600 times, the capacity attenuates to 31%; when the 50G cell cycle reaches 500 times, the capacity attenuates to 38%. Therefore, defined as the phase of obsolescence.
As can be seen from Table 2, the capacity and rated capacity of this experiment are somewhat reduced. Mainly during the charging process, constant-current mode is adopted in this experiment. To save time for the experiment, constant-voltage mode is not adopted at the end of charging, so the capacity is slightly less than the rated capacity. The maximum charging capacity of the first cycle was used as the reference capacity for the experiment.
3.3 Curve analysis
In Li et al. (2019) and Liu et al. (2015), the present remaining discharge capacity can be estimated by the dV/dQ value, so that, through analyzing the characteristics of terminal voltage variation,
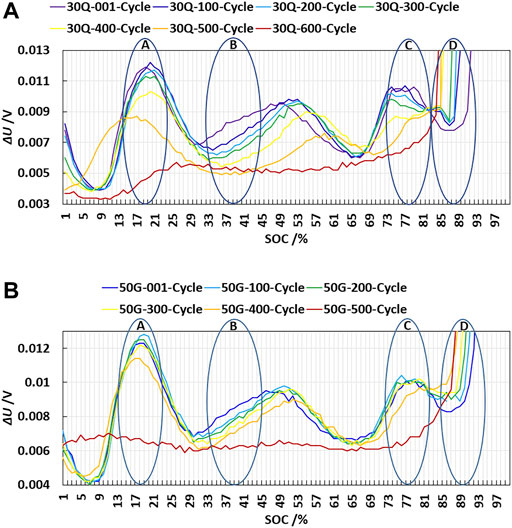
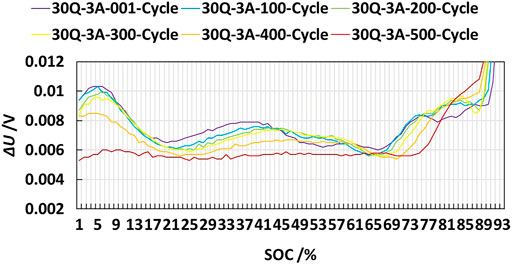
In Figure 3 X-axis represents SOC of each cycle, and Y-axis represents
1)
2) It can be seen from interval D that, at the end of charging, the curve with fewer cycles is outward, while the curve with more cycles is inward. With the increase of the number of cycles, the curve has a tendency of adduction.
3) In the interval A, B, C and D, the number of cycles has an obvious corresponding relationship with the position of the
3.4 Feasibility analysis
According to the experimental data and curve analysis, the feasibility of this method is analyzed theoretically and technically.
1) It has very good identification in A, B, C and D. The number of cycles has an obvious mapping relationship with the position of
2) The charging current is 0.3 C, which belongs to the common vehicle-mounted charging current. The voltage and current data can be collected and obtained directly through BMS, which provides the feasibility of technical application.
3) The current is very stable during the charging process in interval A, B and C. Interval D is at the end of charging, and the charging current changes greatly. Therefore, interval A, B and C are selected.
4) The charging process lasts 3–4 h, and the amount of data collected is not large, which is convenient for calculation and processing.
5) The method directly collects the working voltage and calculates the change rate, independent of the mechanism model of lithium-ion battery.
To sum up, this paper selected A, B and C interval locations to carry out RUCL prediction research.
4 RUCL prediction model
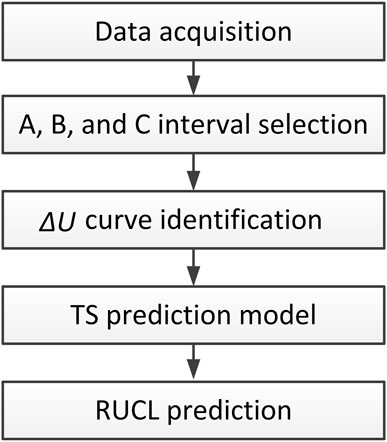
RUCL prediction method establishment process is shown in Figure 4.
Step 1: Data acquisition;
Step 2: A, B, and C interval selection;
Step 3:
Step 4: TS fuzzy model is established and RUCL prediction is made.
4.1 Data acquisition
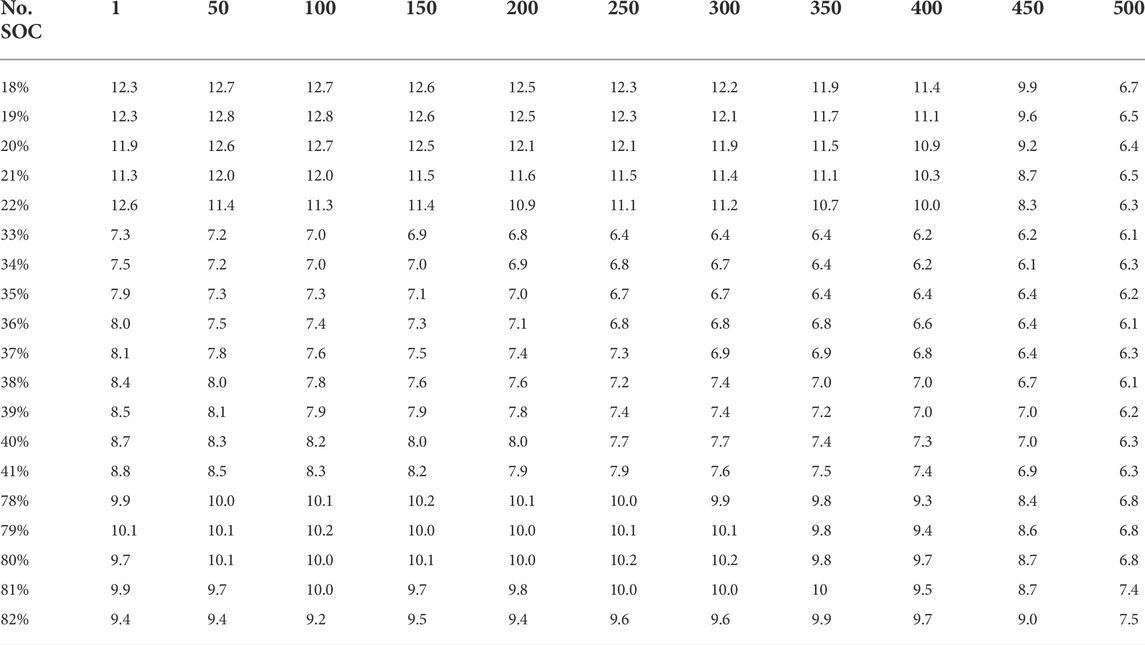
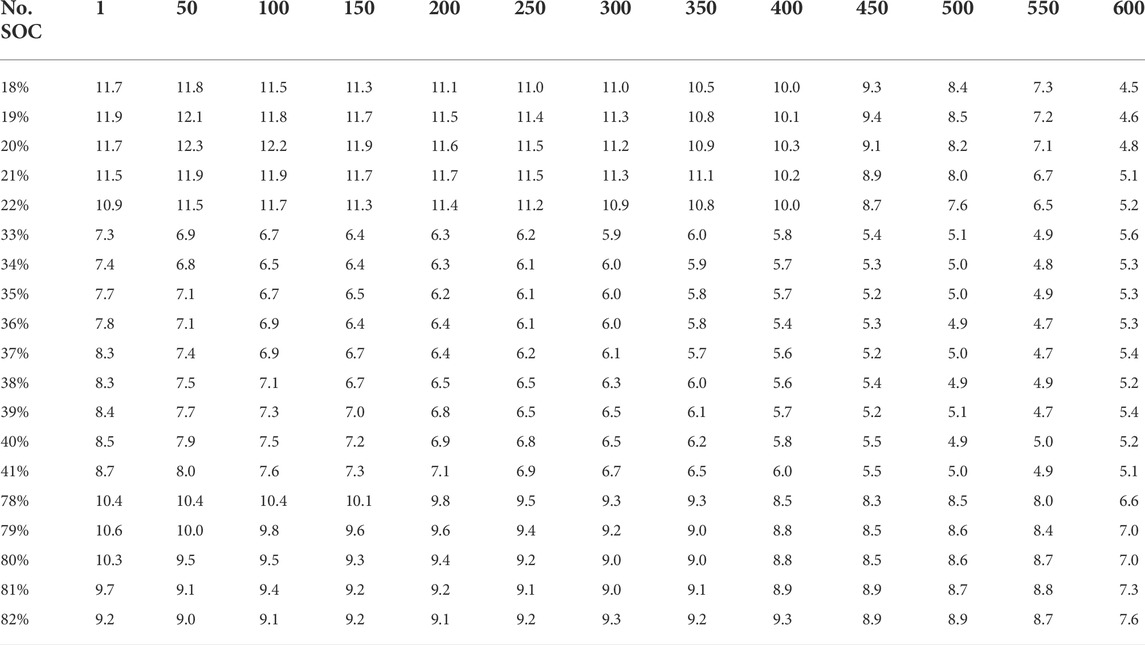
According to the experimental method in Section 3.1, charge and discharge cycle experiments are conducted on INR18650-30Q and INR18650-50G cells, charging working voltage data are collected, and voltage change rate data are calculated. Some experimental data are shown in Table 3 and Table 4. The first behavior cycle number; The first column is the value of SOC; The data in the table is the change rate of working voltage, in mV for different cycles and SOC.
4.2 Determination of A, B, and C intervals
Through data analysis and curve comparison, the intervals of A, B, and C ware selected.
1) Section A interval selection
The central SOC is 20%, the X-axis coordinates are 18–22%, and the interval span is 4% (as shown in Figure 3). Through comparative analysis of
2) Section B interval selection
The central SOC is 37%, the X-axis coordinates are 33–41%, and the interval span is 8% (as shown in Figure 3). Through comparative analysis of
3) Section C interval selection
The central SOC is 80%, the X-axis coordinates are 78–82%, and the interval span is 4% (as shown in Figure 3). Through comparative analysis of
The interval curves of A, B, and C are close in value with high similarity and obvious consistency. In order to reduce the amount of calculation and facilitate the realization of BMS, the average value of
4.3 Recursive least square data fitting
The least square method in regression model is mainly to optimize the fitting function, so that the fitting function can better express the data. In this paper, recursive least square method is used to fit the curve off-line to reduce the amount of data calculation.
For a given set of data
Suppose the fitting formula is:
To minimize the sum of squares of deviations for identifying parameters. That is:
Take the partial derivative,
Solve for
After fitting, the function is:
In this paper, n = 3, coefficients of the fitting equation are shown in Table 5.
4.4 Prediction of RUCL based on TS fuzzy model
From the above sections, according to the mapping relationship between the position of
1) Establishment of fuzzy inference
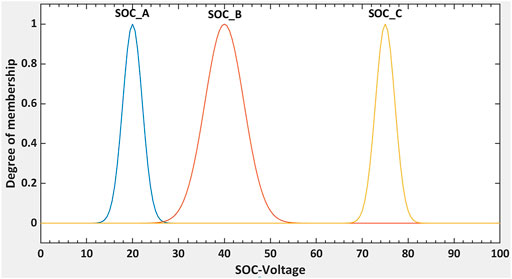
SOC_Voltage indicates the value of SOC.
SOC_Voltage theory domain: [0 100].
SOC_Voltage fuzzy language variables: SOC_A, SOC_B, SOC_C.
SOC_Voltage membership function expression:
where s is the current SOC value, which is SOC_Voltage.
The membership function of SOC_Voltage is shown in Figure 5.
2) Establishment of model export
According to formula (2):
where
5 Verification
5.1 Validate method
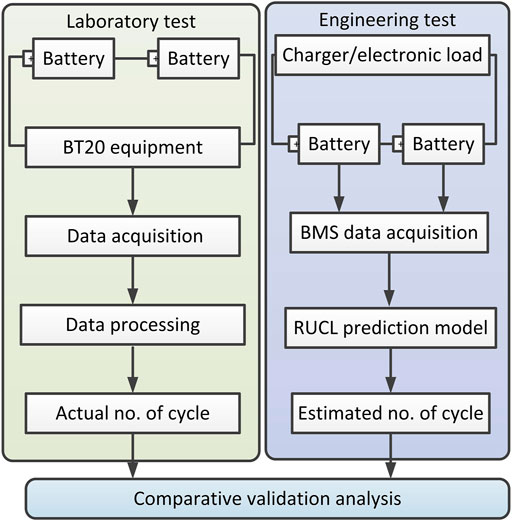
The validation method uses two tests: laboratory test and engineering test. The laboratory test is carried out through the charge and discharge cycle experiment of BT20 experimental device, and the actual RUCL data were obtained. The engineering test is to transplant the above RUCL prediction model into BMS and conduct charge-discharge cycle experiments through chargers and electronic loads to obtain RUCL estimation data. And then verify the advanced and innovative analysis through comparison. The verification method block diagram is shown in Figure 6.
5.2 Validation and analysis
According to the RUCL prediction model above, INR18650-30Q and INR18650-50G cell experimental data are used for experimental verification.
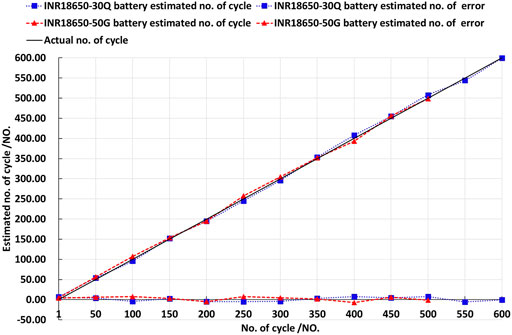
The estimated no. of cycle and estimated no. of error are shown in Figure 7, and the specific verification results of predicted RUCL values and errors are shown in Table 6.
According to Figure 7 and Table 6, the predicted cycle times and the actual cycle times are compared and analyzed. For INR18650-30Q cell, the maximum number of positive error cycles is 7.71, the maximum number of negative error cycles is 5.66, and the error is less than 1.29%. For INR18650-50G cell, the maximum number of positive error cycles is 7.89, the maximum number of negative error cycles is 6.88, and the error is less than 1.58%. Therefore, the method is feasible and accurate.
As can be seen from Figure 7 and Table 6, the error curve is relatively smooth and fluctuates less before the lithium electronic battery is retired, that is, when the capacity is greater than 80% or the number of cycles is less than 350 times. When the capacity of lithium-ion battery is less than 80%, or the cycle times is more than 350 times, the error curve fluctuates greatly. At this time, lithium-ion battery is prone to danger, and the current should be lowered to improve safety.
6 Conclusions and discussion
In this article, two kinds of lithium-ion batteries are selected to conduct charging-discharge cycle experiments respectively to study the new remaining useful cycle life prediction method. Firstly, the relationship between the number of lithium battery cycles and the position of
30Q cell in 1 C (3A) charging process,
1) The curve with more cycles and the curve with less cycles cross each other. In the scrap stage, the curve tends to be horizontal.
2) At the end of charging, the curve with fewer cycles is outward, while the curve with more cycles is inward. With the increase of the number of cycles, the curve has a tendency of adduction.
3) In the SOC range from 25 to 41%, the number of cycles has an obvious corresponding relationship with the position of the
Therefore, the method in this paper has research value and provides an important reference for the prediction of remaining useful cycle life.
However, the proposed method has several shortcomings that are the direction of future efforts as follows:
1) In this article, the SOC was estimated to be in the 1% range. In follow-up work, the
2) The charging-process data were collected, and the charging temperature was found to generally be in the range of 5–45°C. Although temperature has little influence on the
Data availability statement
The original contributions presented in the study are included in the article/supplementary material, further inquiries can be directed to the corresponding author.
Author contributions
EH: writing—Original draft preparation, Conceptualization, Validation, Methodology. ZW: writing—review and editing, Project administration, Supervision, Funding acquisition, Resources. XQ: Visualization, Data curation, Software. GL: Formal analysis, Investigation. All authors have read and agreed to the published version of the manuscript.
Funding
This work was supported by the Science and Technology Major Project of Inner Mongolia Autonomous Region (2020ZD0014).
Acknowledgments
This research was conducted within the University of Shandong Jiao Tong, supported by the charging-discharging equipment BTS20 (5V/4*300A/WD). We thank to the testing team members for their support with the experiment.
Conflict of interest
The authors declare that the research was conducted in the absence of any commercial or financial relationships that could be construed as a potential conflict of interest.
Publisher’s note
All claims expressed in this article are solely those of the authors and do not necessarily represent those of their affiliated organizations, or those of the publisher, the editors and the reviewers. Any product that may be evaluated in this article, or claim that may be made by its manufacturer, is not guaranteed or endorsed by the publisher.
References
Afshari, S. S., Cui, S., Xu, X., and Liang, X. (2022). Remaining useful life early prediction of batteries based on the differential voltage and differential capacity curves. IEEE Trans. Instrum. Meas. 71, 1–9. doi:10.1109/TIM.2021.3117631
Baranyi, P. (2014). The generalized TP model transformation for T–S fuzzy model manipulation and generalized stability verification. IEEE Trans. Fuzzy Syst. 22 (4), 934–948. doi:10.1109/TFUZZ.2013.2278982
Camargos, M. O., Lury, B., Marcos, F. S. V. D., Luciana, B. C., and Reinaldo, M. P. (2020). Data-driven prognostics of rolling element bearings using a novel error based evolving takagi–sugeno fuzzy model. Appl. Soft Comput. 96, 106628. doi:10.1016/j.asoc.2020.106628
Chang, Y., Fang, H. J., and Zhang, Y. (2017). A new hybrid method for the prediction of the remaining useful life of a lithium-ion battery. Appl. Energy 206, 1564–1578. doi:10.1016/j.apenergy.2017.09.106
Chen, L., Ding, Y., Liu, B., Wu, S., Wang, Y., and Pan, H. (2022a). Remaining useful life prediction of lithium-ion battery using a novel particle filter framework with grey neural network. Energy 244, 122581. doi:10.1016/j.energy.2021.122581
Chen, X., LiuWang, Z. J., Yang, C., Long, B., and Zhou, X. (2021). An adaptive prediction model for the remaining life of an Li-ion battery based on the fusion of the two-phase wiener process and an extreme learning machine. Electronics 10 (5), 540. doi:10.3390/electronics10050540
Chen, Z., Chen, L., Shen, W., and Xu, K. (2022b). Remaining useful life prediction of lithium-ion battery via a sequence decomposition and deep learning integrated approach. IEEE Trans. Veh. Technol. 71, 1466–1479. doi:10.1109/TVT.2021.3134312
Dong, G., Chen, Z., Wei, J., and Ling, Q. (2018). Battery health prognosis using brownian motion modeling and particle filtering. IEEE Trans. Ind. Electron. 65 (11), 8646–8655. doi:10.1109/TIE.2018.2813964
Dong, H. C., Jin, X. N., Lou, Y. B., and Wang, C. H. (2014). Lithium-ion battery state of health monitoring and remaining useful life prediction based on support vector regression-particle filter. J. Power Sources 271, 114–123. doi:10.1016/j.jpowsour.2014.07.176
Gao, Z., Shi, X., and Ding, S. X. (2008). Fuzzy state/disturbance observer design for T–S fuzzy systems with application to sensor fault estimation. IEEE Trans. Syst. Man. Cybern. B 38 (3), 875–880. doi:10.1109/TSMCB.2008.917185
Guha, A., and Patra, A. (2018). State of health estimation of lithium-ion batteries using capacity fade and internal resistance growth models. IEEE Trans. Transp. Electrific. 4 (1), 135–146. doi:10.1109/TTE.2017.2776558
Jiao, R., Peng, K., and Dong, J. (2020). Remaining useful life prediction of lithium-ion batteries based on conditional variational auto-encoders-particle filter. IEEE Trans. Instrum. Meas. 69 (11), 8831–8843. doi:10.1109/TIM.2020.2996004
Kara, A. (2021). A data-driven approach based on deep neural networks for lithium-ion battery prognostics. Neural comput. Appl. 33, 13525–13538. doi:10.1007/s00521-021-05976-x
Kim, S., Park, H. J., Choi, J. H., and Kwon, D. (2021). A novel prognostics approach using shifting kernel particle filter of Li-ion batteries under state changes. IEEE Trans. Ind. Electron. 68 (4), 3485–3493. doi:10.1109/TIE.2020.2978688
Lee, C. J., Kim, B. K., Kwon, M. K., Nam, K., and Kang, S. W. (2021). Real-time prediction of capacity fade and remaining useful life of lithium-ion batteries based on charge/discharge characteristics. Electronics 10 (7), 846. doi:10.3390/electronics10070846
Li, X., Andrew, M. C., Donal, P. F., Ren, D., Ying, S., Feng, X., et al. (2019). Degradation mechanisms of high capacity 18650 cells containing Si-graphite anode and nickel-rich NMC cathode. Electrochimica Acta 297, 1109–1120. doi:10.1016/j.electacta.2018.11.194
Li, Y., Liu, S., Zhao, D., Shi, X., and Cui, Y. (2021). Event-triggered fault estimation for discrete time-varying systems subject to sector-bounded nonlinearity: A krein space-based approach. Int. J. Robust Nonlinear Control 31 (11), 5360–5380. doi:10.1002/rnc.5545
Li, Y., Yuan, M., Chadli, M., Wang, Z., and Zhao, D. (2022). Unknown input functional observer design for discrete time interval type-2 Takagi-Sugeno fuzzy systems. IEEE Trans. Fuzzy Syst., 1. doi:10.1109/TFUZZ.2022.3156735
Liu, D. T., Guo, L. M., and Pang, J. Y. (2013). “A fusion framework with nonlinear degradation improvement for remaining useful life estimation of lithium-ion batteries,” in 2013 Annual Conference of the Prognostics and Health Management Society (New Orleans, LA: PHM 2013), 598–607.
Liu, G., Ouyang, M. G., Lu, L., Li, J., and Han, X. (2015). Online estimation of lithium-ion battery remaining discharge capacity through differential voltage analysis. J. Power Sources 274, 971–989. doi:10.1016/j.jpowsour.2014.10.132
Liu, K., Shang, Y., Ouyang, Q., and Widanage, W. D. (2021). A data-driven approach with uncertainty quantification for predicting future capacities and remaining useful life of lithium-ion battery. IEEE Trans. Ind. Electron. 68 (4), 3170–3180. doi:10.1109/TIE.2020.2973876
Liu, Y., Zhao, G., and Peng, X. (2019). Deep learning prognostics for lithium-ion battery based on ensembled long short-term memory networks. IEEE Access 7, 155130–155142. doi:10.1109/ACCESS.2019.2937798
Pan, C. F., Huang, A. B., He, Z. G., Lin, C. J., Sun, Y. Y., Zhao, S. C., et al. (2021). Prediction of remaining useful life for lithium-ion battery based on particle filter with residual resampling. Energy Sci. Eng. 9 (8), 1115–1133. doi:10.1002/ese3.877
Pugalenthi, K., Park, H., Hussain, S., and Raghavan, N. (2022). Remaining useful life prediction of lithium-ion batteries using neural networks with adaptive bayesian learning. Sensors (Basel) 22, 3803. doi:10.3390/s22103803
Ren, L., Dong, J., Wang, X., Meng, Z., Zhao, L., and Deen, M. J. (2021). A data-driven auto-CNN-LSTM prediction model for lithium-ion battery remaining useful life. IEEE Trans. Ind. Inf. 17 (5), 3478–3487. doi:10.1109/TII.2020.3008223
Sadabadi, K. K., Jin, X., and Rizzoni, G. (2021). Prediction of remaining useful life for a composite electrode lithium-ion battery cell using an electrochemical model to estimate the state of health. J. Power Sources 481, 228861. doi:10.1016/j.jpowsour.2020.228861
Song, Y. C., Liu, D. T., Hou, Y. D., Yu, J. X., and Peng, Y. (2017). Data-driven hybrid remaining useful life estimation approach for spacecraft lithium-ion battery. Microelectron. Reliab. 75, 142–153. doi:10.1016/j.microrel.2017.06.045
Song, Y. C., Liu, D. T., Hou, Y. D., Yu, J. X., and Peng, Y. (2018). Satellite lithium-ion battery remaining useful life estimation with an iterative updated RVM fused with the KF algorithm. Chin. J. Aeronautics 31, 31–40. doi:10.1016/j.cja.2017.11.010
Wang, D., and Tsui, K. L. (2018). Brownian motion with adaptive drift for remaining useful life prediction: Revisited. Mech. Syst. Signal Process. 99, 691–701. doi:10.1016/j.ymssp.2017.07.015
Wei, M., Ye, M., Wang, Q., Xu, X., and Twajamahoro, J. P. (2022). Remaining useful life prediction of lithium-ion batteries based on stacked autoencoder and Gaussian mixture regression. J. Energy Storage 47, 103558. doi:10.1016/j.est.2021.103558
Wu, L., Liu, K., and Hui, P. (2021). Evaluation and observability analysis of an improved reduced-order electrochemical model for lithium-ion battery. Electrochimica Acta 368, 137604. doi:10.1016/j.electacta.2020.137604
Zhang, L., Mu, Z., and Sun, C. (2018). Remaining useful life prediction for lithium-ion batteries based on exponential model and particle filter. IEEE Access 6, 17729–17740. doi:10.1109/ACCESS.2018.2816684
Zhang, Y., Tao, G., and Chen, M. (2015). Relative degrees and adaptive feedback linearization control of T–S fuzzy systems. IEEE Trans. Fuzzy Syst. 23 (6), 2215–2230. doi:10.1109/TFUZZ.2015.2412138
Zheng, W., Wang, H., Wang, H., Wen, S., and Zhang, Z. (2018). Fuzzy dynamic output feedback control for T-S fuzzy discrete-time systems with multiple time-varying delays and unmatched disturbances. IEEE Access 6, 31037–31049. doi:10.1109/ACCESS.2018.2831250
Keywords: remaining useful cycle life (RUCL), cycle number, TS (Takagi-Sugeno) fuzzy model, battery management system (BMS), lithium-ion battery
Citation: Hou E, Wang Z, Qiao X and Liu G (2022) Remaining useful cycle life prediction of lithium-ion battery based on TS fuzzy model. Front. Energy Res. 10:973487. doi: 10.3389/fenrg.2022.973487
Received: 20 June 2022; Accepted: 20 July 2022;
Published: 19 August 2022.
Edited by:
Qi Zhang, Shandong University, ChinaReviewed by:
Yujie Wang, University of Science and Technology of China, ChinaHemavathi S., Central Electrochemical Research Institute (CSIR), India
Longxing Wu, Xi’an University of Technology, China
Copyright © 2022 Hou, Wang, Qiao and Liu. This is an open-access article distributed under the terms of the Creative Commons Attribution License (CC BY). The use, distribution or reproduction in other forums is permitted, provided the original author(s) and the copyright owner(s) are credited and that the original publication in this journal is cited, in accordance with accepted academic practice. No use, distribution or reproduction is permitted which does not comply with these terms.
*Correspondence: Zhixue Wang, MjE1MDM1QHNkanR1LmVkdS5jbg==
 Enguang Hou
 Zhixue Wang*
