- Electrical Engineering and Automation at Harbin Institute of Technology, Harbin, China
Insufficient power system operation data sets hinder the extensive application of various artificial intelligence algorithms. The solution of the Thevenin equivalent parameters especially depends on the power flow data of the grid. This article proposes a Kirchhoff circuit law-based power flow sample generation method, which can overcome the operation state observation difficulty and power flow calculation complexity of the power system. To a large extent, the quality of the sample determines the effect of the machine learning algorithm. This method is different in mechanism from traditional power flow calculations, which is applied to generate the state-based power flow sample data sets by using Kirchhoff circuit laws instead of the iterative calculation of power flow starting from the initial value. In this way, the efficiency of power system sample generation required by machine learning algorithms is enhanced significantly. Besides, this article finds the power characteristic parameter suitable for Thevenin’s equivalent parameter machine learning, that is, the load power differential ratio. A clustering method suitable for the Bi-LSTM (bidirectional long short-term memory) model for processing power state samples, which can improve learning performance, was studied. The case studies demonstrate the sample generation efficiency of this method and verify the learning effect of the Bi-LSTM algorithm.
1 Introduction
The Thevenin equivalent parameter is a major index for power system stability analysis. It plays an important role in network equivalent calculations, fault analysis, safety analysis, and voltage stability evaluation. As a complex nonlinear system, the state of the power system is affected by several factors such as the grid topology, parameter changes, power supply mode, load characteristics, and power fluctuations. Therefore, the Thevenin equivalent parameters of the power system feature strong nonlinear and time-varying characteristics, and it is challenging to identify the Thevenin equivalent parameters accurately and quickly.
The rapid development of AI (artificial intelligence) technology provides an excellent opportunity for building a new power flow mapping relationship model based on the labeled power flow sample sets and a new perspective for solving the problems mentioned above. An individual convergence result obtained by iterative calculations by applying Newton’s method, the PQ decomposition method, or other conventional algorithms can only illustrate the power flow state under specific operating conditions or modes. Time-based samples make it inevitable to solve a series of problems caused by the iterative calculation of power flow. Such a sample generation method makes the process of learning material accumulation too expensive.
In recent years, the power flow sample generation’s mainstream scheme has been “typical operation scenarios and data deviation drive and power flow program calculation.” Based on typical load and power generation patterns, a large number of candidate data sets are generated by applying power deviations with different magnitudes or different power adjustment strategies (Zhou et al., 2021b; Tang et al., 2019; Zhou et al., 2019; Zhou et al., 2021a). Li et al. (2021) adopts the conventional power flow program, and Wang et al. (2019) adopts the optimal power flow program as the primary calculation tool in the sample production process. For high power data set quality, the convergence of the conventional power flow or the optimal power flow calculation requires consideration, and the non-convergent data subsets need to be eliminated (Tian et al., 2019; Han et al., 2020; Wang et al., 2021; Zhang et al., 2021; Zhong et al., 2021). The statistics in Wang et al. (2020) demonstrate that in a 36-node system, when the load increase in the typical scenario exceeds 170%, power flow data are generally non-convergent in most cases. When it exceeds 270%, the convergence ratio is less than 10%. When the scale of the power grid is large, less than 50% can converge within 10 iterations. These studies illustrate that the existing scheme is affected by the scale of the power grid, the magnitude of data deviation, and the convergence rate of the power flow program. Moreover, the vast cost and low efficiency are still significant challenges for the high quality and capacity of the sample set.
With the widespread application of Phasor Measurement Units (PMUs) in power systems, the Thevenin equivalent parameter identification method based on local measurements has drawn extensive attention (Vu et al., 1999; Abdelkader and Morrow, 2012). Fluctuations on the system side may cause parameter drift (Liu and Chu, 2014; Abdelkader and Morrow, 2015; Su and Liu, 2016). In response to this problem, some scholars have tried to calculate the equivalent parameters by using wide-area measurements at a single moment. In Wang et al. (2011), the equivalent parameter analytical formula of the coupled single-port model based on the network node voltage equation and single-time wide-area measurements are derived. Since the derivation process is simplified to a certain extent, the identification accuracy still needs improvement. Zheng et al. (2013) obtained the equations containing Thevenin equivalent parameters based on a single moment wide-area measurement and calculated the equivalent parameters iteratively to avoid the influence of the fluctuations on the grid side. However, the amount of calculation is large, and the simplification is complicated. Research (Suthar and Balasubramanian, 2007; Gomez et al., 2011) applies different intelligent algorithms to analyze voltage stability features, but it lacks direct exploration of Thevenin equivalent parameters.
This article focuses on building a high-quality labeled power flow sample set based on the power flow mapping relationship of the power system and designing the process of using intelligent algorithms to solve the Thevenin equivalent parameters to solve the above issues. There are main contributions of this research: 1) we solve the power sample production problem from the perspective of Kirchhoff’s law. The power grid state is reproduced by a given input source while preserving the circuit characteristics of the power topology, physical structure, and load. We replace time-based power samples with state-based power samples to break the limitations of iterative power flow calculations in the power network analysis process. 2) We set the load power differential ratio as the feature input and use the LSTM (long short-term memory) method to mine the Thevenin equivalent parameters.
2 Problem Statement and Supporting Mathematical Methods
Modern power systems have large-scale grid structures, complex renewable energy resources, and diverse operating states. In the face of data-driven learning algorithms, there is a lack of labeled sample sets with appropriate capacity, reasonable distribution, and high quality to train AI algorithms.
The limitation of actual power grid operation modes and the amount of installed measurement equipment limit the online sample collection scheme performance. Moreover, the data set offline calculation scheme is severely restricted by the conventional power flow iterative calculation process. These do not lead to meeting the most basic requirements of the data training algorithm. In particular, it cannot meet the Thevenin equivalent parameter learning algorithm that requires multi-node power flow information.
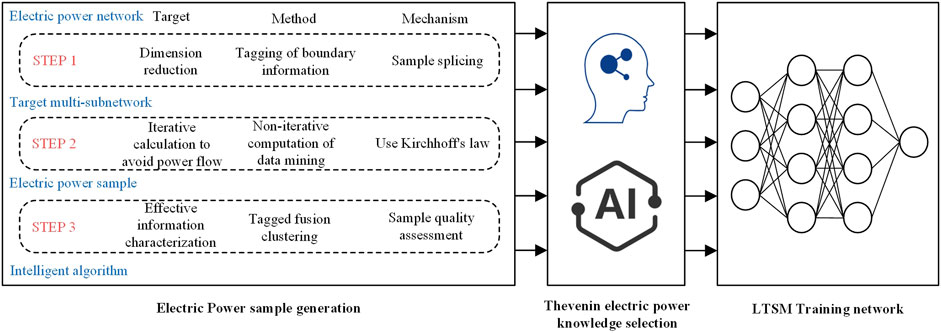
This article proposes a method for generating labeled sample sets for power flow mapping relationships to satisfy sample requirements for machine learning algorithms. As shown in Figure 1, it is the overall design idea of making a power sample set.
The first step is to downscale the data dimension of the ultra-large-scale power network sample set, which is a prerequisite for ensuring the application of AI algorithms based on data training in the power system. The second step is to use the physical laws of the power system to realize the non-iterative calculation of offline power sample generation and solve the core problems of power sample generation efficiency and quality. The key to realizing data dimensionality reduction (the data scale increases exponentially with the node scale) lies in fully utilizing the structural characteristics of the power network topology. The electrical connections of grid nodes are generally sparse, and the grid structure has obvious layering and partition interconnection characteristics. Power sample data sets can have the advantages of regionalized distributed processing by marking different sub-regions’ characteristic labels and interconnection parameters. The second step is to use the physical laws of the power system to realize the non-iterative calculation of offline power sample generation. It helps solve the core problems of power sample generation efficiency and quality. In the third step, this article proposes a standardized evaluation system for the quality of the power sample set. Moreover, the self-examination of the power data sample set is carried out by labeling the target power information features. In the data training process of the Thevenin equivalent parameters, the load power differential ratio is the label parameter.
The solution of the Thevenin equivalent parameters needs the multi-time and overall situation of network power flow information. Such properties require learning methods to process multi-time and the capability of mining implicit mathematical relationships. The LSTM method enhances model-building capabilities through several layers of nonlinear transformations. Using vast training sample sets, theoretically, deep models can approximate high-dimensional functions. The powerful abstract feature capability of LSTM helps uncover the hidden information embedded in the data. The mechanism of machine learning also fundamentally avoids the problem of drift parameters caused by the time difference of the actual PMU measurement equipment.
Through the above process, the LSTM data training mechanism of the Thevenin equivalent parameters of the power network can avoid the complex problems of a series of nonlinear systems caused by iterative calculations and inherent deficiencies of measurement methods.
2.1 A Kirchhoff Law-Based Power Flow Sample Generation Method Serving the Long Short-Term Memory Learning Method
When dealing with problems with high sample dimensions of large-scale power networks, an appropriate partitioning scheme is required to achieve reasonable control of the sample size.
The typical power network organizational structure is shown in Figure 2, with partition and stratification as the main organizational structure. This article adopts the label propagation algorithm as the power network partitioning method, and the hierarchical algorithm is mainly based on the hierarchical organization of the network voltage level. He et al. (2018) find that the dissemination capability of branch power flow value can help evaluate the tightness of the nodes at both ends of the branch. It provides the criterion for the partition of the power grid.
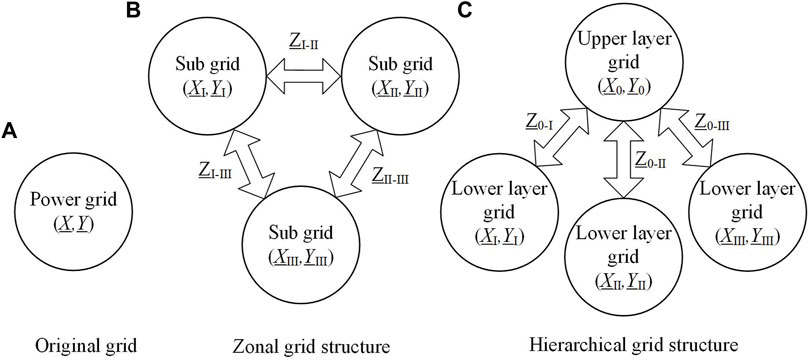
FIGURE 2. Schematic diagrams of the typical power network structure. (A) Original grid. (B) Zonal grid structure. (C) Hierarchical grid structure.
For a single sub-network in a specific power topology, measuring devices or setting rules can supply the boundary information of this single sub-network. This method constructs the conditions for the non-iterative calculation of the power grid. Effective power input replaces the PV nodes and balance nodes. The load power characteristics of node information represent the PQ nodes in the power network. The information of some boundary contact nodes can be set and labeled, as shown in Table 1. Circuit calculation through Kirchoff’s current law, Kirchoff’s voltage law, and Ohm’s law works in the converted circuit. Since the physical laws of the power network are satisfied, the samples are effective, and a series of convergence problems of the power samples generated by iterative calculation is solved. The voltage and current data in the linear space convert to the power information in the nonlinear space by using the mapping method.
The integration of multi-sub-network sample subsets is an important part of realizing the controllable scale of power sample sets through power sample dimensionality reduction. The data structure of the power sample set is shown in Formula 1:
where
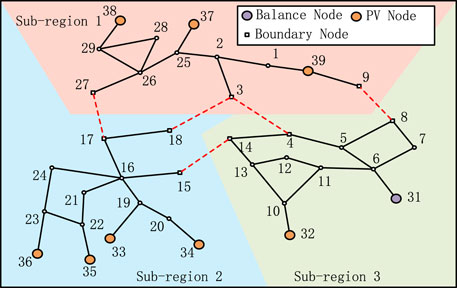
Figure 3 describes the IEEE-39 power system partition structure. We take this system as a sample to introduce the splicing process of the multi-sub-network. First, we replace the controlled voltage source with the PV node of the sub-region 1 sample, and we adjust the output of the voltage source. We obtain the batch sub-region 1 sample set and the information and current labels of the corresponding boundary nodes 27, 3, and 9 in each sample through linear circuit calculation. Then, the power information of boundary node 17 of sub-region 2 is determined through the connection brunch line information and is used as a fixed input bound to the corresponding sub-region 1 sample.
The next step is to perform sample splicing; we replace the controlled voltage source with the PV node of the sub-region 2 samples and obtain a batch sample set that matches the corresponding sub-region 1 through linear circuit calculations. We implement number management to the data set of sub-regions 1 and 2 and label the corresponding current information of boundary nodes 15 and 18. Since the power data and current labels of boundary nodes 18, 15, 3, and 9 are informed, it can calculate the physical information and current labels of boundary nodes 14, 4, and 8 in sub-region 3 through the contact line information.
Finally, we set the boundary nodes of sub-region 3 as input parameters. We replace the controlled voltage source with the PV nodes and the balance nodes. We expand and renumber the latest grid flow data set to the corresponding integrated data set of sub-regions 1 and 2. The generated sample data set will not repeat, and convergence problems caused by power flow calculations get resolved.
2.2 Long Short-Term Memory
2.1.1 Implementation of Long Short-Term Memory
The deep neural network (DNN) is one of the improved neural network models, which overcomes the problem of gradient disappearance of the artificial neural network (ANN) (Li et al., 2019). It uses multiple processing layers to learn the features of data to achieve the “non-linear transformation of multiple layers.” DNN can help to find the implicit functional relationship between input and output. Therefore, DNN can reflect the nonlinear structure of the Thevenin equivalent impedance in the grid system. In addition, several kinds of uncertain node power parameters have different effects on the Thevenin equivalent impedance, which is difficult to be captured by the shallow neural network. Compared with ANN, DNN is more suitable for building the solution model of Thevenin equivalent impedance.
The sequence data at different time points are generally taken into consideration for the solution to the Thevenin equivalent impedance. The recurrent neural network (RNN) can process sequential data, but it has the limitation of long-term dependence. Hence, compared with DNN, RNN applied to sequential data processing is more effective. RNN receives a set of time series as the input characteristic variables each time, and then the output variables are obtained through the multi-layer hidden layer. RNN is widely used in the fields of state identification, load prediction, and stability analysis. As the length of the input sequence increases, it is difficult for the model to use the earlier data information in the data set.
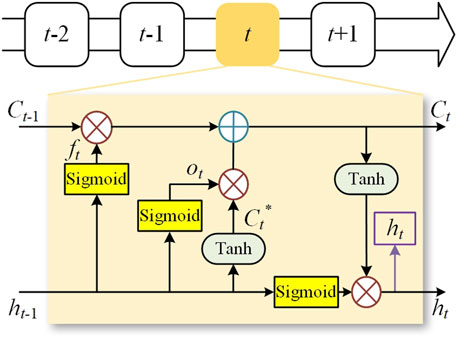
LSTM alleviates the problem of gradient disappearance and enhances model building capability by using storage units (Woo et al., 2020; Xue et al., 2020). A large number of training sample sets work in LSTM for model training, which can dig out the hidden information in the data and enhance the ability to build the multi-layer nonlinear transformation model. The process of LSTM is depicted in Figure 4. Four logic units called input gate, forget gate, update memory cell, and output gate are added to the LSTM network to control the output of the memory unit. The forget gate selects and retains the processing results of the previous memory unit, whose function is as follows:
where ft is the input of the forget gate, Wf is the weight of the forget gate, and bf is the bias of the forget gate.
The input gate controls the current input state in the memory unit, which is expressed as
where ot is the input of the input gate, Wo is the weight of the input gate, bo is the bias of the input gate, Ct* is the input cell vector, and WC is the weight of the memory cell.
The output gate controls the output state of the memory unit, which is expressed as
where it is the input of the output gate, bi is the bias of the output gate, Wi is the weight of the output gate, and ht-1 represents the output vector.
The update memory cell updates the new information and calculates the state again, which is expressed as
where Ct is the memory cell state vector.
With the four logical units, LSTM can store useful data for a longer time and it is more suitable for capturing the long-term correlation between features and output values than RNN.
2.1.2 Implementation of BiLSTM
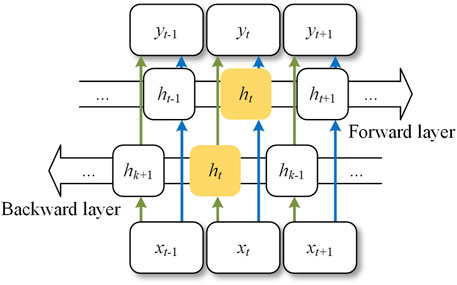
The characteristic of LSTM is that the activation function controls the states of two adjacent memory units, the input gate and forget gate. However, this algorithm only carries out training from front to back according to time series, indicating a relatively low data utilization rate. It is hard to mine the inherent characteristics of data completely. Therefore, to determine Thevenin equivalent impedance, it is of great difficulty to describe the model accurately if only a one-way time series is considered. Bi-LSTM incorporates the bidirectional concept into LSTM, increasing the flow of data from the future to the past (Moharm et al., 2020; Xueqing et al., 2021). The structure of the Bi-LSTM model is shown in Figure 5.
In the Bi-LSTM structure, each state of the hidden layer ht is composed of three parts: the output state of the hidden layer at the previous moment when it is propagating forward along the time axis, the output state of the hidden layer at the previous moment when it is propagating backward along the time axis, and the input variable at the current moment. The combination process of the state in each hidden layer can be represented as
where LSTM is the operation process of the conventional function, ht is the state of the forward hidden layer, hi is the state of the backward hidden layer, bt is the weight of the hidden layer of the forward unit, bk is the output weight of the hidden layer of the backward unit, and ct is the bias of the hidden layer at the current time.
The model parameters are trained in Bi-LSTM through forward and backward paths so that the state of past and future hidden layers can make feedback. Besides, the internal relationship between output features and input features from different states can be further mined by Bi-LSTM, which means that a large margin can improve model accuracy and feature data utilization rate.
3 Solution Method
This article considers the screening mechanism for the LSTM algorithm on the generated sample set to help optimize machine learning. At the same time, the implicit information of the Thevenin equivalent calculation is explored as the input of LSTM to enhance the efficiency of the learning algorithm.
3.1 Sample Set Screening Based on the Neighborhood Grid Clustering Clustering Mechanism
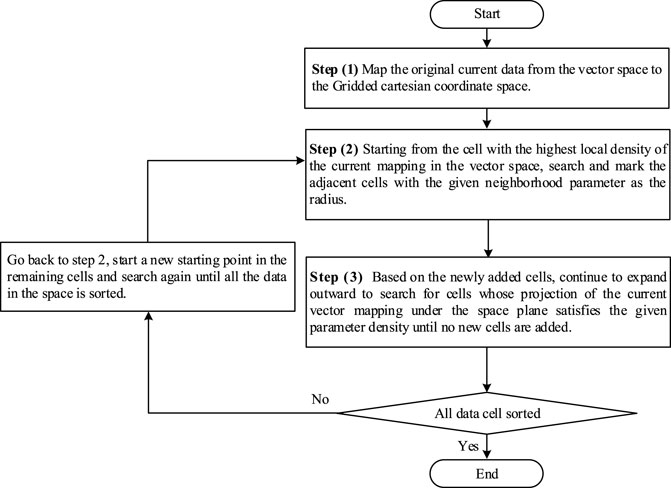
The NGC (Neighborhood Grid Clustering) clustering algorithm helps ensure that the power flow samples meet the requirements of the LSTM algorithm to calculate the Thevenin equivalent parameters. The single sample calculated by Kirchhoff’s law mentioned in this article is a set of data based on the state instead of the time dimension. The Thevenin equivalent parameter data calculation is generally based on multi-time power flow information. The power flow changes of the power system at adjacent times are limited. When the power flow information at adjacent moments is stored as power samples, it is expressed as two power samples with small state changes. Therefore, when processing samples, it is necessary to adopt a clustering algorithm that can filter sample data with large data intervals. In this way, the clustering method adopted in this article ensures that the current vectors of adjacent power samples at the specified nodes tend to be close. By the abovementioned method, the state-based power flow data sets are feasible to solve this problem.
The NGC method using the factors of density and distance in network space implements the clustering function. This method utilizes the idea of grid division (Suo et al., 2018), maps the original data to the grid subspace, and realizes the clustering of data of any shape by using the neighborhood search within the range. The advantage of this classification method is that it can achieve autonomous clustering without pre-specifying the number of clusters and can automatically classify according to parameters. This feature has an excellent performance in the large-scale power network sample data. Figure 6 shows the main clustering process.
Usually, the original data based on traditional clustering algorithms will inevitably have noise. Noise recognition ability is a criterion to measure the clustering algorithm. For a specified grid node, we use NGC to cluster the current vector. If the clustering result identifies noise, it means that the load at this point varies greatly. Such state-based samples are detrimental to the learning effect for the objective algorithm that solves for Thevenin-equivalent parameters. Combined with the NGC algorithm, Equation 9 represents the current noise threshold pIt in a given grid interval.
where tI is current noise data, c represents grid center,
After identifying the current noise data, the noise sample group it belongs to is eliminated. With the help of the NGC method, each group of samples included in the study has a controllable load fluctuation at a specific node. The sample set based on the state quantity can guarantee the effect of Thevenin’s equivalent parameter data learning algorithm.
3.2 Feature Selection for Long Short-Term Memory to Study Thevenin Equivalent Parameters
The Thevenin equivalent can equalize the nonlinear time-varying power system to the form of the series impedance of the voltage source, reduce the system’s complexity, and improve the efficiency of power grid security and stability analysis (Ohtsuka et al., 1989; Luo et al., 2009). As shown in Figure 7A, subsystem A represents the system side, and subsystem B represents the load side. According to the Thevenin equivalent theorem, when no system operating variation occurs in subsystem A, it could be represented by a single voltage source in series with impedance connected to subsystem B, as shown in Figure 7B.

FIGURE 7. Schematic diagram of the Thevenin equivalent for power systems. (A) Power system model before the Thevenin equivalent. (B) Power system model after the Thevenin equivalent.
Functions 10, 11 show the analytical formula of Thevenin equivalent parameters on the system side, observing from the node to the system side.
The model of Thevenin equivalent impedance is affected by several factors in most cases, and various types of characteristic parameters are contained in the input parameters of the network. Therefore, the model of Thevenin equivalent impedance is nonlinear and fluctuating, which results in dimensional disaster in practical training and prediction and reduces the loss of prediction accuracy. Several features in the actual model training process strongly correlate with the model. This step can reduce the number and dimension of feature parameters and the phenomenon of over-fitting operation. Moreover, it can improve the model operation efficiency and generalization ability and improve model accuracy.
The power differential ratio of a node is the cotangent of the argument of the power fluctuation vector, and its long-term change reflects the load growth mode, which can reflect the correlation between the two power samples. This “knowledge” has a practical physical meaning for the LSTM algorithm. Therefore, based on the power flow data sets, the power differential ratio of the node is added as the input parameter of LSTM.
4 Case Study and Discussion
The proposed methods in the present article have been applied to the IEEE 39-bus (New England) test system, as shown in Figure 3. The CPU of the computer simulation platform is i7-8700, and the memory capacity is 16 GB.
4.1 Parameters
In order to evaluate the performance of the Bi-LSTM model quantitatively, evaluation indicators such as mean absolute error (EMAE), mean absolute percentage error (EMAPE), and root-mean-square error (ERMSE) are selected, which are expressed as
where i is the number of samples, n is the total number of samples,
In addition, in order to make the model learn the rules between features better, input features need to be normalized. This method can accelerate the training speed and improve the effectiveness of the model. The normalized processing formula is defined as follows:
where y′ is the normalized input feature and ymax and ymin correspond to the maximum and minimum values of the eigenvalues to be normalized, respectively.
4.2 A Novel Method of Generating the Digital Electricity Data Sample
First, we verify the power flow state sample set calculation method based on Kirchhoff’s law proposed in this article. Comparing the method in this article with the power flow calculation method used in the MATPOWER platform, both complete the goal of generating 100,000 power flow samples for the IEEE 39-bus system.
As shown in Table 2, the sample generation based on the multi-sub-network partitioning and splicing mechanism proposed in this article is about 30 times faster than the traditional power flow calculation method. The memory resource occupies about 45%, and the processor resource occupies about 36%. Table 3 shows that the power sample generation method proposed in this article can effectively avoid the convergence problem of power flow calculations and greatly improve the sample generation efficiency. Since the growth of the power network scale will increase the sample dimension exponentially, when dealing with larger-scale power grids, the advantage of sample generation efficiency in this article will be more obvious.
4.3 Application of the NGC Clustering Method of Power Samples in the Long Short-Term Memory Algorithm
We verify the effectiveness of the NGC clustering screening method proposed in this article for optimizing the LSTM algorithm. Using the scheme in this article and the power flow calculation method used in the MATPOWER platform, 8,000 samples are generated and clustered.
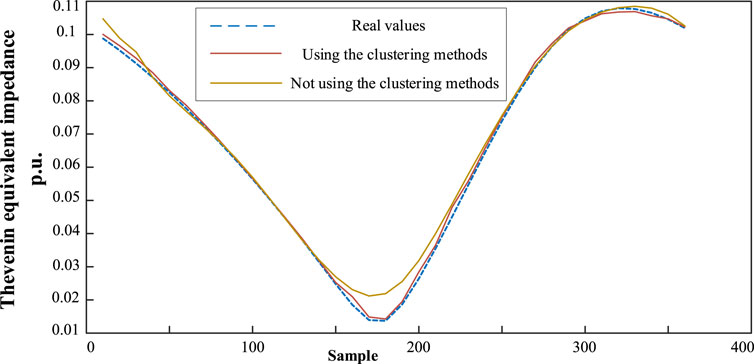
Table 3 shows that the clustering algorithm adopted in this article can effectively eliminate the situation of excessive load fluctuation. In order to verify the advantages of the sample selection method using the clustering algorithm in sample generation and model training, two groups of data sets are used to generate Thevenin equivalent impedance under the same training network. As shown in Figure 8 and Table 4, results without sample screening methods are slightly less accurate and the training time increases exponentially. Therefore, the NGC clustering method can reduce the time cost of model training and improve the accuracy and precision of the model.
4.4 Long Short-Term Memory Results
This research generates 19 groups of power flow data sets for different nodes, and each group has 360 power grid statuses to calculate Thevenin equivalent impedances. Eighteen groups are randomly selected as training samples, while the remaining one group has tested samples.
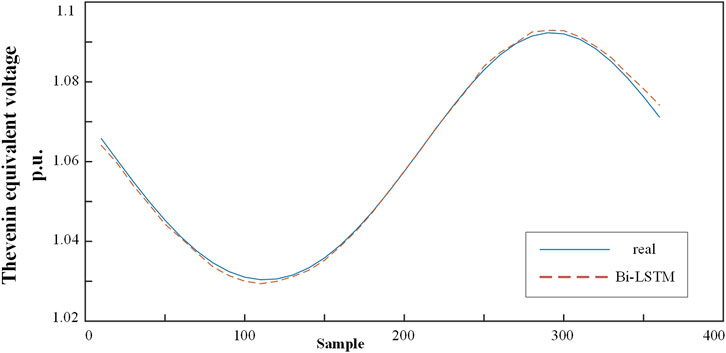
The curve can reflect the trend of change and the degree of fitting more directly, so the curve model of Thevenin equivalent impedance is constructed to reflect the effect of the equivalent impedance model more directly. In this article, the Thevenin equivalent impedance model is constructed by the Bi-LSTM network. In order to balance the training time and prediction accuracy, the Bi-LSTM model is set as three layers, with the number of neurons in each layer being 128, 64, and 24. The corresponding learning rate is 0.1, 0.1, and 0.1. The Thevenin equivalent impedance analysis model is built through Bi-LSTM, and it is verified by using the data of the test group Bus 29. Figure 9 shows the results of the Thevenin equivalent voltage analysis. The Bi-LSTM method has achieved good consequences in finding the implicit functional relationship of the Thevenin equivalent voltage.
In order to further illustrate the advantages of the proposed model in constructing Thevenin equivalent impedance, the proposed model is compared with algorithms such as LSTM and RNN. The curves of each model on the test sets are shown in Figure 10. The error of each model on the test sets is shown in Table 5. By comparison, the average RMSE, MAPE, and MAE of the model selected in this article are 0.0015, 0.0287, and 0.001766, respectively, which are significantly lower than LSTM and RNN.
5 Conclusion
The power sample generation method based on Kirchhoff’s law proposed in this article has the advantage of a high computational efficiency and eliminates the iterative calculation of power flow. The adopted current vector-based NGC clustering method can improve the learning performance of the LSTM algorithm for solving Thevenin equivalent parameters. Compared with other learning algorithms, the adopted Bi-LSTM model and load power differential ratio characteristic parameters have better learning performance. These contributions make the Thevenin equivalent parameter solution more convenient and efficient.
Data Availability Statement
The raw data supporting the conclusion of this article will be made available by the authors, without undue reservation.
Author Contributions
Conceptualization, CL and JL; methodology, CL and JY; software, CL and JY; validation, CL and JY; formal analysis, CL and JY; investigation, CL; resources, JL; data curation, CL; writing—original draft preparation, CL; writing—review and editing, CL and JL; visualization, CL and JL; supervision, JY; project administration, CL. All authors have read and agreed to the published version of the manuscript.
Conflict of Interest
The authors declare that the research was conducted in the absence of any commercial or financial relationships that could be construed as a potential conflict of interest.
Publisher’s Note
All claims expressed in this article are solely those of the authors and do not necessarily represent those of their affiliated organizations, or those of the publisher, the editors and the reviewers. Any product that may be evaluated in this article, or claim that may be made by its manufacturer is not guaranteed or endorsed by the publisher.
References
Abdelkader, S. M., and Morrow, D. J. (2015). Online Thévenin Equivalent Determination Considering System Side Changes and Measurement Errors. IEEE Trans. Power Syst. 30 (5), 2716–2725. doi:10.1109/TPWRS.2014.2365114
Abdelkader, S. M., and Morrow, D. J. (2012). Online Tracking of Thévenin Equivalent Parameters Using PMU Measurements. IEEE Trans. Power Syst. 27 (2), 975–983. doi:10.1109/TPWRS.2011.2178868
Gomez, F. R., Rajapakse, A. D., Annakkage, U. D., and Fernando, I. T. (2011). Support Vector Machine-Based Algorithm for Post-Fault Transient Stability Status Prediction Using Synchronized Measurements. IEEE Trans. Power Syst. 26, 1474–1483. doi:10.1109/TPWRS.2010.2082575
Han, T., Chen, J., Li, Y., He, G., and Li, H. (2020). Study on Interpretable Surrogate Model for Power System Stability Evaluation Machine Learning. Proc. CSEE 40 (13), 4122–4131. doi:10.13334/j.0258-8013.pcsee.190963
He, J., Li, C., Zhang, P., Wang, X., and Li, F. (2018). A Partitioning Method for Power System Parallel Restoration Based on Modified Label Propagation Algorithm. Power Syst. Technol. 42 (06), 1776–1782. doi:10.13335/j.1000-3673.pst.2017.1290
Li, J., Yang, H., Yan, L., Liu, D., Li, Z., and Xia, Y. (2021). An Integrated Evaluation Method for Power System Transient Stability in the Case of Unbalanced Samples. Automation Electr. Power Syst. 45 (10), 34–41. doi:10.7500/AEPS20200309001
Li, M., Yu, D., Chen, Z., Xiahou, K., Ji, T., and Wu, Q. H. (2019). A Data-Driven Residual-Based Method for Fault Diagnosis and Isolation in Wind Turbines. IEEE Trans. Sustain. Energy 10 (02), 895–904. doi:10.1109/TSTE.2018.2853990
Liu, J.-H., and Chu, C.-C. (2014). Wide-Area Measurement-Based Voltage Stability Indicators by Modified Coupled Single-Port Models. IEEE Trans. Power Syst. 29 (2), 756–764. doi:10.1109/TPWRS.2013.2284475
Luo, H., Wu, Z., Dai, Q., Deng, Y., Zhao, K., and Zeng, X. (2009). Fast Computation of Thevenin Equivalent Parameters. Proc. CSEE. 29 (1), 35–39. doi:10.13334/j.0258-8013.pcsee.2009.01.005
Moharm, K., Eltahan, M., and Elsaadany, E. (2020). “Wind Speed Forecast Using LSTM and Bi-LSTM Algorithms over Gabal El-Zayt Wind Farm,” in 2020 International Conference on Smart Grids and Energy Systems, Perth, Australia. 23-26 November. 922–927. doi:10.1109/SGES51519.2020.00169
Ohtsuka, K., Yokokawa, S., Tanaka, H., and Doi, H. (1989). An Equivalent of Multi-Machine Power Systems and its Identification for On-Line Application to Decentralized Stabilizers. IEEE Trans. Power Syst. 4 (2), 687–693. doi:10.1109/59.193844
Su, H.-Y., and Liu, C.-W. (2016). Estimating the Voltage Stability Margin Using PMU Measurements. IEEE Trans. Power Syst. 31 (4), 3221–3229. doi:10.1109/TPWRS.2015.2477426
Suo, M., Zhou, D., An, R., and Li, S. (2018). Neighborhood Density Grid Clustering and its Applications. J. Tsinghua Univ. Sci. Technol. 8, 58. doi:10.16511/j.cnki.qhdxxb.2018.22.025
Suthar, B., and Balasubramanian, R. (2007). “A Novel ANN Based Method for Online Voltage Stability Assessment,” in 2007 International Conference on Intelligent Systems Applications to Power Systems, Kaohsiung, Taiwan, 05-08 November, 1–6. doi:10.1109/ISAP.2007.4441625
Tang, Y., Han, C., Feng, L., and Wang, Q. (2019). Review on Artificial Intelligence in Power System Transient Stability Analysis. Proc. CSEE 39 (01), 2–13. doi:10.13334/j.0258-8013.pcsee.180706
Tian, F., Zhou, X., Shi, D., Chen, Y., Huang, Y., and Yu, Z. (2019). Power System Transient Stability Assessment Based on Comprehensive Convolutional Neural Network Model and Steady-State Features. Proc. CSEE 39 (14), 4025–4032. doi:10.1109/TSG.2015.2427371
Vu, K., Begovic, M. M., Novosel, D., and Saha, M. M. (1999). Use of Local Measurements to Estimate Voltage-Stability Margin. IEEE Trans. Power Syst. 14 (3), 1029–1035. doi:10.1109/59.780916
Wang, S., Chen, H., Pan, Z., and Wang, J. (2019). A Reconstruction Method for Missing Data in Power System Measurement Using an Improved Generative Adversarial Network. Proc. CSEE 39 (01), 56–64. doi:10.13334/j.0258-8013.pcsee.181282
Wang, T., Tang, Y., Guo, Q., Huang, Y., Chen, X., and Huang, H. (2020). Automatic Adjustment Method of Power Flow Calculation Convergence for Large-Scale Power Grid Based on Knowledge Experience and Deep Reinforcement Learning. Proc. CSEE 40 (08), 2396–2406. doi:10.1109/ei250167.2020.9346831
Wang, Y., Pordanjani, I. R., Li, W., Xu, W., Chen, T., Vaahedi, E., et al. (2011). Voltage Stability Monitoring Based on the Concept of Coupled Single-Port Circuit. IEEE Trans. Power Syst. 26 (4), 2154–2163. doi:10.1109/TPWRS.2011.2154366
Wang, Z., Zhou, Y., Guo, Q., and Sun, H. (2021). Transient Stability Assessment of Power System Considering Topological Change: a Message Passing Neural Network-Based Approach. Proc. CSEE 41 (7), 2341–2349. doi:10.13334/j.0258-8013.pcsee.202139
Woo, S., Park, J., Park, J., and Manuel, L. (2020). Wind Field-Based Short-Term Turbine Response Forecasting by Stacked Dilated Convolutional LSTMs. IEEE Trans. Sustain. Energy 11 (04), 2294–2304. doi:10.1109/TSTE.2019.2954107
Xue, Z. Y., Xiahou, K. S., Li, M. S., Ji, T. Y., and Wu, Q. H. (2020). Diagnosis of Multiple Open-Circuit Switch Faults Based on Long Short-Term Memory Network for DFIG-Based Wind Turbine Systems. IEEE J. Emerg. Sel. Top. Power Electron. 8 (03), 2600–2610. doi:10.1109/JESTPE.2019.2908981
Xueqing, Z., Zhansong, Z., and Chaomo, Z. (2021). Bi-LSTM Deep Neural Network Reservoir Classification Model Based on the Innovative Input of Logging Curve Response Sequences. IEEE Access 9, 19902–19915. doi:10.1109/ACCESS.2021.3053289
Zhang, S., Zhang, D., Huang, Y., Li, W., Chen, X., and Tang, Y. (2021). Research on Automatic Power Flow Convergence Adjustment Method Based on Modified DC Power Flow Algorithm. Power Syst. Technol. 45 (01), 86–97. doi:10.13335/j.1000-3673.pst.2019.1969
Zheng, Q. P., Wang, J., Pardalos, P. M., and Guan, Y. (2013). A Decomposition Approach to the Two-Stage Stochastic Unit Commitment Problem. Ann. Oper. Res. 210, 387–410. doi:10.1007/s10479-012-1092-7
Zhong, Z., Guan, L., Su, Y., Yao, H., Huang, J., and Guo, M. (2021). Power System Transient Stability Assessment Based on Graph Attention Deep Network. Power Syst. Technol. 45 (06), 2122–2130. doi:10.13335/j.1000-3673.pst.2020.0897
Zhou, T., Yang, J., Zhan, X., Pei, Y., Zhang, J., Chen, H., et al. (2021a). Data-driven Method and Interpretability Analysis for Transient Voltage Stability Assessment. Power Syst. Technol. 43, 1–10. doi:10.13335/j.1000-3673.pst.2020.2170
Zhou, T., Yang, J., Zhou, Q., Tan, B., Zhou, Y., Xu, J., et al. (2019). Power System Transient Stability Assessment Method Based on Modified LightGBM. Power Syst. Technol. 43 (06), 1931–1940. doi:10.13335/j.1000-3673.pst.2019.0085
Keywords: Thevenin equivalent (TE), LTSM, power flow sample data set, electric data collection system, NGC, Kirchhoff
Citation: Li C, Yu J and Lv J (2022) A Novel Bi-LSTM-Based Method for Thevenin Equivalent Parameter Identification. Front. Energy Res. 10:933544. doi: 10.3389/fenrg.2022.933544
Received: 01 May 2022; Accepted: 31 May 2022;
Published: 12 July 2022.
Edited by:
Meng Song, Southeast University, ChinaReviewed by:
Changsen Feng, Zhejiang University of Technology, ChinaFu Shen, Kunming University of Science and Technology, China
Yi Zhao, Shenyang Institute of Engineering, China
Copyright © 2022 Li, Yu and Lv. This is an open-access article distributed under the terms of the Creative Commons Attribution License (CC BY). The use, distribution or reproduction in other forums is permitted, provided the original author(s) and the copyright owner(s) are credited and that the original publication in this journal is cited, in accordance with accepted academic practice. No use, distribution or reproduction is permitted which does not comply with these terms.
*Correspondence: Chengyu Li, ODAyNjc1NTZAcXEuY29t; Jiaxin Lv, MTk2NTc0MTY1OUBxcS5jb20=
 Chengyu Li
 Jilai Yu