 Juhwan Kim
 Jaehyeong Lee
 Sungwoo Kang
 Sungchul Hwang
 Minhan Yoon
 Gilsoo Jang
- 1School of Electrical Engineering, Korea University, Seoul, South Korea
- 2Power System Planning Department, Korea Electric Power Corporation, Naju, South Korea
- 3Department of Electrical Engineering, Sunchon National University, Suncheon, South Korea
- 4Department of Electrical Engineering, Kwangwoon University, Seoul, South Korea
Power system clustering is an effective method for realizing voltage control and preventing failure propagation. Various approaches are used for power system clustering. Graph-theory-based spectral clustering methods are widely used because they follow a simple approach with a short calculation time. However, spectral clustering methods can only be applied in system environments for which the power generation amount and load are known. Moreover, it is often impossible to sufficiently reflect the influence of volatile power sources (e.g., renewable energy sources) in the clustering. To this end, this study proposes a probabilistic spectral clustering algorithm applicable to a power system, including a photovoltaic (PV) model (for volatile energy sources) and a classification method (for neutral buses). The algorithm applies a clustering method that reflects the random outputs of PV sources, and the neutral buses can be reclassified via clustering to obtain optimal clustering results. The algorithm is verified through an IEEE 118-bus test system, including PV sources.
1 Introduction
New and renewable energy resources have been increasingly used worldwide owing to energy policies aimed at achieving carbon neutrality (Cauz et al., 2020; Li et al., 2021). From a numerical perspective, the accumulated capacity of global wind power increased by a factor of 36.7 (from 16.9 to 621.6 GW) between 2000 and 2019. Within the same time frame, photovoltaic (PV) capacity increased by a factor of 480.8, from 1.2 GW in 2000 to 590.3 GW in 2019 (IRENA, 2021). Owing to the variability in wind and PV generation, wind and PV are treated as variable renewable energy (VRE) sources. In one instance in Denmark (where high renewable penetration has been achieved), VRE generation exceeded demand for 845 h and recorded a high demand of 213%. Such situations have become more frequent since the first occurrence in 2015 (Holttinen et al., 2021). Increases in the uncertainty and variability of VRE sources are expected to pose challenges to the secure operation of modern power systems. Accordingly, probability analyses have been applied to incorporate the uncertainties from VRE sources and converter-interfaced generation (Wiget et al., 2014; Leeuwen and Moser, 2017). Novel approaches are required to handle the corresponding challenges in power system operation, planning, and control.
The clustering (i.e., partitioning, islanding, and splitting) of electric power systems is a concept that emerges especially frequently in control and protection technologies (Park and Kim, 2006; Sarajpoor et al., 2021). In power systems, clustering methods are used in various ways and for various purposes. Chai et al. proposed a double-layer voltage control strategy to solve the voltage violation problem in a distribution system. The proposed method was aimed at minimizing the PV active power curtailment and network power loss of each cluster. In this case, the process of dividing clusters was based on a clustering method that operated according to electrical distance, thus facilitating rapid optimization. In general, following the high penetration of PV power, numerous approaches have been proposed based on the corresponding voltage (for example, to avoid voltage violations). In this context, decentralized or distributed control based on power network clustering offers an advantage over centralized control (Cao et al., 2021). The clustering method can be applied not only to system control but also to event detection (Ma et al., 2021). Nevertheless, in the case of a large existing system, it is difficult to search for events owing to the large quantities of measured data. A graph-theory-based network partitioning algorithm has been proposed to address this problem and accelerate the system response.
The clustering algorithms used in several of the papers cited herein can be classified into different categories (Si et al., 2021). Among these algorithms, hierarchical spectral clustering is an important clustering method and is widely used for the partitioning of electric power systems. Owing to its strong theoretical basis (von Luxburg, 2007; Lee et al., 2014), this method has been used in various power system studies. This spectral clustering technique can be applied using the electrical parameters (e.g., the topology, admittance, and power flow) of a power system alongside hierarchical clustering, where the preferred number of clusters is considered the input. Consequently, hierarchical clustering can be obtained for the connection strength determined by the chosen electrical weighting (Sánchez-García et al., 2014). This method has been studied from various perspectives, such as to improve the calculation efficiency and partition quality through orthogonal conversion (Tyuryukanov et al., 2018), to island power systems according to the minimum active flow disruptions (Amini et al., 2020), and to prevent cascading failures through tree partitioning (Bialek and Vahidinasab, 2022). As described above, numerous studies have focused on clustering; these studies and their findings are summarized and compared in Table 1.
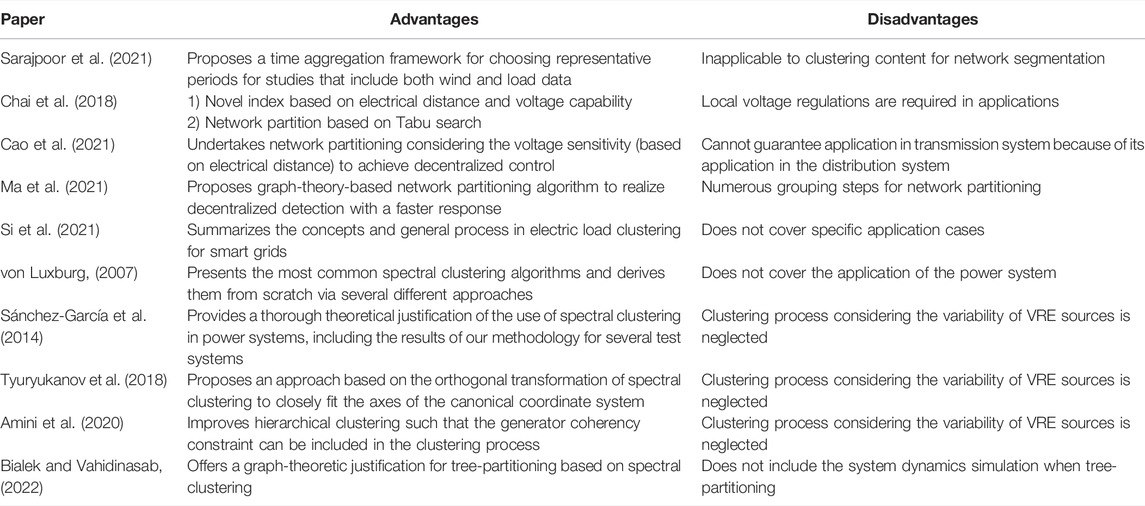
TABLE 1. Comparison of clustering references.
However, methods for clustering in power transmission systems that incorporate variable power sources (e.g., renewable generation) have not been fully discussed. This is because when applying power flow-based clustering, the results can differ in response to variations in power generation. Clustering according to topology or admittance can be considered; however, this leads to further issues that cannot be addressed (e.g., those concerning a branch list with an overload risk, maximum overload rates, and overload probabilities). Accordingly, a probabilistic flow analysis method has been proposed to address these issues (Zhu et al., 2020; Wang et al., 2021; Lin et al., 2022). It is necessary to discuss clustering based on a consideration of a probabilistic interpretation of renewable power generation sources (e.g., PV sources). Therefore, in this paper, we propose a probabilistic clustering methodology for power systems operating with a high penetration of VRE sources.
The main contributions of this paper are as follows:
A probabilistic spectral clustering methodology based on the Monte Carlo method: This method can be applied to power systems by considering the characteristics of VRE sources whilst applying the hierarchical spectral clustering method in the existing power system network.
The classification and reprocessing of neutral buses: Neutral buses are generated as a result of the proposed probabilistic clustering method and the change in power flow. By reprocessing such buses using neutrality and probabilistic evaluation index, optimal clustering results can be derived.
The definition of new evaluation indices for probabilistic clustering: The probabilistic expansion index is discussed anew, allowing the expansion to be used as a clustering evaluation index for application under probabilistic conditions. As a result, a more appropriate clustering can be derived.
The remainder of this paper is organized as follows: In Section 2, the essential preliminaries are introduced, and the spectral clustering method and related contents are summarized. Section 3 describes the proposed probabilistic spectral clustering method, PV modeling, and neutral bus classification. In Section 4, the results of the method applied to an IEEE 118-bus test system are verified. Finally, the discussion and conclusion are presented in Section 5 and Section 6.
2 Hierarchical Spectral Clustering of Power System
A power system can be partitioned via hierarchical spectral clustering, as shown in Figure 1A; the proposed probabilistic spectral clustering is shown in Figure 1B. The spectral clustering algorithm consists of four steps, as illustrated in Figure 1.

FIGURE 1. Clustering process. (A) Hierarchical spectral clustering method. (B) Probabilistic spectral clustering and classification of neutral buses.
2.1 Graph Representation of Network
2.1.1 Terminology
For graph-theory-based network partitioning, power systems with N buses are represented as a graph G = (V, E) with a vertex set V and edge set E. The buses and transmission lines (or transformers) in power grids can be denoted as vertices (nodes) and edges (links), as follows:
This graph is only considered a simple graph (i.e., no loops or multiple edges are allowed). Multiple edges are replaced by equivalent single edges. All graphs are undirected.
2.1.2 Edge Weights Reflecting Power System
The topological structure of the graph does not include the electrical information of the power system. Therefore, the edge weights should be used. Edge weight is a function
1)
2)
3)
In this study, we adopt the notation that
The power-flow-based weight depends on the operating point and denotes the importance of a branch. Thus, a branch with a small flow is more likely to be removed. In contrast, a branch with a large flow exhibits a strong connection between each vertex and is more likely to be grouped together with other elements.
2.1.3 Graph Laplacian Matrix
Laplacian matrices are used in the spectral clustering method for efficient graph partitioning. The method uses the eigenvector and eigenvalues of two types of Laplacian matrices, which are related to the undirected weighted simple graph G = (V, E, w).
The Laplacian matrix L of G is an
The normalized Laplacian matrix is calculated using a diagonal matrix D with nonzero elements
The normalized Laplacian matrix is scale-independent and more suitable for clustering.
The eigenvalues of the Laplacian matrix are non-negative real numbers, and the number of zero eigenvalues is equal to the number of connected components in the graph. For the normalized Laplacian matrix of a connected graph with N vertices, the eigenvalues can be written as follows (von Luxburg et al., 2008):
By taking the k smallest eigenvalues together with their respective eigenvectors (
2.2 Spectral Clustering
Clustering refers to the classification of the vertices in a graph into several groups (clusters) such that vertices in the same cluster are highly interconnected but are weakly connected to vertices in other clusters. Among the clustering methods, spectral clustering uses normalized Laplacian eigenvalues and eigenvectors. The concept applies the first k eigenvectors corresponding to the smallest k eigenvalues (called spectral k-embedding) and identifies the geometric coordinates that match the N vertices. These coordinates form the N rows of the
2.2.1 Laplacian Matrix Calculation
The Laplacian and normalized Laplacian matrix are calculated for graph G using Eqs (4)–(6), as described in the previous section. At this time, the edge weight is calculated as a power flow using Eq. (3). The latter of the two calculated matrices is used in this study. The eigenvectors of this matrix provide the coordinates representing each bus in the space
2.2.2 Spectral Embedding
Spectral embedding is an important process in spectral clustering. This process employs the first
The criterion for determining the embedding space
When the value of the eigengap is large, we obtain a better network partition with at least
2.2.3 Coordinate Normalization
After spectral embedding, the coordinates of the N vertices are represented in space
2.2.4 Hierarchical Clustering
Through the clustering process described above, we express each bus as a coordinate in space
Hierarchical clustering offers several advantages over other clustering methods. It identifies the hierarchy of clusters, which we represent as dendrograms. A dendrogram is a tree diagram that visualizes the hierarchical spectral structure of a power system. This method employs a bottom-up process applied for power system clustering. In N buses, the two most similar buses are merged into a cluster. Here, similarity refers to the distance between buses or clusters. This distance indicates the Euclidian distance between buses i and j.
After the buses are chosen, a new graph with N-1 buses is formed. In the new graph, the two closest buses are merged into a new cluster again, and this process is repeated until the desired number of clusters is obtained. This procedure helps grasp the hierarchical structure immediately, and the number of clusters can be adjusted without additional calculations.
2.3 Clustering Evaluation
Through the hierarchical spectral clustering described thus far, the desired number of clusters can be obtained from graph G. The purpose of clustering is to identify a cluster in which the buses in the cluster are strongly connected to each other and weakly connected to buses in other clusters. To evaluate the quality of a cluster, two quantities are defined to evaluate the connectivity described above. First, boundary (
Second, the volume (
For the abovementioned purposes, the quality evaluation metric for a cluster can be defined as the value obtained by dividing the boundary by the volume. It is denoted as the expansion (
The smaller the value of the expansion for the network partition, the better the clustering (i.e., strong connections between buses included in a specific cluster, and weak connections between buses outside thereof). When partitioning the power system into k clusters, we use the maximum expansion value to evaluate the quality of the clustering method (Sánchez-García et al., 2014):
It is possible to evaluate whether clustering has been well executed by using a normalized cut (i.e., the arithmetic mean of all clusters’ expansions) (von Luxburg, 2007). This method is widely used in the evaluation of graph clustering because the average quality of all clusters can be evaluated.
In this study, in view of the expansion of renewable energy sources in power systems, a metaheuristic approach is applied for probabilistic interpretation. To this end, numerous clustering results must be analyzed for various cases. For this purpose, the above two objective function equations are used to efficiently optimize and evaluate the results. In contrast, several more complex objective functions were required for the method proposed by Cotilla-Sanchez et al. (2013).
3 Probabilistic Spectral Clustering Methodology
In this section, we propose a probabilistic spectral clustering method applicable to power systems containing variable sources (e.g., renewable energy sources). In addition, we explain the process of optimizing the neutral buses that may arise in the process of probabilistic analysis by using an evaluation index (i.e., the expansion described in the previous section). To this end, a model is required for the PV output power and its corresponding variability.
3.1 Modeling of Variable Renewable Energy Source: Photovoltaic (PV)
In this study, assuming a situation in which PV sources are expanded in a power system, we repeatedly perform the clustering process for a power flow with an intermittent PV output. The output power of the PV is affected by the random phenomenon of solar irradiance, which changes the power flows of the branches in the power system. Generally, it is more efficient to model irradiance using a beta probability density function than other probability density functions (Teng et al., 2013). Accordingly, the solar irradiance can be expressed as follows:
In the above,
The output power of the PV module depends on the solar irradiance, ambient temperature, and parameters of the PV module. When the PV module operates at the maximum power point and at a solar irradiance s, the output power can be calculated as a function of s as follows (Sehsalar et al., 2019):
Here, N denotes the number of PV modules, and FF is the fill factor obtained from Eq. (22); VMPP and IMPP are the voltage and current at the maximum power point in V and A, respectively;
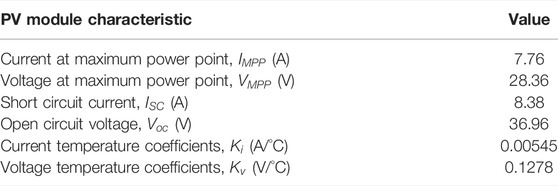
TABLE 2. Characteristics of the photovoltaic (PV) module.
3.2 Probabilistic Optimal Power Flow Algorithm
The PV output varies depending on the changes in the solar irradiance over time; accordingly, the value of the power flow in the power system also varies. Owing to this randomness, the results from the power-flow-based spectral clustering vary continuously. The power generation of the existing turn-on generators should be readjusted to match the PV output. The total power generation of conventional generators is adjusted via the total load, PV generation, and power loss parameters, as follows:
In the above,
In this study, the problem regarding the re-dispatching of generators is solved using an optimal power flow (OPF) calculation, and the objective function is the total fuel cost, as represented by the generator output active power (Chayakulkheeree, 2014; Shaheen et al., 2019).
In the above, FC denotes the total cost of the conventional generator connected to bus i,
The constraints of the OPF problem are the power-balance equation and variable limits.
Here,
In the above equation,
The clustering considering the random variable should be performed by aggregating the repeated results obtained from the power-flow-based clustering affected by the random PV output. To this end, we propose a probabilistic spectral clustering algorithm. This algorithm repeats the spectral clustering process described in the previous chapter (Figure 1) by reflecting the power flow determined from the power flow calculations considering the variable PV output. This algorithm is summarized as follows.
1) Employ test power system data for the probabilistic spectral clustering algorithm.
2) Determine the random PV output calculated through Eq. (20). The solar irradiance follows the beta distribution function; hence, the value of the PV output is randomly determined, changing the value of the power flow.
3) Calculate the power flow in the power system whilst considering the PV output as a negative load. The power flow may vary depending on the random PV output at each moment.
4) Apply each branch’s flow to the corresponding edge weight. In this study, the weight is based on the active power flow, and the value of the edge weight depends on the PV output.
5) Perform the spectral clustering shown in Figure 1. This process involves calculating the Laplacian matrix, spectral embedding, and hierarchical clustering.
6) Repeat Steps 2–5 N times (i.e., the maximum iteration number). The PV output varies at each iteration; hence, the clustering results from the test power system also vary.
7) Count the number of clusters in which each bus is included after the N iterations.
8) Assign buses to each cluster. In this process, non-neutral buses can be easily allocated, though some neutral buses are not. Hence, it is necessary to classify the neutral buses. This is described in the next section.
3.3 Neutral Buses and Classification
3.3.1 Definition of Neutral Buses
Under a probabilistic condition, the clustering result varies according to the variable generation source. This is because the change in PV generation affects the power flow in the power system. As a result, certain buses are grouped into clusters; however, it remains difficult to identify which buses are classified into which clusters. These buses can be referred to as neutral buses. The neutral buses can also be treated as having an almost equal probability of being assigned to each cluster. To define neutrality in this study, the distance between two points is used [i.e., from the most neutral case and from the counting number (in which each bus is grouped in each cluster) represented in the coordinates]. It is possible to identify which cluster has a high grouping probability for each bus by using the angle between the cases grouped into only one cluster and the coordinates of each case. Using these two elements, the neutrality index (NI) at each bus can be defined as follows:
In the above,
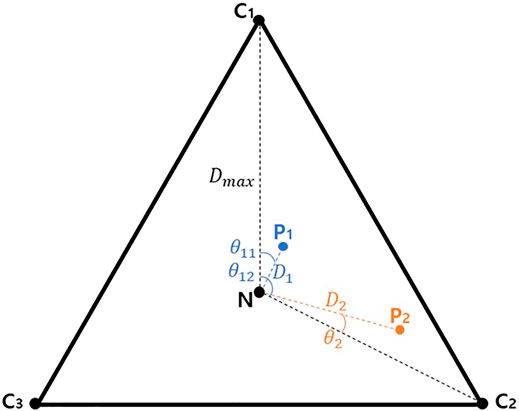
FIGURE 2. Graphical example of neutrality index (cluster number = 3).
For neutral buses with high NI values, a reclassification process and a verification process are required. These processes refer to the evaluation of a neutral bus using an index appropriate for the probabilistic environment, as described in the next section.
3.3.2 Classification and Reprocessing Based on Probabilistic Evaluation Index
To evaluate clustering results (as described in the previous section), we calculate the expansion [Eq. (14)] of each cluster and use their maximum (Eq. (15)) or average (Eq. (16)) expansion values. However, this method can only evaluate the results when clustering the power system in each iteration: it is impossible to evaluate the overall results of the probabilistic clustering (i.e., those reflecting the changing power flow with respect to the variable PV power output). Therefore, a novel method is needed to evaluate the clustering results whilst reflecting random renewable generation during iteration. This method can also be used to determine the clusters into which the neutral buses should be classified.
To evaluate the clustering results from N iterations, the representative index (based on expansion) must be determined in the evaluation. We can consider the maximum and average values of expansion as the index, as described in the previous section (Eq. 15 and Eq. 16). There are N iterations after setting the representative value at each iteration; hence, the probabilistic clustering quality should be evaluated using N data elements. In this study, we use the maximum value amongst the N representatives as a probabilistic clustering evaluation index to conservatively judge the clustering quality when the PV output drastically changes the power current in the system. Therefore, the indices for evaluating the probabilistic clustering results can be defined using the following two equations (with reference to Eq. 15 and Eq. 16):
Here,
The aforementioned index can be used to determine which cluster is the most appropriate for a neutral bus to be grouped into. To this end, the neutral buses are first relocated to each cluster, and the expansion values (which vary depending on the PV output) are aggregated. By calculating the probabilistic clustering evaluation index when placing the neutral buses in each cluster, we can determine in which cluster the value of the index is minimized when placing the neutral buses. At this time, the neutral buses can be classified into their corresponding clusters. That is, the neutral buses can be further classified using the mean index (
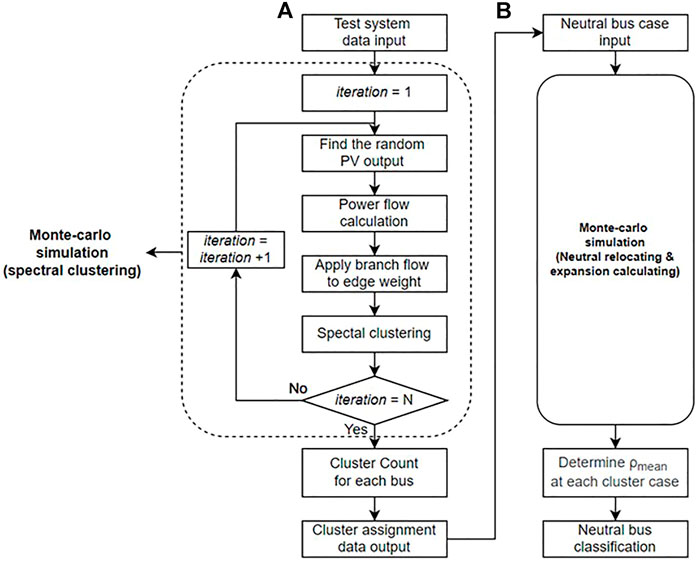
FIGURE 3. Proposed methodology. (A) Probabilistic spectral clustering algorithm. (B) Neutral bus classification.
4 Case Study
As described in this section, the proposed probabilistic spectral clustering algorithm and neutral bus classification were tested using an IEEE 118-bus test system (as shown in Figure 4). This system approximates the American Electric Power system and contains 19 generators, 35 synchronous condensers, 177 lines, nine transformers, and 91 loads. The total generator output and load consumption of the test system were 4,374.5 MW and 4,242.0 MW, respectively. To reflect the random outputs of PV generation, the PV models described in the previous section were connected to 20 buses in the power system as shown in Table 3. By varying the rating of the PV power to 42.42, 106.05, and 169.68 MW, we tested the probabilistic spectral clustering algorithm for system penetration levels of 20, 50, and 80%, respectively. A penetration level means the ratio of the sum of PV ratings to the total load. Depending on the output of the PV system, the outputs of the generators that were turned on were re-dispatched for the OPF calculations. All numerical calculations (e.g., the power flow calculations) were implemented using MATLAB software (Zimmerman and Murillo-Sanchez, 2020).
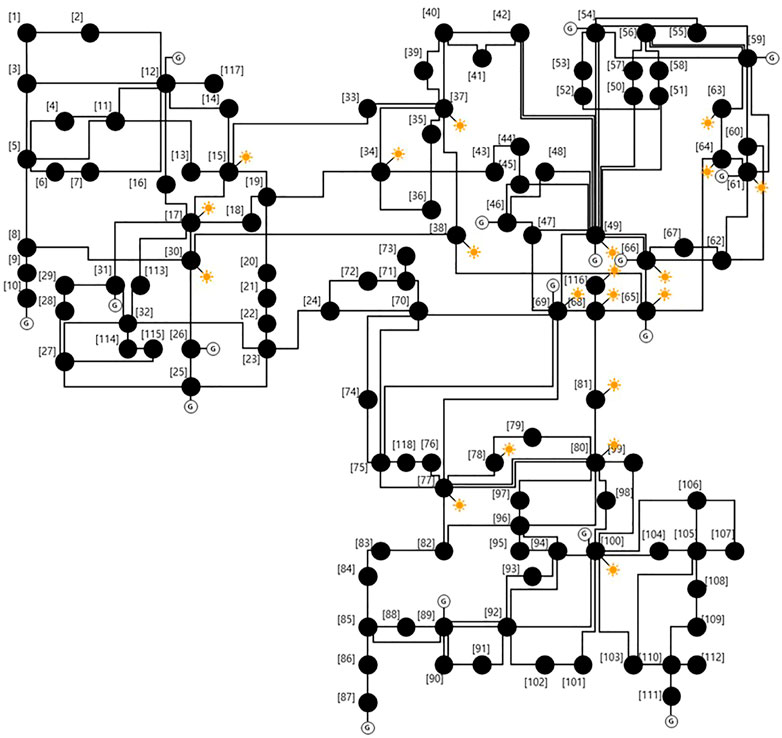
FIGURE 4. IEEE 118-bus system with photovoltaic (PV) integration.

TABLE 3. List of buses connected to PV model.
We first performed the proposed probabilistic spectral clustering (described in the previous section) based on the power flow Laplacian. Owing to the variable generation source (here, the PV source), the power flow in the test system differed for each iteration. Consequently, the coordinates of each bus differed for each iteration, producing different clustering results. In this simulation, the 118-bus system with PV integration was divided into three clusters. As shown in Table 4-1, Table 4-2, and Table 4-3, we observed the number of times each bus was partitioned into clusters during the 10,000 iterations. Referring to the tables, Figure 5 shows the graphs for the cluster counting number and the NI [Eq. (33)] for the 10 most neutral buses.
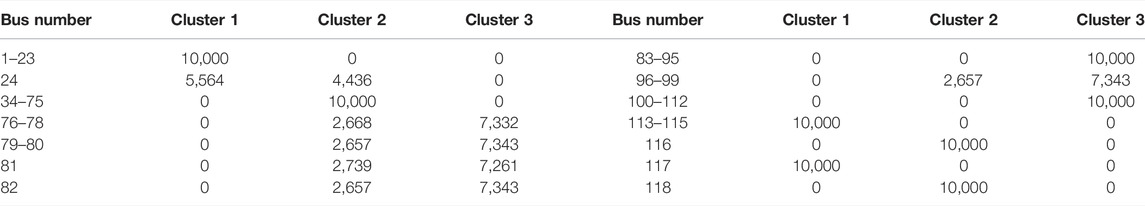
TABLE 4-1. Simulation results at 20% penetration level.
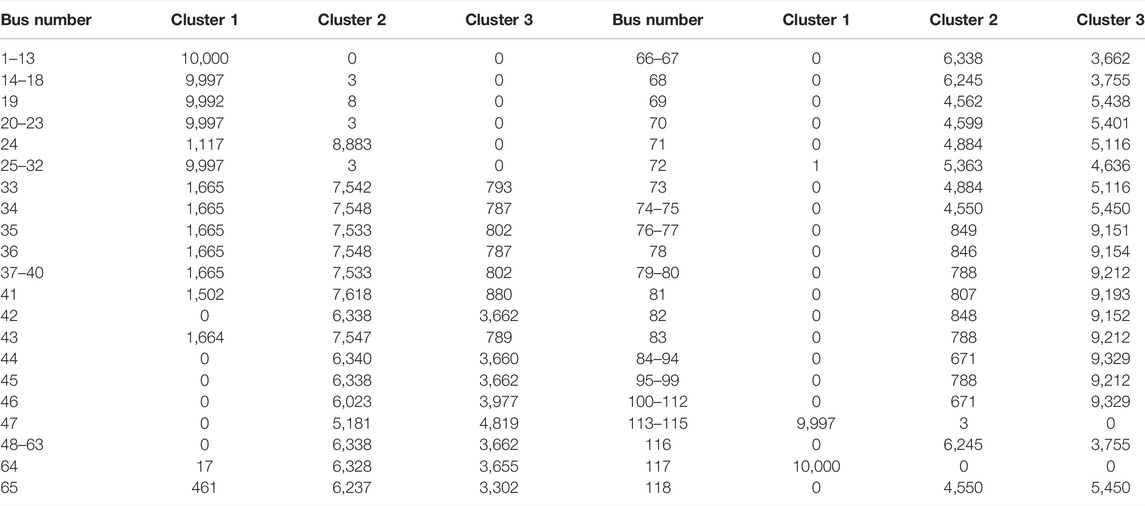
TABLE 4-2. Simulation results at 50% penetration level.
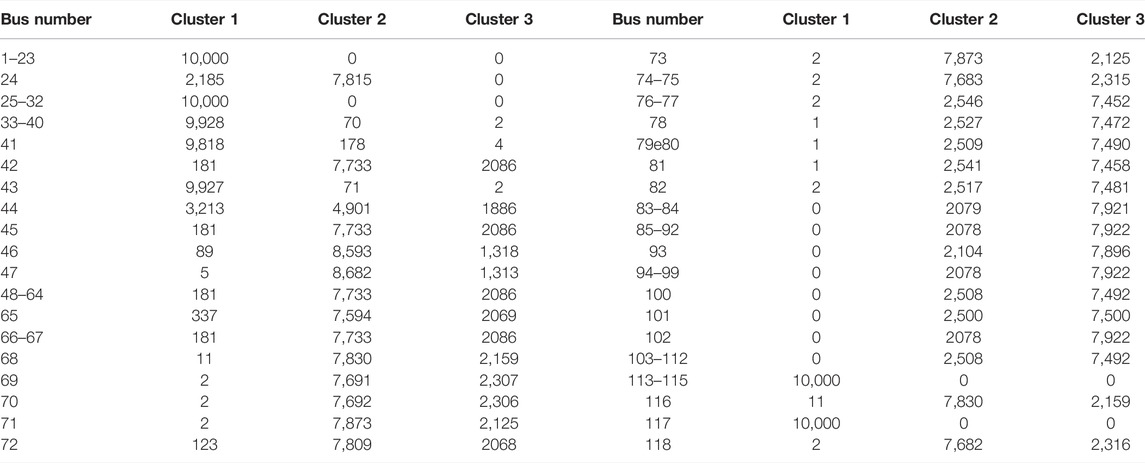
TABLE 4-3. Simulation results at 80% penetration level.
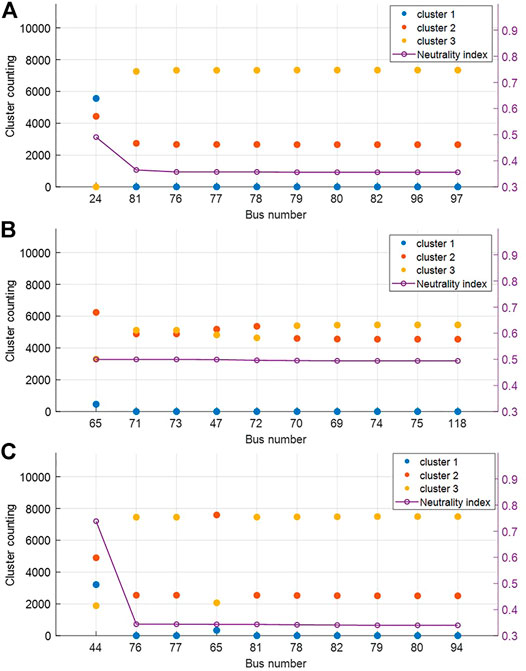
FIGURE 5. Simulation result at (A) 20%, (B) 50%, (C) 80% penetration level.
Each table summarizes the results from the probabilistic spectral clustering after 10,000 repetitions, and buses with the same counting number were grouped and displayed in ascending order. Therefore, when the count number was divided by 10,000, the probability of the buses belonging to each cluster could be calculated. This shows the number of times each bus is grouped into each cluster in the 118-bus system incorporating a variable PV power output.
From Table 4-1, it can be seen that certain buses can be reliably classified into each cluster; however, in the case of Bus 24, the counting numbers grouped into two clusters are similar; hence, it can be considered as a neutral bus. Furthermore, Figure 6 shows snapshots in which Bus 24 is grouped differently into Clusters 1 and 2 according to the variability of PV; here, the hierarchical structure of the buses (as analyzed by spectral clustering) is shown. The similarity of the buses varies owing to PV variability, which changes the cluster to which Bus 24 is assigned.
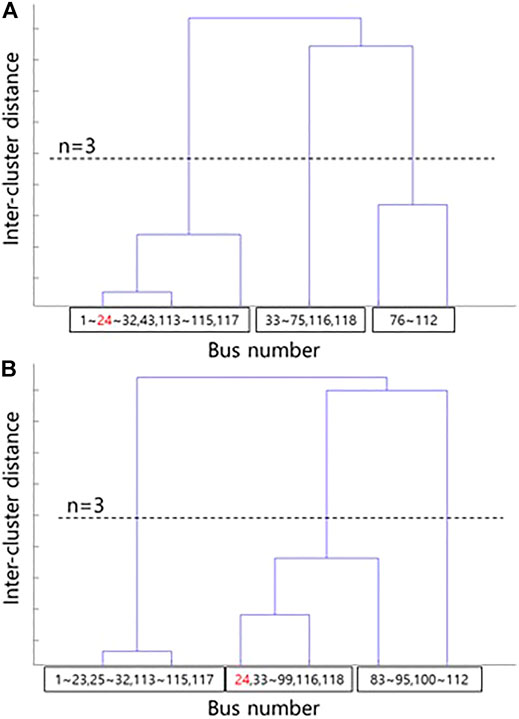
FIGURE 6. Hierarchical structure at 20% penetration level with respect to PV output. (A) Bus 24 belongs to Cluster 1. (B) Bus 24 belongs to Cluster 2.
Next, the counting numbers in which the buses are clearly classified in Table 4-1 decreased as shown in Table 4-2 to Table 4-3 furthermore, when the penetration level of PV sources increased, reliable clustering became more difficult. In particular, in the case of a 20% penetration level, Buses 44 and 65 were reliably clustered; however, when the penetration level increased to 50 and 80%, the buses become neutral and clustering them presented ambiguity.
The simulation results at each penetration level suggest that different neutral buses appear in each case. The most neutral buses for each case were obtained from the maximum NI. Accordingly, the NIs grouped into the clusters for the buses described in Figure 5 at each penetration level are summarized in Figure 7. Among the three clusters, the values of the maximum cluster probability and NIs for most neutral buses at each penetration level are listed in Table 5.
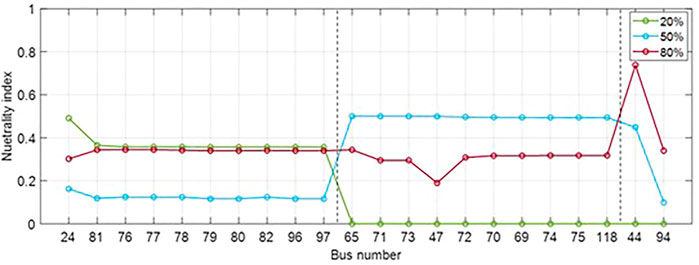
FIGURE 7. Neutrality index results at each penetration level.
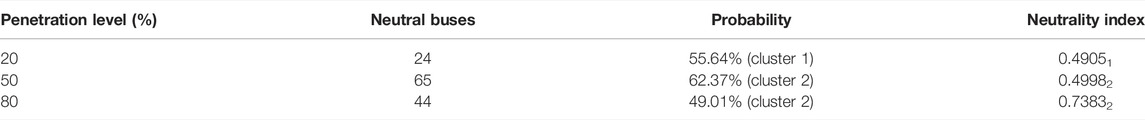
TABLE 5. Most neutral buses in each penetration level case.
As shown in Figure 7, the NIs for neutral buses varied according to the penetration level. In particular, when the penetration level increased, the NI value of the most neutral bus likewise increased. The result of the clustering was not ensured, owing to the variable power generation (e.g., with PV sources). In addition, in Table 5, by observing the number of buses exhibiting the maximum probability for each penetration level, we see that buses were most neutral at penetration levels of 20 and 80%. At a penetration level of 50%, the probability of the most neutral bus (Bus 65, which had the largest NI value) was not the smallest value. This is because the counting number of Bus 65 was grouped into Cluster 1, and the value of NI also increased.
At a penetration level of 20% or 80%, the probability of each bus being grouped into a specific cluster was less than or approximately equal to 50%. Furthermore, the higher the penetration level, the lower the probability. A low clustering probability does not guarantee that the buses grouped into a specific cluster represent the optimal clustering results. Therefore, when neutral buses are assigned to three clusters, it is necessary to determine which cluster is most appropriate for grouping, by considering the variable PV power output. To this end, the expansion-based evaluation process described in Figure 3 is required. In this example, the classification process was applied to Buses 24, 65, and 44, and the index
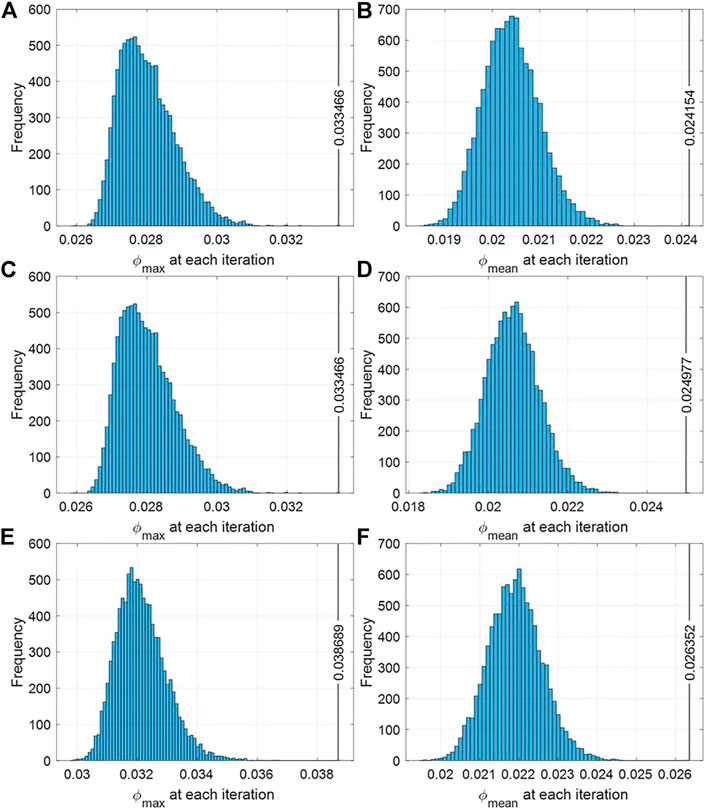
FIGURE 8. Histogram of probabilistic clustering evaluation indices for each cluster at a 20% penetration level. (A–C)
Neutral bus classification is the process of obtaining the expansion value for each cluster when placing neutral buses into Clusters 1–3 (for each penetration level) and repeating this process 10,000 times by considering the random output of the PV power. As a result, when each neutral bus was assigned to Clusters 1 and 2, the evaluation index value was minimized; that is, optimal clustering was achieved. Figure 8A and Figure 8B show the same histogram for the penetration level of 20% (shown in Figure 7). It can be seen that when
In the analysis results, the optimal cluster for each neutral bus was found to be the cluster with the highest probability in Table 5. The optimal cluster can be obtained using this value because the value of indicator i matches the cluster with the highest probability.
5 Discussion
In this simulation, when the penetration level increased, the probability that most buses were grouped into a specific cluster also decreased. Thus, as the penetration level of PV power increased, the clustering results changed more frequently, and the number of buses that were difficult to classify increased. The NI value for each bus also increased. Therefore, the most neutral buses can be found using the NI values, and such buses should be classified.
The most neutral buses for each penetration level can be organized as shown in Table 5. As a result, at penetration levels of 20 and 80%, the probability of an optimal cluster is low (∼50%), and the NI is high. This is because differences between the probabilistic evaluation index values for each cluster in Table 6 are very small; thus, each clustering result has a similar effect. For this reason, to obtain the most optimal case among similar clustering results, it is necessary to group the clusters with the highest clustering probability among the neutral buses, as well as to verify the results using the probabilistic clustering evaluation index.
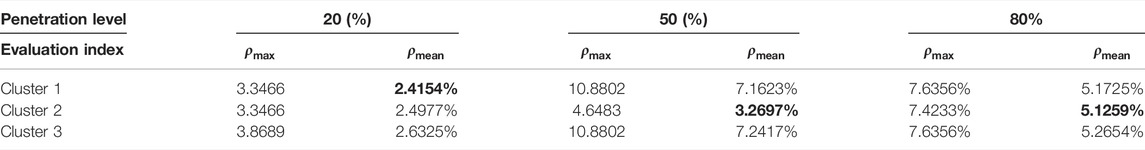
TABLE 6. Probabilistic clustering evaluation index in each penetration level case. The minimum value for the evaluation index ρmean. Since the cluster with the minimum ρmean is the optimal cluster, we emphasized this with bold fonts.
In the case of a penetration level of 50%, the NI value was high; however, the maximum probability was also high. When applying the neutral bus classification process in this case, the differences in the values of the probability evaluation index between Cluster 2 and other clusters were found to be large. Therefore, classification should be first performed on the most neutral buses (with the smallest maximum probability), before proceeding to the next-most neutral buses. Thus. buses will be grouped into clusters with the highest probability, similar to the results mentioned above.
6 Conclusion
This paper introduces a novel method for performing spectral clustering in power systems with variable sources (e.g., renewable energy sources). Because the output of a renewable energy source is variable, it is necessary to consider variable generation at every moment when clustering. To this end, we propose a probabilistic approach based on a widely adopted graph-theory-based spectral clustering method. The conventional spectral clustering method is limited in that it can only be used in power systems for which the power generation and load can be determined. To overcome this problem and reflect the effects of variable power sources, we developed the probabilistic spectral clustering method to group buses into clusters with the highest grouping probability. The results from the probabilistic clustering can be further optimized by classifying neutral buses. The proposed method was applied to an IEEE 118-bus system with PV integration to confirm the clustering results, which varied depending on the PV penetration level. In addition, the neutral buses for each case generated by the probabilistic spectral clustering method were classified to calculate the probabilistic evaluation index for each cluster and to verify which cluster yielded the optimal clustering.
This method can be applied to power system clustering under conditions of variable renewable energy sources, and it is expected to be implemented in power system planning and operation in the future for net-zero establishment. The probabilistic clustering methodology applied in this study synthesizes the expansion value, which depends on the variability of VRE, via the Monte Carlo procedure and identifies the optimal clustering point. This probabilistic analysis method can help determine an optimal operation plan in environments where the penetration of renewable energy is high. In particular, from the perspective of system planning and operation, improvements in system reliability and stability can be expected in environments with high renewable energy penetration. This can be achieved through the installation and control of high-voltage direct current across the interfaces between clusters determined using the probabilistic clustering methodology.
Data Availability Statement
The original contributions presented in the study are included in the article/Supplementary Material; further inquiries can be directed to the corresponding authors.
Author Contributions
JK put forward the main research points and mathematical analysis and wrote the manuscript. SK, JL, and SH conceived the idea and contributed to data interpretation. MY led the experiments. MY and GJ gave guidance on the study and wrote the manuscript.
Funding
This research was supported by the Basic Research Program through the National Research Foundation of Korea (NRF), funded by the MSIT (No. 2020R1A4A1019405), as well as a Korea Institute of Energy Technology Evaluation and Planning (KETEP) grant funded by the Korean Government (MOTIE) (No. 20191210301890).
Conflict of Interest
JL was employed by the company Korea Electric Power Corporation.
The remaining authors declare that the research was conducted in the absence of any commercial or financial relationships that could be construed as a potential conflict of interest.
Publisher’s Note
All claims expressed in this article are solely those of the authors and do not necessarily represent those of their affiliated organizations, or those of the publisher, the editors and the reviewers. Any product that may be evaluated in this article, or claim that may be made by its manufacturer, is not guaranteed or endorsed by the publisher.
References
Amini, M., Samet, H., Seifi, A. R., Al-Dhaifallah, M., and Ali, Z. M. (2020). An Effective Multi-Solution Approach for Power System Islanding. IEEE Access 8, 93200–93210. doi:10.1109/ACCESS.2020.2995085
Bialek, J. W., and Vahidinasab, V. (2022). Tree-partitioning as an Emergency Measure to Contain Cascading Line Failures. IEEE Trans. Power Syst. 37, 467–475. doi:10.1109/TPWRS.2021.3087601
Cao, D., Zhao, J., Hu, W., Ding, F., Huang, Q., Chen, Z., et al. (2021). Data-driven Multi-Agent Deep Reinforcement Learning for Distribution System Decentralized Voltage Control with High Penetration of PVs. IEEE Trans. Smart Grid 12, 4137–4150. doi:10.1109/TSG.2021.3072251
Cauz, M., Bloch, L., Rod, C., Perret, L., Ballif, C., and Wyrsch, N. (2020). Benefits of a Diversified Energy Mix for Islanded Systems. Front. Energy Res. 8, 147. doi:10.3389/fenrg.2020.00147
Chai, Y., Guo, L., Wang, C., Zhao, Z., Du, X., and Pan, J. (2018). Network Partition and Voltage Coordination Control for Distribution Networks with High Penetration of Distributed PV Units. IEEE Trans. Power Syst. 33, 3396–3407. doi:10.1109/TPWRS.2018.2813400
Chayakulkheeree, K. (2014). “Probabilistic Optimal Power Flow: An Alternative Solution for Emerging High Uncertain Power Systems,” in 2014 International Electrical Engineering Congress (iEECON), Pattaya, Thailand, March 19–21, 2014, 1–4. doi:10.1109/iEECON.2014.6925970
Cotilla-Sanchez, E., Hines, P. D. H., Barrows, C., Blumsack, S., and Patel, M. (2013). Multi-attribute Partitioning of Power Networks Based on Electrical Distance. IEEE Trans. Power Syst. 28, 4979–4987. doi:10.1109/TPWRS.2013.2263886
Holttinen, H., Groom, A., Kennedy, E., Woodfin, D., Barroso, L., Orths, A., et al. (2021). Variable Renewable Energy Integration: Status Around the World. IEEE Power Energy Mag. 19, 86–96. doi:10.1109/MPE.2021.3104156
Hung, D. Q., Mithulananthan, N., and Lee, K. Y. (2014). Determining PV Penetration for Distribution Systems with Time-Varying Load Models. IEEE Trans. Power Syst. 29, 3048–3057. doi:10.1109/TPWRS.2014.2314133
Lee, J. R., Gharan, S. O., and Trevisan, L. (2014). Multiway Spectral Partitioning and Higher-Order Cheeger Inequalities. J. ACM 61, 1–30. doi:10.1145/2665063
Leeuwen, T. v., and Moser, A. (2017). “Impact of Flexible Transmission Assets on Day-To-Day Transmission Grid Operation under Uncertainties,” in International ETG Congress 2017, Bonn, Germany, November 28–29, 2017, 1–6.
Li, Z., Cheng, Z., Si, J., Zhang, S., Dong, L., Li, S., et al. (2021). Adaptive Power Point Tracking Control of PV System for Primary Frequency Regulation of AC Microgrid with High PV Integration. IEEE Trans. Power Syst. 36, 3129–3141. doi:10.1109/TPWRS.2021.3049616
Lin, X., Shu, T., Tang, J., Ponci, F., Monti, A., and Li, W. (2022). Application of Joint Raw Moments-Based Probabilistic Power Flow Analysis for Hybrid AC/VSC-MTDC Power Systems. IEEE Trans. Power Syst. 37, 1399–1412. doi:10.1109/TPWRS.2021.3104664
Ma, D., Hu, X., Zhang, H., Sun, Q., and Xie, X. (2021). A Hierarchical Event Detection Method Based on Spectral Theory of Multidimensional Matrix for Power System. IEEE Trans. Syst. Man. Cybern. Syst. 51, 2173–2186. doi:10.1109/TSMC.2019.2931316
Park, Y., and Kim, J. (2006). A Survey on the Power System Modeling Using a Clustering Algorithm. Proc. KIEE Conf., 410–411.
Sanchez-Garcia, R. J., Fennelly, M., Norris, S., Wright, N., Niblo, G., Brodzki, J., et al. (2014). Hierarchical Spectral Clustering of Power Grids. IEEE Trans. Power Syst. 29, 2229–2237. doi:10.1109/TPWRS.2014.2306756
Sarajpoor, N., Rakai, L., Arteaga, J., and Zareipour, H. (2021). A Shape-Based Clustering Framework for Time Aggregation in the Presence of Variable Generation and Energy Storage. IEEE Open J. Power Energy 8, 448–459. doi:10.1109/OAJPE.2021.3097366
Sehsalar, O. Z., Galvani, S., and Farsadi, M. (2019). New Approach for the Probabilistic Power Flow of Distribution Systems Based on Data Clustering. IET Renew. Power Gener. 13, 2531–2540. doi:10.1049/iet-rpg.2018.6264
Shaheen, M. A. M., Hasanien, H. M., Mekhamer, S. F., and Talaat, H. E. A. (2019). Optimal Power Flow of Power Systems Including Distributed Generation Units Using Sunflower Optimization Algorithm. IEEE Access 7, 109289–109300. doi:10.1109/ACCESS.2019.2933489
Si, C., Xu, S., Wan, C., Chen, D., Cui, W., and Zhao, J. (2021). Electric Load Clustering in Smart Grid: Methodologies, Applications, and Future Trends. J. Mod. Power Syst. Clean. Energy 9, 237–252. doi:10.35833/MPCE.2020.000472
Teng, J.-H., Luan, S.-W., Lee, D.-J., and Huang, Y.-Q. (2013). Optimal Charging/discharging Scheduling of Battery Storage Systems for Distribution Systems Interconnected with Sizeable PV Generation Systems. IEEE Trans. Power Syst. 28, 1425–1433. doi:10.1109/TPWRS.2012.2230276
The International Renewable Energy Agency (2021). Available at: https://www.irena.org/Statistics/View-Data-by-Topic/Capacity-and-Generation/Statistics-Time-Series (Accessed March 22, 2022).
Tyuryukanov, I., Popov, M., van der Meijden, M. A. M. M., and Terzija, V. (2018). Discovering Clusters in Power Networks from Orthogonal Structure of Spectral Embedding. IEEE Trans. Power Syst. 33, 6441–6451. doi:10.1109/TPWRS.2018.2854962
von Luxburg, U. (2007). A Tutorial on Spectral Clustering. Stat. Comput. 17, 395–416. doi:10.1007/s11222-007-9033-z
von Luxburg, U., Belkin, M., and Bousquet, O. (2008). Consistency of Spectral Clustering. Ann. Stat. 36. doi:10.1214/009053607000000640
Wang, S., Su, H., and Zhang, Z. (2021). “Probabilistic Power Flow Calculation Considering the Correlation of Distributed Power Sources,” in 2021 IEEE International Conference on Advances in Electrical Engineering and Computer Applications (AEECA), Dialan, China, August 27–28, 2021, 53–58. doi:10.1109/AEECA52519.2021.9574164
Wiget, R., Vrakopoulou, M., and Andersson, G. (2014). “Probabilistic Security Constrained Optimal Power Flow for a Mixed HVAC and HVDC Grid with Stochastic Infeed,” in 2014 Power Systems Computation Conference, Wroclaw, Poland, August 18–22, 2014, 1–7. doi:10.1109/PSCC.2014.7038408
Zhu, X., Liu, C., Su, C., and Liu, J. (2020). Learning-based Probabilistic Power Flow Calculation Considering the Correlation Among Multiple Wind Farms. IEEE Access 8, 136782–136793. doi:10.1109/ACCESS.2020.3011511
Zimmerman, R. D., and Murillo-Sanchez, C. E. (2020). MATPOWER User’s Manual Version 7.1. Madison, WI: Power Systems Engineering Research Center.
Nomenclature
Abbreviations
PV Photovoltaic
VRE Variable renewable energy
Symbols
∂
Bkl Susceptance of the admittance Ykl
E Edge set
e Normalized coordinates of bus i
fbeta Beta probability density function
FC Total fuel cost
FF Fill factor
G Graph
Gkl Conductance of the admittance Ykl
ISC Short-circuit current
Kc Voltage temperature coefficients
Ki Current temperature coefficients
L Laplacian matrix
Ln Normalized Laplacian matrix
ng Total number of generator buses
NI Neutrality index
nl Total number of load buses
nPV Total number of PV buses
PGe Active power generation at generation bus i
Pinj,k Active power injected into bus k
PLj Active power consumption at load bus j
Ploss Power loss in the network
PPVk PV generation at PV bus k
Qinj,k Reactive power injected into bus k
s Random variable of solar irradiance
Ta Ambient temperature of PV cell
Tc Cell temperature of PV cell
Tn Nominal operating temperature of PV cell
v Eigenvector
V Vertex set
Voc Open-circuit voltage
xi Coordinates of bus i
Ykl Admittance of branch from buses from i to j
Keywords: hierarchical spectral clustering, electric power system, photovolataics, power system analysis, expansion
Citation: Kim J, Lee J, Kang S, Hwang S, Yoon M and Jang G (2022) Probabilistic Optimal Power Flow-Based Spectral Clustering Method Considering Variable Renewable Energy Sources. Front. Energy Res. 10:909611. doi: 10.3389/fenrg.2022.909611
Received: 31 March 2022; Accepted: 30 May 2022;
Published: 14 July 2022.
Edited by:
Xingpeng Li, University of Houston, United StatesReviewed by:
Maneesh Kumar, Yeshwantrao Chavan College of Engineering (YCCE), IndiaMartin P. Calasan, University of Montenegro, Montenegro
Copyright © 2022 Kim, Lee, Kang, Hwang, Yoon and Jang. This is an open-access article distributed under the terms of the Creative Commons Attribution License (CC BY). The use, distribution or reproduction in other forums is permitted, provided the original author(s) and the copyright owner(s) are credited and that the original publication in this journal is cited, in accordance with accepted academic practice. No use, distribution or reproduction is permitted which does not comply with these terms.
*Correspondence: Minhan Yoon, bXlvb25Aa3cuYWMua3I=; Gilsoo Jang, Z2phbmdAa29yZWEuYWMua3I=