 Muhammad Aslam
 Ali Hussein Al-Marshadi
- Department of Statistics, Faculty of Science, King Abdulaziz University, Jeddah, Saudi Arabia
The statistical tests under classical statistics can be only applied when the data is linear and has certain observations. The existing statistical tests cannot be applied for circular/angles data. In this paper, the Watson-Williams test under neutrosophic is introduced to analyze having uncertain, imprecise, and indeterminate circular/angles data. The neutrosophic test statistic is introduced and applied to wind direction data. From the real example and simulation study, it can be concluded the proposed neutrosophic Watson-Williams test performs better than the Watson-Williams test under classical statistics.
Introduction
In practice, the population parameters are unknown and estimated on the basis of sample information. The testing of a hypothesis is a procedure that is applied for testing the unknown parameters using sample information. The Z-test and t-test are very popular for testing the mean of unknown population parameters when the sample size is larger than 30 and less than 30, respectively. These traditional tests are used for linear data and cannot be applied for the angles/circular data. In many scientific areas such as wind directions, animal movement, ocean directions, radar data, and bone-fracture plane data are recorded in radians or degrees, see (Fisher, 1995). For the data recorded in radians or degrees, the traditional statistical tests can be applied for testing the mean of circular observations. Watson-Williams test is a popular test that is applied to test whether the mean angles of circular observations differ significantly or not. The test is applied under the assumption that the data follow the von Mises distribution with the same value of concentration parameter, see (Kanji, 2006). (Fitak and Johnsen, 2017), (Ruxton, 2017) and (Landler et al., 2018) used the statistical tests for circular biological data. (Landler et al., 2019) proposed the circular test for non-continue data. More information on tests for circular data can be seen in (Mulder and Klugkist, 2021).
According to (Farrugia and Micallef, 2006), “Wind is a vector quantity having both a magnitude and a three-dimensional direction. This would make wind a spherical variable. However, usually, only the horizontal component is considered. Thus, the wind is mainly treated as a circular variable with an associated magnitude”. The wind directional data is also analyzed using circular statistics. The decision-makers may be interested to test whether the mean wind direction on two edges is the same or different (Bowers et al., 2000) presented the statistical analysis for wind and waves data. (Farrugia and Micallef, 2006) presented the comparative analysis using the wind direction data. More applications of statistical tests for wind data can be seen in (Hassan et al., 2009), (Qin et al., 2010), (Heckenbergerova et al., 2015), (Arias-Rosales and Osorio-Gómez, 2018), (Katinas et al., 2018), (Min et al., 2019) and (Ul Haq et al., 2020).
The aforementioned statistical tests cannot be applied when the decision-makers are uncertain in sample size selection or imprecise circular data is recorded from the complex system. To deal with such data, the statistical tests using fuzzy logic can be helpful in making a decision about the unknown parameters. (Yang and Pan, 1997), (Chen et al., 2013), (Pewsey et al., 2013), (Kesemen et al., 2016), (Lubiano et al., 2016), (Benjamin et al., 2019) and (Pewsey and García-Portugués, 2020) presented various tests to analyze fuzzy data.
(Smarandache, 2014) introduced neutrosophic statistics (NS) to deal with the data having neutrosophic numbers. The neutrosophic statistics were found to be more efficient than classical statistics in terms of informative and flexibility, (Aslam, 2019a). The NS is found to be more efficient than classical statistics, see (Chen et al., 2017a) and (Chen et al., 2017b), (Aslam, 2019a), (Aslam, 2019b) and (Aslam, 2020). (Aslam, 2021) proposed the neutrosophic statistical test to analyze radar data (Khan et al., 2020). proposed variance chart under neutrosophic. More applications to deal with the neutrosophic numbers can be seen in (Ye, 2018), (Ye et al., 2018), (Pramanik and Banerjee, 2018), (Pramanik and Dey, 2018), (Mondal et al., 2018), (Pramanik and Dey, 2019), (Maiti et al., 2020) and (Mondal et al., 2021).
The Watson-Williams test cannot be applied when uncertainty is recorded in circular/angles data. By exploring the literature and to the best of our knowledge, no work on the Watson-Williams test under NS is found in the literature. In this paper, the neutrosophic Watson-Williams test will be introduced for the first time. The test statistic of the Watson-Williams test is introduced under NS. The testing of the hypothesis procedure will be given and applied using the wind direction data. It is expected that the proposed Watson-Williams test will perform better than in the existing test in uncertainty.
Design of the Proposed Test
Watson-Williams (W-W) test under classical statistics is applied for testing the average angles of two independent circular observations which are drawn from von Mises distribution having the same value of concentration parameter
The neutrosophic resultant vectors are defined as
For the combined neutrosophic sample, the components of the neutrosophic resultant vectors are given by
The length of the neutrosophic resultant vector is calculated as follows
The neutrosophic statistic to test the unknown neutrosophic mean angles are given by
where the first part denotes determinate parts and the second part denotes indeterminate parts and
The proposed test will be operated using the following steps
Step-1: state
Step-2: Set the level of significance
Step-3: Do not reject
The operational process of the N-W-W test is also shown in Figure 1.
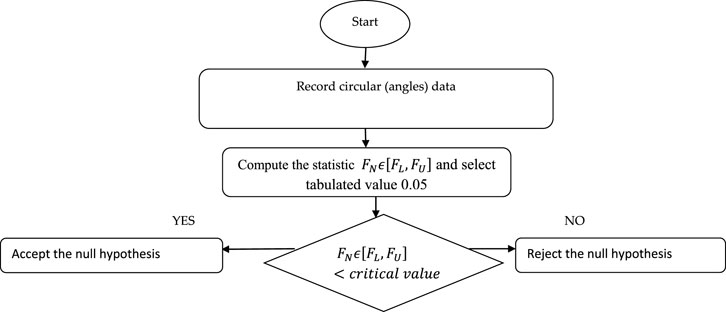
FIGURE 1. The procedure of the proposed N-W-W test.
Application Using Wind Directional Data
In this section, the application of the proposed N-W-W test will be given using the wind directional (angles) data recorded near Corls Ridge, Michaux State Forest. The data is reported from opposite sides of two ridges. The decision-makers are interested to test either angles of the two groups are the same vs. the alternative hypothesis that the angles of the two groups are different. Suppose that the decision-makers are uncertain about the first and the second sample size with the measure of indeterminacy
The neutrosophic resultant vectors for the real data are given as
For the combined neutrosophic sample, the components of the neutrosophic resultant vectors for the real data are given by
The length of the neutrosophic resultant vector for the real data is given by
The neutrosophic statistic is calculated as
where
The Proposed Test Will Be Operated Using the Following Steps
Step-1: state
Step-2: Set the level of significance
Step-3: Do not reject
From the study, it is concluded that both groups of wind directional data have the same mean angles.
Advantages of the Proposed N-W-W Test
The proposed N-W-W test under neutrosophic statistics is a generalization of the existing W-W test under classical statistics. The proposed N-W-W reduces to the existing W-W test when no uncertainty is recorded in the data. In this section, the efficiency of the proposed N-W-W test will be discussed in terms of the measure of indeterminacy, adequacy, information, and flexibility. To discuss the advantages, the neutrosophic statistic of the N-W-W test of real example is considered. The neutrosophic form of the test statistic is
Simulation Study
In this section, the effect of the measure of indeterminacy will be studied on the proposed N-W-W test. The various values of the indeterminacy parameter
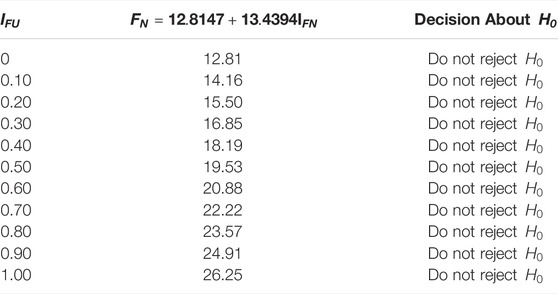
TABLE 1. The effect of indeterminacy on
From Table 1, it is clear that the values of statistic
Conclusion
In this paper, the Watson-Williams test under neutrosophic was introduced to analyze having uncertain, imprecise, and indeterminate circular/angles data. The proposed test was the extension of the existing Watson-Williams test under classical statistics. The neutrosophic statistic for the Watson-Williams test was introduced. The application using wind direction data, simulation, and comparative studies of the proposed Watson-Williams test was given. From these studies, it is concluded that the proposed test is more efficient than the existing Watson-Williams test in terms of flexibility, applicability, and information. The meteorologists can apply the proposed test for testing whether the angles of two wind groups have the same average or not. The proposed Watson-Williams test for big circular data can be studied as future research.
Data Availability Statement
The original contributions presented in the study are included in the article/Supplementary Material, further inquiries can be directed to the corresponding author.
Author Contributions
All authors listed have made a substantial, direct, and intellectual contribution to the work and approved it for publication.
Conflict of Interest
The authors declare that the research was conducted in the absence of any commercial or financial relationships that could be construed as a potential conflict of interest.
Publisher’s Note
All claims expressed in this article are solely those of the authors and do not necessarily represent those of their affiliated organizations, or those of the publisher, the editors and the reviewers. Any product that may be evaluated in this article, or claim that may be made by its manufacturer, is not guaranteed or endorsed by the publisher.
Acknowledgments
The authors are deeply thankful to the editor and reviewers for their valuable suggestions to improve the quality and presentation of the paper. The work was supported by Deanship of Scientific Research (DSR) at King Abdulaziz University, the authors, therefore, thanks the DSR for their financial and technical supports.
References
Arias-Rosales, A., and Osorio-Gómez, G. (2018). Wind Turbine Selection Method Based on the Statistical Analysis of Nominal Specifications for Estimating the Cost of Energy. Appl. Energ. 228, 980–998. doi:10.1016/j.apenergy.2018.06.103
Aslam, M. (2020). Design of the Bartlett and Hartley Tests for Homogeneity of Variances Under Indeterminacy Environment. J. Taibah Univ. Sci. 14 (1), 6–10. doi:10.1080/16583655.2019.1700675
Aslam, M. (2019a). Introducing Kolmogorov-Smirnov Tests Under Uncertainty: An Application to Radioactive Data. ACS Omega 5 (1), 914–917. doi:10.1021/acsomega.9b03940
Aslam, M. (2019b). Neutrosophic Analysis of Variance: Application to University Students. Complex Intell. Syst. 5 (4), 403–407. doi:10.1007/s40747-019-0107-2
Aslam, M. (2021). Radar Data Analysis in the Presence of Uncertainty. Eur. J. Remote Sensing 54 (1), 140–144. doi:10.1080/22797254.2021.1886597
Benjamin, J. B., Hussain, I., and Yang, M.-S. (2019). “Possiblistic C-Means Clustering on Directional Data,” in 2019 12th International Congress on Image and Signal Processing, BioMedical Engineering and Informatics (CISP-BMEI), Suzhou, China, 19-21 Oct. 2019.
Bowers, J. A., Morton, I. D., and Mould, G. I. (2000). Directional Statistics of the Wind and Waves. Appl. Ocean Res. 22 (1), 13–30. doi:10.1016/s0141-1187(99)00025-5
Chen, J., Ye, J., and Du, S. (2017a). Scale Effect and Anisotropy Analyzed for Neutrosophic Numbers of Rock Joint Roughness Coefficient Based on Neutrosophic Statistics. Symmetry 9 (10), 208. doi:10.3390/sym9100208
Chen, J., Ye, J., Du, S., and Yong, R. (2017b). Expressions of Rock Joint Roughness Coefficient Using Neutrosophic Interval Statistical Numbers. Symmetry 9 (7), 123. doi:10.3390/sym9070123
Chen, L., Singh, V. P., Guo, S., Fang, B., and Liu, P. (2013). A New Method for Identification of Flood Seasons Using Directional Statistics. Hydrological Sci. J. 58 (1), 28–40. doi:10.1080/02626667.2012.743661
Farrugia, P., and Micallef, A. (2006). Comparative Analysis of Estimators for Wind Direction Standard Deviation. Meteorol. Appl. A J. Forecast. Pract. Appl. Train. Tech. Model. 13 (1), 29–41. doi:10.1017/s1350482705001982
Fisher, N. I. (1995). Statistical Analysis of Circular Data. Cambridge University Press. doi:10.1017/CBO9780511564345
Fitak, R. R., and Johnsen, S. (2017). Bringing the Analysis of Animal Orientation Data Full Circle: Model-Based Approaches with Maximum Likelihood. J. Exp. Biol. 220 (21), 3878–3882. doi:10.1242/jeb.167056
Hassan, S. F., Hussin, A. G., and Zubairi, Y. Z. (2009). Analysis of Malaysian Wind Direction Data Using ORIANA. Mod. Appl. Sci. 3 (3), 115–119. doi:10.5539/mas.v3n3p115
Heckenbergerova, J., Musilek, P., and Krömer, P. (2015). “Optimization of Wind Direction Distribution Parameters Using Particle Swarm Optimization,” in Afro-European Conference for Industrial Advancement. Afro-European Conference for Industrial Advancement. doi:10.1007/978-3-319-13572-4_2
Katinas, V., Gecevicius, G., and Marciukaitis, M. (2018). An Investigation of Wind Power Density Distribution at Location with Low and High Wind Speeds Using Statistical Model. Appl. Energ. 218, 442–451. doi:10.1016/j.apenergy.2018.02.163
Kesemen, O., Tezel, Ö, and Özkul, E. (2016). Fuzzy C-Means Clustering Algorithm for Directional Data (FCM4DD). Expert Syst. Appl. 58, 76–82. doi:10.1016/j.eswa.2016.03.034
Khan, Z., Gulistan, M., Hashim, R., Yaqoob, N., and Chammam, W. (2020). Design of S-Control Chart for Neutrosophic Data: An Application to Manufacturing Industry. Ifs 38 (4), 4743–4751. doi:10.3233/jifs-191439
Landler, L., Ruxton, G. D., and Malkemper, E. P. (2018). Circular Data in Biology: Advice for Effectively Implementing Statistical Procedures. Behav. Ecol. Sociobiol. 72 (8), 128–210. doi:10.1007/s00265-018-2538-y
Landler, L., Ruxton, G. D., and Malkemper, E. P. (2019). Circular Statistics Meets Practical Limitations: A Simulation-Based Rao's Spacing Test for Non-Continuous Data. Mov. Ecol. 7 (1), 15. doi:10.1186/s40462-019-0160-x
Lubiano, M. A., Montenegro, M., Sinova, B., de la Rosa de Sáa, S., and Gil, M. Á. (2016). Hypothesis Testing for Means in Connection with Fuzzy Rating Scale-Based Data: Algorithms and Applications. Eur. J. Oper. Res. 251 (3), 918–929. doi:10.1016/j.ejor.2015.11.016
Maiti, I., Mandal, T., and Pramanik, S. (2020). Neutrosophic Goal Programming Strategy for Multi-Level Multi-Objective Linear Programming Problem. J. Ambient Intell. Hum. Comput. 11 (8), 3175–3186. doi:10.1007/s12652-019-01482-0
Min, Y., Chen, Y., and Yang, H. (2019). A Statistical Modeling Approach on the Performance Prediction of Indirect Evaporative Cooling Energy Recovery Systems. Appl. Energ. 255, 113832. doi:10.1016/j.apenergy.2019.113832
Mondal, K., Pramanik, S., and Giri, B. C. (2021). NN-TOPSIS Strategy for MADM in Neutrosophic Number Setting. Neutrosophic Sets Syst. 47, 66–92. http://fs.unm.edu/NSS2/index.php/111/article/view/1988.
Mondal, K., Pramanik, S., Giri, B., and Smarandache, F. (2018). NN-Harmonic Mean Aggregation Operators-Based MCGDM Strategy in a Neutrosophic Number Environment. Axioms 7 (1), 12. doi:10.3390/axioms7010012
Mulder, K. T., and Klugkist, I. (2021). Bayesian Tests for Circular Uniformity. J. Stat. Plann. Inference 211, 315–325. doi:10.1016/j.jspi.2020.06.002
Pewsey, A., and García-Portugués, E. (2020). Recent Advances in Directional Statistics. doi:10.48550/arXiv.2005.06889
Pewsey, A., Neuhäuser, M., and Ruxton, G. D. (2013). Circular Statistics in R. Oxford University Press.
Pramanik, S., and Banerjee, D. (2018). Neutrosophic Number Goal Programming for Multi-Objective Linear Programming Problem in Neutrosophic Number Environment: Infinite Study.
Pramanik, S., and Dey, P. P. (2018). Bi-Level Linear Programming Problem with Neutrosophic Numbers: Infinite Study.
Pramanik, S., and Dey, P. P. (2019). Multi-Level Linear Programming Problem with Neutrosophic Numbers: A Goal Programming Strategy: Infinite Study.
Qin, X., Zhang, J., and Yan, X. (2010). A New Circular Distribution and Its Application to Wind Data. J. Math. Res. 2 (3), 12. doi:10.5539/jmr.v2n3p12
Ruxton, G. D. (2017). Testing for Departure from Uniformity and Estimating Mean Direction for Circular Data. Biol. Lett. 13 (1), 20160756. doi:10.1098/rsbl.2016.0756
Ul Haq, M. A., Rao, G. S., Albassam, M., and Aslam, M. (2020). Marshall-Olkin Power Lomax Distribution for Modeling of Wind Speed Data. Energ. Rep. 6, 1118–1123. doi:10.1016/j.egyr.2020.04.033
Yang, M.-S., and Pan, J.-A. (1997). On Fuzzy Clustering of Directional Data. Fuzzy Sets Syst. 91 (3), 319–326. doi:10.1016/s0165-0114(96)00157-1
Ye, J., Cui, W., and Lu, Z. (2018). Neutrosophic Number Nonlinear Programming Problems and Their General Solution Methods Under Neutrosophic Number Environments. Axioms 7 (1), 13. doi:10.3390/axioms7010013
Keywords: watson-williams test, circular data, directional data, neutrosophic statistics, classical statistics
Citation: Aslam M and Al-Marshadi AH (2022) A New Test for Ridge Wind Directional Data Under Neutrosophic Statistics. Front. Energy Res. 10:890250. doi: 10.3389/fenrg.2022.890250
Received: 05 March 2022; Accepted: 17 March 2022;
Published: 24 May 2022.
Edited by:
Mohamed Mohamed, Umm Al-Qura University, Saudi ArabiaReviewed by:
Surapati Pramanik, Nandalal Ghosh B.T. College, IndiaFlorentin Smarandache, University of New Mexico, United States
Copyright © 2022 Aslam and Al-Marshadi. This is an open-access article distributed under the terms of the Creative Commons Attribution License (CC BY). The use, distribution or reproduction in other forums is permitted, provided the original author(s) and the copyright owner(s) are credited and that the original publication in this journal is cited, in accordance with accepted academic practice. No use, distribution or reproduction is permitted which does not comply with these terms.
*Correspondence: Muhammad Aslam, YXNsYW1fcmF2aWFuQGhvdG1haWwuY29t
†ORCID:Muhammad Aslamorcid.org/0000-0003-0644-1950