- 1Department of Electrical Engineering, Tsinghua University, Beijing, China
- 2State Grid Henan Electric Power Company, Zhengzhou, China
- 3State Grid Shandong Electric Power Research Institute, Jinan, China
In recent years, extreme natural disasters have occurred frequently, causing a huge impact on the power grid. In this paper, the method of purchasing and deployment of resources of the distribution network is studied to improve the resilience of the system from the perspective of pre-disaster defense. Considering the sequential game relationship among resource providers, utilities, and extreme disasters, this paper establishes a multi-stage extensive-form game model. To realize collaborative pre- and post-disaster defense of the system, this model comprehensively considers pre-disaster resource deployment, post-disaster reconfiguration and repair crew dispatch. The efficient deriving method of non-inferior solution is designed stage by stage, and the backward induction method is adopted to solve the overall game model efficiently. The experimental results under multiple failure scenarios show the proposed method can give a near-optimal pre-disaster resources purchase and deployment plan that takes into account the characteristics of post-disaster recovery, effectively reducing the expected power loss of the distribution system.
1 Introduction
In recent years, the load power loss of the distribution network (DN) caused by extreme weather has increased. In response to the major power outages caused by high-impact low-probability events, researches have been conducted mainly on two aspects: pre-disaster preparation and post-disaster restoration. Related studies show that remedy resources such as human resources and power supply resources can help to improve the resilience of the DN. Thus, optimal planning and deployment of such resources tend to be important, which may enhance the distribution system resilience with affordable costs.
From the perspective of pre-disaster resource allocation and system strengthening, the asset management of the power grid is studied in (Yeddanapudi et al., 2008) to seek the optimal resource allocation scheme on the basis of ensuring the power grid revenue. A pre-disaster allocation scheme of repair crew and power supply resources is proposed in (Wallnerström and Hilber, 2013) considering the cost to minimize the power grid vulnerability index. Considering uncertainties of failure scenarios, (Chang et al., 2020), established a two-stage model for pre-storm DER allocation problem. Its efficiency is guaranteed by implementing sample averageapproximation method and Benders decomposition. (Yuan et al., 2016). proposes a defender-attacker-defender sequential game model, which regards the pre-disaster line strengthening as the first stage of defense, the impact of disasters on the DN as the second stage of attack. The adjustment of power flow is regarded as the third stage of defense, which is used to solve the pre-disaster line strengthening strategies under the maximum disaster impact. A stochastic optimization model for resilience-oriented planning of mobile emergency generators is proposed in (Yuan et al., 2022), which can accelerate disaster recovery and enhance the resiliency of the DN effectively. A two-stage data-driven robust stochastic optimization model of electric buses preallocation is presented in (Li B. et al., 2021) where electric buses are regarded as large-capacity mobile batteries for emergency power supply.
In terms of post-disaster restoration, an island partition method is designed in (Bie et al., 2017) for post-disaster DNs. After the disaster occurs, the DN is divided into multiple islanded microgrids, and then remote control switches are controlled to perform network reconfiguration to support loads as much as possible. (Bian and Bie, 2018). uses multiple microgrids to improve the resilience of the DN. An energy management strategy is designed within the microgrid which controls energy exchange between microgrids. Considering limited power supply resources in microgrids, a Markov decision model is established in (Gao et al., 2016) to maximize the profit of the islanded microgrid within the expected outage duration by dynamic load shedding. Mobile energy supply vehicles are essential in improving the resilience of the DN, thus vehicle routing and scheduling strategies are proposed in (Lei et al., 2019a; Lei et al., 2019b). Coordinating with traditional restoration efforts, mobile energy supply vehicles enhance both survivability and recovery performance of the DN. To minimize customer intteruption cost, generation cost and mobile energy supply vehicles-related costs, (Yao et al., 2019), established a temporal-spatial model for transportation network and DN.
For loads that cannot be restored by network operations, repair crews should be deployed to repair failed branches to restore power supply. The impact of repair crew deployment on improvement of the resilience of the DN is studied in (Arif et al., 2020). The research divided crews into line repair crew and roadblock removal crew. A crew dispatch model is presented as a mixed-integer linear programming model that minimizes the power loss in the DN. When the estimated repair time of each faulty device is known and the control cost is considered, a MIP-based optimal repair strategy is proposed in (Arab et al., 2016) to minimize total power loss. To co-optimize the repair, reconfiguration and distributed generation dispatch, a two-stage method is proposed in (Arif et al., 2018b) considering equipment resources. In order to fully account for the uncertainty of repair time and demand, a two-stage stochastic mixed integer linear program is developed in (Arif et al., 2018a). A new decomposition approach, combined with the progressive hedging algorithm, is developed for solving large-scale outage management problems in an effective and timely manner. Further considering uncertainties such as the travel time of the repair team and DERs, a novel multistage co-optimization model is proposed in (Li J. et al., 2021) to seamlessly integrate the repair crew dispatch with the distribution system restoration.
It is noted that most of the existing studies improve the resilience of the DN from a single aspect, either by considering the purchase and allocation of power supply resources before a disaster, or by considering top-down repair and reconfiguration after a disaster. However, in DN restoration, adequate remedy resource preparation will contribute to a rapid and effective restoration after disasters, while optimal restoration measures after a disaster can help to reduce the cost of pre-disaster remedy resource purchase. In addition, interactions between pre-disaster and post-disaster resilience enhancement have not been fully considered in the optimal decision against disasters.
The pre-disaster deployment and post-disaster recovery process described earlier consists of disaster attack and network defense stages, thus the overall planning problem can be modeled as a defender-attacker-defender (DAD) model (Alguacil et al., 2014; Yuan et al., 2014). The DAD model includes two defense stages: pre-disaster defense and post-disaster restoration. Existing studies have shown that compared with pure pre-disaster defense or post-disaster restoration, the DAD model can better reduce system losses (Yao et al., 2007). The DAD model is often transformed into a trilevel optimization model. Although it can guarantee a certain degree of optimality, the efficiency is relatively low. Since in the DAD model, decision makers make decisions sequentially, the problem can also be modeled as an extensive-form game where players decide their actions sequentially. In this work, to enhance the resilience of the DN, we consider the extensive-form game relationship between grid managers, social emergency resource providers, and natural disasters. The contributions of this work are twofold:
1. An optimization model of pre-disaster resilience planning of DN based on DAD is established, which considers post-disaster restoration decisions. This model includes the pre-disaster resource allocation model, the post-disaster reconfiguration and repair crew dispatch model, and uses mixed strategies to describe the uncertainty of natural disasters. The model we proposed considers more measures of disaster prevention and post-disaster restoration, and can provide a pre-disaster defense plan that effectively reduces defense costs and post-disaster losses.
2. A set of efficient solution methods for the above optimization model is proposed. Firstly, the proposed model is transformed into an extensive-form game, and the backward induction method is used to solve it efficiently, which avoids the problem of low computational efficiency in multi-level optimization. Secondly, in the above game model, the post-disaster restoration strategy needs to be solved repeatedly, and the solution efficiency of this part becomes the performance bottleneck of the overall optimization. To this end, we propose a set of heuristic algorithms that can quickly generate reconfiguration and repair strategies, greatly improving the overall efficiency.
The proposed collaborative resilience planning strategy will be used to guide grid managers in pre-disaster resource preparation decisions and also give post-disaster restoration strategies in deterministic outage scenarios.
2 Model Formulation
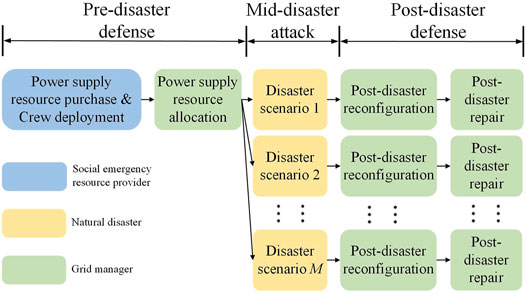
Before a disaster occurs, the grid manager needs to purchase emergency power supply resources from social emergency resource providers and equip repair crews. Then, the grid manager allocates emergency power supply resources to various parts of the grid for use in post-disaster emergency power supply. And then, when disaster strikes the DN, the DN is reconfigured to restore power to the blackout area. Finally, for areas where reconfiguration fails to restore, lines and devices need to be repaired to restore power to the blackout areas or areas with insufficient power supply capacity as soon as possible.
The time point for decision-making in this paper is before the disaster, but the pre-disaster resource purchase and allocations all take into account the impact of the post-disaster recovery process. Grid managers need to develop restoration strategies for multiple scenarios based on the representative disaster scenarios predicted before the disaster, get the grid losses for each scenario, and finally select the desired optimal emergency resource purchase, resource allocation and staffing strategies.
2.1 Overall Game Model
The time sequence of the decision of each game player is deterministic, and the decision at each stage will affect each other. As shown in Figure 1, the game players are the social emergency resource provider, the grid manager, and natural disasters. To reduce the difficulty of pre-disaster defense decision-making, the mixed strategy approach is adopted to deal with natural attacks.
The payoff of the power grid manager is the total cost and power loss of the entire DN in the process of responding to the disaster. The payoff of the social resource provider is the income obtained by the emergency resources provided to the power grid manager. It is designed according to the concept of zero-sum game with power grid managers.
2.2 Pre-disaster Defense Planning Model
The pre-disaster defense planning includes three strategies, namely 1) Power supply resource purchase, 2) Power supply resource allocation, 3) Repair crew deployment. Consider a radial DN containing N buses, and define the set of buses as
where x represents the total amount of power supply resources purchased (unit: kWh) and r is the number of repair crews deployed. d represents the allocation of power supply resources in DN, while Lb (d, r) is the post-disaster power loss when the system is equipped with r repair crews and the allocation of power supply resources is d.
The estimation of Lb (d, r) is a key procedure. Due to the uncertainty of natural disasters, power loss varies from scenario to scenario. For a particular scenario s, post-disaster power loss of the system is Ls (π; d, r) when taking π as the reconfiguration and repair strategy. The objective of reconfiguration and repair is to minimize the post-disaster power loss of DN, that is
where wi represents the weight of load at bus i, Pi is the power demand of load at bus i and T indicates the time for the entire system to be fully restored. δi,s,π(t; d, r) ∈ {0, 1} is the power supply state of load at bus i at time t under disaster scenario s when there are r repair crews scheduled and the configuration of power supply resources is d and the reconfiguration and repair strategy adopted is π. One means the load is out of power, while 0 means the load is powered normally.
In this paper, we adopt the idea of stochastic optimization, using the expected scenario power loss as an estimate of Lb (d, r). That is, the occurrence probability is naturally assigned to each possible disaster scenario, and grid managers need to solve for the expected pre-disaster optimal preparation scheme for all possible disaster scenarios, and this approach better reflects the average power loss in the DN:
The solution of the optimal post-disaster reconfiguration and repair strategy is a NP-hard problem, which is inefficient to solve, so a restoration plan is used as the optimal post-disaster reconfiguration and repair strategy:
where Π(s) represents the set of reconfiguration and repair strategies of disaster scenario s. At this point, the following equation is satisfied:
In order to improve the solution efficiency, the DN power loss after performing the restoration strategy can be used as an estimation of Lb (d, r):
The set of restoration strategies improves the solution efficiency of post-disaster restoration and provides a robust estimation of Lb (d, r) on the other hand, which can leave a certain degree of flexibility for post-disaster restoration.
2.3 Post-disaster Reconfiguration Model
For pre- and post-disaster co-optimization, the estimation of the post-disaster power loss of DN in a single disaster scenario is the key to the solution of the problem. Several studies (Guikema et al., 2010; Nateghi et al., 2011) have used data-driven and statistical methods for post-disaster power loss estimation (Guikema et al., 2010; Guikema et al., 2006), but such methods require a large amount of sample data, and on the other hand, it is difficult to obtain a general loss assessment model applicable to different DNs and different disaster scenarios. In addition, coupled with the bias of historical data caused by climate change and changes in the grid structure, the accuracy of the prediction results obtained using statistical methods is often insufficient. Therefore, we take an inferential calculation approach in this paper to directly calculate the post-disaster power loss of DNs under different restoration strategies.
The post-disaster restoration of DN can be divided into two stages: firstly, the DN is reconfigured to restore power supply to some of the loads rapidly followed by the need to dispatch repair crews for restoration for loads that still cannot be restored using reconfiguration, i.e., the reconfiguration and repair strategy π is divided into reconfiguration and repair:
where πrc represents the reconfiguration strategy and πrr is the repair strategy.
When a disaster strikes the DN, resulting in the failure of some lines in the DN, the set of failed branches in the DN after the disaster is defined as
After failures of branches, some of the loads in the system are disconnected from the substation, thus forming a set of islanded microgrids denoted as
The objective of the reconfiguration stage is to restore de-energized loads in the system as much as possible by controlling the switches after the allocation of emergency power supply resources. The first objective is to perform the reconfiguration to connect the de-energized loads to the DN feeders as much as possible to restore such loads directly:
The second objective is to form the largest possible islanded microgrid using reconfiguration, i.e., to minimize the number of islanded microgrids in the islanded microgrid set
2.4 Post-disaster Repair Model
Consider the repair process after the reconfiguration, suppose that there are r repair crews that need to repair
The set of fault points is denoted as
The transfer matrix
For the depot, its start and end repair time are zero by definition, i.e. tC,s = tC,e = 0. By now, the restoration time of each failed branch is obtained. If the branch corresponding to the fault point u is (i, j), the restoration time of the branch (i, j) is:
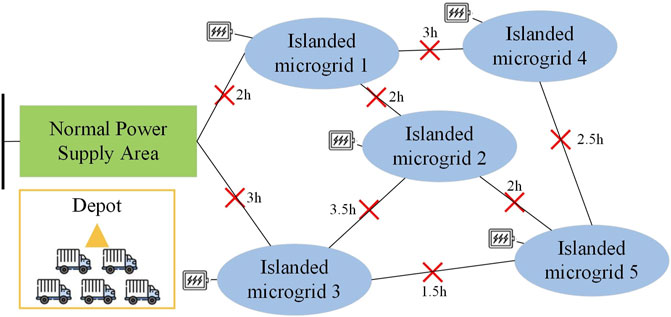
After obtaining the repair time of each faulty branch, the time of each islanded microgrid or load connection to the distribution feeder can be determined based on the topology of the system to calculate the post-disaster power loss, as shown in Figure 2. The solution method is: 1) For each islanded microgrid, depth-first search for all its supply paths to reach the normal power supply area. 2) Calculate the restoration time of a particular islanded microgrid of each supply path, i.e., the latest restoration time of all branches on the supply path. 3) The restoration time of the islanded microgrid is the earliest restoration time among all its power supply paths.
For an islanded microgrid Mm, if there are
where
The set of islanded microgrids is
where
3 Solution Methodology
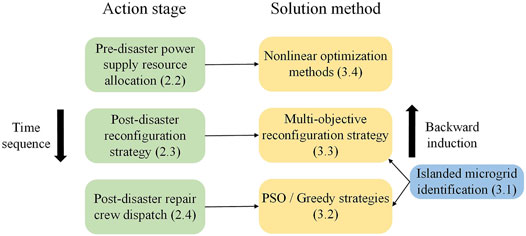
In this section, the islanded microgrid identification strategy is firstly introduced, which is a key aspect of the problem solution. Then, the optimal or near-optimal strategies are solved for each stage of the extensive-form game proposed in this paper using backward induction method. Backward induction starts to solve the proposed game model from the final stages, where the decision maker at each stage chooses the optimal strategy until the initial stage is reached. Therefore, this section presents the solution methods in order from the back of the stage to the front. Figure 3 shows the corresponding relationship between models and solution methods.
3.1 Islanded Microgrid Identification
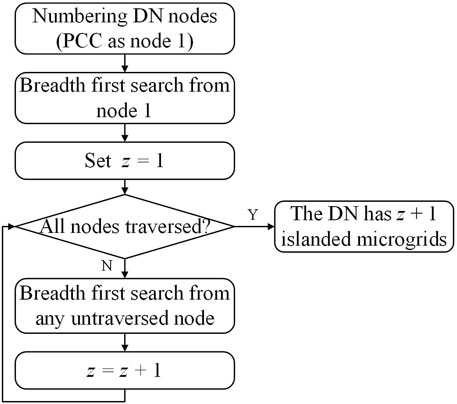
The identification of islanded microgrids in the DN is the basis for the subsequent work in the reconfiguration of the DN, the repair of failed lines, the calculation of load supply status, etc. The DN is modeled as a graph, the nodes of the graph are the buses of the DN, and the edges of the graph are the branches. Then the problem of identifying the islanded microgrid is as follows: given an undirected graph and all the edges in it, determine whether the graph is a connected graph, and calculate the number of connected graphs in the graph, each additionally connected graph in the graph is one more islanded microgrid in the DN.
In this paper, the solution idea is: start from any node in the graph, use breadth-first traversal to search for nodes. If all nodes in the graph can be traversed, then the graph is connected, i.e., there is no island microgrid. Otherwise, the untraversed nodes are randomly selected and searched again by breadth-first traversal until all nodes in the graph are traversed. The total number of connected graphs in the graph is obtained by counting the number of traversals. Figure 4 shows the flow chart of the algorithm. After the graph connectivity identification and the number of connected graphs is calculated, the connected graphs that do not contain any substation nodes (i.e., the root nodes of the DN) are islanded microgrids.
3.2 Post-disaster Repair Crew Dispatch Strategy Solution Method
In the previous section, the mTSP was used as the basis for modeling the post-disaster repair problem. TSP is a typical NP-hard problem, which is difficult to have an effective algorithm for an efficient solution. In this study, the post-disaster repair is located in the last stage of the game decision, which requires efficient solution performance. Therefore, a variety of preplanned repair strategies are manually designed to approximate the optimal repair solution as much as possible.
For a particular disaster scenario, the particle swarm algorithm can give a near-optimal solution to the mTSP. However, the efficiency of PSO is relatively low, especially when the number of particles increases, the number of particle dimensions increases or the number of iterations becomes larger. As the last stage of the game, the algorithm for post-disaster repair requires efficiency. Therefore, it is necessary to find a more efficient post-disaster repair algorithm.
Compared to algorithms such as PSO, which require exploration and iterative search of the entire strategy space, greedy algorithms can quickly obtain a satisfactory solution. Greedy algorithms make optimal choices based on the current situation without considering the overall status. Therefore, it saves a lot of time in exploring the entire space. This subsection uses greedy algorithms to design three preplanned repair strategies to improve the efficiency of the post-disaster solution while ensuring optimality as much as possible.
Distance-based greedy algorithm: r repair crews choose to repair the closest r fault points near the depot. After each repair crew has finished repairing, it will choose the nearest fault point that has not been repaired to repair until all the faults are fixed.
Effect-based greedy algorithm: First of all, we define the repair effect as the value of load restored by the system after a fault point is repaired. Generally speaking, after repairing a fault point, the corresponding faulty line is repaired and an islanded microgrid is connected to the distribution substation and the normal power supply is restored. If an islanded microgrid Mm is connected to the substation after a fault point is repaired, then the repair effect of this point is
Efficiency-based greedy algorithm: Based on the greedy algorithm based on repair effect, the concept of repair efficiency is introduced by further considering the elapsed time of repairing a fault point. For a certain repair crew, the repair time of a fault point is the sum of the road travel time and the repair time. If a fault point is repaired after the isolated microgrid Mm is connected to the DN feeder and the repair time of this point is Tr, then the repair efficiency of this fault point is
Generally speaking, no greedy algorithm can guarantee the satisfactory effect of emergency repair after a disaster. However, choosing the one with the highest effect among the three greedy algorithms can often achieve a satisfactory repair effect while maintaining high efficiency. In an outage scenario s, three sets of emergency repair strategy plans constitute Π(s).
3.3 Post-disaster Reconfiguration Strategy Solution Method
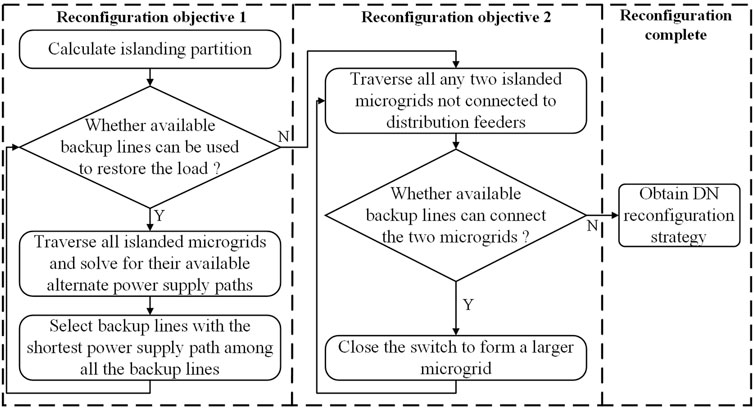
The reconfiguration strategy of the DN is shown in Figure 5. For reconfiguration objective 1: use reconfiguration to restore the power-loss load as much as possible, that is, by controlling the available backup lines in the system, changing the topology of the DN, and connecting the power-loss islanded microgrid to the DN substation as much as possible. The steps are:
(1–1): Calculate the DN islanding partition after the disaster, and identify the formed islanded microgrids.
(1–2): Determine whether there is an available backup line that can connect the islanded microgrid to the main feeder of the DN; if not, the reconfiguration cannot restore the power-loss load, and the reconfiguration objective 1 is completed; if so, go to step (1–3);
(1–3): Traverse all the islanded microgrids in the system and check whether there is an available backup line that can be restored. If so, select the backup line with the shortest power supply path from the main feeder of the DN to close, and restore the islanded microgrid;
(1–4): Return to step (1–2);
For reconfiguration objective 2: minimize the number of islanded microgrids concentrated in islanded microgrids, that is, after reconfiguration objective 1 is completed, connect each islanded microgrid as much as possible to form a large islanded microgrid. The steps are:
(2–1): Traverse all any two islanded microgrids that are not connected to DN substations;
(2–2): Check whether there is an available backup line that can connect the two islands and if so, close the switches of the corresponding backup lines to connect the two islands to form a larger islanded microgrid; if there is no backup line for merging islanded microgrids, the reconfiguration objective 2 is completed.
(2–3): Return to step (2–1).
3.4 Pre-disaster Resource Purchase and Allocation Solution Method
For a specific disaster scenario s, post-disaster reconfiguration and repair can be performed. Considering the disaster scenario set
where cx is the unit cost of power supply resources, cr is the unit cost of repair crews. This optimization problem is a standard nonlinear optimization problem, which can be solved by sequential quadratic programming or active-set algorithm.
4 Case Study
To test the performance of the solution at each stage, this part adopts the method from a single scenario to multiple scenarios and from reconfiguration and repair to the pre-disaster resource purchasing. This paper uses the standard IEEE 33-bus DN case to test the method and conducts numerical experiments on MATLAB 2018b.
Using the Batts typhoon model and the line vulnerability model given in (Panteli et al., 2017), several scenarios are randomly generated. The parameters of the DN are as follows. All load buses are divided into five important levels, and the losses caused by power outages are $1–5/h respectively. Each branch in the system corresponds to a fault repair time, which is a random number within 0–5 h; if a branch breaks in a disaster scenario, the repair time is a pre-generated random number. The travel time between each fault point in the system is a random number within 0–3 h generated randomly.
4.1 Post-disaster Reconfiguration and Repair Results in a Single Disaster Scenario
Consider a specific disaster outage scenario A, as shown in Figure 6. After the post-disaster DN reconfiguration, the obtained post-disaster DN is denoted as scenario B. Set bus 3, 20, and 31 in the DN as candidate nodes for resource allocation. In this single-scenario test, bus 3, 20, and 31 are configured with power supply resources of 1,000, 5,000, and 1,000 kWh, respectively, and the number of repair teams is 3.

FIGURE 6. Post-disaster outage scenarios (A): Scenario A, (B): Scenario B (Scenario A after reconfiguration).
Firstly, the analysis of DN reconfiguration operation is carried out. In scenario A, the system cannot directly restore the load through reconfiguration, that is, there is no closing operation of the normally open switch under reconfiguration objective 1. Considering reconfiguration objective 2, the seven islanded microgrids in scenario A can be partially merged, and three island microgrids can be formed by closing the switches on branch 25–29, 8–21, and 12–22.
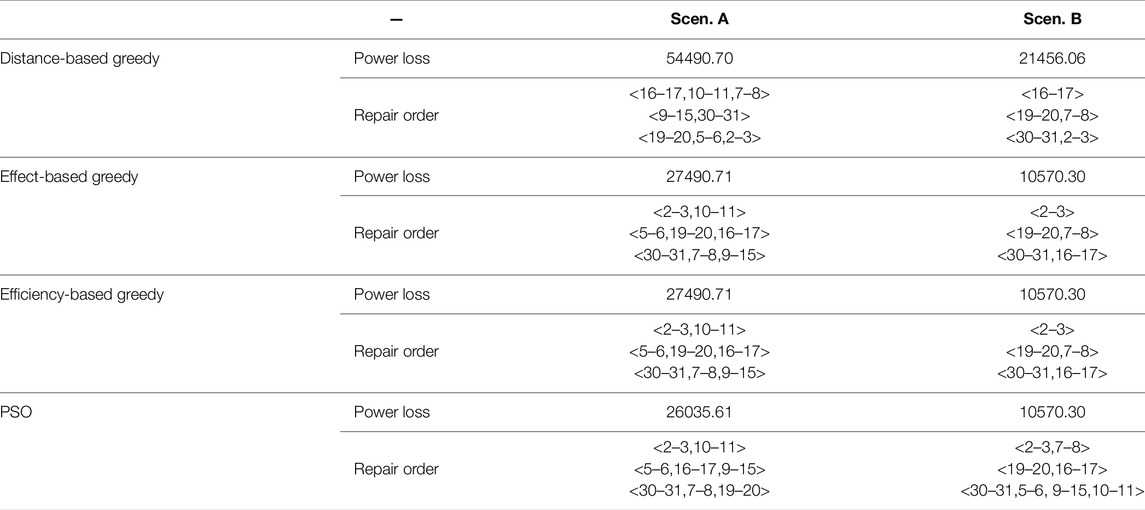
Then, considering the repair measures in the outage scenarios A and B, respectively, the particle swarm algorithm and three greedy algorithms are used for post-disaster repair, and the results are shown in Table 1. It can be seen that after the reconfiguration, the power loss of the system after the disaster is greatly reduced. This shows the effectiveness of post-disaster reconfiguration. On the other hand, since the reconfiguration strategies in scenario A are all operations for reconfiguration objective 2, it also shows the necessity of reconfiguration objective 2. When reconfiguration objective 2 exists, since the system forms an island microgrid as large as possible, it is possible to restore the load in a larger area with fewer repairs during the repair process, and at the same time, it also expands the range of electrical load power supply that power supply resources provide.
In addition, the analysis of several post-disaster repair strategies is carried out. It can be seen from Table 1 that the PSO can obtain the smallest post-disaster power loss in scenario A, and the PSO and the greedy algorithm based on repair effect and repair efficiency in scenario B can obtain the optimal post-disaster loss. The repair order in the table represents the respective repair order of the three emergency repair crews. In scenario B, only five faulty lines are listed in the emergency repair lines of several greedy algorithms. This is because both ends of some faulty lines are connected to the same islanded microgrid after the system reconfiguration, and repair of such lines will not give any extra power restoration, so such faulty lines are excluded from the repair calculation to improve the solution efficiency.
At the same time, it can be found that in scenario B, although the PSO and the greedy algorithm based on the repair effect and repair efficiency can all obtain the same power loss after the disaster, the repair order of the faulty lines is different. This is because in scenario B, when the faulty branches 2–3, 19–20, and 30–31 are repaired, the system will be restored to power, and subsequent branch repair operations will have no effect on the power loss of the system after a disaster. In the three schemes, three repair crews were dispatched to the three faulty branches 2–3, 19–20, and 30–31 at first. Therefore, the restoration process of the system under the three schemes is completely the same, so the post-disaster losses are the same.
In addition, although the post-disaster loss obtained by PSO is the best among several repair strategies, the effects of several greedy algorithms are always quite close to PSO. Considering that in the post-disaster repair calculation of scenarios A and B, PSO takes about 1 min to solve a single time, while the solution time of several greedy algorithms is on the order of 10–2 s, that is, the artificially designed plan can greatly improve the efficiency of the solution. If there is a plan among several artificially designed repair strategies that can approach the repair effect obtained by PSO, it is possible to consider using artificially designed repair strategies to replace PSO and perform upper-level resource allocation and purchase calculations.
4.2 Post-disaster Reconfiguration and Repair Results in Multiple Scenarios
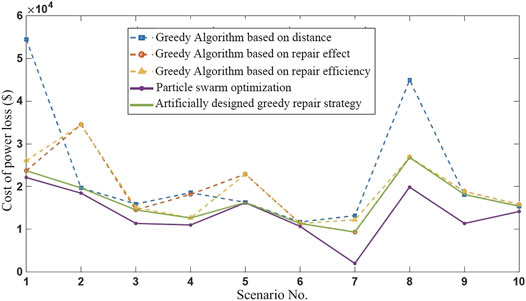
Consider the comparison of emergency repair effects of several post-disaster repair crew dispatch algorithms. 10 disaster scenarios are randomly generated, and each scenario has a randomly generated resource allocation status. Three greedy repair strategies and PSO are used to solve the post-disaster repair, as shown in Figure 7.
It can be seen that in the 10 scenarios, PSO obtained the smallest power loss after the disaster. At the same time, the optimal repair effect among the three greedy post-disaster repair algorithms can closely approach the repair effect of PSO. Considering that the artificially designed repair strategy has high solution efficiency and good solution effect, it is used instead of PSO to solve problems such as upper-level resource allocation.
4.3 Pre-disaster Defense Planning Result in a Single Scenario
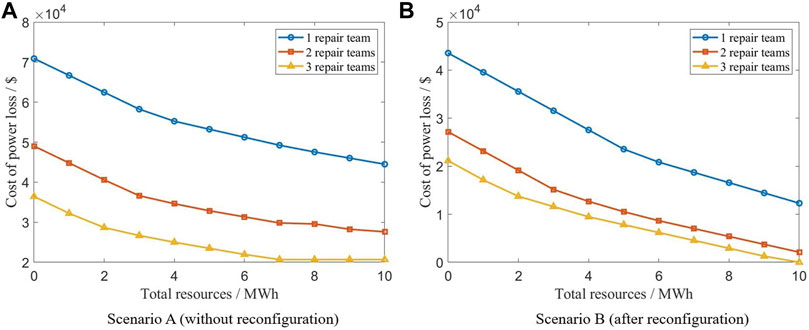
In disaster scenario A, after reconfiguration, the scenario is first converted to scenario B. The greedy repair strategy is selected as the execution strategy for post-disaster repair. This subsection considers solving the optimal allocation of resources before the disaster. Consider the post-disaster power loss when the power supply resources are between 0 and 10 MWh and the number of repair crews is between 1 and 3. The power supply resources are changed at intervals of 1 MWh.
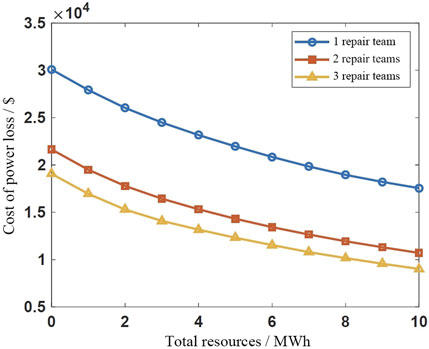
As shown in Figure 8A,B, after taking reconfiguration measures, the power loss can be significantly reduced. Compared with simply increasing resources, reconfiguration has a better loss reduction effect, which proves that considering post-disaster decision-making can reduce redundancy in pre-disaster resource deployment.
In Figure 8, with the increase of the total amount of system power supply resources, the power loss of the system after the disaster will be reduced; at the same time, the increase in the number of repair crews can effectively help reduce the power loss after the disaster. In addition, the total amount of power supply resources and the number of repair crews have the effect of diminishing marginal revenues. As the total amount of power supply resources increases, that is, the number of repair crews increases, the reduction rate of post-disaster losses will correspondingly decrease.
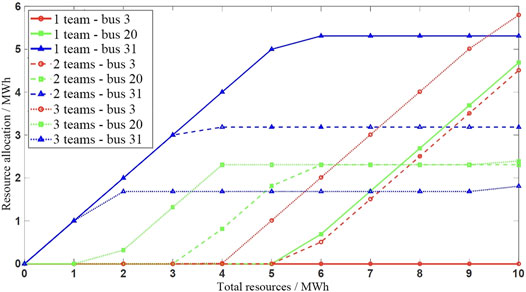
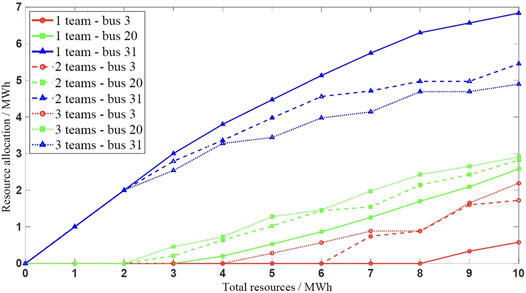
Figure 9 shows the optimal resource allocation scheme obtained under different total power supply resources and the number of repair crews in scenario B. As shown in Figure 9, there are two overall trends in the optimal resource allocation of the system: 1) Downstream buses tend to get more resources allocated; 2) The increase in the number of repair crews helps to reduce the variance of each resource allocation bus.
For trend (1), it can be seen that bus 31 located downstream of the system tends to get more resource allocation. The reasons are as follows. The time for the downstream bus to restore power supply is generally later than that of the upstream bus. Allocating more power supply resources to it can help it maintain a longer power supply when the power is lost and reduce the power loss. According to trend (2), it can be seen that with the increase in the number of repair crews, the resource allocation of downstream buses that originally allocated more resources gradually decreased, and the resources allocated to upstream buses that originally allocated fewer resources gradually increased. The variance of the resource allocation has a decreasing trend. The reasons are as follows. When the number of repair crews increases, multiple repair crews can be assigned to different upstream and downstream buses to carry out repairs at the same time, so the time for the upstream and downstream buses to restore power supply will be closer, and the downstream nodes do not need extra power supply resources.
4.4 Pre-disaster Resource Purchase and Repair Crew Planning Result for Multiple Scenarios
A single disaster scenario is often difficult to accurately reflect the impact of the disaster, so it is necessary to evaluate multiple disaster scenarios to find the optimal resource purchase and repair crew planning before the disaster. 100 disaster scenarios are generated, that is, the size of the scenario set
For these 100 disaster scenarios, post-disaster reconfiguration, and the optimal repair strategy of the greedy repair strategy set under the given resource and repair crew planning are solved. On a machine configured with Intel Xeon CPU, using MATLAB 2018b to solve the pre-disaster and post-disaster collaborative optimization in these 100 scenarios, it took 14498.89 s.
As shown in Figure 10, the two trends in resource allocation mentioned in the previous subsection are more pronounced under multiple disaster scenarios. This also shows that when performing resource allocation of the DN, more resources should be appropriately allocated to the candidate buses for resource allocation downstream of the DN.
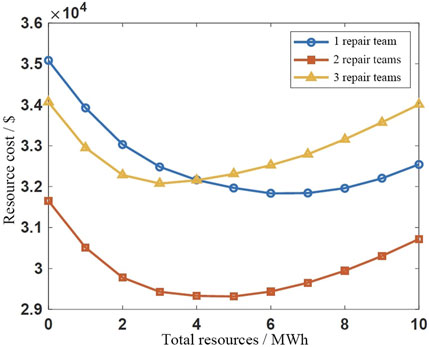
Considering the cost of resource purchase and repair crew planning, the unit price cx of power supply resources is set to 1$/kWh, and the unit price cr of the repair crew is set to 5000$per repair crew. The optimal resource purchase and repair crew planning solution under 100 scenarios is carried out, and the results are shown in Figures 11, 12.
In multiple disaster scenarios, the total amount of system power supply resources and the number of emergency repair crews still have the effect of diminishing marginal revenues. On the premise of considering the cost, this shows that the pre-disaster resource preparation is not the better with more resources and repair crews. It is necessary to balance the cost and the repair effect.
The optimal resource purchase amount in 100 disaster scenarios is 4 MWh, and the number of repair crews configured is 2. In addition, it is found that there is a trade-off relationship between the optimal resource purchase amount and the configuration of the number of repair crews. As the number of repair crews increases, the optimal resource purchase amount will decrease accordingly. For example, with 1, 2, and 3 repair crews, the optimal resource purchases are 6, 4, and 3 MWh, respectively. This shows that grid managers need to make reasonable choices in power supply resources and repair crew planning when funds are limited.
Therefore, under the 100 disaster scenarios, the optimal pre-disaster resource purchase and repair crew planning scheme is as follows: the system manager can purchase 4 MWh power supply resources and deploy two repair crews. The optimal allocation scheme is equipping bus 3, 20 and 21 with 0, 0.635 and 3.365 MWh resources respectively. After a disaster, the system can use the post-disaster reconfiguration and repair strategy proposed in this paper to implement the optimal post-disaster restoration in a specific scenario according to the actual disaster.
4.5 Pre-disaster Resource Purchase Game Results in Multi-Disaster Scenarios
In the case of multi-disaster scenarios, the resource purchase decision of the grid manager is given when the resource price of the resource provider is fixed. From the perspective of economics, rational people consider marginal benefits, and when resource pricing is variable, resource purchasing and selling decisions will change. Therefore, this subsection presents the pre-disaster resource purchase game results in the multi-disaster scenario from the perspective of marginal revenue.
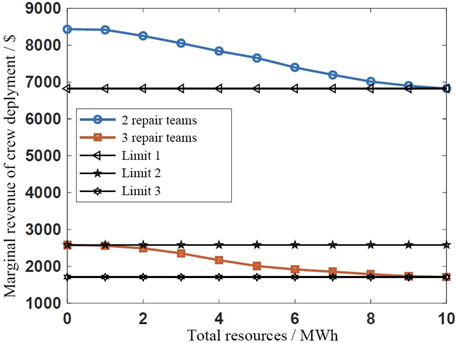
First, consider the deployment strategy of the number of repair crews. As shown in Figure 13, the marginal revenue of deploying the second repair crew is above $6823, so when the cost of deploying the second repair crew is below $6823, it is reasonable to deploy it. In the same way, the marginal revenue of deploying the third repair crew is between $1711–2585. When the cost of deploying the third repair crew is more than $2585, it is not cost-effective to deploy three repair crews. From the perspective of marginal revenue, it is also verified that in the previous subsection, when the unit price of the team is $5000, it is optimal to deploy two repair crews.
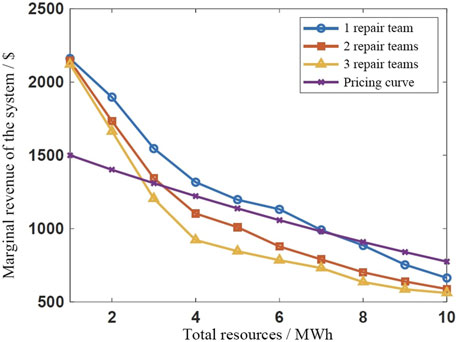
Secondly, consider the purchase strategy of the power supply resources. As shown in Figure 14, with the increase of the total amount of resources purchased by the grid manager, its marginal revenue decreases, and the speed of marginal revenue decreases when different repair crews are deployed. If the resource pricing curve is known, the optimal system resource purchase amount can be found by finding the intersection of the resource pricing curve and the marginal revenue curve. Resource purchase is cost-effective only when the marginal revenue is greater than the resource price. If two emergency repair crews are deployed, as shown in Figure 14, the intersection of the resource pricing curve and the system marginal revenue curve is between 3 and 4, then the optimal purchase amount of power supply resources for the system is 3 or 4 MWh. After the resource purchase amount is determined, the resource allocation curve shown in Figure 10 can be used to determine the allocation scheme of power supply resources in the system.
5 Conclusion
This paper builds an extensive-form game model for pre-disaster resilience planning considering post-disaster decision-making of DNs, which comprehensively considers pre-disaster resource purchase, resource allocation, repair crew deployment, post-disaster DN reconfiguration and fault repair. A post-disaster reconfiguration scheme of the DN with two objectives is proposed, a multi-traveling salesman problem model for post-disaster repair crew dispatch is constructed, and a PSO-based repair strategy and three greedy repair strategies are designed to improve the efficiency of solving post-disaster repair strategies. In the pre-disaster prevention stage, considering the impact of post-disaster restoration methods on the pre-disaster planning, the ideology of mixed strategy in strategic game is used to deal with the uncertainties of natural disasters and reduce the difficulty of pre-disaster optimization. The backward induction method is used to solve the extensive-form game model stage by stage, and the coordinated optimization and restoration scheme of the DN under deterministic disaster scenarios is obtained. The proposed model is tested on the IEEE 33-bus case, and the near-optimal pre-disaster power supply resource purchase and repair crew deployment plan are given, which can effectively reduce the resource preparation cost and loss of power loss.
Data Availability Statement
The original contributions presented in the study are included in the article/supplementary material, further inquiries can be directed to the corresponding author.
Author Contributions
YC and HN contributed to conception and design of the study. ZJ, NZ, and HN performed the case study. YY organized the paper structure and wrote the manuscript. ZJ and NZ contributed to manuscript revision and read.
Funding
This work was supported by Science and Technology Project of State Grid Corporation of China (5100-202155295A-0-0-00): “Research on power system security defense and resilience improvement technology to deal with high proportion of new energy access”.
Conflict of Interest
Author HN was employed by the company State Grid Henan Electric Power Company. Author ZJ and NZ was employed by the State Grid Shandong Electric Power Research Institute.
The remaining authors declare that the research was conducted in the absence of any commercial or financial relationships that could be construed as a potential conflict of interest.
The authors declare that this study received funding from Science and Technology Project of State Grid Corporation of China (5100-202155295A-0-0-00): “Research on power system security defense and resilience improvement technology to deal with high proportion of new energy access”. The funder was not involved in the study design, collection, analysis, interpretation of data, the writing of this article or the decision to submit it for publication.
Publisher’s Note
All claims expressed in this article are solely those of the authors and do not necessarily represent those of their affiliated organizations, or those of the publisher, the editors and the reviewers. Any product that may be evaluated in this article, or claim that may be made by its manufacturer, is not guaranteed or endorsed by the publisher.
References
Alguacil, N., Delgadillo, A., and Arroyo, J. M. (2014). A Trilevel Programming Approach for Electric Grid Defense Planning. Comput. Operations Res. 41, 282–290. doi:10.1016/j.cor.2013.06.009
Arab, A., Khodaei, A., Khator, S. K., and Han, Z. (2016). Electric Power Grid Restoration Considering Disaster Economics. IEEE Access 4, 639–649. doi:10.1109/ACCESS.2016.2523545
Arif, A., Ma, S., Wang, Z., Wang, J., Ryan, S. M., and Chen, C. (2018a). Optimizing Service Restoration in Distribution Systems With Uncertain Repair Time and Demand. IEEE Trans. Power Syst. 33, 6828–6838. doi:10.1109/TPWRS.2018.2855102
Arif, A., Wang, Z., Wang, J., and Chen, C. (2018b). Power Distribution System Outage Management With Co-Optimization of Repairs, Reconfiguration, and DG Dispatch. IEEE Trans. Smart Grid 9, 4109–4118. doi:10.1109/TSG.2017.2650917
Arif, A., Wang, Z., Chen, C., and Wang, J. (2020). Repair and Resource Scheduling in Unbalanced Distribution Systems Using Neighborhood Search. IEEE Trans. Smart Grid 11, 673–685. doi:10.1109/TSG.2019.2927739
Bian, Y., and Bie, Z. (2018). Multi-Microgrids for Enhancing Power System Resilience in Response to the Increasingly Frequent Natural Hazards. IFAC-PapersOnLine 51, 61–66. doi:10.1016/j.ifacol.2018.11.678
Bie, Z., Lin, Y., Li, G., and Li, F. (2017). Battling the Extreme: A Study on the Power System Resilience. Proc. IEEE 105, 1253–1266. doi:10.1109/JPROC.2017.2679040
Chang, D., Shelar, D., and Amin, S. (2020). “Stochastic Resource Allocation for Electricity Distribution Network Resilience,” in 2020 American Control Conference (ACC), 198–203. doi:10.23919/ACC45564.2020.9147879
Gao, H., Chen, Y., Xu, Y., and Liu, C. C. (2016). Dynamic Load Shedding for an Islanded Microgrid with Limited Generation Resources. IET Gener. Transm. Distrib. 10, 2953–2961. doi:10.1049/iet-gtd.2015.1452
Guikema, S. D., Davidson, R. A., and Liu, H. (2006). Statistical Models of the Effects of Tree Trimming on Power System Outages. IEEE Trans. Power Deliv. 21, 1549–1557. doi:10.1109/TPWRD.2005.860238
Guikema, S. D., Quiring, S. M., and Han, S.-R. (2010). Prestorm Estimation of Hurricane Damage to Electric Power Distribution Systems. Risk Anal. 30, 1744–1752. doi:10.1111/j.1539-6924.2010.01510.x
Lei, S., Chen, C., Li, Y., and Hou, Y. (2019a). Resilient Disaster Recovery Logistics of Distribution Systems: Co-Optimize Service Restoration With Repair Crew and Mobile Power Source Dispatch. IEEE Trans. Smart Grid 10, 6187–6202. doi:10.1109/TSG.2019.2899353
Lei, S., Chen, C., Zhou, H., and Hou, Y. (2019b). Routing and Scheduling of Mobile Power Sources for Distribution System Resilience Enhancement. IEEE Trans. Smart Grid 10, 5650–5662. doi:10.1109/TSG.2018.2889347
Li, B., Chen, Y., Wei, W., Mei, S., Hou, Y., and Shi, S. (2021). Preallocation of Electric Buses for Resilient Restoration of Distribution Network: A Data-Driven Robust Stochastic Optimization Method. IEEE Syst. J. 16 (2), 2753–2764. doi:10.1109/jsyst.2021.3123623
Li, J., Khodayar, E., and Feizi, M. R. (2021). Hybrid Modeling Based Co-Optimization of Crew Dispatch and Distribution System Restoration Considering Multiple Uncertainties. IEEE Syst. J. 16 (1), 1278–1288. doi:10.1109/JSYST.2020.3048817
Nateghi, R., Guikema, S. D., and Quiring, S. M. (2011). Comparison and Validation of Statistical Methods for Predicting Power Outage Durations in the Event of Hurricanes. Risk Anal. 31, 1897–1906. doi:10.1111/j.1539-6924.2011.01618.x
Panteli, M., Pickering, C., Wilkinson, S., Dawson, R., and Mancarella, P. (2017). Power System Resilience to Extreme Weather: Fragility Modeling, Probabilistic Impact Assessment, and Adaptation Measures. IEEE Trans. Power Syst. 32, 3747–3757. doi:10.1109/TPWRS.2016.2641463
Wallnerström, C. J., and Hilber, P. (2013). “Vulnerability Analysis of Power Distribution Systems for Cost-Effective Resource Allocation,” in 2013 IEEE Power Energy Society General Meeting. doi:10.1109/PESMG.2013.6672145
Yao, Y., Edmunds, T., Papageorgiou, D., and Alvarez, R. (2007). Trilevel Optimization in Power Network Defense. IEEE Trans. Syst. Man. Cybern. C 37, 712–718. doi:10.1109/TSMCC.2007.897487
Yao, S., Wang, P., and Zhao, T. (2019). Transportable Energy Storage for More Resilient Distribution Systems With Multiple Microgrids. IEEE Trans. Smart Grid 10, 3331–3341. doi:10.1109/TSG.2018.2824820
Yeddanapudi, S. R. K., Li, Y., McCalley, J. D., Chowdhury, A. A., and Jewell, W. T. (2008). Risk-Based Allocation of Distribution System Maintenance Resources. IEEE Trans. Power Syst. 23, 287–295. doi:10.1109/TPWRS.2008.919316
Yuan, W., Zhao, L., and Zeng, B. (2014). Optimal Power Grid Protection through a Defender-Attacker-Defender Model. Reliab. Eng. Syst. Saf. 121, 83–89. doi:10.1016/j.ress.2013.08.003
Yuan, W., Wang, J., Qiu, F., Chen, C., Kang, C., and Zeng, B. (2016). Robust Optimization-Based Resilient Distribution Network Planning against Natural Disasters. IEEE Trans. Smart Grid 7, 2817–2826. doi:10.1109/TSG.2015.2513048
Keywords: resilience, distribution network, extensive-form game, defender-attacker-defender model, backward induction method
Citation: Chen Y, Yan Y, Nie H, Jiang Z and Zhou N (2022) Extensive-form Game-Based Pre-Disaster Resilience Planning Considering Post-Disaster Restoration Decisions. Front. Energy Res. 10:889437. doi: 10.3389/fenrg.2022.889437
Received: 04 March 2022; Accepted: 06 June 2022;
Published: 07 July 2022.
Edited by:
Shunbo Lei, The Chinese University of Hong Kong, Shenzhen, ChinaReviewed by:
Jiazuo Hou, The University of Hong Kong, Hong Kong SAR, ChinaGaoqi Liang, The Chinese University of Hong Kong, Shenzhen, China
Yalong Li, China University of Mining and Technology, China
Copyright © 2022 Chen, Yan, Nie, Jiang and Zhou. This is an open-access article distributed under the terms of the Creative Commons Attribution License (CC BY). The use, distribution or reproduction in other forums is permitted, provided the original author(s) and the copyright owner(s) are credited and that the original publication in this journal is cited, in accordance with accepted academic practice. No use, distribution or reproduction is permitted which does not comply with these terms.
*Correspondence: Ying Chen, Y2hlbl95aW5nQHRzaW5naHVhLmVkdS5jbg==
 Ying Chen
 Yunqi Yan
 Huanhuan Nie2