- 1College of Electrical Engineering, Shanghai University of Electric Power, Shanghai, China
- 2State Grid Zhejiang Anji County Power Supply Co., Ltd., Huzhou, China
With the large-scale access of distributed resources to distribution network operation, there are more and more prosumers on the user side. It forms the basis of load prediction and demand-side management to identify different power consumption patterns and establish a typical load characteristic database according to the load data of prosumers. Therefore, a method to build a prosumer load characteristic database based on a deep convolutional autoencoder is proposed. First, the autoencoder network was used to extract the features of the load data collected to reduce the data dimension. Then, the density weight canopy algorithm was used to precluster the data after dimensionality reduction to obtain the initial clustering center and the optimal clustering number K value. The pre-clustering results were combined with the k-means algorithm for clustering, and the typical load characteristic database of prosumers was obtained. Finally, the comparison between the clustering index and the traditional k-means clustering algorithm and the improved k-means direct clustering algorithm proves that the method can effectively improve the accuracy of clustering results.
1 Introduction
In recent years, with the worsening of environmental pollution, energy crisis, and climate change worldwide, distributed energy has gradually become the mainstream trend of energy utilization due to its clean characteristics. At the same time, rooftop photovoltaic, electric vehicles, energy storage technology, and other technologies have been booming, and prosumer groups have been growing (Huang S. et al., 2021). Prosumers are emerging special consumers, which have two characteristics of power supply and electricity consumption, and have good frequency regulation characteristics. Analyzing consumers' electricity consumption characteristics can help to deeply understand consumers' electricity consumption behavior patterns and provide decision support for demand-side lean management. Under the condition of a smart grid, various advanced metering devices, such as sensors and smart meters, are increasingly installed in the distribution network to monitor, control, and predict the use of electric energy (Song et al., 2013). The daily consumption data of transformers or power users collected at different time intervals constitute the daily load curve of each monitoring point. The analysis of daily load of monitoring points can detect power theft by power users and protect the legitimate rights and interests of power enterprises (Chen et al., 2021). In addition, this accurate and detailed power consumption information also provides a basis for power distribution enterprises to obtain load patterns through a specialized analysis (Zhao et al., 2014).
As an unsupervised machine learning algorithm, clustering can be used to cluster data sets. There are high degrees of similarity among the data in the cluster and some differences among the data in the cluster, which has a wide range of applications in the field of data mining. The clustering of load curves can be divided into direct clustering and indirect clustering. Direct clustering refers to the clustering of power load data directly by using the algorithm without processing (Jiang et al., 2018). In the literature study by Zhang and Zhao, (2017), the initial clustering center was selected according to the principle of the sample density and relatively far distance between sample sets, and then, the optimal clustering number K value was obtained by the sum of error squares, but the time complexity was high. Literature studies by Kwac J et al. (2014) and Wang et al. (2020) solved the problem of manual determination of K value in the traditional clustering algorithm by combining the adaptive learning theory and evaluation calculation of clustering validity function, but the clustering accuracy is low. However, with the increase in the dimension of prosumer load data, direct clustering is confronted with dual challenges of storage and computation in processing high-dimension data. Indirect clustering can solve this problem. Indirect clustering is used to extract the characteristics of the power load data of prosumers first, reduce the dimension of the load data, and then perform the sequence clustering analysis after dimensionality reduction. In the literature study by (Chen et al. (2018), singular value decomposition was used to transform the data, that is, in a new coordinate system, the coordinates on each coordinate axis were dimension reduction indicators, and then, the improved k-means algorithm was used to cluster the load curve. In the literature (Zhong and Tam (2015), discrete Fourier transform was used to reduce the dimension of load data and extract features, and then, load curves were clustered. In the literature (Zhang B et al. (2015) and Li Y et al. (2018), Sammon mapping, principal component analysis, and other dimensionality reduction algorithms were used to reduce the dimension of load data, and then, different clustering methods were used for clustering, and effective clustering curve results were obtained.
In this study, a power load clustering method based on the deep convolutional autoencoder (DCAE) is proposed, which uses the DCAE to extract and reduce the characteristics of the load data of prosumers, and then adopts the density weight canopy algorithm to precluster the data after dimensionality reduction. The initial clustering center and the optimal clustering number K value were obtained. The pre-clustering results were clustered using the k-means algorithm, and the clustering effectiveness index was compared and analyzed with other traditional methods, in order to improve the clustering efficiency of the power load and the accuracy of clustering results, and the typical load characteristic database of prosumers was obtained.
2 One-Dimensional Deep Convolution Autoencoder
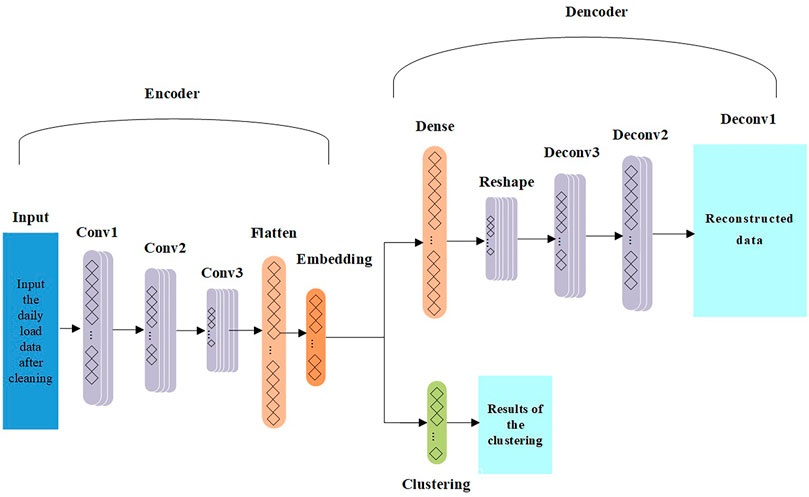
Autoencoders efficiently learn raw input data without supervision. A single-layer autoencoder contains an input layer, a hidden layer, and an output layer. The convolutional autoencoder replaces the fully connected neural network with a convolutional network. Compared with the fully connected network, the advantage of a convolutional network is that it adopts the method of local connection, weight sharing, and multiple convolution kernels. Local connection greatly reduces the computation of the network, weight sharing greatly reduces the complexity of the network, and multiple convolution kernels help to extract multiple features. Therefore, the convolutional neural network can effectively avoid the complexity of data reconstruction in feature extraction and classification. The one-dimensional convolutional autoencoder is introduced in load clustering research, and its good reconstruction ability can be used to extract the time series features of load data and obtain effective representation of data. Moreover, the non-linear relationship of high-dimensional data can be mined through the convolutional neural network to effectively reduce data dimension and improve the clustering efficiency. The load sequence feature extraction method of the 1D-DCAE network model was used to remove the clustering part from Figure 1. The model is divided into an encoder and a decoder. The encoder passes through three convolution layers, flattening layer, and embedding layer in turn to obtain the deep feature sequence of the daily load curve after dimensionality reduction. The decoder reconstructs the features after dimensionality reduction through the full connection layer, remodeling layer, and three deconvolution layers to obtain the reconstruction curve similar to the input. Codecs are trained together to minimize the reconstruction error to obtain the best model. It is assumed that
where
Its decoding process is expressed as follows:
where
After training, the loss function minimization constantly adjusts the optimization. The objective of the model is to minimize the mean square error of the loss function
The gradient descent method is used to solve the optimization problem
3 K-Means Clustering Algorithm Based on Density Weight Canopy
3.1 Traditional K-Means Clustering Algorithm
The k-means algorithm is a clustering algorithm that belongs to the classification method. Usually, the Euclidean distance is used as an evaluation index for similarity degree of two samples. Its basic idea is as follows: K points in the data set were randomly selected as the initial clustering center, which was classified into the class with the smallest distance according to the distance between each sample in the data set and k centers. Then, the average value of all samples in each class was calculated, and each class center was updated until the square error criterion function stabilized at the minimum value.
It is assumed that the object set
where
The square criterion error function is as follows:
where k is the number of clustering,
3.2 Improved K-Means Clustering Algorithm
In order to solve the problem that the traditional k-means algorithm cannot effectively process high-dimensional data and the artificial clustering number K value and the random selection of the initial clustering center are easy to converge to the local optimal, an improved k-means algorithm of density weight canopy is proposed to cluster the power load data after dimensionality reduction.
The improved algorithm performs pre-clustering on the data after dimensionality reduction through the density weight canopy algorithm so as to obtain the initial clustering center and the appropriate number of clustering. The pre-clustering results are combined with the k-means algorithm for clustering.
Density
In Formula 6,
According to Eq. 6, the physical meaning of
The average distance of samples in the cluster
The distance between clusters
where
According to Formula 9, the physical meaning of the distance between clusters
The weight product
The maximum weight product method is composed of sample density
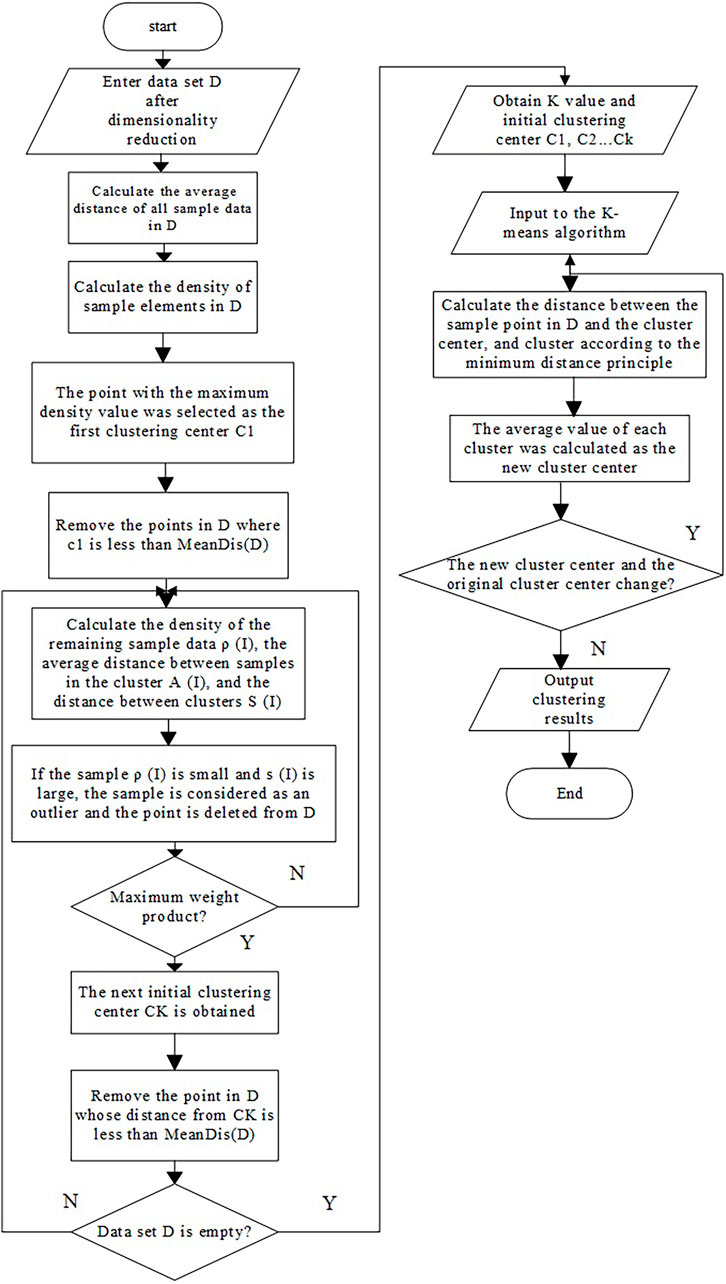
The steps of the improved k-means algorithm are as follows.
Step 1: For the data set D after dimensionality reduction, Formula 5 is used to calculate the density values of all sample elements in D. The first clustering center C1 selects the point with the maximum density value, and then, the set C of the clustering center changes to C = {C1}. Meanwhile, the points in D whose distance from C1 is less than the average distance MeanDis(D) of sample elements are removed.
Step 2: The ρ(i), a(i), and s(i) of the remaining sample data in D were calculated according to Eqs 5, 7, 8 and were substituted into Eq 9 to calculate the weight product W. The maximum weight product point of the second clustering center c2 was selected, and the set C of the clustering center changed to C = {c1, c2}. Meanwhile, the points in D whose distance from c2 is less than the mean distance MeanDis(D) of sample elements are removed.
Step 3: Step 2 is repeated until the data set D after dimensionality reduction is empty, so C = {c1, c2, …, ck}.
Step 4: The initial clustering center and K value obtained in the aforementioned steps are combined with the k-means algorithm to cluster D and update the clustering center. When there is no change between the new clustering center and the initial clustering center, the clustering result is output.
4 Clustering Analysis of Power Load Based on 1D-DCAE Dimensionality Reduction
4.1 Data Preprocessing
With the continuous development of energy Internet, the difficulty of obtaining massive basic power load data is gradually reduced (Zhou et al., 2018). However, in the process of data collection, there are still missing data and abnormal data in load data due to terminal acquisition equipment failure, data transmission and communication error, loss of human factors, and other problems (Zeng H, 2017). During data cleaning, load curve data with large data missing are removed, and load data without serious data missing are filled by multi-order Lagrange interpolation, as shown in Eq. 10. If the load data change rate of a load curve at time T is significantly different from that at the previous time, or it is beyond the preset threshold, it is called abnormal data. Gaussian filtering can be used to eliminate noise, or multi-order Lagrange interpolation can be used to correct a small amount of abnormal load curve data.
where
In order to conduct 1D-DCAE neural network training, the feature data should be normalized first, which can accelerate the speed of obtaining the optimal solution in gradient descent training and possibly improve the calculation accuracy. In this study, StandardScaler standardization is carried out for load data, and mean removal and variance normalization are carried out for each characteristic dimension of the sample to eliminate the influence of load data dimension on subsequent clustering and ensure comparability between data. The z-score standardization formula is adopted as follows:
where x is the load data after cleaning;
4.2 Overall Algorithm Process
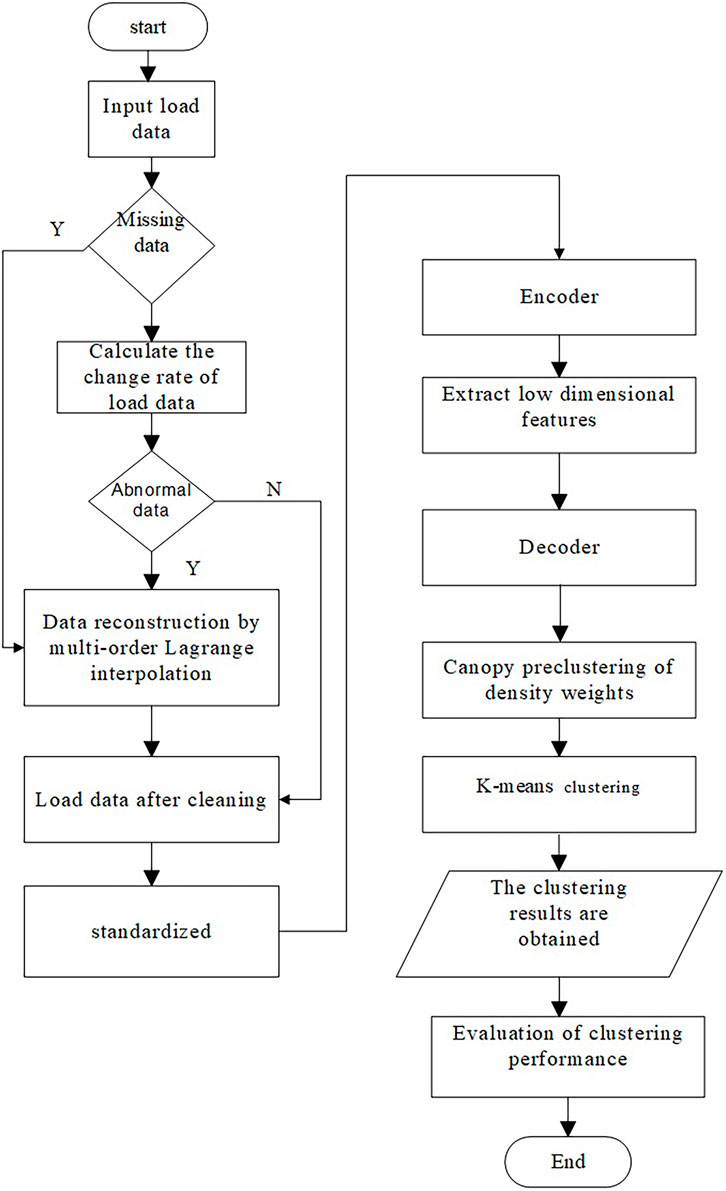
The overall algorithm includes preprocessing load data, dimensionality reduction of load data, determination of the initial cluster center and K value, clustering of data set, and performance evaluation. The overall algorithm flow chart is shown in Figure 3. The detailed process is described as follows.
1) Data cleaning, standardization, and preprocessing of load data are carried out through data correction and data completion technologies.
2) The 1D-DCAE technology is used to extract low-dimensional features of load data, reduce the dimension of load data, realize lossless compression of original data, and improve the speed and accuracy of subsequent clustering.
3) The density weight canopy algorithm is used to perform pre-clustering on the load data after dimensionality reduction so as to obtain the initial cluster center and the appropriate number of clusters.
4) The pre-clustering results are combined with the k-means algorithm for clustering, to output the clustering results, and make a comparative analysis with other traditional methods through clustering effectiveness indicators.
5 Example Analysis
The actual electricity consumption data of 70 distribution users at 48 points per day in 2019 were selected for experimental data. After data pretreatment, 3,500 daily load data were reserved for cluster analysis.
5.1 Convolutional Autoencoder Network Structure and Parameter Setting
The main parameter settings of the 1D-CAE model are shown in Table 1, especially including the size, quantity, step size, flattening layer, and hidden layer parameter settings of the convolution kernel.
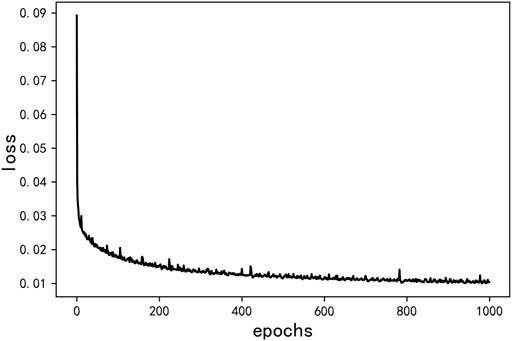
The input is 48× 1-dimensional load sequence, which is passed through three convolution layers with the number of convolution kernels being 32, 64, and 128,; the size of convolution kernels being 3, and step size being 2; and then through the flattened layer. The obtained results are flattened into a one-dimensional sequence, and then, through the hidden layer, the 6-dimensional sequence is output. After that the sequence is restored to the one before the flatten layer through dense layer and reshape layer. In the end, it passes through three layers of deconvolution whose nuclear number is 64, 32 and 1 respectively, the convolution kernel size is 3, and the step length is 2. Then the input sequence is reconstructed. The training loss is shown in Figure 4. The reconstruction loss ended up around 0.0105.
The input data can extract the features of the original data in the coding part, obtain the dimensionality reduction data, and then reconstruct the original data through the decoding part. As the number of iterations increases, the MSE loss function between the original data and the output data decreases continuously, and the loss value is stable at about 0.01, indicating that the dimensionality reduction data can effectively characterize the original data.
5.2 Typical Load Signature Database
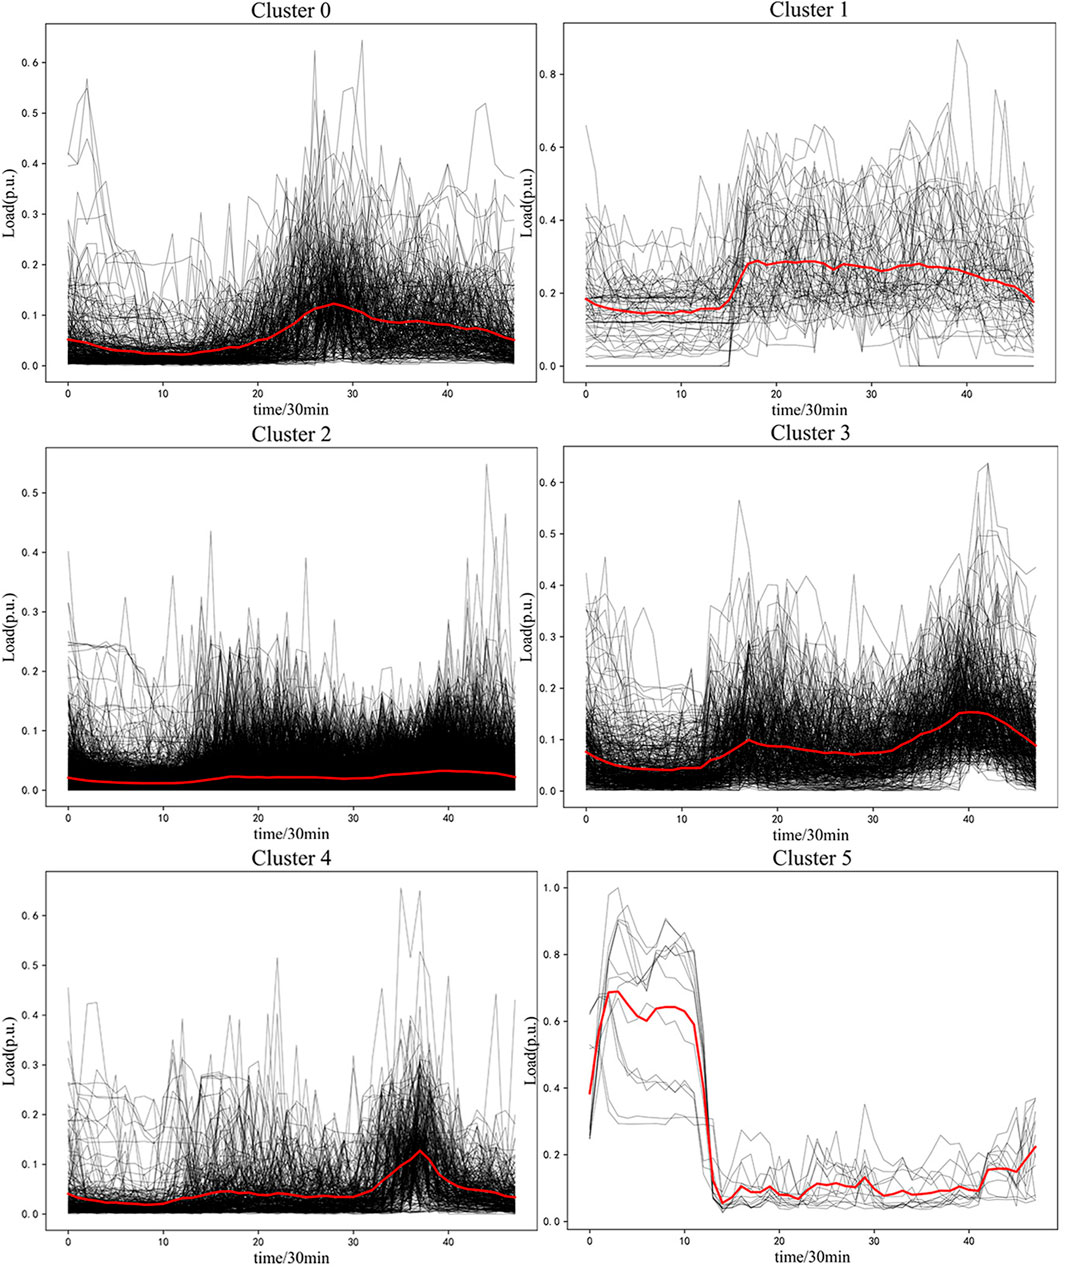
The 1D-DCAE + k-means clustering method is used to conduct clustering simulation on daily load curves of distribution substation users and extract typical load curves. The simulation results are shown in Figure 5. The algorithm divides 3,500 daily load curves into six categories.
The user load curve of type 0 is a single peak curve, and the peak appears from 10 a.m. to 3 p.m. On the whole, the load in the afternoon is larger than that in the morning, so this kind of load may have a large proportion of commercial and civil air conditioning load. The first type of the user load curve is a two-step curve. The step appears at 7 a.m. and remains relatively stable on the whole. Therefore, this type of load may belong to the tertiary industry business park or two-shift industrial load. The second type of the user load curve has no peak value and is generally stable with a low value. Therefore, this type of load may belong to the residential load or distributed pv with energy storage regulation connected to a certain proportion. The third type of the user load curve is a double peak load curve, with the first peak appearing at 7 a.m. and the second peak at 8 p.m. Therefore, this type of load may be distributed pv without energy storage access. Due to the energy storage output at noon, the load is small at noon. The fourth type of the user load curve is a single peak load curve; the peak appears at 7 pm, and the overall load is relatively stable, so this type of load may be connected to some energy storage devices. The fifth type of the user load curve is a single peak load curve, and the peak appears at 0 to 6 o’clock in the morning. Due to the influence of electricity price incentive, users will choose to charge EV in the early morning, so EV charging pile load will increase at night. Since this load is large at night, this type of load may have a significant share of EV charging pile load.
5.3 Cluster Performance Analysis
In order to verify the superiority of the model proposed in this study, cluster indicators DBI (Davies–Bouldin Index), CHI (Calinski–Harabasz Index), and silhouette coefficient (SC) are selected for quantitative analysis. The higher the SC value, the better is the clustering result. The smaller the DBI value, the better is the clustering effect. The higher the CHI value, the better is the clustering effect. Four clustering methods k-means, PCA + k-means, deep embedded clustering based on local structure retention (IDEC), and 1D-DCAE + k-means were compared and analyzed with the same set of data. The analysis results are shown in Table 2.
It can be seen from Table 2 that dimension reduction can improve the clustering effect. Using k-means clustering after dimensionality reduction through PCA is better than using k-means clustering directly; with the DBI index reduced by about 0.29, the CHI index increased by about 459.03, and the SC index increased by about 0.04. By comparing the IDEC method with the k-means method and the PCA + k-means method, the DBI index decreased by 1.57 and 1.28, respectively, while the CHI index increased by 16690.18 and 16231.15, respectively. The SC index increased by 0.5173 and 0.4729, respectively. Compared with IDEC, the 1D-DCAE + k-means method proposed in this study improved DBI, CHI, and SC indexes by about 0.15, 19384.92, and 0.10, respectively, and all three indexes were better, indicating that the 1D-DCAE + k-means method had significantly improved the feature extraction and clustering effect.
6 Conclusion
In this study, a power load clustering method based on the deep convolutional autoencoder (DCAE) is proposed, which uses DCAE to extract and reduce the characteristics of the load data of prosumers, and then adopts the density weight canopy algorithm to cluster the data after dimensionality reduction. Load curve dimensionality reduction and clustering are realized to generate the typical load characteristic database of prosumers. Taking the daily load data of local distribution substation users as an example, the typical load characteristic database of prosumers is established, which verifies the effectiveness and practicability of the method. The results are compared with other traditional dimensional-reduction clustering methods. The DBI index of this method is lower, the CHI index is greatly improved, and the SC index is also improved, thus improving the clustering quality. At the same time, through the clustering analysis of the consumption data of prosumers, the consumption level can be divided and obtained, which is helpful to understand the consumption pattern of prosumers and master the consumption level of prosumers. Power supply companies can also formulate demand-side management schemes for prosumers through clustering results so as to avoid the peak consumption of the power grid and move the peak to fill the valley, thus relieving users from avoiding peak consumption and moving the peak to fill the valley and relieving the pressure caused by tight power supply during peak consumption.
Data Availability Statement
The raw data supporting the conclusion of this article will be made available by the authors, without undue reservation.
Author Contributions
Manuscript writing: BX and YG; data collection: JL and YL; content and format correction: YY, FX, and XX. All authors have read and agreed to the published version of the manuscript.
Funding
This study received funding from The Science and Technology Project of State Grid Zhejiang Electric Power Co., Ltd. (KJKY2021335), and The Collective Enterprise Science and Technology Project of Zhejiang Electric Power Co., Ltd. (HZJTKJ2021-14). The funder was not involved in the study design, collection, analysis, interpretation of data, the writing of this article or the decision to submit it for publication. All authors declare no other competing interests.
Conflict of Interest
Authors JL, YL, YY, FX, and XX were employed by the State Grid Zhejiang Anji County Power Supply Co., Ltd.
The remaining authors declare that the research was conducted in the absence of any commercial or financial relationships that could be construed as a potential conflict of interest.
Publisher’s Note
All claims expressed in this article are solely those of the authors and do not necessarily represent those of their affiliated organizations, or those of the publisher, the editors, and the reviewers. Any product that may be evaluated in this article, or claim that may be made by its manufacturer, is not guaranteed or endorsed by the publisher.
References
Chen, G., Li, D., and Chen, X. (2021). Detection Method of Electricity Theft with Low False Alarm Rate Based on an XGBoost Model. Power Syst. Prot. Control. 49 (23), 178–186. (in Chinese). doi:10.19783/j.cnki.pspc.210094
Chen, Y., Hao, W. U., and Shi, J. (2018). Application of Singular Value Decomposition Method in Dimension Reduction Clustering Analysis of Daily Load Curve. Power Syst. Automation 42 (3), 105–111. doi:10.7500/AEPS20170309008
Huang, S., Wu, Q., Liao, W., Wu, G., Li, X., and Wei, J. (2021). Adaptive Droop-Based Hierarchical Optimal Voltage Control Scheme for VSC-HVdc Connected Offshore Wind Farm. IEEE Trans. Ind. Inf. 17 (12), 8165–8176. doi:10.1109/TII.2021.3065375
Jiang, Z., Lin, R., Yang, F., and Wu, B. (20182018). A Fused Load Curve Clustering Algorithm Based on Wavelet Transform. IEEE Trans. Ind. Inf. 14 (5), 1856–1865. doi:10.1109/TII.2017.2769450
Kwac, J., Flora, J., and Rajagopal, R. (2014). Household Energy Consumption Segmentation Using Hourly Data. IEEE Trans. Smart Grid 5 (1), 420–430. doi:10.1109/TSG.2013.2278477
Li, Y., Huang, Q., and Song, L. (2018). Load Pattern Extraction Method for Power Users Based on Clustering Fusion Technology. Electr. Meas. Instrumentation 55 (16), 137–141, 152.
Song, Y., Zhou, G., and Zhu, Y. (2013). Present Status and Challenges of Big Data Processing in Smart Grid. Power Syst. Techn. 37 (4), 927–935. (in Chinese). doi:10.13335/j.1000-3673.pst.2013.04.004
Wang, Z., Zhou, Y., and Li, G. (20202020). Anomaly Detection by Using Streaming K-Means and Batch K-Means. 2020 5th IEEE International Conference On Big Data Analytics (ICBDA). Xiamen: Department of Computer Science, University of Liverpool, 11–17.
Zeng, H. (20172017). Research on Clustering Analysis of Electricity Measurement Data and Detection of Electricity Theft. Kunming: Kunming University of Science and Technology.
Zhang, B., Zhuang, C., and Hu, J. (2015). Power Load Curve Ensemble Clustering Algorithm Based on Dimension Reduction Technology. Chin. J. Electr. Eng. 35 (15), 3741–3749.
Zhang, S., and Zhao, H. (2017). Algorithm Research of Optimal Cluster Number and Initial Cluster center. Appl. Res. Comput. 34 (6), 1617–1620. doi:10.3969/j.issn.1001-3695.2017.06.004
Zhao, T., Zhang, Y., and Zhang, D. (2014). Application Technology of Big Data in Smart Distribution Grid and its prospect Analysis. Power Syst. Techn. 38 (12), 3305–3312. (in Chinese). doi:10.13335/j.1000-3673.pst.2014.12.006
Zhong, S., and Tam, K.-S. (2015). Hierarchical Classification of Load Profiles Based on Their Characteristic Attributes in Frequency Domain. IEEE Trans. Power Syst. 30 (5), 2434–2441. doi:10.1109/tpwrs.2014.2362492
Keywords: prosumer, convolutional autoencoder, load classification, dimensionality reduction clustering, neural network
Citation: Xu B, Gao Y, Liu J, Lu Y, Yang Y, Xu F and Xu X (2022) Construction Method of the Distribution Transform Load Feature Database Based on Deep Convolutional Autoencoder. Front. Energy Res. 10:883528. doi: 10.3389/fenrg.2022.883528
Received: 25 February 2022; Accepted: 14 March 2022;
Published: 14 April 2022.
Edited by:
Bin Zhou, Hunan University, ChinaReviewed by:
Lei Xi, China Three Gorges University, ChinaHuayi Wu, Hong Kong Polytechnic University, Hong Kong SAR, China
Copyright © 2022 Xu, Gao, Liu, Lu, Yang, Xu and Xu. This is an open-access article distributed under the terms of the Creative Commons Attribution License (CC BY). The use, distribution or reproduction in other forums is permitted, provided the original author(s) and the copyright owner(s) are credited and that the original publication in this journal is cited, in accordance with accepted academic practice. No use, distribution or reproduction is permitted which does not comply with these terms.
*Correspondence: Yuan Gao, Z2FveXVhbkBzaGllcC5lZHUuY24=
 Bin Xu
 Yuan Gao1*