 Juan H. Leal1*
 Eric J. Meierdierks1
 Ricardo Navar1
 Cameron M. Moore2
 Allison E. Ray3
 Troy A. Semelsberger1*
- 1Material Physics Applications Division, Los Alamos National Laboratory, Los Alamos, NM, United States
- 2Chemistry Division, Los Alamos National Laboratory, Los Alamos, NM, United States
- 3Science and Technology, Idaho National Laboratory, Idaho Falls, ID, United States
The impacts of biological degradation on surface area, surface energy, wettability, and cohesion of anatomically fractionated (i.e., leaf, stalk, and cob) and bulk corn stover are presented in this study. The physical, thermal and chemical properties of corn stover are critical material attributes that not only influence the mechanical processing and chemical conversion of corn stover, but also the bulk solids handling and transport. The measured surface areas were observed to be dependent on the degree of biological degradation (mild vs. moderate vs. severe) and on the anatomical fraction. The surface area of the bulk corn stover samples increased with the degree of biological degradation. The leaf fraction was the most sensitive to biological degradation, resulting in an increase in surface area from 0.5 m2/g (mildly degraded) to 1.2 m2/g (severely degraded). In contrast, the surface area of the cob fraction remained relatively unaffected by the degree of biological degradation (i.e., mildly degraded−0.55 m2/g, severely degraded−0.40 m2/g. All biologically degraded samples resulted in significant changes to the surface chemistry (evidenced by an increase in surface energy. As a general trend, the surface energy of bulk corn stover increased with the degree of biological degradation—the same trend was observed for the leaf and stalk anatomical fractions; however, the surface energy for the cob fraction remained unchanged. Wettability, calculated from surface energy, for bulk corn stover samples did not reveal any discernable trend with the degree of biological degradation. However, trends in wettability were observed for the anatomical fractions, with wettability increasing for the stalk and leaf fractions, and decreasing for the cob fraction. Excluding the cob fraction, the work of cohesion increased with the degree of biological degradation. Understanding the impacts of biological degradation on the physical, chemical and thermal properties of corn stover offers insights to improve the overall operational reliability, efficiency and economics of integrated biorefineries.
1 Introduction
Global energy consumption continues to increase steadily as predicted by the United States. Energy Information Administration (EIA), with renewables slated to be the fastest growing energy source by 2040 (EIA, 2019). As energy demands increase, so does the importance of securing our nation’s energy supplies, and with global climate change as a serious concern, the motivation for the United States and others in the global community to work towards replacing petroleum with renewable energy sources is gaining momentum. Currently, almost half (45%) of renewable energy used in the United States is biomass sourced, making up 5% of total energy usage—which has more than doubled in the past 20 years (Renewable Energy Sources, 2019). After the 3 Billion Ton study, the UnitedStates Department of Energy (DOE) has determined that there is a sustainable supply of biomass to potentially replace 30% of petroleum production with biofuel by 2030 (Perlack, 2005; Perlack et al., 2011; Langholtz et al., 20162016).
Biomass is a renewable, low cost, and abundant feedstock with established conversion methods to biofuels and platform chemicals; however, the commercialization of Integrated Biorefineries (IBR) is still not achievable. The challenges facing IBRs are associated with the lack of throughput and operational reliability of bulk solids and handling; thus preventing IBRs from achieving the DOE technical cost target of ethanol at $3.00 per gallon of gasoline (gge) (Harmon et al., 2017). In order to achieve the cost target, the operational reliability (i.e., time on stream) of a bio-refinery must exceed 90% (currently estimated around 30%) (Biorefinery Optimization Workshop Summary, 2016). Critical material attributes and feedstock variability are largely responsible for the inconsistent and unreliable operations of bulk solids handling and transport. Critical material attributes include (but not limited to): moisture content, surface area, particle size, aspect ratios, wettability, cohesion and anatomical fraction. The critical material attributes investigated in this paper are anatomical fraction, wettability, surface area, and ash.
Biomass storage conditions (time, temperature, environment) is a major source of feedstock variability that directly impacts the quality of feedstock through changes in the critical material attributes (Searcy et al., 2015; Nagle et al., 2020). Biomass storage is a necessary process because the harvest window is much shorter than the required year-long processing window. A known challenge with biomass storage is biologically induced degradation, which occurs in piles or bales of organic material such as corn stover (Smith et al., 2020). Biological degradation is complex process resulting from respiration of plant tissues, abiotic oxidation and microbial degradation—resulting in the loss of valuable sugars, and dry-matter (Bose et al., 2020).
The biological degradation of biomass directly affects the quality of the feedstock, which in turn influences the overall conversion, yield and economics of IBRs (Smith et al., 2014; Ray et al., 2020). Biological degradation is analogous to composting which involves three types of bacteria, psychrophilic, mesophilic, and thermophilic. (Hanson-Harding, 2013) Biological degradation can be broadly grouped into microbial-induced degradation, thermal degradation and partial/complete oxidation. Microbial-induced degradation is the result of bacteria breaking down the biomass. Thermal degradation is the temperature dependent degradation (i.e., decomposition) of biomass in the presence or absence of oxygen. Under adiabatic conditions, the bale temperature continues to rise to the point where partial oxidative degradation starts. Complete oxidation only proceeds when the oxygen concentration is high enough to support combustion. Prior to complete combustion, partial oxidation is the dominate reaction because oxygen is the limiting reactant. The products from biological heating is a function of time, temperature, and oxygen concentration. A deeper understanding how biological heating contributes to feedstock variability offers opportunities for engineering improvements to handle the range of feedstock properties while still maintaining continuous operation.
The objective of this research is to investigate the effects that biological heating has on corn stover properties such as surface area, surface energy, cohesion, and wettability. This paper presents the characterization of 21 samples (bulk and anatomical fractions) among five bales that were visually identified as being exposed to varying degrees of biologically degradation.
2 Materials and Methods
2.1 Corn Stover Samples
Corn stover, the residue left after corn (Zea mays) has been harvested, is the greatest source of agricultural residue in the United States (Turhollow et al., 2014; Bradley et al., 2019). Corn stover consists of stalks, leaves, cobs and is a low-cost material for the production and supply of biofuel and platform chemicals (Kumar et al., 2008; Liu et al., 2014; Woźniak et al., 2021). Samples of corn stover were provided by Idaho National Laboratory (INL) for surface energy analysis and were stored in sealed plastic bags at room temperature. All samples were sourced from five bales (bale 1, 2, 3, 5, and 6) collected within a single field in Iowa and dissected into three categories based on visual identification of biologically induced heating or degradation. Figure 1A shows a segmented bale affected by biological degradation. There is a visual difference between the mildly heated (Figure 1B), which are light in color, and the severely heated, (Figure 1C) darker and almost black, samples. The stalk, leaf, and cob (anatomical fractions) were separated from part of bale 5 by visual inspection into 3 degrees of heating—mild 1), moderate 2), and severely 3) heated corn stover (Figure 2). All samples were then processed through three stages of milling. First through a Vermeer BG480 bale processer fitted with a 75 mm screen, followed by a Bliss Hammermill with a 25 mm screen. Samples were further milled using a Thomas Model 4 Wiley knife mill (Thomas Scientific, Swedesboro, NJ) fitted with a 2 mm screen producing 21 samples (Table 1) and were placed in plastic grab bags (25 g).
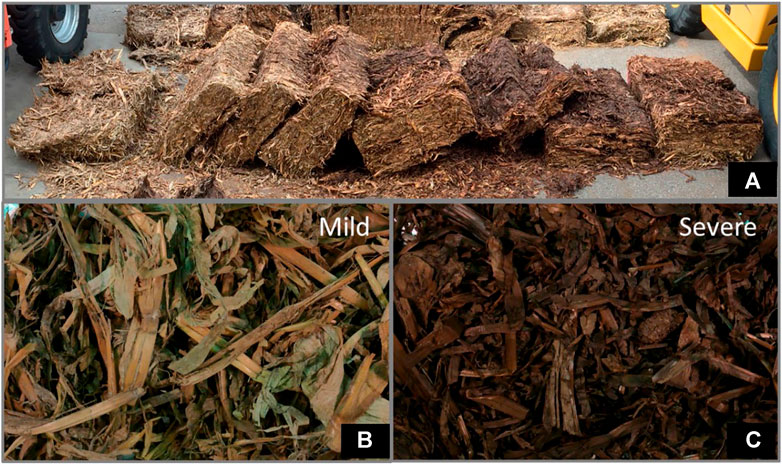
FIGURE 1. (A) A dissected bale showing various degrees of biological degradation, (B) a closer look at the mildly degraded section showing little to no browning, and (C) severely degraded corn stover appearing very dark, nearly black (images provided by staff at Idaho National Laboratory*).
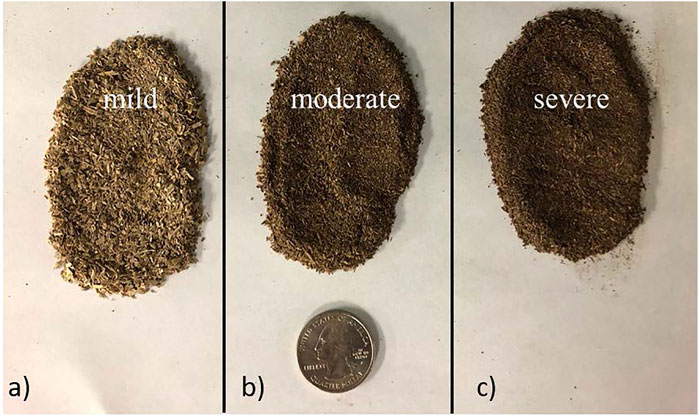
FIGURE 2. (A) 2 mm grind of mildly heated corn stover (leaf), (B) moderately heated, (C) severely heated.
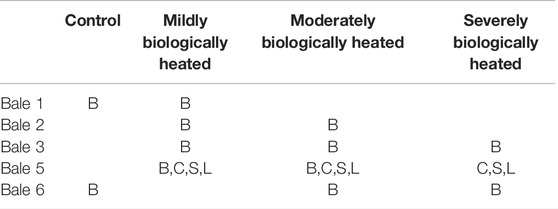
TABLE 1. Corn stover samples used in this study, “B” indicates bulk (unfractionated), “C,” “S,” and “L” indicate the fractions, cob, stalk and leaf, respectively.
2.2 Sample Drying
The as-received moisture content of the corn stover samples were measured using our TGA (thermal gravimetric analyzer). The as-received moisture contents ranged from 7–15 wt%. All samples were dried to moisture contents less than 2 wt% in a custom built in-house drying station consisting of a packed-bed, convection oven and argon purge gas. Sample drying was necessary to obtaining surface area measurements using the nitrogen adsorption technique (residual moisture would produce a virtual leak). The samples were weighed and loaded into a stainless steel tube (O.D. = 1 inch, Length = 8 inches) which was then placed into the convection oven and connected to the UHP argon purge gas. The isothermal drying temperature was maintained at 45°C during the 10 h drying cycle. The argon flow rate through the packed-bed was maintained at 150 sccm for all samples. Three to 4 g of corn stover were typical bed loadings. A final sample conditioning step was performed on the surface area analyzer (see § 2.3) prior to surface area analysis.
2.3 Specific Surface Areas
Multipoint specific surface area (SSA) was collected using a Micromeritics 3Flex instrument and the Brunauer–Emmett–Teller (BET) theory. All adsorption data were obtained using nitrogen as the adsorbate gas. The secondary drying step and outgassing consisted of samples with masses ranging from 1.3 to 1.6 g. BET range was determined from a linear fit of the BET plot. The linear fit was selected using seven increasing points (1-p/p°) up to the maximum on the Rouquerol transform plot. All experiments performed produced positive BET “C” constants.
2.4 Ash Content Measurement
Corn stover reportedly contains about 5-7 wt% of intrinsic ash (Bonner et al., 2014)—which is inorganic material that is taken up naturally within plant tissue during the growth process. Conversely, extrinsic ash is inorganic material introduced to the plant exterior by the external surroundings during harvest, collection, and storage (Lizotte et al., 2015; Lacey et al., 2016). In order to track and correlate the impacts of ash, all ash data were collected after completing the surface energy measurements. Note: surface energy measurements are non-destructive which allowed us to use the same sample for ash quantification.
Ash content was determined using a Netzsch 449 Jupiter simultaneous thermal analyzer (STA). The corn stover recovered after surface energy analysis was weighed and placed in three 500 μl alumina crucibles (∼333 mg corn stover per crucible) for ash analyses. The temperature program consisted of an initial 30 min isotherm at 25°C, followed by a 6°C/min ramp to 107°C in an argon environment (40 sccm), where the temperature was held isothermally until no further mass loss could be observed (approximately 2 h). Afterwards, the purge gas was switched from argon to air (40 sccm) with a temperature ramp of 10°C/min to 750°C. Temperature was held isothermally at 750°C for 1 h to verify the complete oxidation of the material—indicated by no additional mass loss. The remaining mass represented the weight percent of total ash (extrinsic plus intrinsic) relative to moisture-free corn stover.
2.5 Surface Energy, Inverse Gas Chromatography
Surface energy measurements were carried out at via inverse gas chromatography at infinite dilution using a Surface Energy Analyzer (SEA) from Surface Measurement Systems (SMS), outfitted with a flame ionization detector (FID). After drying and collecting surface area measurements the corn stover samples were packed in silanized glass columns. Vapor probe properties used for the calculations in this study are tabulated in Table 2. The silanized glass columns used for all analyses were sourced from SMS with the following dimensions; 4 mm ID, 6 mm OD × 300 mm L. Each sample was loaded into a new silanized column resulting in a solid (no gaps) packed column of densities between 0.13 and 0.64 g/cm3. To avoid probe to probe interactions, all surface energy measurements were performed at infinite dilution (0.005 n/nm or 0.5% mono-layer coverage). For each analysis (1 column per sample run in triplicate), the carrier gas used was helium (10 sccm), and the column temperature was maintained at 30°C with a 60 min conditioning step (identical conditions). In the SEA Analysis software, the center of mass option was used to determine retention time due to the asymmetrical peaks produced as a result of the polar probe-surface interactions. Instrument reproducibility was within 0.5% deviation using the mannitol reference standard provided by Surface Measurement Systems.
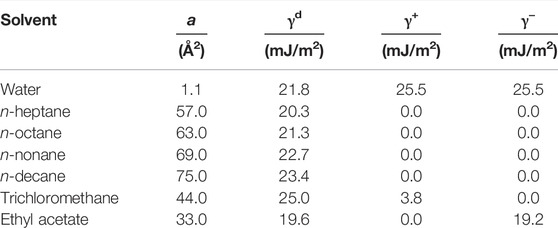
TABLE 2. Characteristics of the Dispersive and Acid-Base IGC probes used in this study.
2.5.1 Total Surface Energy
The free total surface energy (
2.5.2 Dispersive Surface Energy
Dispersive surface energy (
2.5.3 Specific Surface Energy
A monopolar Lewis acid (trichloromethane) and base (ethyl acetate), of HPLC grade from Sigma-Aldrich were used for the specific surface energy (
Determining the specific contributions was applied using the following approach:
where
Then Rearranged Into:
This same process was followed using ethyl acetate’s measured free enthalpy of adsorption (
2.5.4 Wettability
The ratio of specific over total surface energy, known as hydrophilicity, is a useful tool in the prediction of changes in wettability. These values can be used to track changes in sample sets as a result of storage conditions, and physical or chemical treatments.
2.5.5 Work of Cohesion and Work of Adhesion
The work of cohesion is defined as the intermolecular attractive force acting between two adjacent portions of a substance, the force that holds a piece of matter together (Li et al., 2020). The work of cohesion for both corn stover and water was calculated using Eq. 9. The variable
The work of adhesion (calculated with Eq. 10 measures the sum of interfacial forces between the corn stover surface (
The ratio (Φ, phi) of the work of adhesion (
3 Results and Discussion
3.1 Bet Surface Areas
Surface area and porosity changes may affect downstream processes such as enzymatic conversion. Enhanced enzyme accessibility is a limiting factor and pretreatments aim to increase this by creating or increasing voids, slits and generally increasing surface area (Ishizawa et al., 2007). In addition to surface energy, surface texture, area, and porosity plays an important role in wetting behavior of biomass. Understanding and controlling the parameters that affect biomass wetting characteristics may prove to be useful to biorefinery operators seeking to reduce wetting times during pretreatment or enzymatic digestion. Figure 3A shows the measured surface areas for the 12 non-fractionated bulk corn stover samples. The average surface area for the bulk corn stover samples was 1.03 m2/g, with a standard deviation of 0.09 m2/g and a range of 0.90–1.22 m2/g. The overall trend in surface area of the bulk corn stover samples increased with extent of biological degradation. The surface areas for the fractionated samples (stalk, leaf, and cob) are shown in Figure 3B as a function of the degree of self-heating. The average (
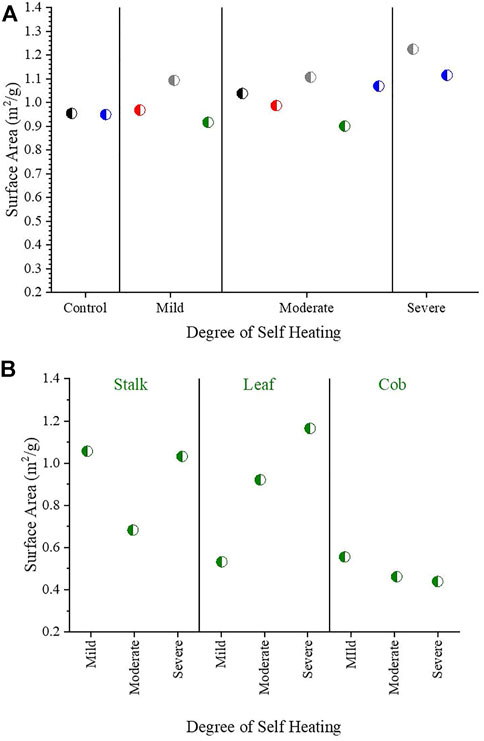
FIGURE 3. (A) Surface areas of corn stover samples; ◐ Bale 1, ◐ Bale 2, ◐ Bale 3, ◐ Bale 5, ◐ Bale 6. (B) Surface areas of fractionated corn stover samples from Bale 5
3.2 Total Ash Content Measurement
High level of inorganic material in corn stover can cause accelerated wear in hammer-mills, knife-mills, and screw feeders (Lacey et al., 2018). This soil-borne contamination has deleterious effects in downstream operations such as acid pretreatment, enzymatic hydrolysis and the fermentation processes (Weiss et al., 2010; Fang and Jia, 2012). Ash measurements were congruent with data collected previously in house and by collaborators from Idaho National Laboratory (Leal et al., 2020; Li et al., 2020). Ash data are plotted for the bulk bale samples in Figure 4A as a function of biological self-heating. The percent ash is the mass ratio of remaining ash to the mass of dried corn stover (× 100). The data set has an average ash content of 8.9% with a standard deviation (σ) and variance (σ2) of 3.2%, and 10.3, respectively. The range of total ash measured was 4–17%. The ash data for the fractionated samples are presented in Figure 4B as a function of biological self-heating. The average ash content of this data set is 8.2% with a standard deviation (σ) and variance (σ2) of 3.9%, and 15.2, respectively. The range of measured ash among the fractionated corn stover data set was 2%–16%. The variability in ash content observed here and in the literature (Xiong et al., 2008; Agblevor et al., 1995; K. J. Shinners et al., 2009; Shinners et al., 2011; Xiong et al., 2010; Fang and Jia, 2012; Werther et al., 2000) are most likely due to the variations in the collecting, storage, handling, and analytical technique.
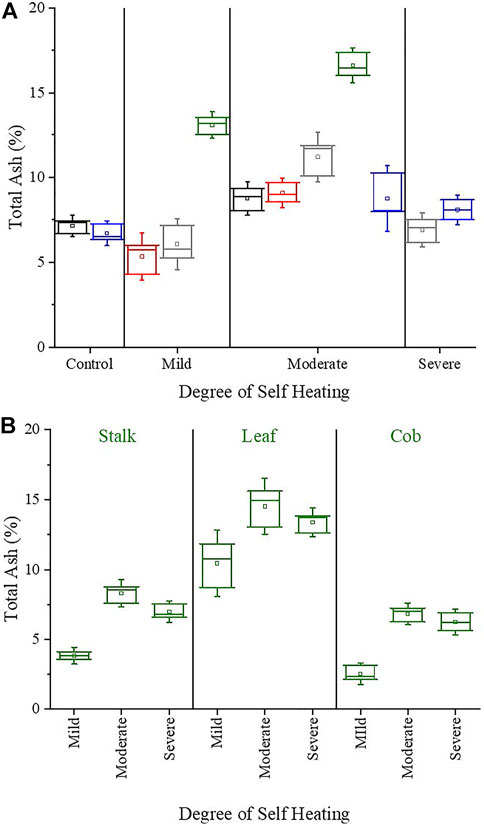
FIGURE 4. (A) Total ash measurements of bulk bale samples; □ Bale 1, □ Bale 2, □ Bale 3, □ Bale 5, □ Bale 6. (B) Total ash measurements of fractionated corn stover samples from Bale 5 [box upper and lower limit = data max. and min., whiskers = sample standard deviation (Coeff. 1.5), solid horizontal line = median, hollow internal box = mean].
3.3 Inverse Gas Chromatography Surface Energy
The intermolecular forces related to van der Waals (non-polar) interactions and Coulombic (polar) interactions are studied using surface energy characterization with inverse gas chromatography (IGC). The non-polar or van der Waals interactions are termed the dispersive surface energy component. The polar, or Coulombic interactions are referred to as the specific surface energy portion of the surface energy. These measurements offer fundamental thermodynamic insights that lead to predictions in surface compatibility, solubility, adhesion, cohesion, wettability (hydrophilicity/hydrophobicity), and adsorption capacity (Lloyd, 1994; Colorado and Lee, 2000; Etzler, 2003; Gérardin et al., 2007; Lee et al., 2008; Winandy and Shupe, 2010; Hubbe et al., 2015). Increased cohesion in corn stover is suspected to cause poor flow and agglomeration in bulk solids handling through rat-holing and arching in hoppers during conveyance operations (Leal et al., 2020; Ray et al., 2020).
Measured surface energies of a material are representative of the chemical composition of the surface exposed to the vapor probes. Inorganic material (ash content) on the surface of corn stover may result in higher values of surface energy as they generally present higher values (often greater than 1,000 mJ/m2) (Vitos et al., 1998). Another influence on surface energy that has been reported is particle size (Amara et al., 2012). However, that dependency can be misleading. Articles suggesting a dependency of surface energy on particle size are strictly measuring sub-micron particles (nano) composed of inorganic material. The corn stover particles measured in this study are of sizes ranging from 0.18 to 2.00 mm (50% greater than 0.5 mm) and carbonaceous. Surface energy dependency from particle size does not apply to these larger particles.
Surface energy units are energy per unit area of surface (i.e. mJ/m2). Therefore, if the chemical composition of the surface does not change there should be zero difference in surface energy between large and small particles. However, smaller particles often have different surface energy values compared to larger particles. There are a few explanations for this. During size reduction, particles often undergo energetic processes such as milling or grinding (Ho et al., 2012). These processes can create surface disorder, reduce crystallinity, expose preciously inaccessible interfaces, or cleave material in ways that favor one crystal plane over others (Heng et al., 2006; Jaffari et al., 2014; Shah et al., 2015). Nanoparticles may have different surface energy values as they may be composed of fewer crystal planes, or a dominant plane may be exposed compared to surfaces of larger particles (Heng et al., 2006; Ho et al., 2009; Smith et al., 2017).
3.3.1 Total Surface Energy
The bulk ground samples in Figure 3C, (bales 1, 2, 3, 5, and 6) show increases in total surface energy as the degree of self-heating increases. The average value was 108.07 mJ/m2 for this set of samples, and the range was 92.68–128.12 mJ/m2;
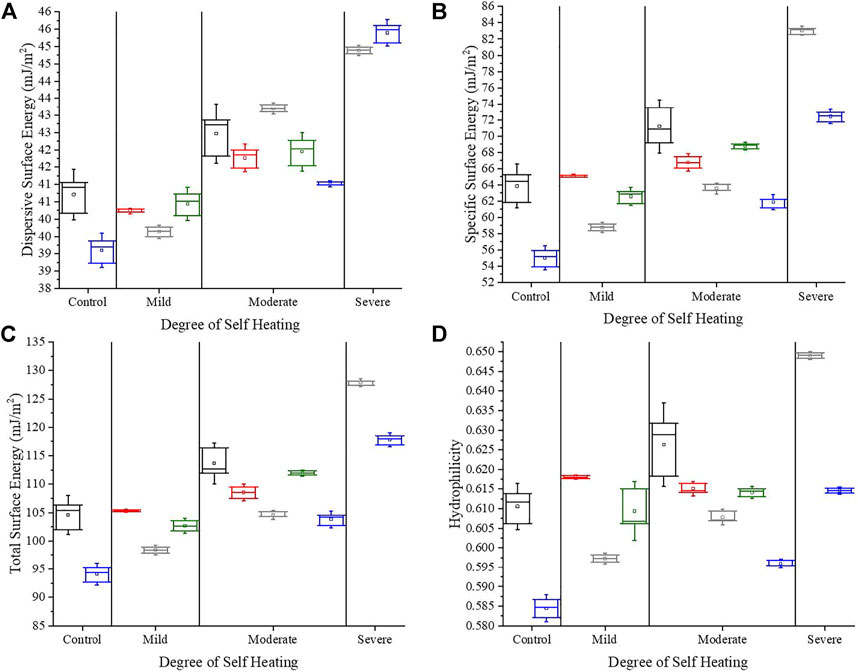
FIGURE 5. (A) Dispersive, (B) specific, (C) total surface energy and (D) hydrophilicity of bulk bale samples; □ Bale 1, □ Bale 2, □ Bale 3, □ Bale 5, □ Bale 6 [box upper and lower limit = data max. and min., whiskers = sample standard deviation (Coeff. 1.5), solid horizontal line = median, hollow internal box = mean].
3.3.2 Dispersive Surface Energy
The dispersive surface energy of the bulk ground samples of bales 1, 2, 3, 5, and 6 are displayed in Figure 5A. There is an observed increase in dispersive surface energy in all bales with increased degrees of self-heating. A measurable change in dispersive energy is an indicator of chemical changes to the surface, a change in the amount of apolar chemical species exposed per area. The self-heating may have caused migration of or movement of apolar portions to the surface resulting in an observed increase in dispersive surface energy. Bale 6, for example, shows an increase from 39.10 mJ/m2 (mild) to 45.40 mJ/m2 (severe), demonstrating the greatest change among the bales. Student t-tests reveal the changes in dispersive energy from self-heating to be significant among all bale samples (non-fractionated). The fractionated samples, with the exception of the cob (Figure 6A), increase monotonically as a function of self-heating. According to student t-tests all samples showed to be different from one another with the exception of the moderate (
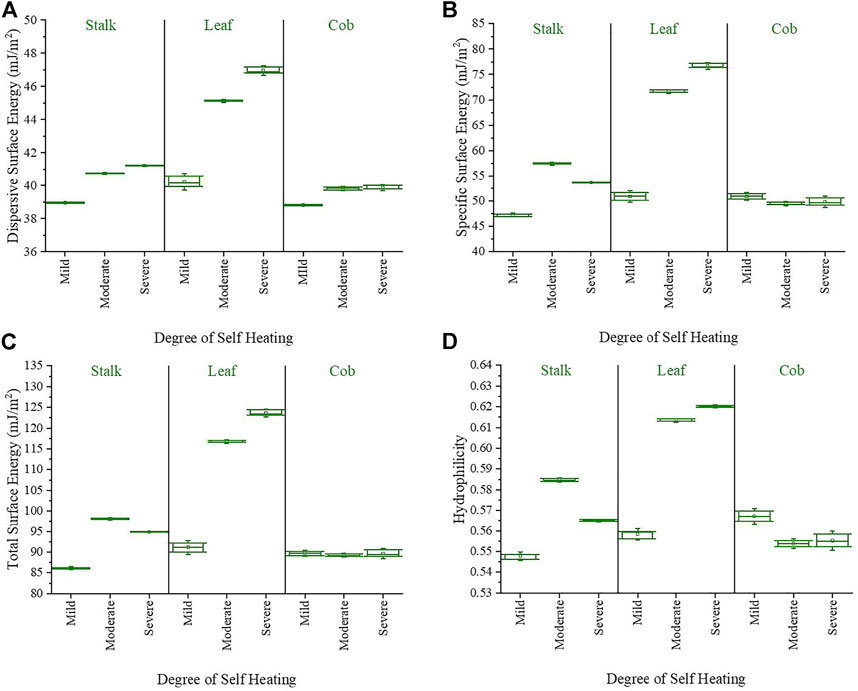
FIGURE 6. (A) Dispersive, (B) specific, (C) total surface energy, and (D) hydrophilicity of corn stover anatomically fractionated samples from Bale 5 [box upper and lower limit = data max. and min., whiskers = sample standard deviation (Coeff. 1.5), solid horizontal line = median, hollow internal box = mean].
3.3.3 Specific Surface Energy
Specific surface energy for bales 1, 2, 3, 5, and 6 are plotted against the degrees of self-heating in Figure 5B. Bales 3 and 6 severe samples measured at higher specific surface energies than those samples self-heated to a lesser degree. Student t-tests suggest self-heating significantly changes the specific surface energy of the samples in Figure 5B, with the exception of bale 2 mild (
3.3.3.1 Effects of Self-Heating on Acid/Base Values
Figures 7A,B display the acid and base surface energy values, respectively, which comprise the specific surface energy. Self-heating increased the acid sites (electron acceptors) on the surface except for bale 2, which experienced a decrease in acid sites from the mild to moderate self-heating. The basic sites (electron donators) were also observed to increase with self-heating, although the changes in bale 1 control (
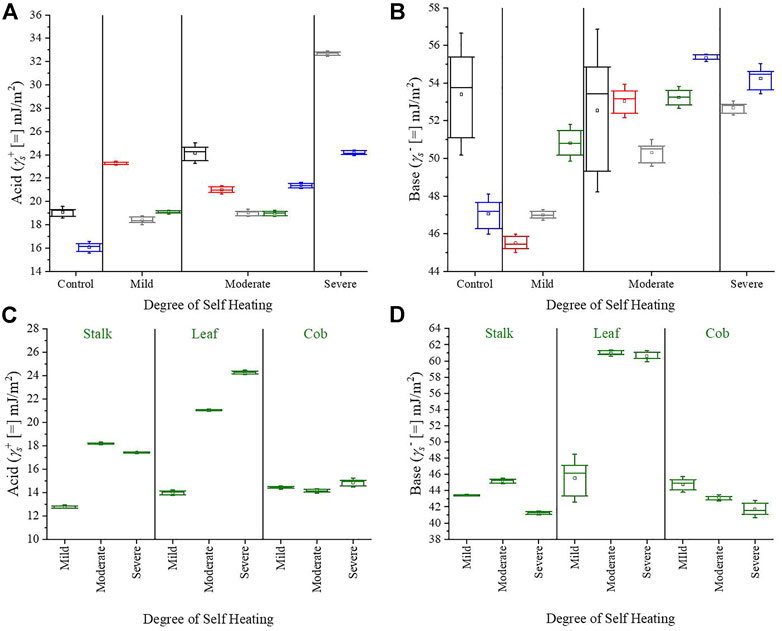
FIGURE 7. (A) Acid (bulk corn stover), (B) Base (bulk corn stover); □ Bale 1, □ Bale 2, □ Bale 3, □ Bale 5, □ Bale 6. (C) Acid (anatomical fractions), and (D) Base (anatomical fractions) contributions of surface energy with respect to degree of biological heating [box upper and lower limit = data max. and min., whiskers = sample standard deviation (Coeff. 1.5), solid horizontal line = median, hollow internal box = mean].
3.3.3.2 Ash Influence on Specific Surface Energy
The amounts of inorganic matter in biomass feedstocks can range widely based on harvesting practices, plant type, and storage. Plants naturally contain a physiological amount of inorganics that are vital to biological functions; these amounts can vary among plant types and are referred to as intrinsic ash content. Proximate analysis provides values of this physiological mineral content as a wt% of the dry biomass matter and are reported to be less than 10 wt. % on the average. High ash content (above 10%) in biomass feedstock is often attributed to practices and techniques in harvesting, handling and storage—these methods allow for the accumulation of extrinsic mineral/inorganic content such as dirt. The impacts of ash on the surface energy of corn stover has been found to significantly increase specific surface energy values in ash concentrations above 10% w/w (Leal et al., 2020). It was demonstrated that it is possible to wash out most of the ash over 10% w/w, suggesting that those inorganics were extrinsic, not intrinsic. Increases in surface energy translate into increased values of calculated hydrophilicity (section 3.3.4)—changes that may negatively affect material flowability properties. Figure 4A shows the variability of ash content in the bulk bale samples. Ash contents over 10% were observed only in the bale five mild, moderate and bale 3 moderate samples. These samples are a ground mix of stalk, leaf, and cob fractions and the mass distribution of each is uncertain. Amounts of ash increase in samples from control to mild or mild to moderate but decrease in bale 3 moderate to severe sample. The increase in ash may contribute to increases in surface energy, but in the case of bale 3 the ash content decreases from the moderate to severe self-heating, however the specific surface energy increases from ∼63 mJ/m2 to ∼84 mJ/m2. The increase in ash as a result of heating from mild to moderate is unclear and may be a result of a loss in organic mass during the heating or as a result of biological organismal consumption. Figure 4B illustrates the amount of ash measured in the mild, moderate and severely heated fractionated samples. Previously observed trends in non-degraded corn stover indicated a monotonic increase in surface energy with increasing ash content (mostly in increases of the acidic component of the surface) (Leal et al., 2020). The effects of self-heating have convoluted the interpretation of the aforementioned trend of surface energy and ash.
3.3.4 Wettability
Figure 5D shows self-heating did not affect the wettability of samples in bales 2 and 5. However, according to the calculated hydrophilicity, bales 1, 3, and 6 are predicted to have increased in wetting ability. Severe degradation of corn stover results in an increase in water extractive content, likely due to a disruption of the cell wall structural integrity (Li et al., 2020). Changes in the surface chemistry of the degraded corn stover, in addition to the disrupted cell wall integrity, may also contribute to the increase in water extracted content observed by Li et al. (2020). Functional groups on the right side in Table 3 are conducive to a hydrophobic surface, whereas the groups on the left side contribute to its hydrophilic nature. Without more information, it is unclear to whether an increase in oxygen to carbon ratio has occurred. Figure 6D shows a monotonic increase in calculated wettability of the leaf. The stalk fraction increased wettability with moderate self-heating, but further exposure to self-heating reversed the trend. Of all three fractions, the cob was the least affected by self-heating with respect to wettability. The cylindrical solid structure of the cob may have prevented the effects of degradation from reaching internal parts of the cob, restricting the changes to the surface, thus leaving the bulk of the cobs mass relatively unaffected. The overall implications on downstream processing may manifest themselves in slower drying times for fractions with higher wettability, or decreased moisture uptake rates for fractions with decreased wettability. The differences in wettability among the fractions and degrees of degradation can result in segregation, or clumping of the bulk material, causing issues with handling operations through biorefinery equipment (e.g., hoppers and screw feeders).
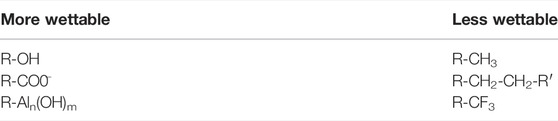
TABLE 3. Common functional groups contributing to wettability.
3.3.5 Work of Cohesion and Work of Adhesion
The calculated work of cohesion for bulk and fractionated corn stover samples can be observed in Figures 8A,C, respectively. Increases in cohesive forces were observed from the control to the severely heated bulk corn stover samples. Self-heating had the greatest effect on the leaf fraction of corn stover, and least on the cob.
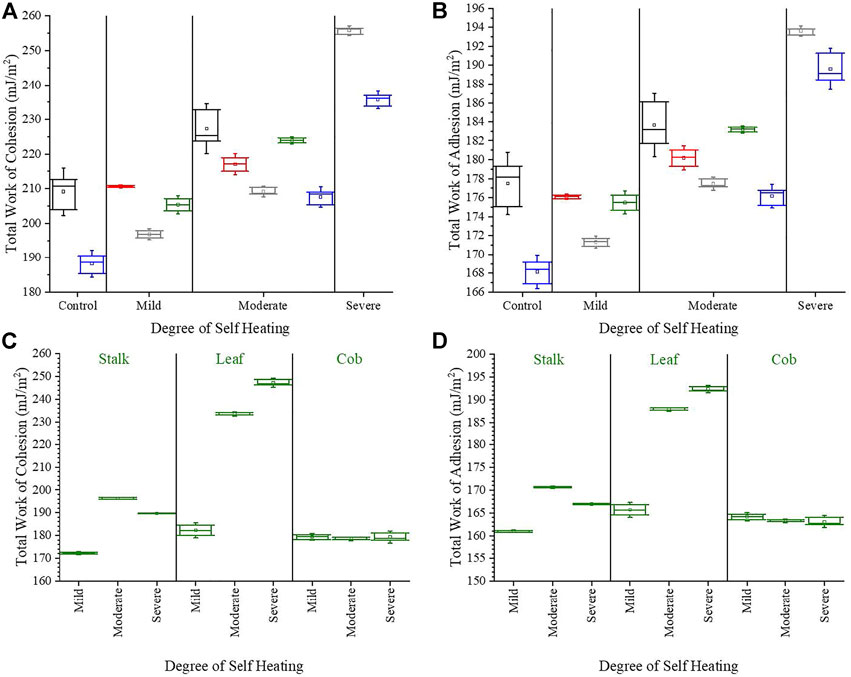
FIGURE 8. (A) Work of Cohesion, (B) Work of Adhesion, of bulk bale samples; □ Bale 1, □ Bale 2, □ Bale 3, □ Bale 5, □ Bale 6. (C) Work of Cohesion (anatomical fractions), and (D) Work of Adhesion (anatomical fractions) with respect to degree of biological heating [box upper and lower limit = data max. and min., whiskers = sample standard deviation (Coeff. 1.5), solid horizontal line = median, hollow internal box = mean].
Figures 8B,D display the work of adhesion (corn stover sample to liquid water) of both the bulk and fractionated corn stover samples. Using the vOCG scale, the trend in adhesion is similar to the work of cohesion (corn stover), but the values are overall lower. The average percent difference from work of cohesion to adhesion of the bulk samples increases with degrees of self-heating. Work of adhesion is 13.00% lower than work of cohesion in the control, 14.68% in the mild, 16.99% in the moderate, and 22.01% in the severe group. This indicates that self-heating produces a compounding effect on biomass feedstock via increases in water adsorption and particle cohesion, potentially resulting in rat-holing, arching, and poor flow in hoppers or jamming of screw feeders of biorefineries.
Eq. 11 implies that when comparing the two competing forces acting on a drop of water, if Φ is greater than one, the drop will spread easier because the net forces are in favor of adhesion. Figure 9 illustrates an observable monotonic increase in Φ with respect to biological self-heating. The authors understand this to be an oversimplified estimation of real-world phenomena where there are other factors to consider, e.g., surface roughness, hierarchal structures, heterogeneity, etc., which may positively or negatively affect the magnitude of IGC measured cohesion or adhesion. The simplicity of Φ offers a less abstract view of wettability and provides another method of evaluation for discussion.
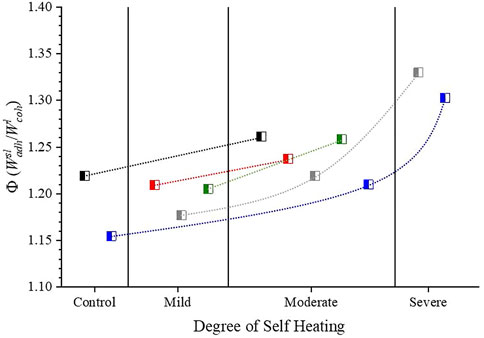
FIGURE 9. The ratio of the work of adhesion,
Further utility in the works of adhesion can be explored in the measurements of solid-solid interfaces involving biomass feedstock, for instance the surface of a hopper, or surface of a screw feeder where lower works of adhesion could prove optimal. Future work aims to couple flow behavior of biomass feedstock (rheological measurements) with surface energy for a direct evaluation of impacts (Cheng et al., 2021).
4 Conclusion
Biological degradation (a known source of feedstock variability) was shown to have pronounced impacts on the surface area, surface energy, wettability and cohesion of corn stover. The implications of biological degradation negatively impact not only the overall efficiency, conversion, and yields of integrated biorefineries; but also the operational reliability of bulk solids handling and transport of corn stover. Surface area is a critical material attribute that can be used as a proxy for the pretreatment reactivity; an increase in the corn stover surface area corresponds to an increase in the pretreatment conversion/reactivity. The surface area of the bulk corn stover samples increased with the degree of biological degradation. The leaf fraction was the most sensitive to biological degradation, resulting in an increase in surface area from 0.5 m2/g (mildly degraded) to 1.2 m2/g (severely degraded). In contrast, the surface area of the cob fraction remained relatively unaffected by the degree of biological degradation (i.e., mildly degraded–0.55 m2/g, severely degraded–0.40 m2/g).
All biologically degraded samples in this study resulted in significant changes to the surface chemistry (evidenced by an increase in surface energy). As a general trend, the surface energy of bulk corn stover increased with the degree of biological degradation—the same trend was observed for the leaf and stalk anatomical fractions; however, the surface energy for the cob fraction remained unchanged. Wettability (calculated from surface energy) is a characteristic property that impacts the overall efficiency and conversion of pretreatment processes—hydrophilic (i.e., wettable) materials lead to higher water-uptake rates (correlating to higher conversion rates) as compared to hydrophobic, or non-wettable materials. The wettability for bulk corn stover samples did not reveal any discernable trend with the degree of biological degradation. However, trends in wettability were observed for the anatomical fractions, with wettability increasing for the stalk and leaf fractions, and decreasing for the cob fraction. Excluding the cob fraction, the work of cohesion increased with the degree of biological degradation. The quantified impacts of biological degradation on the physiochemical and thermodynamic properties of corn stover presented in this study offer fundamental insights to improve the overall conversion, economics, and operational reliability of Integrated Biorefineries.
Data Availability Statement
The raw data supporting the conclusions of this article will be made available by the authors, without undue reservation.
Author Contributions
JL performed most of the experiments, EM assisted with a few surface area measurements, TS assisted JL with writing, RN and CM assisted in editing content. AR helped process and supply samples from INL.
Funding
This work was supported by the United States. Department of Energy, Bioenergy Technologies (BETO) Office as part of the FCIC: Feedstock Conversion Interface Consortium (CPS Agreement Number: 33740).
Conflict of Interest
The authors declare that the research was conducted in the absence of any commercial or financial relationships that could be construed as a potential conflict of interest.
Publisher’s Note
All claims expressed in this article are solely those of the authors and do not necessarily represent those of their affiliated organizations, or those of the publisher, the editors and the reviewers. Any product that may be evaluated in this article, or claim that may be made by its manufacturer, is not guaranteed or endorsed by the publisher.
Acknowledgments
The authors would like to thank all our colleagues in the FCIC and of the Bioenergy Technologies Office for their support on Feedstock-Conversion Interface Consortium R&D. We also thank Sergio Hernandez (INL Biomass Feedstock Characterization Researcher) and Dr. Daniel Burnett (Director of Science Strategy at Surface Measurement Systems). This research leveraged resources of the Biomass Feedstock National User Facility (BFNUF), which is a DOE Office of Energy Efficiency and Renewable Energy User Facility located at Idaho National Laboratory.
References
Agblevor, F. A., Besler, S., and Wiselogel, A. E. (1995). Fast Pyrolysis of Stored Biomass Feedstocks. Energy fuels. 9 (4), 635–640. doi:10.1021/ef00052a010
Amara, H., Nelayah, J., Creuze, J., Chmielewski, A., Alloyeau, D., Ricolleau, C., et al. (2012). Is There Really a Size Effect on the Surface Energy of Nanoparticles. [Internet]. Available from: https://hal.archives-ouvertes.fr/hal-03310351.
Biorefinery Optimization Workshop Summary, (2016). Biorefinery Optimization Workshop Summary Report. [Internet]. Chicago. [cited 2019 Mar 28]. Available from: https://www.energy.gov/sites/prod/files/2017/02/f34/biorefinery_optimization_workshop_summary_report.pdf.
Bonner, I. J., Smith, W. A., Einerson, J. J., and Kenney, K. L. (2014). Impact of Harvest Equipment on Ash Variability of Baled Corn Stover Biomass for Bioenergy. Bioenerg. Res. 7 (3), 845–855. doi:10.1007/s12155-014-9432-x
Bose, E., Leal, J. H., Hoover, A. N., Zeng, Y., Li, C., Ray, A. E., et al. (2020). Impacts of Biological Heating and Degradation during Bale Storage on the Surface Properties of Corn Stover. ACS Sustain. Chem. Eng. 8 (37). doi:10.1021/acssuschemeng.0c03356
Bradley, T. H., Baral, N. R., Davis, R., Baral, N. R., Davis, R., and Bradley, T. H. (2019). Supply and Value Chain Analysis of Mixed Biomass Feedstock Supply System for Lignocellulosic Sugar Production. Biofuels, Bioprod. Biorefining. 13 (3), 635–659.
Cheng, Z., Leal, J. H., Hartford, C. E., Carson, J. W., Donohoe, B. S., Craig, D. A., et al. (2021). Flow Behavior Characterization of Biomass Feedstocks. Powder Technol., 156–180. doi:10.1016/j.powtec.2021.04.004
Colorado, R., and Lee, T. R. (2000). Physical Organic Probes of Interfacial Wettability Reveal the Importance of Surface Dipole Effects. J. Phys. Org. Chem. 13 (12), 796–807. doi:10.1002/1099-1395(200012)13:12<796::aid-poc317>3.0.co;2-#
Eia, (2019). EIA Projects 28% Increase in World Energy Use by 2040 - Today in Energy. U.S. Energy Inf. Adm. [Internet]. [cited 2019 Mar 28]. Available from: https://www.eia.gov/todayinenergy/detail.php?id=32912.
Etzler, F. M. (2003). Characterisation of Surface Free Energies and Surface Chemistry of Solids. Contact angle, wettability adhesion 3, 219–263.
Fang, X., and Jia, L. (2012). Experimental Study on Ash Fusion Characteristics of Biomass. Bioresour. Technol. 104, 769–774. doi:10.1016/j.biortech.2011.11.055
Gérardin, P., Petrič, M., Petrissans, M., Lambert, J., and Ehrhrardt, J. J. (2007). Evolution of Wood Surface Free Energy after Heat Treatment. Polym. Degrad. Stab. 92 (4), 653–657.
Harmon, L., Hallen, R., Lilga, M., Heijstra, B., Palou-Rivera, I., and Handler, R. (2017). A Hybrid Catalytic Route to Fuels from Biomass Syngas. Golden, CO (United States).
Heng, J. Y. Y., Bismarck, A., Lee, A. F., Wilson, K., and Williams, D. R. (2006). Anisotropic Surface Energetics and Wettability of Macroscopic Form I Paracetamol Crystals. Langmuir 22 (6), 2760–2769. doi:10.1021/la0532407
Ho, R., Naderi, M., Heng, J. Y. Y., Williams, D. R., Thielmann, F., Bouza, P., et al. (2012). Effect of Milling on Particle Shape and Surface Energy Heterogeneity of Needle-Shaped Crystals. Pharm. Res. 29 (10), 2806–2816. doi:10.1007/s11095-012-0842-1
Ho, R., Wilson, D. A., and Heng, J. Y. Y. (2009). Crystal Habits and the Variation in Surface Energy Heterogeneity. Cryst. Growth & Des. 9 (11), 4907–4911. doi:10.1021/cg900696f
Hubbe, M. A., Gardner, D. J., and Shen, W. (2015). Contact Angles and Wettability of Cellulosic Surfaces: A Review of Proposed Mechanisms and Test Strategies. BioResources 10 (4), 8657–8749. doi:10.15376/biores.10.4.hubbe_gardner_shen
Ishizawa, C. I., Davis, M. F., Schell, D. F., and Johnson, D. K. (2007). Porosity and its Effect on the Digestibility of Dilute Sulfuric Acid Pretreated Corn Stover. J. Agric. Food Chem. 55 (7), 2575–2581. doi:10.1021/jf062131a
Jaffari, S., Forbes, B., Collins, E., Khoo, J., Martin, G. P., and Murnane, D. (2014). Evidence for the Existence of Powder Sub-populations in Micronized Materials: Aerodynamic Size-Fractions of Aerosolized Powders Possess Distinct Physicochemical Properties. Pharm. Res. 31 (12), 3251–3264. doi:10.1007/s11095-014-1414-3
K. J. Shinners, K. J. K. J., G. C. Boettcher, G. C., D. S. Hoffman, D. S. D. S., J. T. Munk, J. T., R. E. Muck, R. E., and P. J. Weimer, P. J. (2009). Single-Pass Harvest of Corn Grain and Stover: Performance of Three Harvester Configurations. Trans. ASABE 52 (1), 51–60. doi:10.13031/2013.25940
Kumar, A., Wang, L., Dzenis, Y. A., Jones, D. D., and Hanna, M. A. (2008). Thermogravimetric Characterization of Corn Stover as Gasification and Pyrolysis Feedstock. Biomass Bioenergy 32 (5), 460–467. doi:10.1016/j.biombioe.2007.11.004
Lacey, J. A., Aston, J. E., and Thompson, V. S. (2018). Wear Properties of Ash Minerals in Biomass. Front. Energy Res. 6, 119. doi:10.3389/fenrg.2018.00119
Lacey, J. A., Emerson, R. M., Thompson, D. N., and Westover, T. L. (2016). Ash Reduction Strategies in Corn Stover Facilitated by Anatomical and Size Fractionation. Biomass Bioenergy 90, 173–180. doi:10.1016/j.biombioe.2016.04.006
Langholtz, M., Stokes, B., and Eaton, L. (20162016). 2016 Billion-Ton Report: Advancing Domestic Resources for a Thriving Bioeconomy (Executive Summary). Ind. Biotechnol. 12 (5), 282–289. doi:10.1089/ind.2016.29051.doe
Leal, J. H., Torres, E. L., Rouse, W. T., Moore, C. M., Sutton, A. D., Hoover, A. N., et al. (2020). Impacts of Inorganic Material (Total Ash) on Surface Energy, Wettability, and Cohesion of Corn Stover.
Leal, J. H., Moore, C. M., Sutton, A. D., and Semelsberger, T. A. (2019). Surface Energy of Air Fractionated Corn Stover. Industrial Crops Prod. 137, 628–635. doi:10.1016/j.indcrop.2019.05.046
Lee, S., Park, J.-S., and Lee, T. R. (2008). The Wettability of Fluoropolymer Surfaces: Influence of Surface Dipoles. Langmuir 24 (9), 4817–4826. doi:10.1021/la700902h
Li, C., Kerner, P., Williams, C. L., Hoover, A., and Ray, A. E. (2020). Characterization and Localization of Dynamic Cell Wall Structure and Inorganic Species Variability in Harvested and Stored Corn Stover Fractions as Functions of Biological Degradation. ACS Sustain. Chem. Eng. 8 (18), 6924–6934. doi:10.1021/acssuschemeng.9b06977
Liu, Z.-H., Qin, L., Li, B.-Z., and Yuan, Y.-J. (2014). Physical and Chemical Characterizations of Corn Stover from Leading Pretreatment Methods and Effects on Enzymatic Hydrolysis. ACS Sustain. Chem. Eng. 3 (1), 140–146. doi:10.1021/sc500637c
Lizotte, P.-L., Savoie, P., and De Champlain, A. (2015). Ash Content and Calorific Energy of Corn Stover Components in Eastern Canada. Energies 88 (6), 48274827–48483838. doi:10.3390/en8064827
Lloyd, T. B. (1994). Experimental Procedures to Characterize Acid-Base and Dispersion Force Contributions to Solid Wettability A Review. Colloids Surfaces A Physicochem. Eng. Aspects 93 (C), 25–37. doi:10.1016/0927-7757(94)02907-5
Nagle, N. J., Donohoe, B. S., Wolfrum, E. J., Kuhn, E. M., Haas, T. J., Ray, A. E., et al. (2020). Chemical and Structural Changes in Corn Stover after Ensiling: Influence on Bioconversion. Front. Bioeng. Biotechnol. 8, 739. doi:10.3389/fbioe.2020.00739
Perlack, R. D. (2005). Biomass as Feedstock for a Bioenergy and Bioproducts Industry: The Technical Feasability of a Billion-Ton Annual Supply. Oak Ridge, TN: Oak Ridge National Laboratory.
Perlack, R. D., Eaton, L. M., and Langholtz, M. H. (2011). US Billion Ton Update: Biomass Supply for a Bioenergy and Bioproducts Industry (Executive Summary). Ind. Biotechnol. 7 (5), 375–380.
Ray, A. E., Williams, C. L., Hoover, A. N., Li, C., Sale, K. L., Emerson, R. M., et al. (2020). Multiscale Characterization of Lignocellulosic Biomass Variability and its Implications to Preprocessing and Conversion: A Case Study for Corn Stover. ACS Sustain. Chem. Eng. 8 (8), 3218–3230. doi:10.1021/acssuschemeng.9b06763
Renewable Energy Sources, (2019). Energy Explained, Your Guide to Understanding Energy. Energy Inf. Adm. [Internet]. [cited 2019 Mar 28]. Available from: https://www.eia.gov/energyexplained/?page=renewable_home.
Searcy, E., Lamers, P., Hansen, J., Jacobson, J., Hess, R., and Webb, E. (2015). Advanced Feedstock Supply System Validation Workshop. United States: Golden, CO.
Shah, U. V., Olusanmi, D., Narang, A. S., Hussain, M. A., Tobyn, M. J., Hinder, S. J., et al. (2015). Decoupling the Contribution of Surface Energy and Surface Area on the Cohesion of Pharmaceutical Powders. Pharm. Res. 32 (1), 248–259. doi:10.1007/s11095-014-1459-3
Shinners, K. J., Wepner, A. D., Muck, R. E., and Weimer, P. J. (2011). Aerobic and Anaerobic Storage of Single-Pass, Chopped Corn Stover. Bioenerg. Res. 4 (1), 61–75. doi:10.1007/s12155-010-9101-7
Smith, R. R., Shah, U. V., Parambil, J. V., Burnett, D. J., Thielmann, F., and Heng, J. Y. Y. (2017). The Effect of Polymorphism on Surface Energetics of D-Mannitol Polymorphs. Aaps J. 19 (1), 103–109. doi:10.1208/s12248-016-9978-y
Smith, W. A., Bonner, I. J., Kenney, K. L., Wendt, L. M., Smith, W. A., Bonner, I. J., et al. (2014). Practical Considerations of Moisture in Baled Biomass Feedstocks Practical Considerations of Moisture in Baled Biomass Feedstocks, 7269.
Smith, W. A., Wendt, L. M., Bonner, I. J., and Murphy, J. A. (2020). Effects of Storage Moisture Content on Corn Stover Biomass Stability, Composition, and Conversion Efficacy. Front. Bioeng. Biotechnol. 8, 716. doi:10.3389/fbioe.2020.00716
Turhollow, A., Perlack, R., Eaton, L., Langholtz, M., Brandt, C., Downing, M., et al. (2014). The Updated Billion-Ton Resource Assessment. Biomass Bioenergy 70,149–164. doi:10.1016/j.biombioe.2014.09.007
Vitos, L., Ruban, A. v., Skriver, H. L., and Kollár, J. (1998). The Surface Energy of Metals. Surf. Sci., 411 (1–2), 186–202. doi:10.1016/s0039-6028(98)00363-x
Weiss, N. D., Farmer, J. D., and Schell, D. J. (2010). Impact of Corn Stover Composition on Hemicellulose Conversion during Dilute Acid Pretreatment and Enzymatic Cellulose Digestibility of the Pretreated Solids. Bioresour. Technol. 101 (2), 674–678. doi:10.1016/j.biortech.2009.08.082
Werther, J., Saenger, M., Hartge, E.-U., Ogada, T., and Siagi, Z. (2000). Combustion of Agricultural Residues. Prog. Energy Combust. Sci. 26 (1), 1–27. doi:10.1016/s0360-1285(99)00005-2
Winandy, J. E., and Shupe, T. F. (2010). FROM HYDROPHILICITY to HYDROPHOBICITY : A CRITICAL REVIEW : PART I . WETTABILITY and SURFACE BEHAVIOR Cheng Piao. Wood Fiber 42 (4), 490–510.
Woźniak, M., Ratajczak, I., Wojcieszak, D., Waśkiewicz, A., Szentner, K., Przybył, J., et al. (2021). Chemical and Structural Characterization of Maize Stover Fractions in Aspect of its Possible Applications. Materials 14 (6).
Xiong, S., Burvall, J., Örberg, H., Kalen, G., Thyrel, M., Öhman, M., et al. (2008). Slagging Characteristics during Combustion of Corn Stovers with and without Kaolin and Calcite. Energy fuels. 22 (5), 3465–3470. doi:10.1021/ef700718j
Keywords: surface energy, biological heating, degradation, corn stover, cohesion, wettability
Citation: Leal JH, Meierdierks EJ, Navar R, Moore CM, Ray AE and Semelsberger TA (2022) Impacts of Biologically Induced Degradation on Surface Energy, Wettability, and Cohesion of Corn Stover. Front. Energy Res. 10:868019. doi: 10.3389/fenrg.2022.868019
Received: 01 February 2022; Accepted: 13 June 2022;
Published: 14 July 2022.
Edited by:
Umakanta Jena, New Mexico State University, United StatesReviewed by:
Macmanus Ndukwu, Michael Okpara University of Agriculture, NigeriaJian Zhang, East China University of Science and Technology, China
Copyright © 2022 Leal, Meierdierks, Navar, Moore, Ray and Semelsberger. This is an open-access article distributed under the terms of the Creative Commons Attribution License (CC BY). The use, distribution or reproduction in other forums is permitted, provided the original author(s) and the copyright owner(s) are credited and that the original publication in this journal is cited, in accordance with accepted academic practice. No use, distribution or reproduction is permitted which does not comply with these terms.
*Correspondence: Juan H. Leal, amhsZWFsQGxhbmwuZ292; Troy A. Semelsberger, dHJveUBsYW5sLmdvdg==