 Wei Guo1
 Ziheng Pu
 Lang Quan
- 1State Grid Beijing Electric Power Research Institute, Beijing, China
- 2College of Electrical Engineering and New Energy, China Three Gorges University, Yichang, China
With the continuous expansion of urban cable scale and the increase in service time, the fire accident risk of cable tunnels also increases. Defects in the configuration of fire prevention measures lead to many fire accidents and seriously affect the reliability of power supply. First, the detection data of a typical tunnel fire accident are analyzed in this study. The results show that the main problems are the unreasonable installation position of fire extinguishers, the lack of fire prevention measures between intermediate joints, and the insufficient fire prevention performance of interlayer fire barriers. Then, the field test of cable tunnel fire is carried out in a cable tunnel to be put into operation. The test data show that the high-temperature area is mainly concentrated on the top of the tunnel, and the insufficient suspension height of the fire extinguisher will affect the trigger time. The energy of a short circuit accident is large, the cable burns and spreads rapidly, and the delayed triggering may lead to large fire to extinguish effectively. Comparing the simulation and test results of abnormal characteristic parameters in fire, the temperature error is less than 4%. The fire power development curve is obtained through simulation, and the burner power is set to test the fire prevention and extinguishing devices. Finally, the optimal configuration scheme of the fire anomaly data detection equipment and fire-extinguishing products is proposed. The temperature drop rate increases by 135%.
Introduction
In recent years, the cable utilization rate in the core area of megacities has reached 100%. Cables of multiple transmission circuits in key areas are laid in the same tunnel. If one cable is on fire, other lines will be directly exposed to the fire. Even flame-retardant cables will produce insulation deterioration and breakdown under long-term burning and then become a new fire source (Yan et al., 2018). At the same time, non-flame-retardant distribution power cables or optical cables are often laid in the main cable tunnels. It will also be ignited and cause the fire to burn continuously. Therefore, in case of fire in the tunnel, it is very easy to cause all cables and optical cables in the same channel to burn. The load of the whole transmission channel is lost, which may lead to large-scale power failure in the city. In order to monitor the tunnel fire, optical fiber temperature measurement, smoke sensor, and other detection devices are installed. Some new important cable tunnels are also equipped with intelligent inspection devices and video monitoring (Shen et al., 2021; Yang et al., 2021a; Yang et al., 2021b). With the application of the artificial intelligence algorithm in the power system, some fire prediction methods have also been proposed. The cable tunnel is long and narrow, the entrance is small, and the space is sealed. In case of fire, firefighters cannot enter to carry out routine firefighting. Therefore, firefighting products such as fire extinguishers, fire barriers, and fireproof tapes are used in cable tunnels. However, due to the lack of research on the combustion characteristics of tunnel fire, the configuration of some tunnel firefighting products built in the early stage is unreasonable. Moreover, the short circuit energy of high-voltage cables is huge, the fire develops rapidly, and the performance of some firefighting products is not enough to deal with it. It is necessary to analyze the abnormal data of typical tunnel fire accidents to determine the causes of accidents and the deficiencies of fire prevention and extinguishing measures, and to further put forward improvement schemes.
The main causes of fire in cable tunnels are high temperature caused by excessive line load or excessive short circuit current; partial insulation damage and discharge arc ignition caused by overvoltage; and the fault of cable grounding system leads to sheath suspension potential breakdown and long-term small current discharge (Dong et al., 2017). After the fire accident in the cable tunnel, due to the long and narrow seal and the accumulation of a large amount of toxic smoke, it is difficult for personnel to enter and extinguish the fire from the outside (Wang et al., 2017; Liang et al., 2019; Song et al., 2020). It is easy to spread and causes great economic losses. The alarm time of different detectors is obtained by tests (Liu X et al., 2021). The alarm characteristics of fire detectors with different sensitivities are simulated and analyzed, which provide a reference for selecting sensors with extra sensitivity and designing fire-monitoring systems in cable tunnels. Zhang and Zhao (2020) combined test and simulation and concluded that closing the fire door after a fire and adopting mechanical ventilation can effectively control the fire. The establishment of a test platform confirmed the feasibility of liquid nitrogen fire extinguishing in a cable tunnel (Guo et al., 2020). Liu Y et al. (2021) conducted water mist fire-extinguishing tests and found that the greater the flow or velocity, the stronger the inhibition effect on the total firepower of cable tunnel. Li et al. (2018) analyzed the fire development law of cable tunnels under different fire spacing and found that a fire spacing of no more than 500 m is conducive to controlling the fire development and ventilation after fire extinguishing. Mi et al. (2020) simulated different combinations of ventilation modes, automatic fire-extinguishing systems, and fire doors to effectively control the smoke propagation in the tunnel and help people evacuate immediately. However, the aforementioned studies mostly analyzed a single fire prevention measure and did not consider the characteristics of a high-voltage cable channel. Due to the lack of comprehensive configuration of various fire-extinguishing measures, the fire risk of the high-voltage cable tunnel is still high.
In order to configure fire prevention and extinguishing measures more reasonably, it is necessary to obtain the development characteristics of high-voltage cable tunnel fire. The research of tunnel fire is mostly simulation analysis. However, because it is difficult to determine the relevant combustion parameters, there are some differences between the simulated data and the actual combustion data of the high-voltage cable tunnel. The research on the fire prevention effect of fire prevention and extinguishing measures needs experimental verification. Zhu et al. (2019) conducted the fire test of reduced size cable tunnels. It was found that within 200–600 s, the combustion time of the cable was 23%, the mass loss was 75%, and the transverse temperature distribution in the range of 0–90 degrees of the tunnel was obtained. An et al. (2020) studied the effects of layer spacing and cable spacing on flame characteristics and the risk of multilayer cables. It was found that the flame height increased with the increase in layer spacing, and the flame width decreased with the increase in cable spacing. Fire tests were carried out in a reduced cable tunnel under different oxygen concentrations (Xu et al., 2021). It was found that different combustion parameters changed under different oxygen concentrations, and there were two temperature peaks on the section, which were directly above the fire source. It is found that in the case of fire in a cable tunnel, the highest position of ceiling temperature has nothing to do with the cable inclination (An et al., 2021). When the cable inclination is less than 15°, the highest ceiling temperature further increases. However, the aforementioned research is mostly carried out in a laboratory or a reduced scale platform, which is different from the actual high-voltage cable tunnel. If the test is carried out in a typical actual tunnel, more reference test data can be provided.
First, combined with the monitoring data of typical cable tunnel fire accidents, this study analyzes the causes and development of fire. More targeted studies pointed out the shortcomings of fire prevention and extinguishing measures of high-voltage cable tunnels. Then, in order to obtain the characteristics of cable combustion spread and detection data in the cable tunnel, the field test of cable fire is carried out in a cable tunnel to be put into operation. The obtained data are more real and effective, and the simulation model can be verified and modified. At the same time, the fire test of firefighting products such as fire extinguishers and fire barriers were carried out in the tunnel. Finally, the optimal configuration scheme of fire anomaly data detection equipment and firefighting products is proposed according to the test and simulation data. The comprehensive effects of various fire prevention and extinguishing products are considered.
Abnormal Data Analysis of Tunnel Fire Accidents
Cause Analysis of Fire Accident in Cable Tunnel
According to incomplete statistics, about 200 cable lines have been tripped due to cable tunnel fires in the past 4 years. Most of the tunnel fires are caused by joint failure. In particular, cables with a voltage of 110 kV and above cause huge economic losses after failure. This study takes a fire accident caused by a 220 kV intermediate joint fault as an example. The scene of the cable combustion accident is shown in Figure 1. In case of breakdown, the copper shell of the intermediate joint has burst and the intermediate joint has been seriously burnt. Although the outer sheaths of the other two phases of cables in the same circuit adjacent to them are flame-retardant materials, they are still seriously ablated, and the aluminum sheaths of the inner layer are exposed to varying degrees. The cross-linked polyethylene material inside the failed intermediate joint started to melt after combustion and dropped onto the 220 kV cable of another circuit below, which damaged the outer sheath, but did not cause open fire, and the inner aluminum sheath was not exposed and damaged. The fire barrier above the intermediate joint was burnt out for about 6 m, and all the communication cables laid inside were burnt out. The fire barrier has not played its due role, and the fireproof performance needs to be tested.
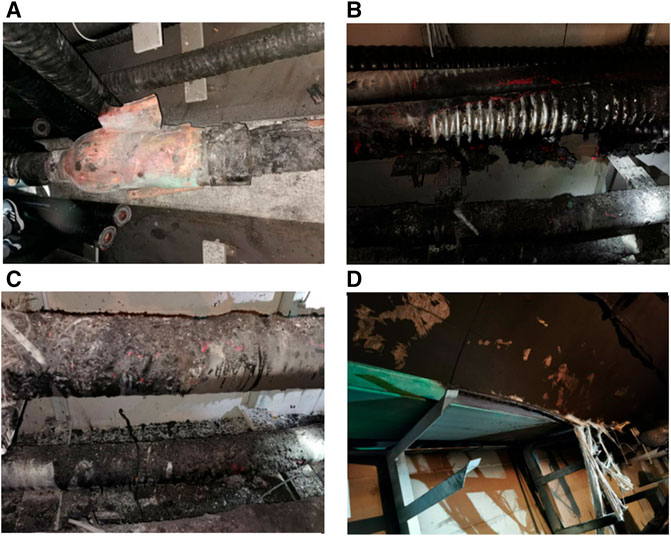
FIGURE 1. Field conditions of cable tunnel with fire accident (A) accident intermediate joint (B) adjacent phase cables in the same circuit (C) another circuit cable in the lower layer (D) fire barrier above.
The cable intermediate joint is disassembled for analysis. There are 33-cm-long cracks in the copper shell of the cable intermediate joint. The exposed insulating rubber parts have obvious breakdown holes. After the metal copper shell was cut off, it was found that the insulating rubber parts were ablated in a large area, and the length of the ablation area was up to 50 cm. The insulating rubber parts are cut to observe the breakdown position of the cable body and the breakdown position of the corresponding insulating rubber parts. The fault breakdown is the radial breakdown of insulating rubber parts, and the starting position of high voltage is the end of the wire core shield. After the semiconductive tape outside the shield at the cable core is stripped, obvious ablation can be found at the edge of the shield. When insulating rubber part is cut along the axial direction of the fault breakdown position, the breakdown path can be observed. It can be seen that the diameter of the breakdown hole is about 10 mm, and the position of the breakdown path is consistent with the position of the mold joint of the semiconductive layer in the insulating rubber part. There are impurities on the surface of the semiconductive layer in some insulating rubber parts, which may cause partial discharge.
According to the statistical analysis of similar faults, there have been 13 breakdown faults of silicone rubber intermediate joints of 110 kV and above voltage levels of the same manufacturer since 2014. There are 11 breakdown faults during power transmission and closing, and 2 breakdown faults during voltage withstand tests. The causes of the breakdown faults were analyzed. There are 10 failures caused by the breeding of electric trees in insulating rubber parts. There are 2 failures caused by construction quality problems. The cause of another accident is unknown. The operation time of cable joints in these 13 accidents is counted, as shown in Figure 2. The operation time of the 69.2% faulty cable is 3 years. This is consistent with the development law of actual cable insulation defects. During the initial operation of 1–2 years, insulation defects continue to develop. To a certain extent in the third year, breakdown accidents are prone to occur with overvoltage. For cables without obvious defects, the insulation aging does not gradually produce defects until 6 years of operation, resulting in breakdown. The investigation and analysis show that the cable intermediate joint faults all occur in the power transmission and closing stage. The main reasons are insulation defects of insulating rubber parts, insufficient insulation margin, and breakdown caused by operating overvoltage during closing. It is necessary to improve the process of intermediate joints of similar manufacturers to avoid insulation defects of intermediate joints.

FIGURE 2. Statistical analysis of operation time of typical accident cables.
Analysis of Monitoring Data in Tunnel
First, the fault time is determined according to the voltage and current waveform of fault recording. The fault is a phase C short circuit fault, which occurred at 12:08:51 and lasted for 0.04 s. During the fault, the phase C voltage drops to 16.61 kV and the maximum fault current is 13.37 kA. The system returns to normal after an oscillation of 0.04 s. Due to the short fault duration, the monitoring system did not collect the grounding current value at the time of fault occurrence. The grounding current of each phase of the fault circuit collected by the monitoring system before and after the fault is within 13 A. According to the simulation calculation of the induced current of the metal sheath of 220 kV double circuit cable, the grounding current is about 10 A under different loads and laying methods. The monitored grounding current data are normal.
The optical fiber temperature data within 5 h before and after the fault are shown in Figure 3. The sampling rate of the optical fiber temperature measurement on-line monitoring system is about 5 min/time. The system does not collect the instantaneous temperature rise process at the time of fault discharge (12:08). The temperature before (12:05) and after (12:10) the time of fault is 35°C, and the measured temperature data are normal. From the time of failure (12:08) to the starting time of temperature rise displayed by optical fiber temperature measurement (12:15), the temperature measurement data are normal. It is judged that this stage is the ignition stage of the phase C cable, and the phase B cable has not been ignited. The temperature measurement optical fiber is arranged in the phase B cable, so the temperature data are unchanged. During the period when the optical fiber temperature measurement data increased from 34.97°C (12:15) to 515.01°C (13:01), the temperature value generally showed a sharp upward trend. It is judged that this stage is the combustion stage of the phase C cable, and the peaks occurred successively during this stage. In the following 156 min (to 15:36), the optical fiber temperature measurement value was maintained at 360°C, and it was judged that the combustion of the phase C cable was extinguished at this time. Combined with the field analysis, the upper fireproof slot box of the cable is ignited during the cable combustion, and the high temperature measured by the optical fiber is caused by the slot box combustion. After 15:36, the oxygen content in the tunnel space was insufficient to maintain the continuous combustion of the tank box, all the flames in the tunnel were extinguished, and the temperature measurement data returned to normal. The two temperature drop areas are due to the action of fire extinguishers separated by a certain distance, which has a certain cooling effect. However, due to the long trigger time of fire extinguishers and insufficient distance, the flame is not completely extinguished. The area near the middle joint of the cable is reignited. This indicates that the layout of fire extinguishers needs to be optimized.
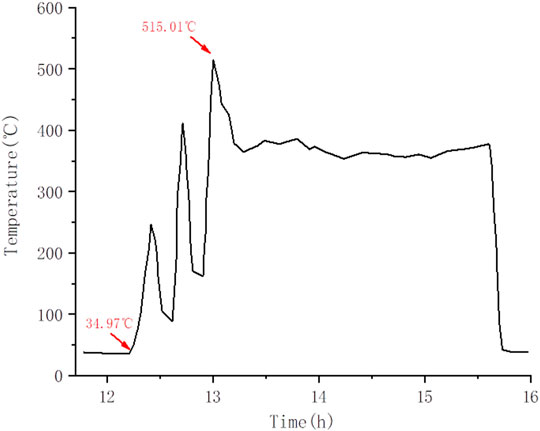
FIGURE 3. Optical fiber temperature measurement data of cable tunnel fire accident.
Field Test of Simulated Fire in Cable Tunnel
Test Equipment Layout and Test Method
A tunnel to be put into operation was selected for the cable fire test. The tunnel section is 2.1 m high and 2 m wide. The cable tunnel area for testing is between two cable tunnel shafts, with a total length of 140 m, and there is a ventilation shaft in the middle, as shown in Figure 4. The fire source is arranged 30 m to the south of the ventilation shaft. It mainly tests the monitoring data of intermediate joint in case of fire. Four monitoring points are set at 3 m and 6 m on both sides of the fire source for the measurement of CO, CO2, and flue gas concentration data. The temperature data need to analyze the difference in different heights. Four monitoring points are arranged on both sides of the fire source, and the height of the monitoring points is from 1.5 to 1.9 m. The specific layout inside the tunnel is shown in Figure 5. It can also be seen that there are six layers of supports in the tunnel, including 220 kV cables placed for the second time and 110 kV cables placed on the third and fourth layers. The left side of the figure shows the test layout without fire prevention measures. On the right side is a comparative test arrangement with fire barriers.
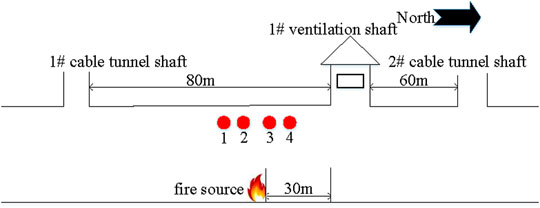
FIGURE 4. Tunnel structure and overall layout for field test.

FIGURE 5. Specific layout inside the tunnel.
The main equipment of the test includes a simulated fire source system and characteristic data monitoring system. Combined with relevant standards, a set of fire source device with remote control ignition and adjustable power is developed in this study. The fire source system mainly includes propane gas supply device, flowmeter, control valve, anti-backfire device, fireproof metal pipe, burner, and wireless ignition device. The power regulation of fire source is feedback controlled by a flowmeter and control valve. At the same time, the ignition source can be controlled off after the cable ignition is completed. In order to ensure the signal acceptance of the wireless ignition device in the underground tunnel, signal repeaters are installed at the tunnel shaft and in the tunnel. The characteristic data of cable combustion mainly include temperature, CO, CO2, and flue gas concentration. CO concentration in gas is one of the effective characteristic quantities of fire gas in fire detection. CO2 is the main product of most polymer combustion, and its concentration can characterize the scale of fire. The fire smoke particles vary in size, and the diameter range generated by complete combustion is concentrated below 1 um. Here, the cable combustion is incomplete combustion, and the particles are large. The PM10 sensor is used to monitor the smoke concentration. The main technical parameters of the sensor used are as follows: CO sensor, range 0–1000 ppm, resolution 0.1 ppm; CO2 sensor, range 0–5000 ppm, resolution 50 ppm; and PM10 sensor, range 0–1999 ug/m3, resolution 0.3–10 um. CO, CO2, and PM10 sensors are integrated. Three prevention treatments and sheet metal shells are installed to adapt to the harsh environment of the cable tunnel. The shell opening channel can effectively collect tunnel data. There are many temperature acquisition points, and the K-type thermocouple matrix is used for acquisition. All collected characteristic data are monitored online through the RS485 communication module and uploaded to supporting software. All data can be displayed and stored in real time.
Considering the fire caused by the simulated cable discharge fault, the test method is as follows: the burner is placed under the lowest support, the cable is cut off, the insulating layer is exposed; the ventilation is adjusted to simulate different arc power to ignite the cable; the fire source is turned off after igniting for a period of time, the cable continues to burn; the combustion situation is video-recorded; the characteristic parameters such as temperature and gas are collected and recorded through a monitoring device; the tunnel is filled with dry ice to extinguish the fire after completing the combustion test, and air extraction and tail gas treatment are carried out to ensure that the air in the tunnel meets the entry requirements of personnel before going down the well.
Monitoring Data Analysis of Tunnel Fire Test
The development of cable combustion in the tunnel is shown in Figure 6. After the burner is ignited, the 220 kV cable on the second layer support is ignited within 5S. The outer sheath begins to undergo pyrolysis under the influence of high temperature, resulting in a variety of gas products such as alkanes, olefins, and chlorinated products. These products are mixed with air for combustion, and the flame height increases rapidly. The insulating layer is cut and exposed to simulate the joint breakdown fault. The insulating layer is made of XLPE, which is flammable. At high temperature, the XLPE will melt and fall, resulting in obvious flame on the ground. A large amount of heat and flue gas are generated by combustion and gradually diffused. After the 220 kV cable is completely burned, the 110 kV cable on the upper layer is further ignited. Finally, the test cables are fully burned to form a stable flame area.

FIGURE 6. Development of cable combustion in tunnel.
The relevant data of the fire test are collected in real time. The gas monitoring data of two monitoring points, which are 3 m away from the fire source, are analyzed as an example. The variation curve of CO and CO2 concentration is shown in Figure 7. The CO2 gas concentration increased continuously in the initial stage and exceeded 5,000 ppm in 55 s. CO2 in the initial stage is mainly produced by a propane burner. After the 220 kV cable is ignited, the burner is closed. At this time, CO2 is mainly generated by the combustion of the cable. In the initial stage, oxygen is sufficient, and the propane burner burns completely to produce very little CO. CO is mainly produced by pyrolysis combustion of the cable outer sheath and insulating layer. After the cable is ignited, insufficient initial pyrolysis will produce a large amount of CO. The CO content increased to 20 ppm in 15 s. Then the temperature increases rapidly, the pyrolysis of CO is fully burnt, and the CO content enters the slow growth stage. The combustion range expanded in about 45 s, more cables were not fully pyrolyzed, and the CO content increased rapidly again, reaching 90 ppm in 60 s. The variation curve of flue gas particle concentration is shown in Figure 8. In the first 10 s, the combustion causes the temperature in the fire source area to increase sharply, forming a local high-temperature area. With the acceleration of air flow, some stationary particles begin to diffuse under the action of thermal convection. The flame-retardant characteristics of the cable sheath led to a large number of smoke particles, the diameter of which is greater than 2.5 μm accounting for the main proportion. These particles form a layer of hot smoke at the top of the tunnel. The measured concentration quickly exceeds 1800 ug/m, and the smoke 3concentration reaches the maximum range of the sensor within 45 s.
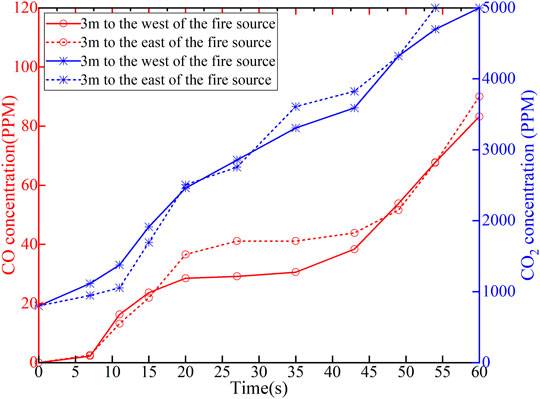
FIGURE 7. Variation curve of CO and CO2 concentration.
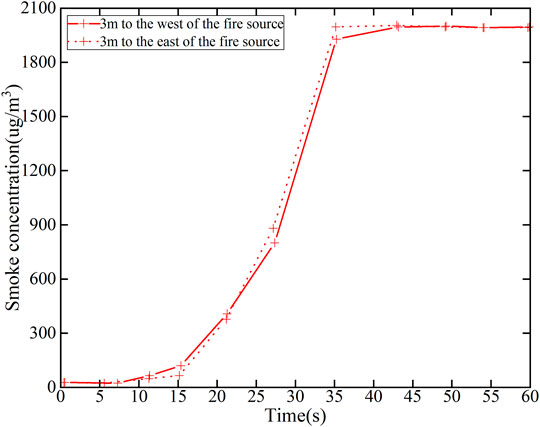
FIGURE 8. Variation curve of flue gas particle concentration.
The temperature variation curve at different heights of each monitoring point is shown in Figure 9. The temperature of monitoring points 2 and 3, 3 m away from the fire source, began to increase from 18 s. There are obvious differences in the maximum temperature at different heights. For example, the temperature at the height of 1.9 m of measuring point 2 can reach more than 160°C, while the temperature at the height of 1.5 m is about 100°C. The monitoring temperature of measuring point 3 is higher than that of measuring point 2. Since measuring point 3 is close to the side of the ventilation shaft, the air flow is easier to supplement oxygen, burn more fully, and generate more heat. As shown in the monitoring data of measuring point 1, it can be seen that the temperature difference between different heights below 1.8 m height is greater than that of measuring point 2. However, the temperature data of 1.8 m height and 1.9 m height are close. This indicates that the hot gas flow diffuses at the top, and the farther away from the fire point, the more the temperature is concentrated at the top of the tunnel. The maximum temperature at the height of 1.5 at measuring point 1 is only about 70°C, so the fire extinguisher may not be triggered. In the accident analyzed before, the fire extinguisher was placed on the cable support near the middle of the channel. The suspension height is about 1.6 m and is not in the area directly above the fire source but in the middle of the tunnel. It is placed about 3 m away from the ignition point. This leads to the late triggering time, and the limited fire-extinguishing range of the fire extinguisher also limits the fire-extinguishing effect. The layout of the fire extinguisher equipment needs to be optimized.
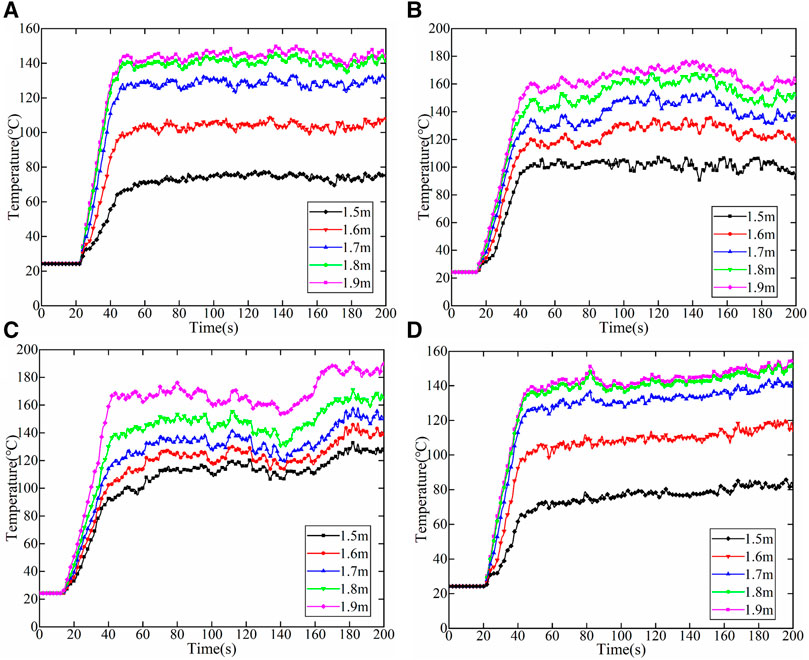
FIGURE 9. Temperature variation curve at different heights of each monitoring point (A) 1, (B) 2, (C) 3, and (D) 4
Fire Performance Test Results of Fire Barrier
As shown in Figure 5, a fire barrier is arranged on the support on the right side of the tunnel for test. The area with the fire barrier protects the upper cable from ignition, as shown in Figure 6. When the fire barrier is tested, the fire source power of the burner needs to be set based on the actual cable tunnel fire. However, the fire source power of the actual cable tunnel cannot be obtained directly. The simulation analysis of cable fire needs to be used and then compared with the experimental temperature monitoring data. A high-voltage XLPE cable is composed of multilayer materials. The complex pyrolysis method is used to simulate the combustion spread of the multilayer cable structure. The reaction rate formula of combustion is as given follows:
where Wi is the i-th pyrolysis reaction rate; Ai is the i-th pre-exponential factor; Ei is the activation energy of the i-th reaction; R is the general gas constant, with a value of 8.314 kJ/kmol•K; Ts is the reaction temperature (K); N is the reaction order; ρi is the mass concentration of the current solid phase type; ρo is the initial density of the solid surface at the boundary; and XO2 is a simulated reaction rate, which is affected by local oxygen concentration.
During the combustion process of the power cable, the combustion of the outer sheath and insulating layer needs to be determined according to the test. Combined with the combustion calorific value of solid materials obtained from the test, the mass of gas fuel required for the corresponding gas-phase reaction is converted. According to the ratio of the outer sheath and insulating layer of the high-voltage cable, the gas-phase reaction equation is shown in formula 2.
The simulation model is established based on the field test cable and tunnel structure size. Simulation is carried out with the previous settings. The comparison between the monitoring data of the temperature sensor above the fire source and the simulation data is shown in Figure 10. After the cable is ignited, the temperature increases rapidly. After about 40 s, the temperature oscillates around 840°C, and the oscillation amplitude of the simulation value is slightly higher than that of the test value. The change trend of temperature is very close between the test and simulation. The maximum error is about 4%. The effectiveness of the simulation model is verified.

FIGURE 10. Temperature comparison of test and simulation above fire source.
Comparative tests were carried out on the type A fire barrier (using the pultrusion process) and the type B fire barrier (using new high-flame-retardant molding plastic process). The temperature sensor is used to measure the temperature at three different positions of the fireproof partition sample. The layout of the measuring points is shown in Figure 11. The flame temperature is about 1,000°C, and the combustion time is 6 min. The test results are shown in Table 1.
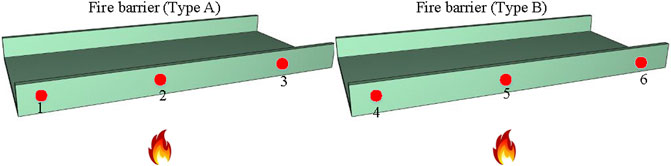
FIGURE 11. Layout of the temperature measuring points.
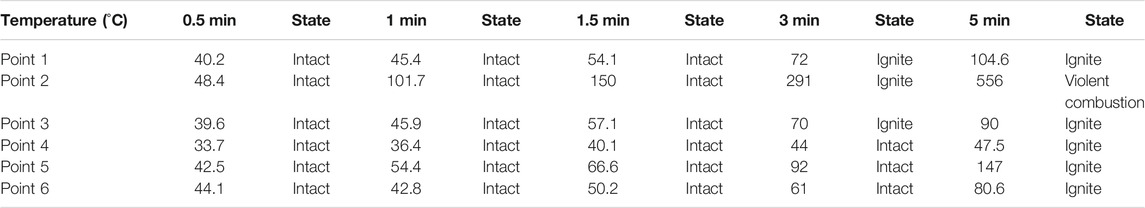
TABLE 1. Comparative combustion test data of two kinds of fire barrier.
In the first 1.5 min, neither sample was ignited. The temperature of sample B was up to 66.6°C and that of the sample A was up to 150°C. At 3 min, sample A begins to burn obviously, and the maximum temperature of the measuring point reaches 291°C. At 3.5 min, sample B began to burn sporadically. At 4 min, the combustion fire of sample A becomes larger, the smoke is thick and black, and the combustion fire of sample B is smaller. At 6 min, the combustion fire and smoke of sample A are very large. The temperature in the tank box reaches more than 500°C, while the maximum temperature of sample B is only 147°C. When the fire source is turned off, the combustion flame of sample B will extinguish itself within 5 s, while the combustion flame of sample A will not extinguish for 40 s. It will not be extinguished until it is sprayed many times by the fire-extinguishing device. The fire barrier in the accident is type A. Its fire protection performance obviously cannot meet the fire protection requirements of the high-voltage cable tunnel. The type A fire barrier in the existing high-voltage cable tunnel needs to be replaced. Type B fire barrier can meet the fire isolation requirements at the joint.
Optimal Configuration Scheme of Fire Prevention and Extinguishing Products
Based on the aforementioned accident data analysis and field fire test, the existing firefighting measures for cable joints in high-voltage cable tunnels mainly have the following problems: 1) The trigger time of fire-extinguishing bomb from fire to action is long, resulting in longer fire development time and expanded influence range; 2) in case of severe fire, the fire extinguisher can temporarily suppress the fire situation after spraying fire-extinguishing agent, but then it will rekindle; 3) fire will spread to the part outside the protection area of the fire protection tape, and the flame will directly burn the cable body, resulting in cable damage; and 4) when the cable intermediate joint is arranged in the middle, the molten medium caused by high temperature will drip to the lower cable after the failure of the cable intermediate joint, affecting the normal operation of the lower cable. In view of the aforementioned problems, improvements are made from the layout position and configuration quantity of fire extinguishers, the winding range of fireproof tapes, and the optimization of fireproof diaphragms.
Through tests, when the fire extinguisher is placed at the top of the middle of the tunnel, about 30 s after the fire source is turned on, the temperature at the temperature-sensing glass ball of the fire extinguisher reaches the trigger temperature of the fire extinguisher, the fire extinguisher starts to act, ejects fire-extinguishing agent, and the fire is controlled. When the fire extinguisher is placed on the uppermost support directly above the cable joint, the fire-extinguishing conditions can be triggered earlier, and the fire can be extinguished before the fire develops completely. The optimized trigger time is about 20 s, which is about 30°C lower at the maximum temperature. At the same time, the ignition point is uncertain due to the long middle joint of the high-voltage cable. The actual fire-extinguishing device may not be directly above the intermediate joint. The test is conducted at 1 and 1.5 m on both sides of the center line of the cable joint of the upper support. When the distance is 1.5 m, it reaches the trigger temperature of the fire extinguisher in about 33 s. However, due to the late start-up time and the spread of the fire, the cables outside the fire envelope are still ablated. When the distance is 1 m, the trigger temperature of the fire extinguisher is reached in about 25 s. After the combustion test, there are slight ablation marks on the outer sheath of the cable, and the fire prevention effect is better than the that in aforementioned methods, but it is still possible to damage the upper cable in extreme fire. Consider arranging one fire extinguisher on both sides of the intermediate joint. The test results show that the trigger temperature is reached in about 25 s. The ultra-fine dry powder in the fire area maintains a high concentration, and oxygen is seriously insufficient, so it cannot be reignited. The temperature drop rate is about 135% faster than that of a single fire extinguisher.
In the current fire protection layout scheme for the middle joint area of the high-voltage cable tunnel, the cables on both sides of the joint of the whole line are wrapped with the fireproof tape about 3 m. The test results show that the cable 3 m away from the burning place of the middle joint of the cable is still ablated, and the length of the cable body not covered with the fireproof tape is not more than 1 m. The length of the cable covered with the fireproof tape is optimized to be 4 m.
The optimized configuration of fire protection measured at the intermediate joint of the high-voltage cable is shown in Figure 12. The installation position and dosage of ultra-fine dry powder fire-extinguishing device have an obvious influence on the extinguishing effect. According to the comparative analysis of the test, a 4-kg ultra-fine dry powder fire-extinguishing device is installed at the top support 0.8∼1 m from both sides of the center line of the cable joint. In order to prevent the high-temperature molten medium in the faulty joint from affecting the lower cable, the high-flame-retardant, non-toxic, and low-smoke plastic cable fireproof partition is installed at the lower part of the cable intermediate joint. In order to prevent the fault arc or open fire from affecting the surrounding cables, the cables on both sides of the cable intermediate joint and within 4 m on both sides are wrapped with the fireproof wrapping tape. The fire test was carried out after improving the layout of fire-extinguishing measures. After the fire is formed at 19 s, the fire-extinguishing bomb acts, and the fire extinguishing is completed when the fire is not fully developed. At the same time, fire barriers and fire belts also effectively inhibit the development of cable fire.
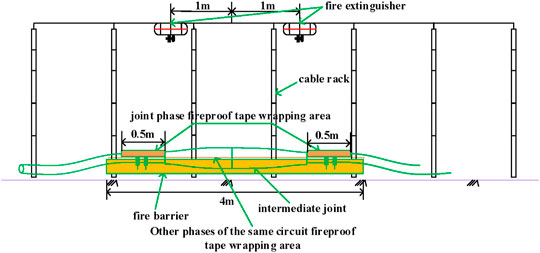
FIGURE 12. Optimized configuration of fire prevention measures at intermediate joints.
Conclusion
The abnormal monitoring data of typical high-voltage cable tunnel fire accidents are analyzed in this study. Combined with the field tunnel fire test, the shortcomings of the existing fire prevention and extinguishing measures are analyzed. The optimal configuration scheme of the fire anomaly data detection equipment and fire-extinguishing products is proposed. The main conclusions are as follows:
1) The statistical data of typical accidents show that the joint breakdown fault is the main cause of cable tunnel fire. The main problems existing in the existing tunnel fire prevention measures are the unreasonable installation position of fire extinguishers, the lack of fire prevention measures between intermediate joints, and the insufficient fire prevention performance of interlayer fire barriers.
2) The field test shows that the high temperature of the high-voltage cable is mainly concentrated at the top of the tunnel near the ignition point. If the layout is unreasonable, it is difficult to trigger the fire extinguisher in time. The melting drop of the insulating layer is easy to cause fire below. Comparing the simulation and test results of abnormal characteristic parameters in fire, the temperature error is less than 4%. The fire power curve of the cable tunnel is obtained through simulation, and then the burner power is set. It can conveniently and effectively test the performance of different fire prevention and extinguishing devices.
3) The fire prevention and extinguishing configuration of the cable tunnel is improved from the aspects of the layout position and configuration quantity of fire extinguishers, winding range of the fireproof tape, and optimization of fireproof partition. The temperature drop rate increased by about 135%, and can effectively prevent re-ignition.
Data Availability Statement
The original contributions presented in the study are included in the article/supplementary material; further inquiries can be directed to the corresponding author.
Author Contributions
ZP put forward research ideas. WG guided the research methods. ZP wrote the original draft and he is the corresponding author. ZR reviewed the manuscript. YM and ZeP conducted field tests. SZ edited figures and tables. ZeP did the data analysis. All authors have read and approved the submitted version of the manuscript.
Conflict of Interest
The authors declare that the research was conducted in the absence of any commercial or financial relationships that could be construed as a potential conflict of interest.
Publisher’s Note
All claims expressed in this article are solely those of the authors and do not necessarily represent those of their affiliated organizations, or those of the publisher, the editors, and the reviewers. Any product that may be evaluated in this article, or claim that may be made by its manufacturer, is not guaranteed or endorsed by the publisher.
References
An, W., Wang, T., Liang, K., Tang, Y., and Wang, Z. (2020). Effects of Interlayer Distance and cable Spacing on Flame Characteristics and Fire hazard of Multilayer Cables in Utility Tunnel. Case Stud. Therm. Eng. 22, 100784. doi:10.1016/j.csite.2020.100784
An, W., Wang, X., Tang, Y., Wang, T., and Lu, J. (2021). Influence of cable Inclination Angle and Longitudinal Ventilation on Temperature Distribution during cable Fire in Utility Tunnel. Case Stud. Therm. Eng. 27, 101304. doi:10.1016/j.csite.2021.101304
Dong, X., Yang, Y., Zhou, C., and Hepburn, D. M. (2017). Online Monitoring and Diagnosis of HV cable Faults by Sheath System Currents. IEEE Trans. Power Deliv. 32 (5), 2281–2290. doi:10.1109/TPWRD.2017.2665818
Guo, D., Zhang, G., Zhu, G., Jia, B., and Zhang, P. (2020). Applicability of Liquid Nitrogen Fire Extinguishing in Urban Underground Utility Tunnel. Case Stud. Therm. Eng. 21, 100657. doi:10.1016/j.csite.2020.100657
Li, J., Shi, C., Chen, C., Zhang, Y., Xu, X., and Shi, J. (2018). “October)Fire Smothering and Post-fire Ventilation Strategy for Cable Compartment in Urban Utility Tunnel,” in Asia-Oceania Symposium on Fire Science and Technology (Singapore: Springer), 1047–1059.
Liang, K., Hao, X., An, W., Tang, Y., and Cong, Y. (2019). Study on cable Fire Spread and Smoke Temperature Distribution in T-Shaped Utility Tunnel. Case Stud. Therm. Eng. 14, 100433. doi:10.1016/j.csite.2019.100433
Liu, X., Hou, D., Ji, J., and Zhu, H. (2021). Experiment and Numerical Simulation of cable Trench Fire Detection. Case Stud. Therm. Eng. 28, 101338. doi:10.1016/j.csite.2021.101338
Liu, Y., Fang, Z., Tang, Z., Beji, T., and Merci, B. (2021). The Combined Effect of a Water Mist System and Longitudinal Ventilation on the Fire and Smoke Dynamics in a Tunnel. Fire Saf. J. 122, 103351. doi:10.1016/j.firesaf.2021.103351
Mi, H., Liu, Y., Jiao, Z., Wang, W., and Wang, Q. (2020). A Numerical Study on the Optimization of Ventilation Mode during Emergency of cable Fire in Utility Tunnel. Tunnelling Underground Space Technology. 100, 103403. doi:10.1016/j.tust.2020.103403
Shen, X., Ouyang, T., Khajorntraidet, C., Li, Y., Li, S., and Zhuang, J. (2022). Mixture Density Networks-Based Knock Simulator. Ieee/asme Trans. Mechatron. 27, 159–168. doi:10.1109/TMECH.2021.3059775
Song, Z., Wang, X., Tan, Z., Miao, X., and Zou, L. (2020). “Analysis of Distribution Law of Fire Gas Concentration in Underground Cable Tunnel of Substation,” in 2020 IEEE International Conference on High Voltage Engineering and Application (ICHVE) (IEEE), 1–4.
Wang, Y., Rui, D., Qingyun, L., and Fang, G. (2017). Review of Urban High-Voltage cable Tunnel Monitoring Techniques,” in 2017 EPTC Power Transmission and Transformation Technology Conference (PTTTC), 8. doi:10.1049/cp.2017.0552
Xu, G., Zhu, G., Pan, R., and Liu, X. (2021). Experimental Study on Combustion Parameters and Temperature Distribution of Linear Fire under Different Oxygen Concentration in Tunnel. Results Eng. 11, 100272. doi:10.1016/j.rineng.2021.100272
Yan, B., Ren, G., Huang, X., Chi, J., Zheng, L., Luo, H., et al. (2018). “Study on Early Fire Behavior Detection Method for Cable Tunnel Detection Robot,” in Intelligent Computing and Internet of Things (Singapore: Springer), 215–224.
Yang, N., Dong, Z., Wu, L., Zhang, L., Shen, X., Chen, D., et al. (2021a). A Comprehensive Review of Security-Constrained Unit Commitment. J. Mod. Power Syst. Clean Energ. doi:10.35833/MPCE.2021.000255
Yang, N., Yang, C., Wu, L., Shen, X., Jia, J., Li, Z., et al. (2021b). Intelligent Data-Driven Decision-Making Method for Dynamic Multi-Sequence: An E-Seq2Seq Based SCUC Expert System. IEEE Trans. Ind. Inform. doi:10.1109/TII.2021.3107406
Zhang, H., and Zhao, Y. (2020). Study on Underground Utility Tunnel Fire Characteristics under Sealing and Ventilation Conditions. Adv. Civil Eng. 2020. doi:10.1155/2020/9128704
Keywords: power cable tunnel, fire accident, anomaly detection, field test, detection data analysis, fire development
Citation: Guo W, Pu Z, Ren Z, Zhou S, Quan L, Men Y and Pan Z (2022) Analysis of Abnormal Detection Data of Fire Accident in Power Cable Tunnel and Field Test Study on Characteristic Parameters of Tunnel Fire. Front. Energy Res. 10:860707. doi: 10.3389/fenrg.2022.860707
Received: 23 January 2022; Accepted: 25 February 2022;
Published: 22 March 2022.
Edited by:
Xun Shen, Tokyo Institute of Technology, JapanCopyright © 2022 Guo, Pu, Ren, Zhou, Quan, Men and Pan. This is an open-access article distributed under the terms of the Creative Commons Attribution License (CC BY). The use, distribution or reproduction in other forums is permitted, provided the original author(s) and the copyright owner(s) are credited and that the original publication in this journal is cited, in accordance with accepted academic practice. No use, distribution or reproduction is permitted which does not comply with these terms.
*Correspondence: Ziheng Pu, cHpoZHFAY3RndS5lZHUuY24=