- 1School of Electric Power, South China University of Technology, Guangzhou, China
- 2Maintenance and Test Center of EHV Power Transmission Company, China Southern Power Grid Company Limited, Guangzhou, China
Motor load accounts for more than 50% of the total electric power load in China. Identifying the load of induction motors non-intrusively is of great importance for the design of energy-saving schemes and formulation of demand-side response strategies in industrial enterprises. Based on the transient mechanism of the induction motor, the present work first defines some motor load start-up transient feature parameters with clear physical meanings and proposes a set of non-intrusive motor load identification methods applicable to industrial settings. In addition, a case study that applied the proposed method to the industrial setting was performed to verify its effectiveness. The results showed that the proposed method can overcome the problem of misidentification caused by the fact that the start-up transient process is affected by its mechanical load characteristics and hence can identify motors with similar running power and has good anti-interference capacity despite power quality disturbances.
Introduction
Industrial load identification can identify the start time and stop time of each device in the workshop by a small amount of electrical information in the distribution system. Industrial load identification methods boast many advantages, including low installation and maintenance cost, and little impact from user intervention. Based on the load information from industrial load identification methods, energy service providers, governments, and energy policymakers can develop demand response policies and energy efficiency strategies and can plan the use of new energy sources (Hart, 1992; Adabi et al., 2015; Holmegaard and BaunKjaergaard, 2016; Zhang et al., 2021).
In China, load identification methods for industrial sites see wider adoption and a higher market value than non-intrusive load monitoring (NILM) for residential and commercial buildings. As reported by the National Bureau of Statistics of China (National Bureau of Statistics of China, 2021), the annual consumption of electricity in China is greater than six trillion kWh from 2017 to 2019. Notably, the electricity consumption of industrial induction motors is greater than three trillion kWh per year (more than 50% of the total electricity consumption nationwide) (National Bureau of Statistics of China, 2021). Moreover, in industries that feature high energy consumption like chemical, steel, cement, and textile, the induction motor load accounts for 75%–90% of the total industrial power load. Therefore, if a set of load identification methods for induction motors is proposed and installed in industrial sites, it means that more than 75% of the industrial load is monitored at the equipment level, and more than 50% of the electric load of the whole Chinese society is monitored at the equipment level. However, in reality, since the power consumption data of each motor are related to a company’s production and involves commercial secrets, and many motors are integrated into complete industrial machines (Kien Nguyen Trung et al., 2012), energy service providers often do not have access to the power consumption data of the motors. Nevertheless, to achieve the goal of energy conservation, we still have to rely on industrial load identification methods to obtain such data as the actual running time (turn-on/off time), running power, and power consumption of each motor.
Many studies have implemented residential load identification (Dash et al., 2021; Kong et al., 2016; D'Incecco et al., 2020; Chen et al., 2020; Zhou et al., 2021) based on two characteristics of residential electricity consumption, namely, high regularity and a limited number of household appliances. These studies mainly adopt the non-mechanistic methods based on publicly available datasets (Kolter and Johnson, 2011; Anderson et al., 2012; Kahl et al., 2016; Parson et al., 2016; Monacchi et al., 2014; Kelly and Knottenbelt, 20152015), which means that the identification features do not come from the electric principle of equipment but from the information provided by public datasets. However, for the identification of induction motors in the industrial sector, which accounts for the highest proportion of industrial loads, we can make full use of the well-known principles of induction motors to deduce the identification features and carry out induction motor load identification (as the publicly available datasets are not relied on in this type of method, there is no need to verify the results by datasets). Therefore, the load features of induction motors should be found not from the datasets but from the fundamental principle of induction motors. Furthermore, the power consumption in factories depends on their production plans. Induction motors with different but similar rated power may have the same steady-state running power, so it is difficult to identify induction motors simply by using steady-state power. Instead, it is an effective method to identify the load of induction motors by using the start-up transient characteristics from the motor principle.
There have been few works on industrial load identification (Leeb and Kirtley, 1993; Leeb et al., 1995; Khan et al., 1997; Chang et al., 2007; Shaw et al., 2008; Chang et al., 2011; Kien Nguyen Trung et al., 2012; Adabi et al., 2015; Holmegaard and BaunKjaergaard, 2016; Renaux et al., 2018; Yi et al., 2019 Yuan et al., 2019; Yu et al., 2020; Faustine et al., 2021; Yang et al., 2021), and fewer on the circuit mechanism of three-phase induction motors (Leeb and Kirtley, 1993; Leeb et al., 1995; Khan et al., 1997; Chang et al., 2007; Shaw et al., 2008; Chang et al., 2011; Yi et al., 2019). Leeb et al. (Leeb and Kirtley, 1993; Leeb et al., 1995; Khan et al., 1997; Shaw et al., 2008) used the spectral envelope of instantaneous power in the induction motor starting the transient process as the identification feature but did not clarify that the shape and duration of the envelope are related to the size of the mechanical torque; for instance, the duration and the shape of the envelope may be different for each start of the mixer. Chang et al. (Chang et al., 2007; Chang et al., 2011) used the energy of the start-up transient process to identify a single-phase 0.2-HP induction motor and a three-phase 1-HP induction motor, but the transient energy is also related to the mechanical torque. For example, in some water supply systems, when the water flow speed in the pipeline is large, the starting torque is small, and the required start-up transient energy is also small; when the water flow is reverse or static, the starting torque is large, and the required start-up transient energy is large, which is likely to cause identification errors.
In order to solve this problem, it is necessary to define and extract more detailed, stable, and reliable transient features, to deal with the more extreme but crucial cases of load identification: several motors with the same rated power or the same pole pairs (very likely to have similar starting energy, the same maximum of start-up instantaneous power, and similar spectral envelope and duration) exist in a distribution system at the same time.
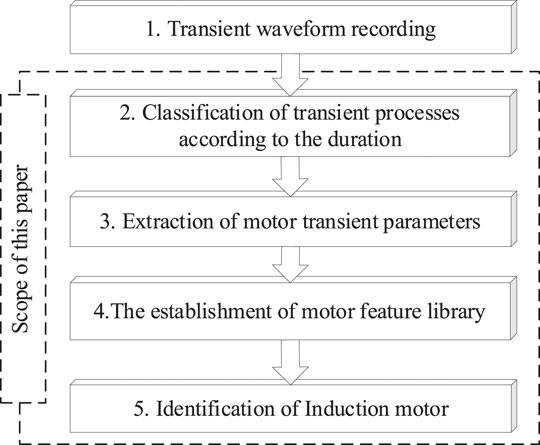
The aim of this paper is to propose a non-intrusive motor load identification method for industrial sites using the known start-up transient process mechanism of induction motors (Chen, 1982) so as to solve the induction motor identification problem in industrial sites. Figure 1 presents a diagram of the proposed method. This method uses the turn-on and turn-off transient waveform recorded by smart meters in the distribution system, extracts motor transient quantities from the transient waveforms and builds a feature library, and then uses the feature library to identify the start time, stop time, and running power of a motor.
The main contributions of this work are as follows:
1) The motor transient mechanism is, for the first time, used to implement load identification in industrial sites.
2) The motor load features defined in this paper depend on the equivalent circuit parameters of motors. Compared with existing data-based methods (Renaux et al., 2018; Yuan et al., 2019; Yu et al., 2020; Faustine et al., 2021; Yang et al., 2021), these features have a clearer physical meaning and are of higher generalization capacity.
3) The proposed transient features are not related to the mechanical torque, and compared with previously reported features, they are more short-term and detailed, which can help resolve the challenge in identifying different equipment with similar starting power and similar running power.
The remaining sections are arranged as follows: Methods proposes the method of distinguishing the motor devices from other devices, defines the motor feature parameters and proposes the method of solving the feature parameters, defines the feature-hood, and proposes a method of obtaining the feature-hoods. Results and Discussion proves the discriminative performance of the proposed feature parameters by simulating the distribution of parameters and analyzing the distribution concentration under different power quality disturbances and proves the effectiveness of the proposed method through a study case in the industrial sites, and the method is compared with methods in existing works. Conclusion presents the conclusions.
Methods
Basis for Identifying Motor Loads From Instantaneous Power
Motor load identification is important, as motor load takes up a huge proportion in the industrial sites, and the primary problem of motor load identification is to identify whether a new device connected to the power supply network at a certain moment is a motor or some other device.
In China, the electrical equipment and machinery in industrial production can be divided into the following four categories: 1) equipment that converts electrical energy into mechanical energy, which is mainly motor-driven equipment; 2) equipment that converts electrical energy into thermal energy, which mainly refers to electric heating equipment (this type of equipment is generally powered by switching power supply and can be equivalent to resistance); 3) equipment that converts electrical energy into chemical energy, which is mainly electrolytic plating equipment (this type of equipment is generally powered by switching power supply); and 4) lighting equipment (this type of equipment is generally powered by switching power supply and can be equivalent to resistance).
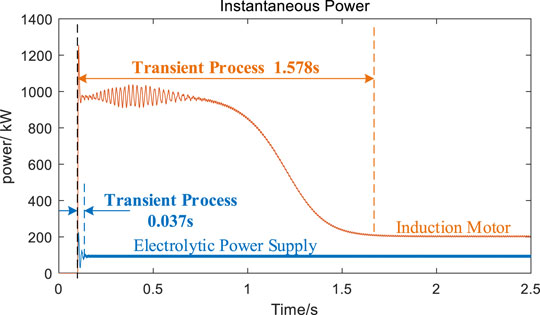
Except for the first category, the rest of the categories of equipment mentioned above are either powered by switching power supplies or equivalent to resistors, and their start-up process is often over within a few power cycles (Chen, 1982) (generally all less than 0.5 s), as illustrated in Figure 2. Figure 2A gives the start-up power curve of an electrolytic plant with a start-up duration of less than 0.02 s; and Figure 2B gives the start-up power curve of a 200-kW centrifugal fan with a wide range of duration of 1.5 s.
In summary, from the above analysis, the duration of the start-up process can be used to judge whether the newly turned-on device is a motor load or another piece of equipment.
Feature Parameter Extraction and Motor Load Identification
The previous Basis for Identifying Motor Loads From Instantaneous Power solved the problem of whether the newly turned-on equipment at a certain moment is an electric motor; this subsection distinguishes and marks every newly turned-on motor. At the initial stage of the start-up process of a motor, i.e., before its rotor rotates and after its power switch is closed, the motor can be regarded as a linear circuit, and this process is defined as the rotor-locked process in the present work. The three-phase instantaneous power of the motor is not related to the closing phase-angle of the supply voltage, as described Eq. 8 in Supplementary Appendix SA. Based on the three-phase instantaneous power during the rotor-locked process, the load feature parameters of the motor can be defined and extracted. These parameters can be used to identify and differentiate motors with similar running power and similar numbers of poles.
Rotor-Locked Instantaneous Power and Definition of Feature Parameters
As indicated in Chen (1982), when an induction motor is connected to the power network, the angular frequency of its rotor equals 0 (
where
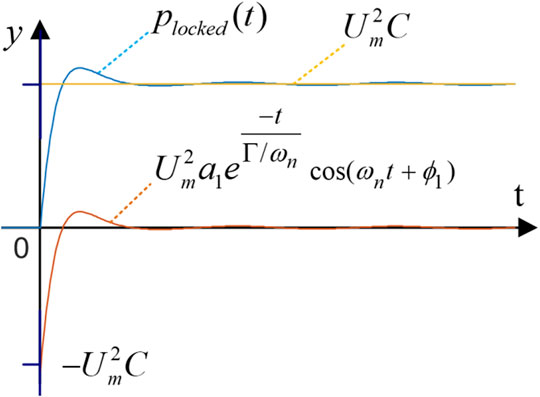
Eq. 1 and its DC component and AC component are shown in Figure 3. From Eq. 1, we can see that:
1) When a motor is connected to the power network, the angular velocity of the rotor equals zero (ω = 0). The
2) C is the DC component coefficient of
3) Γ is the decay time constant of the AC component of
In summary, Γ and C reflect the features of the AC and DC components, respectively, in
The Rotor-Locked Power With Relaxation Term and Feature Extraction Model
To take into account the power grid disturbances and accommodate more complex scenarios, we define the equation with relaxation terms, as follows:
where
For the identification problem in a distribution network powering multiple motors, both the sum power
We assume that the power switch is closed at the timepoint t = 0, and
By iteratively solving the optimization model (3), the feature parameters (Γ, C) of the rotor-locked process of a motor can be extracted.
For the model, the following aspects should be noted.
First, the approximation of
Second, given the possible phase delay of data obtained from the sampling device, the delay parameter
Third, relaxation terms are added to Eq. 2, which further corrects Eq. 1. Without the relaxation term, the power quantity disturbances, and measurement errors can lead the optimization model (3) to an incorrect solution. The power quality disturbances and measurement errors include the following: 1) voltage deviation, frequency deviation, voltage distortion, voltage asymmetry, etc., and 2) phase deviation of voltage and current. The tolerable frequency deviation of the grid voltage is generally at −0.4% to 0.4%, the tolerable voltage deviation is generally at −7% to 7%, the asymmetry is generally allowed within the range of 0%–4%, and the voltage distortion rate is generally allowed at 0%–2%. In order to improve the efficiency of the model solution and reduce the requirement for computing power on the embedded device, the orders of the relaxation terms in Eq. 2 are taken as 2, 5, and 7, which are considered as the universal harmonic components in power systems.
Definition and Acquisition of Feature-Hood for Motor Identification
Due to the power quality disturbances, deviations in the value of feature parameter (Γ, C) are often observed in an industrial motor. However, even if there are deviations, the distribution of (Γ, C) will be relatively concentrated (as to be proved in Performance Verification of Feature Parameters via Y-Series Induction Motors). This relative concentration can be described by a circular hood defined by 2-parametric numbers in the plane where (Γ, C) is located.
Definition of Feature-Hood
The feature-hood of motor i is defined as follows:
where
Di—the feature-hood of motor i (i = 1, 2, … , N);
xci—cluster center (Γci, Cci);
Ri—cluster radius.
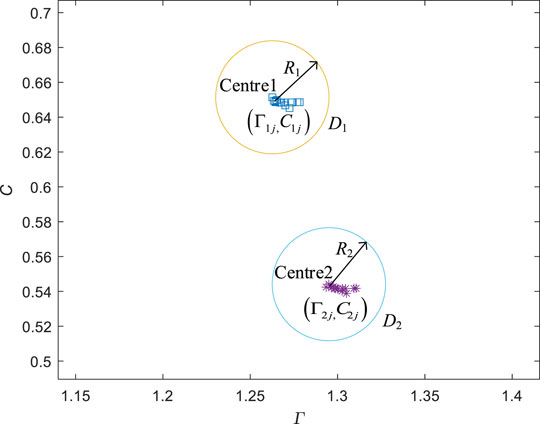
As Figure 4 shows, the feature parameters under the combined power grid disturbance j are (Γij, Cij). The feature cluster consisting of parameters (Γij, Cij) is contained in the feature-hood Di.
Because the number and type of motors in a factory are often not precisely known, it is necessary to obtain the feature clusters of each motor by unsupervised clustering. The center (xci, Ri) and the steady running power (Pisteady) of motor i should be recorded, and then the feature-hoods (Di) and the feature library can be determined.
In real-world applications, if the number of motors is known, K-means clustering or tree branch clustering can be used; or otherwise, Density-Based Spatial Clustering of Applications with Noise (DBSCAN) clustering can be used. If the maximum distance R from the midpoint of the cluster is used as the radius, the feature-hood of each cluster is obtained. The center of Motor i (Γci, Cci) Ri and the steady running power Pi (Figure 4) are recorded to form the motor feature-hoods {Di}. If the distance between the centers of the two clusters is greater than the sum of their radii (Figure 5), a classification of 100% accuracy can be achieved.
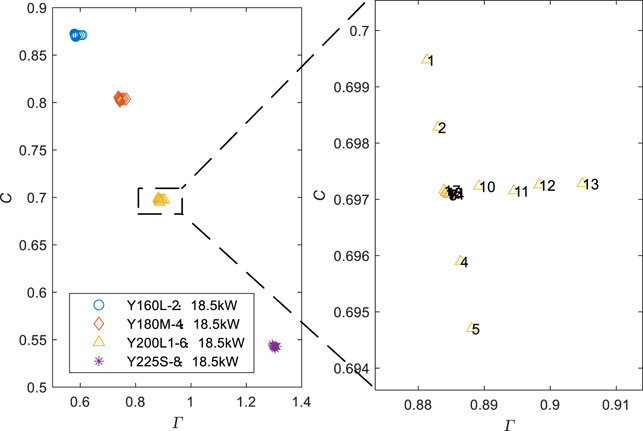
FIGURE 5. Distribution of feature parameters of motors with the same rated power but a different number of poles.
Application of Feature-Hoods
After a feature-hood set {Di} for an industrial site is established, a transient power pv, generated when unknown equipment v is started, is collected at time t0–t1, and a set of (Γv, Cv) is extracted if
Then, the unknown equipment v is considered as the motor i.
Results and Discussion
Performance Verification of Feature Parameters via Y-Series Induction Motors
Devices with similar power are not easy to distinguish, which is considered a major challenge in NILM research. In this subsection, the start-up process of some Y-series motors with a similar number of poles and similar rated power [more details are available in Supplementary Appendix SB and previous works (Jin, 1997; Xin, 2010)] was simulated under different power quality disturbances to verify the discrimination performance of the proposed feature parameters and feature-hoods in Definition and Acquisition of Feature-Hood for Motor Identification. The distribution of the feature parameters shows that the proposed feature parameters have good discriminative performance.
Simulation of Discriminative Performance Under Different Power Quality Disturbances
Similar Motors
Similar motors refer to motors with similar rated power but a different number of poles, or motors with the same number of poles but different rated power.
1) The motors with similar rated power but a different number of poles discussed in this subsection are Y160L-2 (18.5 kW), Y180M-4 (18.5 kW), Y200L1-6 (18.5 kW), and Y225S-8 (18.5 kW) made in China, and their specific parameters are available in Supplementary Appendix SB.
2) The motors with the same number of poles but different rated power discussed in this subsection are Y225S-8 (18.5 kW), Y225M-8 (22 kW), Y250M-8 (30 kW), and Y280S-8 (37 kW) made in China, and their detailed parameters are shown in Supplementary Appendix SB.
Power Quality Disturbances
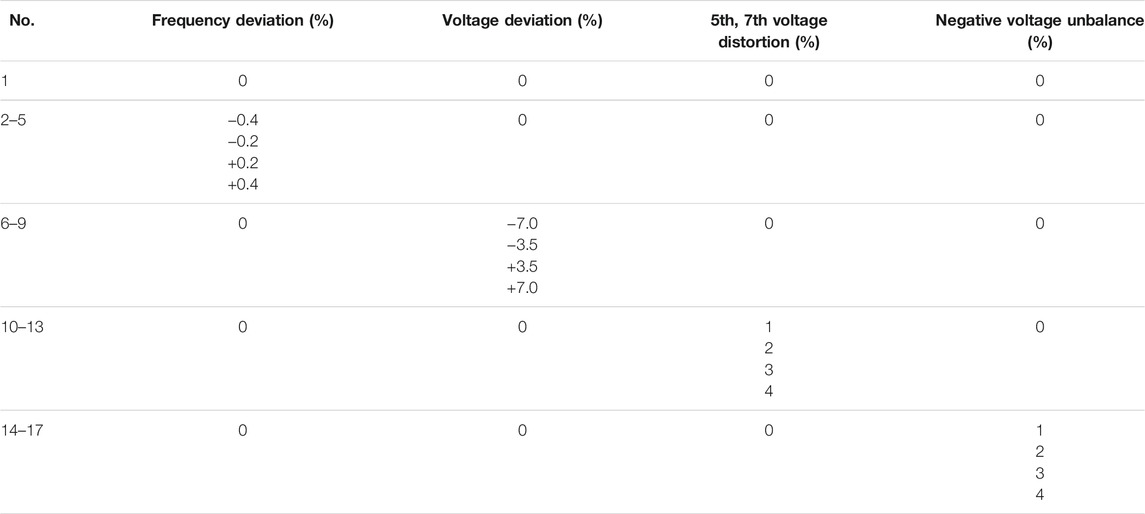
Within the permissible range for the daily operation of power grids, as specified by the Chinese National Standards, the power quality disturbances are divided into 17 kinds of power quality conditions for simulation here, as shown in Table 1.
Analysis of Discriminative Performance
This subsection simulates a similar start-up process of multiple motors in MATLAB using common induction motor models under each of the 17 kinds of power quality conditions listed in Table 1.
First, the motors are started at full voltage with a rated mechanical load, and the instantaneous power sequence of each motor is obtained. Then, the sequence within three power cycles after the switch is turned off can be approximated by the optimization model (3) specified in The Rotor-Locked Power With Relaxation Term and Feature Extraction Model. Finally, the feature parameters (Γ, C) of each motor can be obtained.
• Figure 5 shows the simulation results for Scenario a) specified in Similar Motors.
Figure 5 shows that the feature clusters of multiple motors with the same rated power are distributed along a straight line. It can be observed that Γ increases and C decreases as the number of poles increases, and the minimum longitudinal and transverse distances between clusters are about 0.15 and 0.1, respectively.
As the zoom-in plot of clusters (the right part of Figure 5) shows, the longitudinal span of points within the cluster Experiment 1 and Experiment 5 is 0.005, and the transverse span is 0.02. Since
• Figure 6 shows the simulation results for Scenario b) specified in Similar Motors.
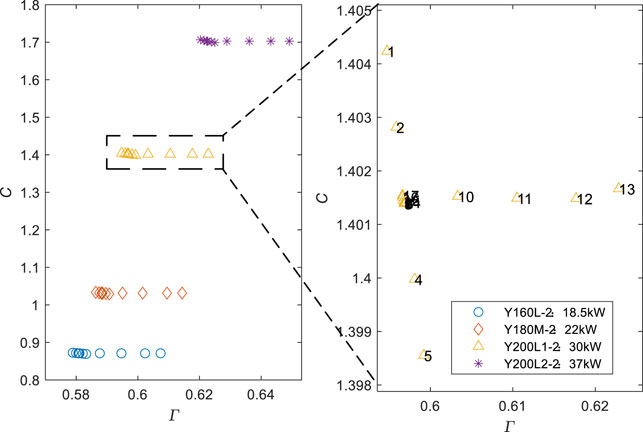
FIGURE 6. Distribution of feature parameters of motors with the same number of poles but different rated power.
Figure 6 shows that the feature clusters of multiple motors with the same number of poles but different rated power are distributed along a straight line; and as the rated power increases, Γ and C increase, and the minimum longitudinal and transverse distances between clusters are about 0.2 and 0, respectively. As the zoom-in plot of each cluster (the right part of Figure 6) shows, the longitudinal span of points within the cluster in Experiment 1 and Experiment 5 is 0.007, and the transverse span is 0.03. Since
Discriminative Performance of Y-Series 18.5–37 kW Motors
Figure 7 shows a cluster of points consisting of (Γ, C) for motors of Y-series with a rated power 18.5–37 kW under various power quality disturbances: Figure 7A is for frequency deviation, Figure 7B is for voltage deviation, Figure 7C is for voltage distortion (fifth, seventh harmonic), Figure 7D is for voltage unbalance (negative sequence), and Figure 7E is a general graph containing all disturbances.
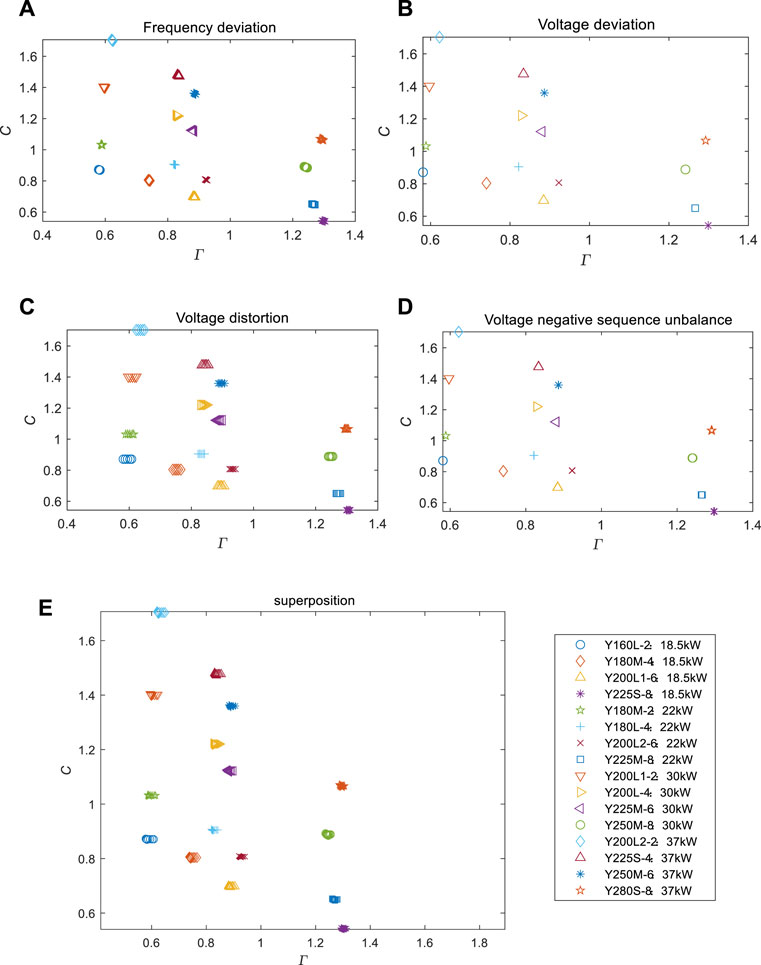
FIGURE 7. Feature cluster distribution of induction motors under different power quality disturbances. (A) Feature distribution of each motor under different frequency deviation. (B) Feature distribution of each motor under different voltage deviation. (C) Feature distribution of each motor under different voltage distortion. (D) Feature distribution of each motor under different voltage negative sequence unbalance. (E) Summary and superposition of (A-D).
Figure 7 reveals the following findings:
1) As shown in Figures 7B,D, the clusters under frequency deviations and voltage distortions are concentrated. As shown in Figures 7A,C, the clusters under voltage deviations and voltage negative sequence unbalance are not as concentrated as those shown in Figures 7B,D but are still relatively concentrated.
2) As shown in Figure 7E, the clusters are still relatively concentrated as the power disturbances increase, such as the case with a frequency deviation of 0.4%, a voltage deviation of 7%, the fifth, seventh harmonic content of 4%, and voltage negative sequence unbalance of 4%.
It means that the clustering method can be used to obtain the feature clusters of each motor, and the cluster–hoods of different motors can be used to achieve the goal of distinguishing different motors.
Experiment of Motor Load Identification for a Small Machining Factory
This subsection verifies the effectiveness of the method described in Feature Parameter Extraction and Motor Load Identification, with a case study made in a small machining factory.
Monitoring Devices and Data
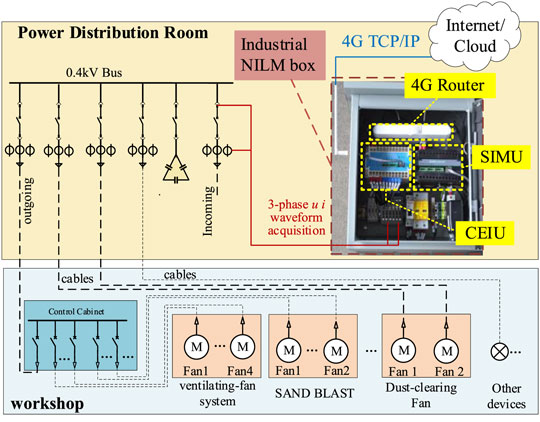
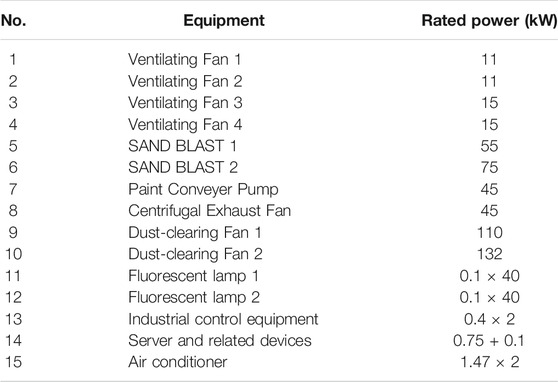
Equipment in a small factory: The small machining factory studied here has one 0.4 kV power incoming line and three outlet lines, and there is a set of reactive power compensation equipment with automatic switching on the busbar, as shown in Figure 8. The main loads include 10 induction motors, which are axial fans, centrifugal fans, and high-power pumps. And the background loads include some lower-rated power devices, which are fluorescent lamps, control equipment, computer server, and air conditioner, as shown in Table 2. The total rated power of the factory is about 500 kW. The daily working hours of the workshop are 08:00∼12:00, 13:30∼16:30, and 17:00∼20:30, and the equipment start/stop is controlled as per the actual needs of production.
Monitoring device and data acquisition: The monitoring devices were deployed in the power incoming cabinet (Figure 8). Collecting Electric Information Unit (CEIU) and Smart Information Management Unit (SIMU) provided by Guangzhou Guanxing Electric Technology Co., Ltd., were adopted. The CEIU can acquire and record the turn-on and turn-off transient waveforms with a sampling frequency of 8 kHz, according to a set of thresholds. And SIMU can support the deployment of intelligent algorithms implemented by high-level programming languages, such as C++, java, or Python.
The proposed method of this paper can be deployed on the SIMU, and the identification results can be sent to users through a webpage or a smart phone application. The users can define the names of the unnamed feature-hoods according to their requirements and send the names of that feature-hoods back to SIMU to form a local feature library.
Data for clustering and testing: The training data and testing data are shown in Figure 9. Figure 9A shows the RMS voltage curve for a month, which affects the accuracy of the parameter C, as defined in Eqs 1, 2. Figures 9B,C show the instantaneous power curve for 1 month and 1 day. Figure 9D shows the instantaneous power curve of Ventilating Fan 2.
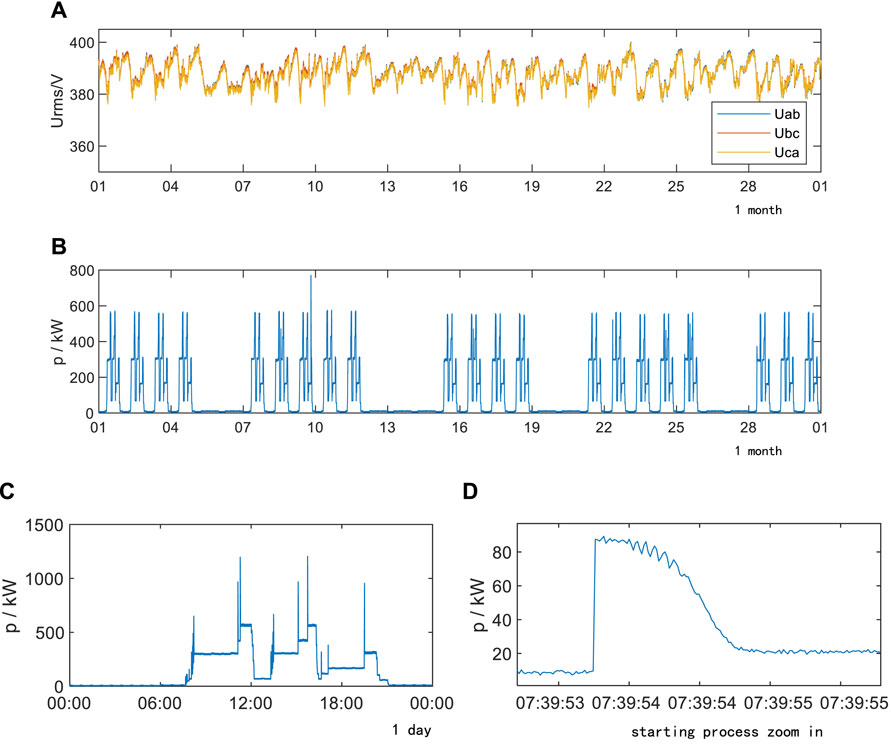
FIGURE 9. Data of the study case: (A) voltage root-mean-square (RMS) curve; (B) instantaneous power for 1 month; (C) instantaneous power for 1 day; (D) instantaneous power of one device in its start-up process.
Each main piece of equipment was started up and shut down about 2–3 times per day. During this period, the frequency, voltage deviation, voltage harmonics, and voltage unbalance of the power network were within the allowable range of IEC standards.
The clustering data were selected from the instantaneous power in the first 18 days. The testing data were selected from the instantaneous power in the last 3 days. Each turn-on or turn-off transient event was labeled with timestamp and equipment name.
Experimental Results and Discussions
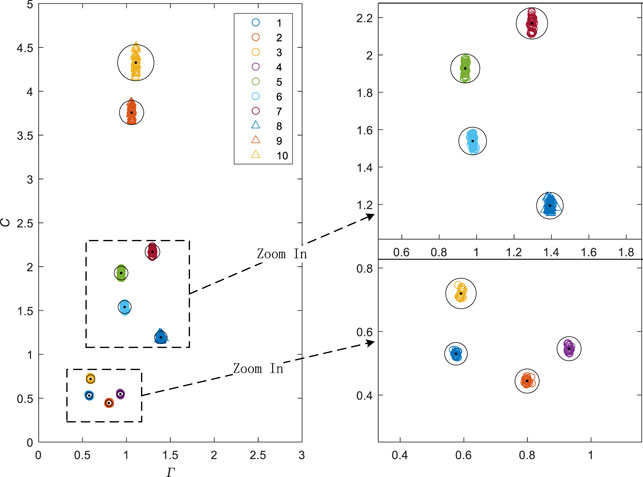
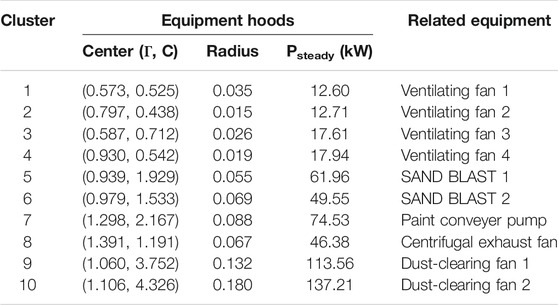
Model training result: By the optimization model 3) specified in The Rotor-Locked Power With Relaxation Term and Feature Extraction Model, all the start-up transient processes of 1 month were extracted, and adopting the DBSCAN cluster, the feature-hoods defined in Eq. 4 in Definition and Acquisition of Feature-Hood for Motor Identification were obtained using epsilon = 0.1 and min-points = 5 as the parameter to finish DBSCAN. The results are shown in Figure 10, where clusters 1 to 10 in Figure 10 represent the valid clusters, and the equipment corresponding to each cluster was associated by the user (workers) according to the steady running power of each cluster/hood.
According to the cluster/hood results, as shown in Figure 10, the mean position of each cluster was taken as the hood center and the distance from the hood center to the farthest point within the cluster as the hood radius. The center and radius of each cluster/hood and the steady running power at the end of the transient process were recorded; then, the local feature library of the factory was established, as shown in Table 3. In practical application, the equipment name in the last column of Table 3 should be determined by the users (workers) based on the steady running power. The steady running power Psteady can be used to identify which equipment causes the turn-off transient event.
Model testing result: The test was performed with the start-up instantaneous power curve of 3 days, and the (Γ, C) of each start-up event was calculated, and the distance to each center in Table 3 was calculated to determine which feature-hood the recorded start-up process belongs to. Figure 11 shows the motor load identification results in a full working day. In Figure 11, the solid black line is the objective, while the solid red line is the result of the proposed method, and the dashed line is every recognized motor load.
Compared to other features: To evaluate the effectiveness of the proposed method, an evaluation indicator, i.e., identification accuracy, is used. Compared to the transient energy defined and proposed by Chang et al. (2007; Chang et al., 2011), the (Γ, C) achieves a higher identification accuracy, as shown in Table 4.
Among them, the start-up transient energy of similar motors, Ventilating Fan 1 and Ventilating Fan 2, is affected by the wind pressure in the pipeline during starting. As the wind pressure in the ventilation pipeline changes, the values of the start-up transient energy of these two motors will become closer, resulting in more identification errors, and the accuracy on the test set is only 81.11%. However, the feature (Γ, C), as defined in Rotor-Locked Instantaneous Power and Definition of Feature Parameters, relies only on the motor equivalent circuit parameters and hence achieves a higher identification accuracy at 93.33%.
Application Effect Analysis
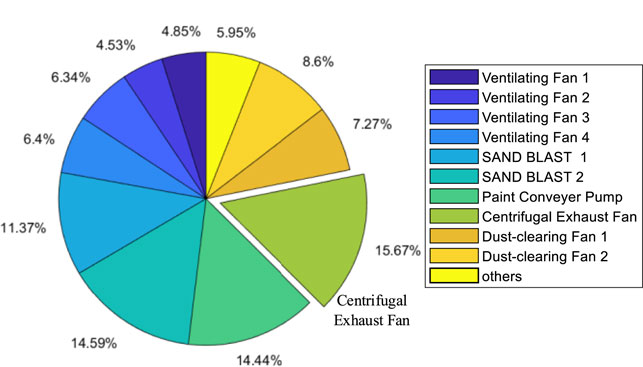
Energy-saving effects and suggestions: According to the motor load identification result shown in Figure 11, we can know the power consumption proportion of each piece of equipment, as shown in the pie chart in Figure 12. It can be seen from the pie graph and the orange dash line in Figure 11 that Centrifugal Exhaust Fan, though not the equipment with the largest rated power, has a long running time and consumes about 15.67% of the total power. According to the relationship between the speed and the running power of exhaust pump or exhaust fan, it is advisable to install an extra inverter for the Centrifugal Exhaust Fan, as this modification can reduce the motor speed by 10% and save 30% energy; the factory will save about 4.7% of power consumption, about 4,819 kWh/month.
Cost-saving effects and suggestions: Assume that the electricity rate during peak period (14:00–17:00 and 19:00–22:00), plain period (8:00–14:00, 17:00–19:00, and 22:00–24:00), and valley period (0:00–8:00) is 1/kWh, 0.7/kWh, 0.3/kWh, respectively. The motor load identification result (dashed line) in Figure 11 shows that the peak, plain, and valley electricity consumption of the plant is 1,398.1, 2028.3, and 68.2 kWh, respectively, and the peak, plain, and valley electricity cost of the plant is 1,398.1, 1,419.81, and 20.6, respectively. Figure 11 reveals that the production periods of the factory are 8:00∼12:00, 13:30∼16:30, and 17:00∼20:30, which means that the current electricity consumption pattern is overusing the peak rate and is missing the valley rate. If the operation time of medium and large equipment can be shifted by 20 min to 07:40∼12:00 in the morning and 13:00∼16:10 in the afternoon, the factory will save 2.75% of the electricity cost.
Conclusion
Industrial motor load identification provides more comprehensive basic data for the formulation and implementation of safety and power-saving policies. In the present work, a set of motor load identification methods based on the start-up transient mechanism of electric motors is given. The following conclusions are obtained:
1) It is feasible and effective to use the transient mechanism and extract relevant parameters for load identification.
2) The proposed parameters have a clear physical meaning and are universally applicable; they can also be applied to load identification of synchronous motors with asynchronous starting.
3) The proposed method solved the challenges in load identification when multiple motors are started at the same time because the transient information required by the method is only 2∼3 power cycles.
4) Simulations proved that the proposed parameters have good tolerance to power quality disturbances and that the proposed parameters have good discriminative performance.
5) The case study in a real-world machining factory verified the effectiveness of the proposed method, the problem of identifying different motors with the same steady running power is solved, and the effect of industrial motor load identification methods in reducing energy consumption and cost is analyzed.
However, it needs to be noted that the use of the method in this paper is temporarily limited to scenarios containing a large number of directly starting motors and will not be applicable to scenarios containing motors with other starting methods or motors running at variable power. If the turn-on instantaneous power provided by the recording program of the acquisition device is incomplete or the deviation of switch closing moment t0 is too large, the application of this method will be affected.
Data Availability Statement
The raw data supporting the conclusion of this article will be made available by the authors, without undue reservation.
Author Contributions
YL and ZL contributed to the conception and design of the study. JH organized the database and performed the statistical analysis. ZL wrote the first draft of the manuscript. YL and ZL wrote sections of the manuscript. All authors contributed to manuscript revision and read and approved the submitted version.
Conflict of Interest
JH was employed by the China Southern Power Grid Company Limited.
The remaining authors declare that the research was conducted in the absence of any commercial or financial relationships that could be construed as a potential conflict of interest.
Publisher’s Note
All claims expressed in this article are solely those of the authors and do not necessarily represent those of their affiliated organizations, or those of the publisher, the editors, and the reviewers. Any product that may be evaluated in this article, or claim that may be made by its manufacturer, is not guaranteed or endorsed by the publisher.
Acknowledgments
The authors would like to thank Guangzhou Guanxing Electric Technology Co., Ltd., for supporting this study by providing monitoring devices and electric data of a machining factory.
Supplementary Material
The Supplementary Material for this article can be found online at: https://www.frontiersin.org/articles/10.3389/fenrg.2022.858969/full#supplementary-material
References
Adabi, A., Mantey, P., Holmegaard, E., and Kjaergaard, M. B. (2015). “Status and Challenges of Residential and Industrial Non-intrusive Load Monitoring,” in Technologies for Sustainability (IEEE). doi:10.1109/sustech.2015.7314344
Anderson, K., Ocneanu, A., Benitez, D., Carlson, D., and Berges, M. (2012). “BLUED: A Fully Labeled Public Dataset for Event-Based Non-intrusive Load Monitoring Research,” in Proceedings of the 2nd KDD Workshop on Data Mining Applications in Sustainability (SustKDD), Beijing, China, August 12, 2012, 1–5.
Chang, H.-H., Chen, K.-L., Yuan-Pin Tsai, Y. P., and Wei-Jen Lee, W. J. (2011). A New Measurement Method for Power Signatures of Non-intrusive Demand Monitoring and Load Identification. IEEE Trans. Industry Appl. 48 (2), 764–771. doi:10.1109/IAS.2011.6074429
Chang, H. H., Yang, H. T., and Lin, C. L. (2007). “Load Identification in Neural Networks for a Non-intrusive Monitoring of Industrial Electrical Loads,” in Computer Supported Cooperative Work in Design Iv, International Conference, Cscwd, Melbourne, Australia, April, Revised Selected Papers (Berlin, Heidelberg: Springer).
Chen, K., Zhang, Y., Wang, Q., Hu, J., Fan, H., and He, J. (2020). Scale- and Context-Aware Convolutional Non-intrusive Load Monitoring. IEEE Trans. Power Syst. 35, 2362–2373. doi:10.1109/TPWRS.2019.2953225
Chen, W. C. (1982). Transient Processes of Electric Machine. Beijing: China Mechanical Press. (in Chinese).
D'Incecco, M., Squartini, S., and Zhong, M. (2020). Transfer Learning for Non-intrusive Load Monitoring. IEEE Trans. Smart Grid 11 (99), 1419–1429. doi:10.1109/TSG.2019.2938068
Dash, S., Sodhi, R., and Sodhi, B. (2021). An Appliance Load Disaggregation Scheme Using Automatic State Detection Enabled Enhanced Integer Programming. IEEE Trans. Ind. Inf. 17 (99), 1176–1185. doi:10.1109/TII.2020.2975810
Faustine, A., Pereira, L., and Klemenjak, C. (2021). Adaptive Weighted Recurrence Graphs for Appliance Recognition in Non-intrusive Load Monitoring. IEEE Trans. Smart Grid 12 (99), 398–406. doi:10.1109/TSG.2020.3010621
Hart, G. W. (1992). Nonintrusive Appliance Load Monitoring. Proc. IEEE 80 (12), 1870–1891. doi:10.1109/5.192069
Holmegaard, E., and Baun Kjaergaard, M. (2016). “NILM in an Industrial Setting: A Load Characterization and Algorithm Evaluation,” in IEEE International Conference on Smart Computing (SMARTCOMP), St Louis, MO, May 18-20, 2016 (IEEE), 179–186. doi:10.1109/SMARTCOMP.2016.7501709
Jin, X. Z. (1997). Common Technical Data for Motor Repair. Beijing: China Mechanical Press. (in Chinese).
Kahl, M., Haq, A. U., Kriechbaumer, T., and Jacobsen, H. A. (2016). “WHITED - A Worldwide Household and Industry Transient Energy Data Set,” in 3rd International Workshop on Non-Intrusive Load Monitoring, Vancouver Canada, May 14-15 2016, 1–4.
Kelly, J., and Knottenbelt, W. (2015). The uk-dale Dataset, Domestic Appliance-Level Electricity Demand and Whole-House Demand from Five uk Homes. Sci. Data 2, 1–14. doi:10.1038/sdata.2015.7
Khan, U. A., Leeb, S. B., and Lee, M. C. (1997). A Multiprocessor for Transient Event Detection. IEEE Trans. Power Deliv. 12 (1), 51–60. doi:10.1109/MPER.1997.56066410.1109/61.568225
Kien Nguyen Trung, K. N., Zammit, O., Dekneuvel, E., Nicolle, B., Cuong Nguyen Van, C. N., and Jacquemod, G. (2012). “An Innovative Non-intrusive Load Monitoring System for Commercial and Industrial Application,” in IEEE International Conference on Advanced Technologies for Communications(Proceedings International Conference on Advanced Technologies for Communications, Hanoi, VIETNAM, Oct 10-12, 2012 (Perth, Australia), 23–27. doi:10.1109/ATC.2012.6404221
Kolter, J. Z., and Johnson, M. J. (2011). "REDD: A public data set for energy disaggregation research," in Proc. Data Min. Appl. Sustain.. San Diego, CA, USA: Artificial Intelligence 25, 59–62.
Kong, W., Dong, Z. Y., Hill, D. J., Luo, F., and Xu, Y. (2016). Improving Nonintrusive Load Monitoring Efficiency via a Hybrid Programing Method. IEEE Trans. Ind. Inf. 12 (6), 2148–2157. doi:10.1109/TII.2016.2590359
Leeb, S. B., and Kirtley, J. (1993). “A Multiscale Transient Event Detector for Nonintrusive Load Monitoring,” in Conference of the IEEE Industrial Electronics Society, Maui, HI, USA, November 15-19, 1993 (IEEE), 354–359.1
Leeb, S. B., Shaw, S. R., and Kirtley, J. L. (1995). Transient Event Detection in Spectral Envelope Estimates for Nonintrusive Load Monitoring. IEEE Trans. Power Deliv. 10 (3), 1200–1210. doi:10.1109/61.400897
Monacchi, A., Egarter, D., Elmenreich, W., D'Alessandro, S., and Tonello, A. M. (2014). GREEND: An Energy Consumption Dataset of Households in Italy and Austria. IEEE International Conference on Smart Grid Communications (SmartGridComm)IEEE, 511–516.
National Bureau of Statistics of China, National Data: Electricity Balance Sheet. Available: https://data.stats.gov.cn/english/easyquery.htm?cn=C01 (Accessed November 23, 2021).
Parson, O., Fisher, G., Hersey, A., Batra, N., and Rogers, A. (2016). “Dataport and NILMTK: A Building Data Set Designed for Non-intrusive Load Monitoring,” in 1st International Symposium on Signal Processing Applications in Smart Buildings at 3rd IEEE Global Conference on Signal & Information Processing, Orlando, FL, USA, 14-16 December 2015 (IEEE).
Renaux, D., Lima, C., Pottker, F., Oroski, E., and Hercules, M. C. (2018). “Non-Intrusive Load Monitoring: an Architecture and its Evaluation for Power Electronics Loads,” in IEEE International Power Electronics and Application Conference and Exposition (PEAC), Shenzhen, China, November 4–7, 2018 (IEEE), 1–6. doi:10.1109/peac.2018.8590472
Shaw, S. R., Leeb, S. B., Norford, L. K., and Cox, R. W. (2008). Nonintrusive Load Monitoring and Diagnostics in Power Systems. IEEE Trans. Instrum. Meas. 57 (7), 1445–1454. doi:10.1109/TIM.2008.917179
Xin, C. P. (2010). Concise Motor Technical Manual. Shenyang: Liaoning Science and Technology Publishing House. (in Chinese).
Yang, F., Liu, B., Luan, W., Zhao, B., and Zhang, R. (2021). FHMM Based Industrial Load Disaggregation,” in 2021 6th Asia Conference on Power and Electrical Engineering (ACPEE), Chongqing, China, April 8-11, 2021.
Yi, S., Yin, X., Diao, Y., Wang, B., and Wu, P. (2019). A New Event-Detection Method Based on Composite Windows in NILM for Industrial Settings,” in IEEE Sustainable Power and Energy Conference (iSPEC), Beijing, China, November 21-23, 2019. IEEE, 2768–2771. doi:10.1109/ispec48194.2019.8975265
Yu, J. Y., Liu, W. N., and Wu, X. (2020). Noninvasive Industrial Power Load Monitoring Based on Collaboration of Edge Device and Edge Data center,” in 2020 IEEE International Conference on Edge Computing (EDGE), October 18–24, 2020 (IEEE), 23–30.
Yuan, D. H., Chew, B., and Xu, Y. (2019). “A Time Series Data Feature Based Back Propagation Neural Network Approach for Non-intrusive Load Monitoring,” in 2019 9th International Conference on Power and Energy Systems (ICPES), Perth, Australia, Perth, Australia, December 10-12, 2019. Available: http://ieeexplore.ieee.org/stamp/stamp.jsp?tp=&arnumber=9105353&isnumber=9105351. doi:10.1109/icpes47639.2019.9105353
Zhang, K., Zhou, B., Or, S. W., Li, C., Chung, C. Y., and Voropai, N. I. (2021). Optimal Coordinated Control of Multi-Renewable-To-Hydrogen Production System for Hydrogen Fueling Stations. IEEE Trans. Ind. Applicat. 1, 1. doi:10.1109/TIA.2021.3093841
Keywords: energy conservation, electrical load classification, industrial electric power monitoring, motor load identification, start-up transient process of induction motor
Citation: Liu Y, Liang Z and Huang J (2022) A Non-Intrusive Motor Load Identification Method Based on Load Transient Features. Front. Energy Res. 10:858969. doi: 10.3389/fenrg.2022.858969
Received: 20 January 2022; Accepted: 25 January 2022;
Published: 03 March 2022.
Edited by:
Bin Zhou, Hunan University, ChinaReviewed by:
Shan Du, Xi’an University of Post and Telecommunications, ChinaAiping Wu, Xidian University, China
Copyright © 2022 Liu, Liang and Huang. This is an open-access article distributed under the terms of the Creative Commons Attribution License (CC BY). The use, distribution or reproduction in other forums is permitted, provided the original author(s) and the copyright owner(s) are credited and that the original publication in this journal is cited, in accordance with accepted academic practice. No use, distribution or reproduction is permitted which does not comply with these terms.
*Correspondence: Yongqiang Liu, eW9uZ3FsaXVAMTYzLmNvbQ==
 Yongqiang Liu1*
 Zhaowen Liang
 Jiajie Huang