 Jun Pan1
 Jianfeng Ma
 Junzhao Han
 Ye Zhou
 Lielong Wu
95% of researchers rate our articles as excellent or good
Learn more about the work of our research integrity team to safeguard the quality of each article we publish.
Find out more
ORIGINAL RESEARCH article
Front. Energy Res. , 11 January 2023
Sec. Process and Energy Systems Engineering
Volume 10 - 2022 | https://doi.org/10.3389/fenrg.2022.1117606
This article is part of the Research Topic Design, Simulation and Optimization of Hydraulic Machinery, Volume II View all 9 articles
Wear of runner blades is a common problem affecting the operational reliability of turbines with high head and high sediment content. In order to accurately predict the wear of the turbine runner blade, based on the solid-liquid two-phase flow equation and turbulence model, the full channel numerical simulation of the internal water and sediment flow was carried out, and the sediment volume distribution and sand water velocity on the turbine runner blade were obtained. Then, according to the digital simulation results and the operating parameters of the turbine runner, the sediment wear test scheme for the turbine blade material specimen is designed, and the sediment wear test is carried out on the runner material. According to the test results, the sediment wear curve of runner blade material is obtained and applied to numerical simulation, and the main position and wear degree of turbine blade sediment erosion are predicted. The inspection results of the runner blade wear after the unit has operated for a flood season show that obvious wear can be seen at the outlet edge of the lower band of the runner blade, and the wear position and wear amount are basically consistent with the simulation values. The study is of great importance for predicting the wear of turbine runner blades with high drop height and high sediment content, and for turbine maintenance under complex conditions.
Prediction of wear of sand erosion has always been a very important topic in the field of hydraulic machinery. As for the wear mechanism, based on the Euler-Euler method, Zhou et al. (Zhou et al., 2022) numerically simulated the turbine with long and short blades under the condition of sediment-laden water. The results show that the erosion area increases with increasing sediment particle size when the sediment volume fraction is constant. Using experiments and simulations CFD-DEM, Xu et al. (Xu et al., 2022) investigated the influence of the spherical valve arrangement on the two-phase flow and erosion distribution in the valve. The results show that the surface of the eroded plate forms a wavy texture under the condition of a small opening. When the placement method changes from vertical to horizontal, the particle distribution easily accumulates near some walls and forms a protective layer, which reduces the erosion rate. Noon and Kim et al. (Noon and Kim, 2016) performed a three-dimensional numerical analysis of the erosion of lime slurry flowing through a centrifugal pump and its effects on head and loss of efficiency. The results show that the impact velocity, mass concentration and solid particle diameter are crucial for erosion damage. Bohn B et al. (Bohn et al., 2019) have designed and fabricated a magnetic sensor to measure impeller blade wear during operation of a centrifugal pump. With increasing wear, the impeller gap increases and the total reluctance of the magnetic circuit increases, which leads to a decrease in the peak inductance of the coil. The sensor helps to monitor the wear of the impeller blades. The results show that the geometric changes strongly influence the flow properties and thus affect the erosion mode. Tarodiya et al. (Tarodiya and Gandhi, 2019) used mixed and Euler-Euler multiphase models for multiphase modeling of a centrifugal slurry pump. The results showed that the head and efficiency of the pump decreased with increasing particle size and concentration. In the Euler-Euler model, the liquid (f) and solid (s) phases are assumed to coexist at every point in space in the form of an interpenetrating continuity. By solving the continuity equation and the momentum equation of the two phases, the volume fraction of the liquid phase and the solid phase are obtained, and the coupling between the phases is realized by the exchange coefficient.
Tang et al. (Tang et al., 2021) investigated the effect of particle shape on the wear properties of centrifugal pumps with CFD-DEM. The results show that as the sphericity of the particles increases, the overall pump impact wear first decreases and then increases. The internal impeller impact wear occurs mainly at the leading edge of the blade. Regardless of how the particle shape and wear mode change, the volute is the main wear part. Shi et al. (Shi et al., 2020) performed a numerical study on the internal flow field of a solid-liquid centrifugal pump and used the wear equation to predict the wear of the volute casing due to the solid-liquid two-phase flow. The wear mechanism of the volute casing of a centrifugal pump is analyzed in detail and systematically. The results show that the relative wear along the volute is a function of the erosion behavior of the volute material and the impact angle of the solid particles around the volute. Tao et al. (Tao et al., 2021) investigated the effects of blade thickness on the solid-liquid two-phase flow and impeller wear of a ceramic centrifugal slurry pump by numerical simulation and wear test. As the thickness of the blade increases, the angle of impact of the solid particles increases, which leads to an increase in the angle of wrap of the trajectory of the solid particles. By increasing the wrap angle of the solid particles, the collision area between the pressure side of the blade and the solid particle side is shifted toward the impeller outlet and more collisions occur between the solid particles and the suction side of the blade, which increases the wear of the suction side of the blade.
At present, there are relatively few studies on the prediction of sediment wear on the impeller of the high head hydropower station mixed flow system, and the formation mechanism of flow component wear is still insufficient. Currently published in the relevant literature, according to the hydropower station where the flow sediment combined with runner material in the wear test rig to carry out the test, and through the runner blade running a flood season according to the measured data on the high head mixed flow unit wear characteristics analysis and prediction of the literature is also less, so it is necessary to high head mixed flow unit runner wear in-depth discussion. In this paper, based on the Euler model combined with the turbine wear prediction method proposed by Duronev and Pelaev, the wear characteristics of a high head Francis turbine in a hydropower station are predicted under rated operating conditions. The internal flow characteristics, particle distribution, wear location, and wear prediction of the runner are analyzed in detail, and the performance of the runner against sediment wear is investigated.
The research object is a Francis turbine with high head in a hydropower station. The runner of the high-head turbine consists of 15 long and 15 short blades, an upper crown and a lower band. The 15 long and 15 short blades are staggered and welded to the upper crown and lower band to form a runner body. There are 16 stay vane and 24 guide vane. The sectional view of high-head turbine is show in Figure 1.
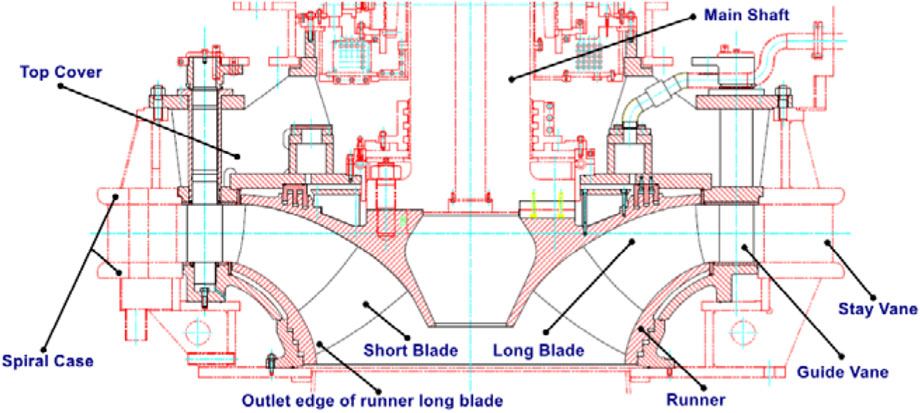
FIGURE 1. The sectional view of high-head turbine.
The main parameters of high-head turbine are shown in Table 1.

TABLE 1. Parameters of high head turbine.
Based on the geometrical parameters of the entire flow channel of the hydraulic turbine, a three-dimensional calculation area for the flow field is defined. The whole calculation area includes five parts: Spiral casing, stay vane, guide vane, hydraulic turbine runner and draft tube. The entire flow channel is shown in Figure 2.
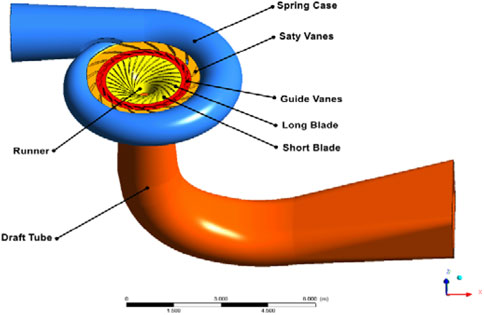
FIGURE 2. The entire flow passage’s model of internal water-sediment flow in high-head Francis turbine.
The three-dimensional model of the Francis turbine with a large drop height is created using the ICEM software and a structured grid. The geometric structure of the spiral casing and the runner is more complex, the geometric size range is large, the flow is complex and the local grid density needs to be increased. The mesh quality is above .5, which meets the requirements of numerical simulation. The models of the entire computational grid and the subcomponents of the computational grid are shown in the following Figure 3.
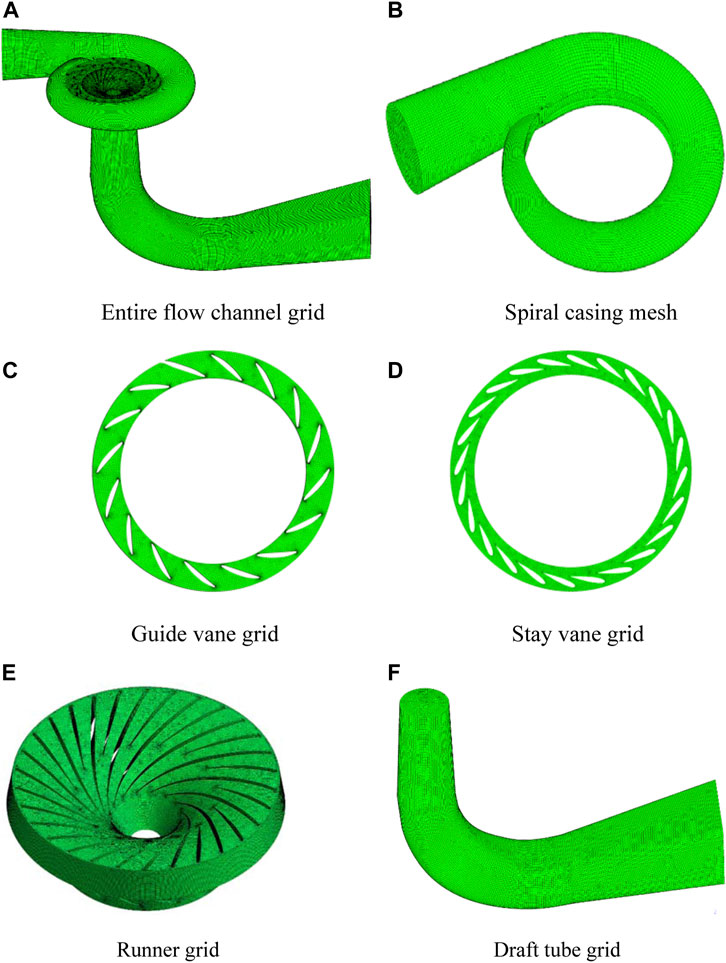
FIGURE 3. Hydraulic turbine grid model. (A) Entire flow channel grid (B) Spiral casing mesh. (C) Guide vane grid (D) Stay vane grid. (E) Runner grid (F) Draft tube grid.
The computational grid is divided into different number of grids with about 1 million increments. The independence test of the grid is performed with the measured efficiency in the rated operation of the turbine as a control parameter The fourth grid in Table 2 below has an error of less than .2% and meets the requirements for the grid independence detection.
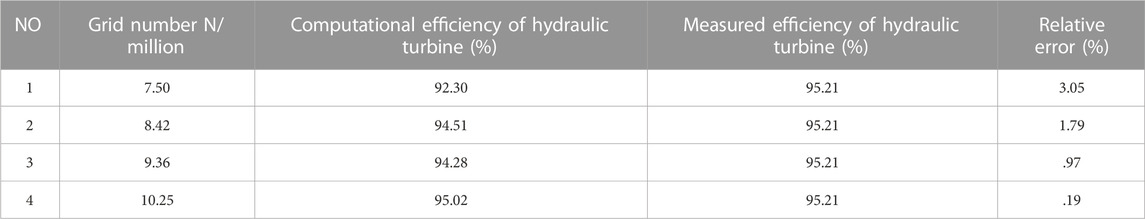
TABLE 2. Grid independence verification.
From Table 2, in the absence of sand particles, the relative error between the computational efficiency and the measured efficiency is smallest when the number of grids reaches 10.25 million, so the fourth scheme was selected as the best.
The specific boundary conditions are set according to the rated operating condition of the turbine of the hydropower station. Unit operation rated head is
The inlet and outlet boundaries are set at the inlet of the volute and at the outlet of the draft tube. In the case of uniform flow, the total pressure is given at the inlet. In this work, the pressure outlet has a better convergence speed, and the specific data are given according to the design conditions. For the solid wall, the no-slip condition is assumed that the normal velocity is 0. After the single-phase steady-state calculation of each working condition, it is used as the initial condition for the multi-phase calculation range. The dynamic and static interface is given as dynamic and static rotor.
With the rapid development of high-performance computers and numerical simulation methods, computational fluid dynamics (CFD) has become an effective method for studying complex two-phase flows. In this study, the Euler-Euler model is generally used to simulate multiphase flows (Tian, 2020).
The motion equation of solid-liquid two-phase flow in Euler coordinate system:
Liquid phase continuity equation can be expressed as:
Solid phase continuity equation can be expressed as:
Liquid phase momentum equation can be expressed as:
Solid phase momentum equation can be expressed as:
where
For the turbine, its internal flow is very full turbulent flow, this paper uses the
Liquid phase continuity equation can be expressed as:
The continuity equation of sediment particles can be expressed as:
where,
The wear test device uses the hydraulic-mechanical wear test system independently developed by the Institute of Mechanical and Electrical Engineering of the Chinese Academy of Water Sciences. The schematic diagram is shown in Figure 4. The test device mainly consists of a pressure vessel, a rotary table, a variable frequency motor, a water pump, a cooling system, and a measuring device. Six fan-shaped specimens with a front diameter of 400 mm are installed on the rotary table to form a torus, as shown in Figure 4B.
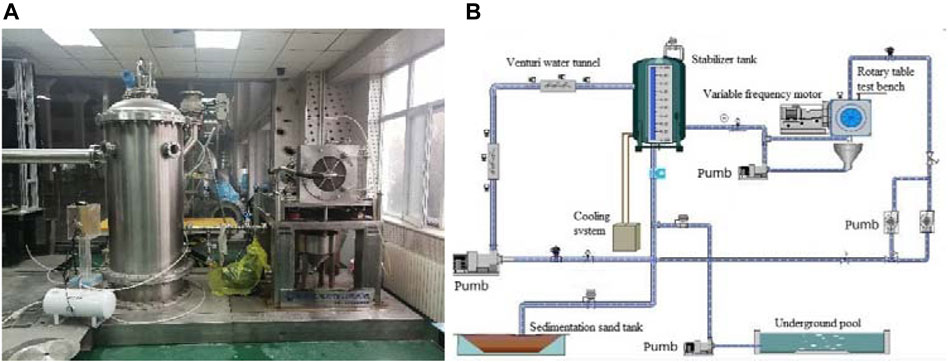
FIGURE 4. (A) Hydraulic machinery abrasion test system (B) Testing apparatus scheme.
Thus, the experimental principle is to determine the velocity distribution of the sand water around the impeller blade by numerically simulating the sand water flow in the turbine under rated conditions. The flow velocity range of blades is 25 m/s∼45 m/s, as shown in the following Figure 5.
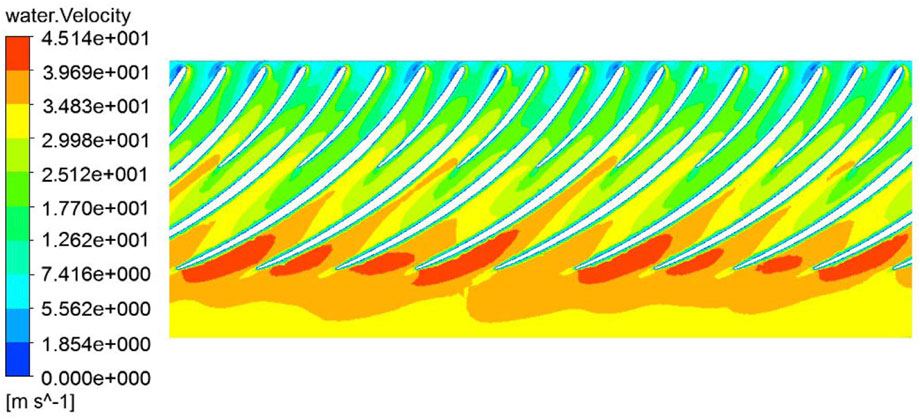
FIGURE 5. Velocity distribution of flowing sand water.
Abrasion experiments were conducted based on five groups of overcurrent velocities of 25 m/s, 30 m/s, 35 m/s, 40 m/s and 45 m/s. The sediment conditions and flow velocity on the surface of the sample correspond to the actual flow velocities on the surface of the turbine and runner blades to ensure that the experimental results are consistent with rated condition of hydraulic turbine. The relationship between wear volume per unit time and velocity was determined through several series of experiments at various overflow velocities.
The hydropower station is located in the plateau, 2,200 m above sea level. The average annual sediment concentration is 1.93 kg/m3 and the average annual suspended sediment mass is 1.74 million tons. According to the hydrological bureau, suspended sediment was sampled in the river near the dam of the hydropower station. The maximum particle size was .535 mm and the mean particle size was .02 mm. Analysis of the mineral composition and content of the sediment. The mineral composition and content of the sediment were determined by X-ray diffraction analysis. The results of the analysis are shown in the following Table 3. The mineral composition of the sediment consists mainly of quartz, feldspar and clay minerals, with the proportion of hard particles with Mohs hardness greater than 5 being 55.6%.
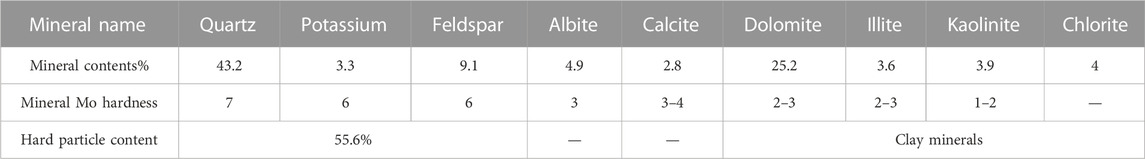
TABLE 3. Mineral composition and content of sediment in power station.
The material of the test specimen corresponds to the material of the turbine blades of a hydroelectric station with high water level The material of the test piece is 0Cr13Ni5Mo. The test piece is shown in Figure 6.
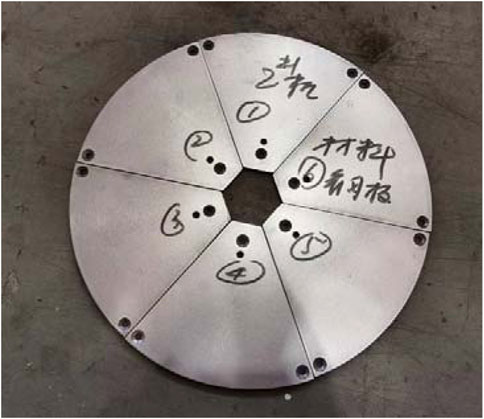
FIGURE 6. Wear test bench specimen.
According to the method proposed by Durinev and Pelaev for predicting turbine wear, the following relationship can be summarized for the calculation of wear (Yu et al., 2007):
where,
The test material and sediment composition content are consistent with the real hydropower station, and the influence coefficient
The relationship between material wear and speed is determined by measuring the material wear, as shown in the following Figure 7.
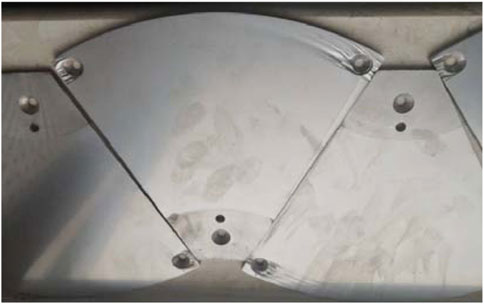
FIGURE 7. Wear test bench specimen after a period of time (T = 12 h).
The values of the parameters E and
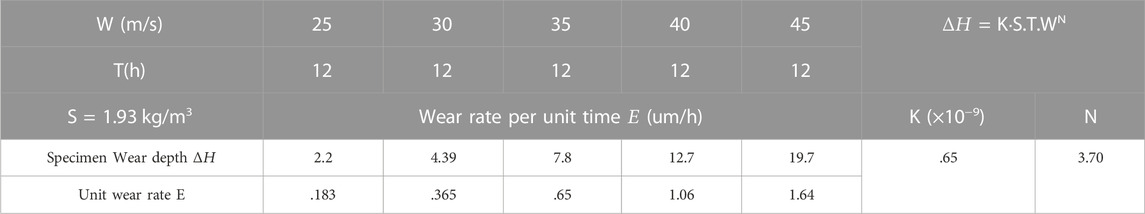
TABLE 4. Relationship between unit wear rate E and velocity W.
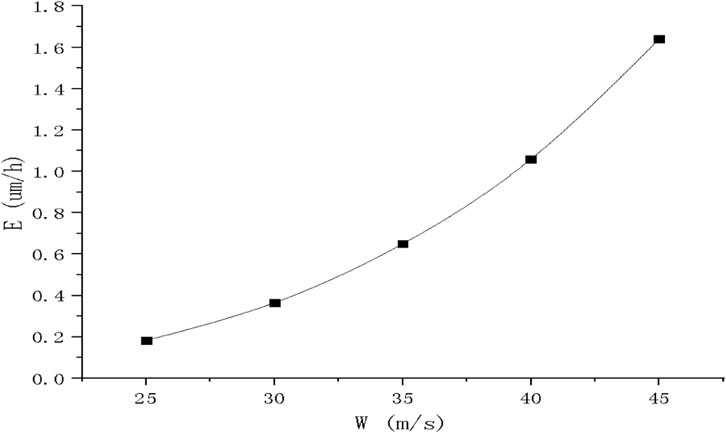
FIGURE 8. Wear amount per unit time.
From Table 4 and Figure 8, There is a good exponential relationship between wear rate and velocity, and the index N is about 3.7. According to material wear curve for wear estimation, namely material test sediment wear curve can be expressed as:
The flow characteristics of sediment-laden water largely determine the operational performance of the hydropower station (Li et al., 2020), which in turn affects the wear characteristics of the flow components in the hydropower station. In this regard, flow velocity and sediment distribution are the most important factors affecting wear. First, the flow characteristics within the hydropower station are analyzed under rated operating conditions. As shown in the Figure 9, the pressure gradient is highest in the Spiral casing due to the conversion of potential and kinetic energy of water, followed by the guide vane, stay vane and runner The lowest point of unit pressure is near the runner outlet. At the same time, the flow velocity at the inlet side of the runner in the flow channel is the highest, followed by the outlet side of the runner, and the flow velocity at the rear end of the draft tube is the lowest.
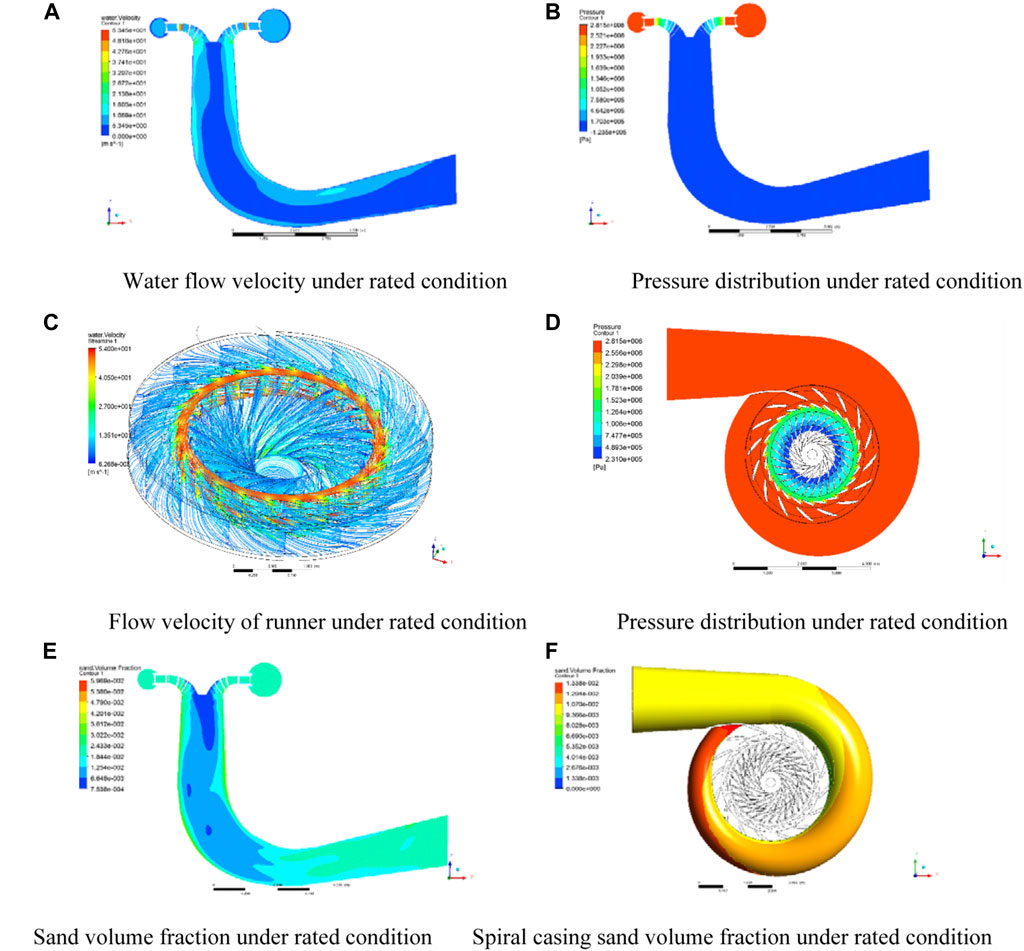
FIGURE 9. Numerical simulation results. (A) Water flow velocity under rated condition (B) Pressure distribution under rated condition (C) Flow velocity of runner under rated condition (D) Pressure distribution under rated condition (E) Sand volume fraction under rated condition (F) Spiral casing sand volume fraction under rated condition.
From the distribution of sediment under the above operating conditions in the flow channel, it is evident that sediment is concentrated on the surface of the spiral casing, stay vane, guide vane, turbine blade, draft tube and other flow components, especially on the stay vane and guide vane. The sediment distribution is obviously concentrated on the inlet side of the guide vane, and the outlet side of the back pressure surface of the long vane is also the area with the largest concentration of sediment distribution. When the operating conditions, sediment particle size and sediment concentration change, the phenomenon of concentrated sediment distribution at the above locations does not change significantly. Figure 10.
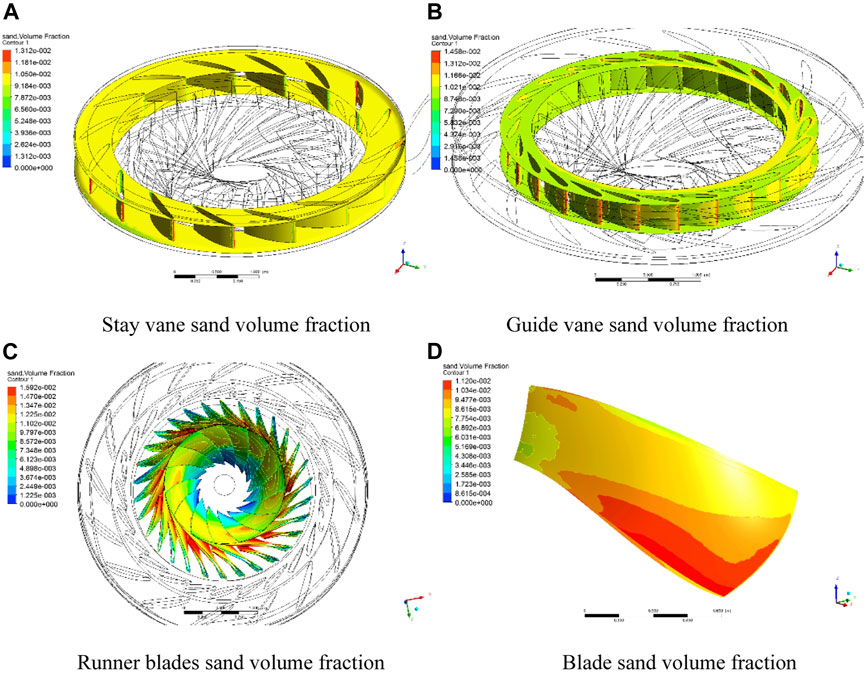
FIGURE 10. Numerical simulation results under rated condition. (A) Stay vane sand volume fraction (B) Guide vane sand volume fraction (C) Runner blades sand volume fraction (D) Blade sand volume fraction.
The wear pattern of the water turbine is closely related to sediment distribution and flow velocity (Jiarui, 2021). The distribution of sediment throughout the flow field and the local flow velocity determine which parts and areas of the turbine are more susceptible to wear, which provides a basis for the future design of turbine wear protection. Therefore, the change in sediment distribution and internal flow field characteristics in the flow field will result in different wear conditions in different regions of the turbine (Gao et al., 2002). The material test sediment wear curve obtained by the sediment wear experiment of hydraulic turbine materials is introduced into the simulation calculation. The simulation results are shown in the Figure 11, the sediment sample adjustment formula applied to the simulation calculation of the rated operating conditions after 2,483.92 h determines the amount of wear of each component. The position of the long blade that is susceptible to wear is located near the blade inlet and the outlet of the back pressure surface.
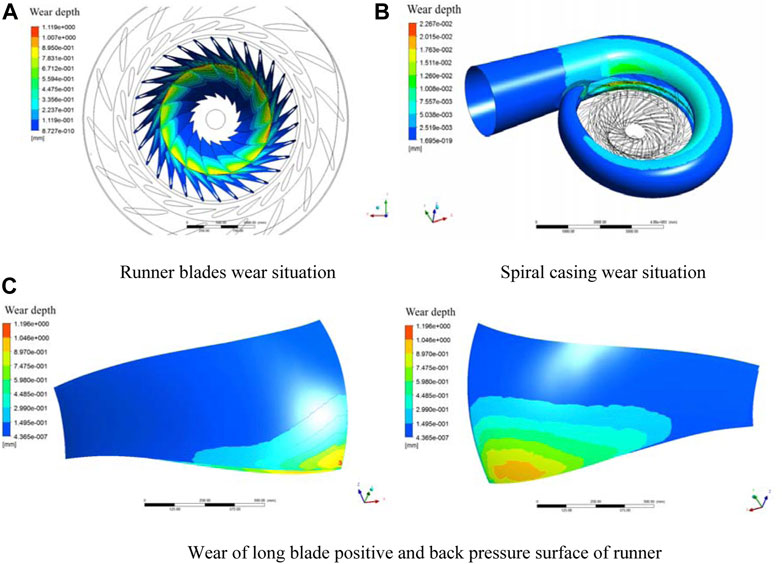
FIGURE 11. Numerical simulation results under wear situation. (A) Runner blades wear situation (B) Spiral casing (C) wear situation Wear of long blade positive and back pressure surface of runner.
The following conclusions can be drawn: the maximum wear point of the positive pressure surface and the back pressure surface of the long blade ˜ -1.196–1.092 ≈-2.28 mm.
Unit 3F of a hydropower station began a 72-h trial operation in December 2017. Since its official commissioning, a total of 2,483.92 operating hours have been performed. The flow passage and flow components of the unit 3F were inspected. The inspection revealed that the runner edges of the turbine generator of hydropower unit 3F are heavily worn. There are 15 long blades with different degrees of wear on the water edge. Measuring point for measuring blade thickness (Cheng and Chen, 2009) with ultrasonic thickness gauge (Yang, 2020) is shown in Figure 12.
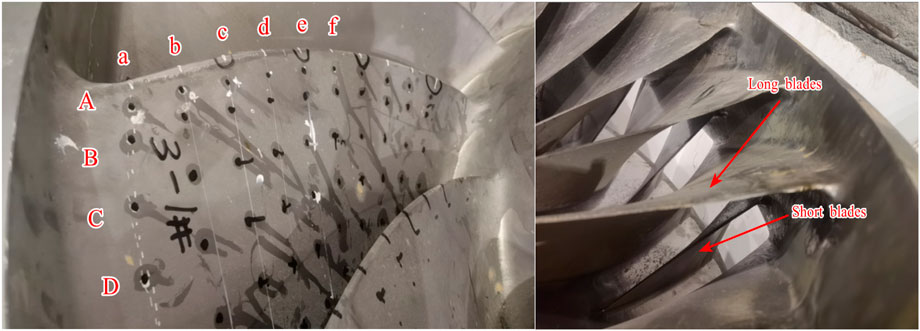
FIGURE 12. Measuring point of ultrasonic thickness gauge for turbine blades.
The data in Table 5 below are the theoretical thickness of each measuring point of runner blade of 3F unit of a hydropower station:
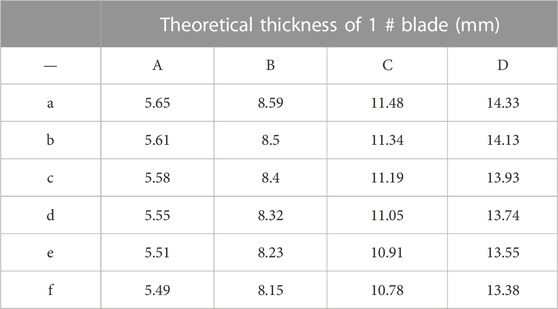
TABLE 5. Theoretical thickness of 1 # blade.
The data in Table 6 below are the existing thickness of each measuring point of runner blade after the 3F unit of a hydropower station operates for 2,483.92 h:
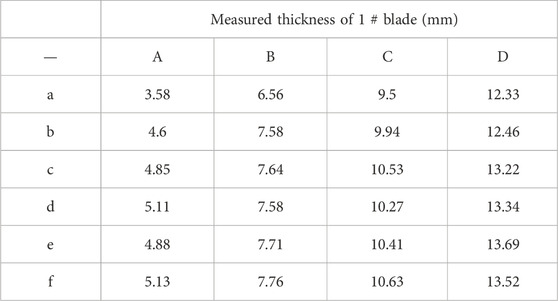
TABLE 6. Measured thickness of 1 # blade.
The data in Table 7 below are the difference between the theoretical thickness of runner blades of 3F unit of a hydropower station and the existing thickness of each measuring point after 2,483.92 h of operation:
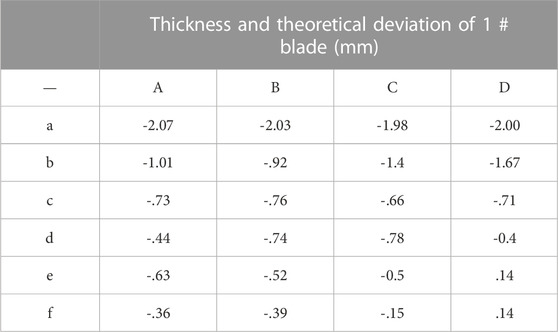
TABLE 7. Thickness and theoretical deviation of 1 # blade.
The results show that after 2,482.92 h of unit operation, the runner of 3F unit was severely worn and the blade thickness was significantly reduced. After measuring the wear of long blades (1#) with ultrasonic thickness gauge, it is found that the wear of blades at A-a position is -2.07 mm, and the predicted wear depth is -2.28 mm according to simulation calculation, with an error of 10.14%.
1) In the sediment wear test, the sample material of hydraulic turbine blade is 0Cr13Ni5Mo. Suspended sediment was sampled from the river near the dam of the hydropower station. In the test, the conservative maximum sediment concentration of 1.93 kg/m3 was taken during the operation of the hydraulic turbine unit. According to the sediment wear test results of five groups of samples at different flow velocities, under the same sediment concentration and sediment composition, the wear depth per unit time of turbine blade material samples increases rapidly with the increase of sand and water velocity.
2) The maximum wear depth of the runner blade in the actual measurement of the unit is -2.07 mm, which is located near the water outlet edge of the runner long blade and the lower ring welding point. The wear depth of the same position predicted by the sediment wear digital simulation for the same operation time cycle is -2.28 mm. The trend of the sediment wear depth of the runner blade is consistent with the actual measurement trend of the unit, and the error of the maximum wear depth prediction is about 10%, Therefore, the digital simulation prediction method has certain engineering guiding significance.
3) The sediment abrasion depth curve obtained by sediment abrasion test, combined with two-phase flow digital simulation calculation based on Euler-Euler equation and turbulence model, can realize conservative prediction of sediment abrasion depth of hydraulic turbine blades, provide a method for flow body design and evaluation of sediment abrasion resistance performance of high head and high sediment concentration hydraulic turbine runner blades, and help to improve the sediment abrasion prevention and control technology of this type of hydraulic turbine blades, And carry out application and promotion in the project.
4) This study also has the following shortcomings: first, it is unable to fully consider all the operating conditions of the turbine runner blades in the complex working environment, as well as the continuous changes of river sediment (Cao et al., 2018) with the upstream water flow. Secondly, the influence of cavitation and sediment coupling on the prediction of runner blade wear depth cannot be considered. At present, we can only measure the maximum sediment concentration with conservative rivers for many years to ensure that there is enough margin for predicting the sediment wear depth of turbine runner blades.
The original contributions presented in the study are included in the article/Supplementary Material, further inquiries can be directed to the corresponding author.
JP JM, JH, and YZ contributed to the conception and design of the study. YZ and WZ organized the database. JH and JM performed the statistical analysis. JP wrote the first draft of the manuscript. LW and JM performed the finite element calculation. All authors contributed to manuscript revision, and read and approved the submitted version.
This research was funded by Special Support Plan for High Level Talents in Zhejiang Province (No. 2021R52036).
LW was employed by Hangzhou Resource Power Equipment Co. Ltd.
The remaining authors declare that the research was conducted in the absence of any commercial or financial relationships that could be construed as a potential conflict of interest.
All claims expressed in this article are solely those of the authors and do not necessarily represent those of their affiliated organizations, or those of the publisher, the editors and the reviewers. Any product that may be evaluated in this article, or claim that may be made by its manufacturer, is not guaranteed or endorsed by the publisher.
Bohn, B., Khoie, R., Gopaluni, R. B., Olson, J. A., and Stoeber, B. (2019). Development and characterization of a non-intrusive sensor to measure wear in centrifugal pumps. IEEE sensors J. 19 (18), 7906–7914. doi:10.1109/jsen.2019.2919283
Cao, H., Zhang, J., Dong, X., and Chen, C. (2018). Study on sediment characteristics of baihetan hydropower station [J]. People's Yangtze River 49 (23), 16–20. doi:10.16232/j.cnki.1001-4179.2018.23.003
Cheng, L., and Chen, H. (2009). Feasibility analysis on measurement research of turbine blade abrasion of Three Gorges Hydropower Station [J]. China Water Transp. (the second half of the month) 9 (12), 105–106. doi:10.3969/j.issn.1006-7973-C.2009.12.054
Gao, Z., Zhou, X., Zhang, S., and Lu, L. (2002). Three dimensional turbulent flow calculation and wear prediction of turbine runner [J]. Journal of Hydraulic Engineering 9, 37–43. doi:10.3321/j.issn:0559-9350.2002.09.007
Jiarui, C. (2021). Study on the relationship between river turbidity of Yingxiuwan Hydropower Station and sediment wear of turbine runner blades [D]. China: Xihua University. doi:10.27411/d.cnki.gscgc.2021
Li, Y., Guo, B., and Xiao, Y. (2020). Numerical study of hydro-abrasive erosion in high-head Francis turbine runner [J]. Journal of Hydroelectric Engineering 39 (02), 112–120. doi:10.11660/slfdxb.20200211
Noon, A. A., and Kim, M. H. (2016). Erosion wear on centrifugal pump casing due to slurry flow. [J]. Wear 364-365, 103–111. doi:10.1016/j.wear.2016.07.005
Shi, B., Pan, J., Wu, L., Zhang, X., Qiu, Y., and Zhang, Y. (2020). A prediction method of wear for volute casing of a centrifugal slurry pump. [J]. Geofluids 2020, 1–12. doi:10.10.1155/2020/8847087
Tang, C., Yang, Y. C., Liu, P. Z., and Kim, Y. J. (2021). Prediction of abrasive and impact wear due to multi-shaped particles in a centrifugal pump via CFD-DEM coupling method. Energies 14, 2391. doi:10.3390/en14092391
Tao, Y., Bai, Y. M., and Wu, Y. C. (2021). Influence of blade thickness on solid–liquid two-phase flow and impeller wear in a ceramic centrifugal slurry pump. Processes 9 (8), 1259. doi:10.3390/pr9081259
Tarodiya, R., and Gandhi, B. K. (2019). Numerical simulation of a centrifugal slurry pump handling solid-liquid mixture: Effect of solids on flow field and performance. Adv. Powder Technol. 30, 2225–2239. doi:10.1016/j.apt.2019.07.003
Tian, W. (2020). Study on internal flow and wear of turbine guide vane in Francis turbine of multi-sediment high head. China: Xihua University. doi:10.27411/d.cnki.gscgc.2020.000455
Xu, B., Lin, Z., Zhu, Z., and Yu, T. (2022). Experimental and simulation study of the effect of gravity on the solid-liquid two-phase flow and erosion of ball valve. Advanced Powder Technology 33, 103416. doi:10.1016/J.APT.2021.103416
Yang, Y. (2020). A thousand weeks Research on in situ ultrasonic thickness measurement technology based on dry coupling [D]. China: Zhejiang University. doi:10.27461/d.cnki.gzjdx.2020.003941
Yu, J., Tang, S., and Pan, L. (2007). “Prediction and analysis of silt wear of xiluodu hydraulic turbine [C],” in Proceedings of the technical seminar on the stability of hydraulic turbine generator units (AIP) (Economic Daily Press), 339–347.
Keywords: sediment wear, sediment content, complex conditions, francis turbine, wear depth
Citation: Pan J, Ma J, Han J, Zhou Y, Wu L and Zhang W (2023) Prediction of sediment wear of francis turbine with high head and high sediment content. Front. Energy Res. 10:1117606. doi: 10.3389/fenrg.2022.1117606
Received: 06 December 2022; Accepted: 23 December 2022;
Published: 11 January 2023.
Edited by:
Ling Zhou, Jiangsu University, ChinaReviewed by:
Jiaxing Lu, Xihua University, ChinaCopyright © 2023 Pan, Ma, Han, Zhou, Wu and Zhang. This is an open-access article distributed under the terms of the Creative Commons Attribution License (CC BY). The use, distribution or reproduction in other forums is permitted, provided the original author(s) and the copyright owner(s) are credited and that the original publication in this journal is cited, in accordance with accepted academic practice. No use, distribution or reproduction is permitted which does not comply with these terms.
*Correspondence: Junzhao Han, aGFuanpAenN0dS5lZHUuY24=
Disclaimer: All claims expressed in this article are solely those of the authors and do not necessarily represent those of their affiliated organizations, or those of the publisher, the editors and the reviewers. Any product that may be evaluated in this article or claim that may be made by its manufacturer is not guaranteed or endorsed by the publisher.
Research integrity at Frontiers
Learn more about the work of our research integrity team to safeguard the quality of each article we publish.