 Linchao Dai
94% of researchers rate our articles as excellent or good
Learn more about the work of our research integrity team to safeguard the quality of each article we publish.
Find out more
ORIGINAL RESEARCH article
Front. Energy Res., 13 January 2023
Sec. Process and Energy Systems Engineering
Volume 10 - 2022 | https://doi.org/10.3389/fenrg.2022.1096539
This article is part of the Research TopicAdvance in Energy Security Engineering and Methane Emission Reduction ScienceView all 5 articles
The measurement of gas content in coal seam by means of indirect method involves heavy workload, long period, high cost and complicated operation and a proneness of negative values in the process of measuring gas absorption constant. To address these problems, the gas basic parameters and coal quality indexes of 90 coal samples from 90 coal mines in 13 provinces of China are determined experimentally in this paper. The intrinsic relationship between gas adsorption constant a and atmospheric adsorption capacity
Coal seam gas content has an immediate impact on the amount of coal seam gas and the amount of mine gas emission, which is of great significance for the appropriate design of mine ventilation, gas drainage, outburst risk assessment and so on (Wang et al., 2018; Zhou et al., 2022a; Ma et al., 2022). The determination method of gas content in coal seam includes direct method and indirect method (Zhou, 2014; Lei et al., 2018; Cheng et al., 2019). The direct method is used to determine the desorption gas quantity and atmospheric gas quantity in the underground field and laboratory, and then calculate the gas loss in the sampling process, and the sum of the three parts is the gas content in the coal seam. On the basis of the gas adsorption constant and coal quality index measured in the laboratory, as well as the coal seam gas pressure measured in the field, the indirect method is used to calculate the adsorption gas quantity and free gas quantity of coal through Langmuir equation, and the sum of the two parts is the gas content of coal seam. Compared with the direct method, the parameters measured by the indirect method are all measured values, including the gas pressure in the coal seam, and as there are fewer influencing factors in the process of measurement, the measurement error is small, and the measured data has higher credibility. The values measured by direct method are often lower than the actual values, whereas the values measured by indirect method in many mines are often closer to the actual values (Li et al., 2020; Wang et al., 2022). However, the indirect method has its deficiencies-the measurement of gas adsorption constant needs to be done in laboratory and the measurement of coal-seam gas pressure needs to be done in the pit. These involve heavy workload, long period, high cost, complex operation and high technical requirements. The measurement of coal-seam gas pressure is quite difficult, especially in the gently inclined coal seam or the coal seam with poor compactness of surrounding rock. For the coal samples with very low degree of metamorphism or coal samples with a large amount of coal gangue, the gas adsorption constant is often negative, which is not consistent with the theory, making it impossible to determine the gas content in coal seam using indirect method.
As there are various factors affecting coal seam gas content, and gas occurrence features complexity, non-linearity, dynamic and random uncertainty, it is difficult to accurately determine and predict coal seam gas content (Scott, 2002; Xiang, 2017; Long et al., 2018; Wang et al., 2019; Malinnikova et al., 2020; Si et al., 2021a; Banerjee and Chatterjee, 2021; Deng, 2021; Xiao et al., 2022). In recent years, a significant body of researchers have devoted to the prediction of gas content in coal seams and achieved fruitful results. Li (2014) and Wang (2015) established a mathematical model for predicting coal seam gas content based on drilling cuttings gas desorption index method. Gao et al. (2015) established a multivariate linear regression model for predicting coal seam gas content by using partial least square multiple linear regression. Hao and Sun (2015), Xu et al. (2019) and Zhou et al. (2016) used grey theory to construct the prediction method of coal seam gas content. Lin et al. (2020) proposed a gas content prediction model (PSO-BP model) based on particle swarm optimization (PSO) optimization error back propagation (BP) neural network. Zhao et al. (2022) established a gas content prediction model (ACSOA-BP) based on adaptive chaotic seagull algorithm optimized BP neural network. Wei and Pei (2019) established a coal seam gas content prediction model based on PCA-AHPSO-SVR, and found that the average accuracy of the proposed PCA-AHPSO-SVR model is 5.51% and 9.32% higher than that of PCA-PSO-SVR and PSO-SVR model, respectively. In a study by Wang et al. (2016), a new method of coal seam gas content measurement based on the small gap of gas adsorption and desorption characteristics of coal seams in the same geologic unit was proposed. Li et al. (2019) used a support vector machine (SVM) network for sensitive parameters training based on genetic constraints to establish a set of prediction methods for the volume gas content. Zhou et al. (2022b) built a collaborative prediction model of gas emission quantity by feature selection and supervised machine learning algorithm to improve the scientific and accurate prediction of gas emission quantity in the mining face.
As can be seen from the above research, the existing prediction models of coal seam gas content are focused on the relationship between coal seam gas content and influencing factors such as coal seam depth, coal seam thickness, floor elevation, fault distance, coal seam dip angle and so on. However, the predication of coal seam gas content based on the correlation between gas basic parameters and coal quality indicators is rarely studied. Coal quality indexes include moisture Mad, ash Aad, volatile Vdaf, initial gas release velocity
The gas adsorption constant of coal characterizes the adsorption capacity of coal to methane, reflecting the maximum gas adsorption capacity and coal quality characteristics (Lei, 2017). The purpose of determining the gas adsorption constant in the laboratory is to calculate the gas content in coal seam, which is an indirect method to determine the gas content in coal seam. At present, the roadways in a vast majority of mines are located along the coal seam, so the indirect method is widely used to determine the gas content in coal seams (Zhao and Jia, 2019; Plaksin and Kozyreva, 2021). High pressure volumetric method is used to determine adsorption constant (7 gas adsorption capacities corresponding to 7 equilibrium pressures with approximate average distribution in the range of 0∼5 MPa are measured), and the HCA-1 high pressure capacity method (Chen et al., 2012; Zhang et al., 2015; Zhou et al., 2019) is used to determine the experimental determination process of gas adsorption device as shown in Figure 1.
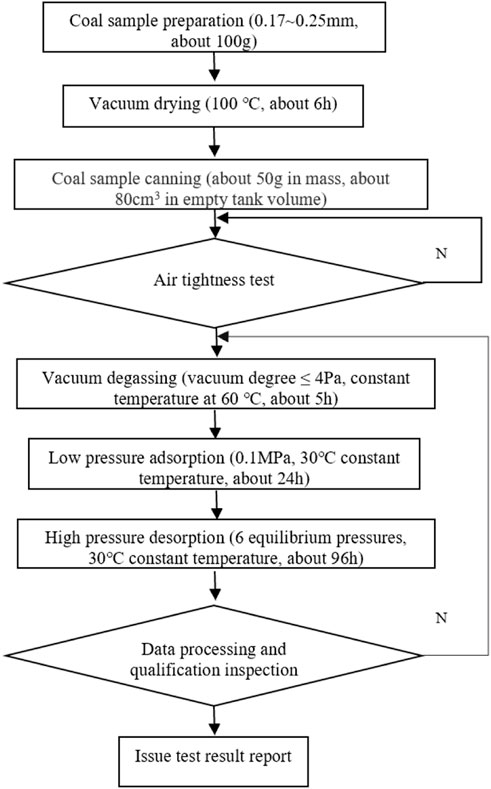
FIGURE 1. Measurement process of HCA-1 high pressure volume gas adsorption device.
Ninety coal samples were collected from 90 coal mines in 13 provinces, including Guizhou, Jiangxi, Anhui, Xinjiang, Sichuan, Liaoning, Shaanxi, Henan, Shanxi, Jilin, Qinghai, Yunnan and Inner Mongolia. According to the national standards such as GB/T 482-2008 “Methods for Coal Seam Samples”, GB/T 474-2008 “Coal Sample Preparation Methods”, GB/T 477-2008 “Coal Sample Sieving Test Methods” and other national standards, about 5 kg powder mixed coal samples taken from freshly exposed coal seams, after being marked with the mine name and sampling location on the tightly sealed packages, were sent to the laboratory for numbering, registration, sampling, drying, crushing, sieving, etc., before they were prepared to be coal samples of different particle sizes for inspection.
According to the coal industry standards and national standards such as MT/T 752-1997 “Method for Determination of Methane Adsorption of Coal”, GB/T 212-2008 “Method for Industrial Analysis of Coal”, GB/T 217-2008 “Method for Determining the True Relative Density”, and GB/T 6949-2008 “Method for Determination of Apparent Relative Density of Coal”, 90 coal samples were measured in the laboratory using HCA-1 high pressure volumetric gas adsorption device, industrial analysis instrument, density meter and other instruments and equipment. More specifically, the coal quality indexes and gas basic parameters such as moisture Mad, ash Aad, volatile Vdaf, true density TRD, apparent density ARD, porosity F, atmospheric adsorption capacity
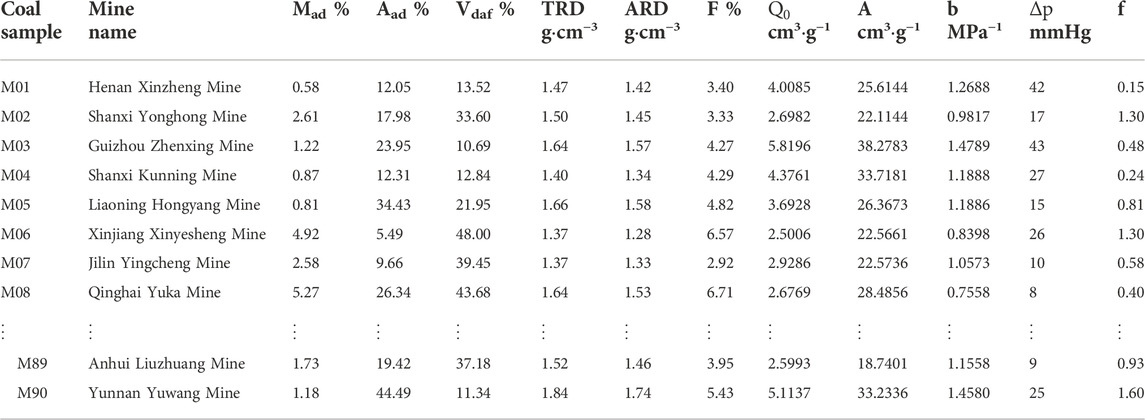
TABLE 1. Measured 90 coal sample coal quality index and gas basic parameters summary table (part).
From Table 1, the variation ranges of the parameters of 90 coal samples measured are as follows: Mad is 0.48–9.31%, Aad is 2.71–70.73%, Vdaf is 5.33–55.91%, TRD is 1.33–2.27 g.cm−3, ARD is 1.28–2.11 g.cm−3, F is 2.19–13.04%,
In general, multivariate nonlinear regression is defined as follows: based on the fact that the nonlinear function has multiple derivatives in the independent variable range, the nonlinear function relationship between multivariate independent variables and dependent variables is established by transforming the nonlinear relationship into a generalized linear relationship and carrying out regression analysis by means of mathematical statistics. The general nonlinear regression model can be expressed as follows:
In the equation, x represents observable random independent variables; c represents parameter vectors to be estimated; y represents independent observation variables; ε represents random variables. Eq. 1 is often used to solve the estimated value of the parameters using the least square method to minimize the sum of squares of the residual. The sum of squares function of residual error and its first derivative are:
The c of the above equation can be solved by calculating the Equation 2, and the global minimum can be estimated.
Taking gas adsorption constants a and b as dependent variables, 9 factors such as Mad, Aad, Vdaf, TRD, ARD, F,
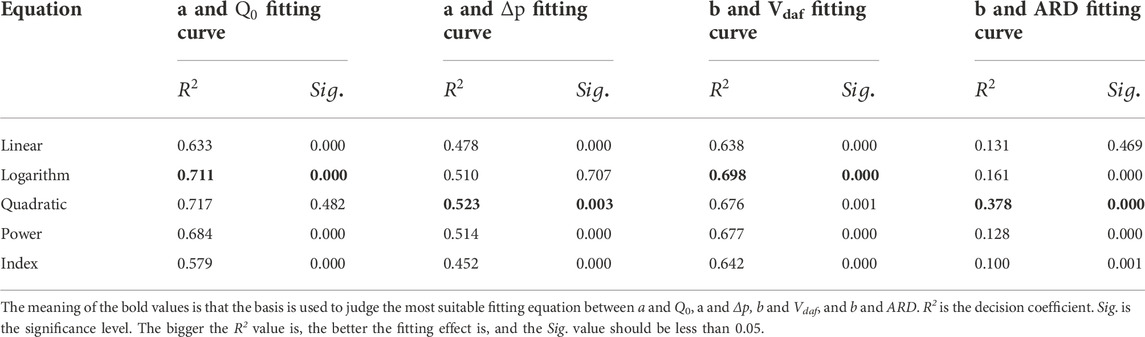
TABLE 2. Estimated results of gas adsorption constants a and b curves.
From Table 2, for a and b, five commonly used unary curve equations such as linear, logarithmic, quadratic, power and index are established respectively. By comparing the coefficient of determination
Let the gas adsorption constant a be the equal of the dependent variable
The gas adsorption constants a and b are taken as dependent variables and f1, f2, f3 and f4 as independent variables respectively, and the linear regression model of Equation 4 is obtained.
After testing, the decision coefficients R2 of a and b are 0.737 and 0.728 respectively, indicating that f1 and f2 can explain 73.7% of the changes of the dependent variable a and 72.8% of the changes of the dependent variable b, as well as high goodness of fit of regression. The significance level (the probability value corresponding to t statistics) is
The multiple nonlinear regression models of a and b are obtained by putting f1, f2, f3, and f4 into Equation 4, as shown in Eq. 5.
Atmospheric adsorption capacity, also known as residual gas capacity, refers to the maximum gas capacity of coal adsorption under atmospheric pressure. In the laboratory, the degassing method is used to make the coal sample in the state of negative pressure, and then make the coal sample adsorb methane gas at atmospheric pressure to reach adsorption saturation. Atmospheric adsorption is an important part of the prediction of gas emission from mining face, and it is also one of the prevention and control indexes of coal and gas outburst (Wu et al., 2011; Lu et al., 2022). Both an and a characterize the adsorption and desorption performance of coal, the difference between them is that the adsorption pressure is different, the adsorption pressure is standard atmospheric pressure, and the adsorption pressure of an is the limit.
Figure 2 shows the overall variation trend of a under different
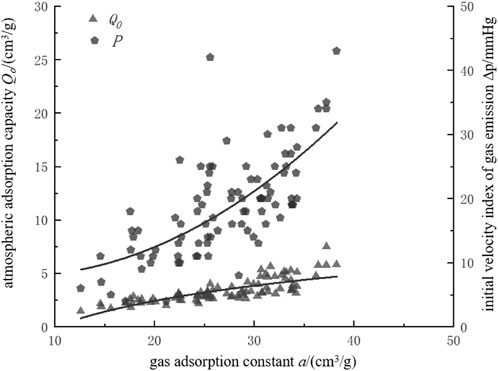
FIGURE 2. Relationship between parameters
The initial gas emission velocity of coal represents the gas release capacity of coal at the moment of pressure relief. In Figure 2, with the increase of
According to the multivariate nonlinear regression equation5, a curved surface fitting diagram of the influence of atmospheric pressure adsorption capacity
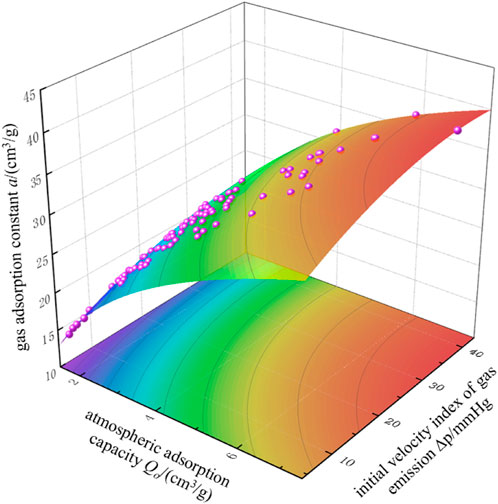
FIGURE 3. Surface fitting plot with gas adsorption constant a and
The gas adsorption constant b characterizes the speed of coal adsorption and desorption of gas. The overall change law of b under different volatile matter Vdaf and apparent density ARD can be seen from Figure 4. With the increase of volatile matter Vdaf, b attenuates as a logarithmic function, and when Vdaf increases to a certain extent, b decreases to a minimum. This is because Vdaf characterizes the metamorphic degree of coal, and the larger the Vdaf, the lower the metamorphic degree of coal, the weaker the adsorption capacity of coal, the slower the adsorption speed, and the longer the time to reach adsorption saturation, the smaller the b. On the contrary, the smaller the Vdaf, the stronger the adsorption capacity of coal, the faster the adsorption speed, and the shorter the time to reach the adsorption saturation state, the greater the b. With the increase of apparent density ARD, b shows the trend of quadratic function from low to high and from high to low. This is because ARD characterizes the pore volume of coal. When ARD increases, the pore volume of coal increases, the pore size of coal increases, the gas escape channel becomes shorter, the resistance to gas desorption decreases, and the desorption rate increases, b increases accordingly. When ARD increases to a certain extent, some types of coal may change due to higher degree of coal metamorphism, the arrangement of coal molecular structure changes from disorder arrangement to neat arrangement, the pore volume decreases rapidly, the gas desorption path lengthens with higher resistance, b decreases accordingly.
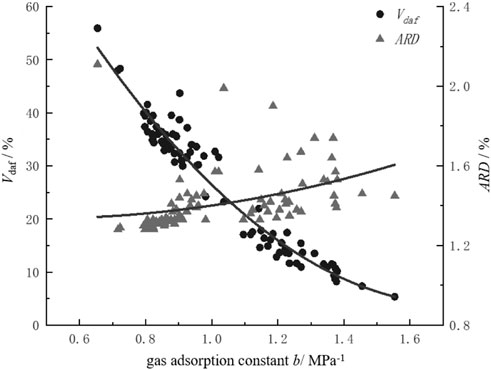
FIGURE 4. Relationship between parameters Vdaf, ARD and b in 90 coal samples.
According to the multivariate nonlinear regression model (5), a surface fitting diagram of the effect of coal volatile matter Vdaf and coal apparent density ARD on gas adsorption constant b is established, as shown in Figure 5. The impact trend of Vdaf on b is in a shape of downward curve, that is, when ARD is in the range of 1.28–1.69 g/cm3, the metamorphic degree of coal decreases with the increase of Vdaf, and the b value increases significantly with the increase of Vdaf. when ARD is in the range of 1.70–2.11 g/cm3, with the increase of Vdaf, the metamorphic degree of coal decreases significantly. The three-dimensional curved surface reflects the influence of Vdaf - ARD correlation on the evolution of b from peak to valley, that is, the pore volume of coal changes from high to low and low to high.
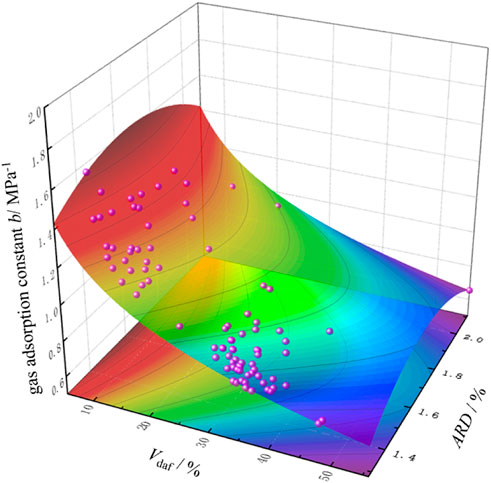
FIGURE 5. Surface fitting plot with gas adsorption constant b and Vdaf -ARD.
The most commonly used indirect method of determining coal seam gas content both domestically and internationally is to calculate the coal seam gas content according to the known coal seam gas pressure and the gas adsorption constant of coal measured in the laboratory. The equation is as follows:
Through the above experimental study, the multiple nonlinear regression model of gas adsorption constant a and b is obtained, and the mathematical model of gas content in coal seam W' is obtained by replacing Eqn 5 with (6), as shown in Eq. 7.
From the Eqn 7, the gas content in coal seam is in connection with both gas pressure in coal seam and the seven indexes of coal quality index and gas basic parameters. The measurement of these seven indexes in the laboratory features simple operation, low cost and short time, and the test can be completed within 24 h. This greatly improves the measurement efficiency and reduces the measurement cost, and provides a solution to the problem that some coal samples cannot be determined by indirect method due to negative values of gas adsorption constant. Six coal samples were taken from 6 coal mines in Shanxi, Guizhou and Inner Mongolia provinces, and the coal quality indexes and gas basic parameters of 6 coal samples were measured in the laboratory. The coal seam gas content is predicted by using the mathematical model of coal seam absolute gas pressure p and coal seam gas content in 6 coal mines, and the predicted values W' are compared with the measured values W as shown in Table 3.
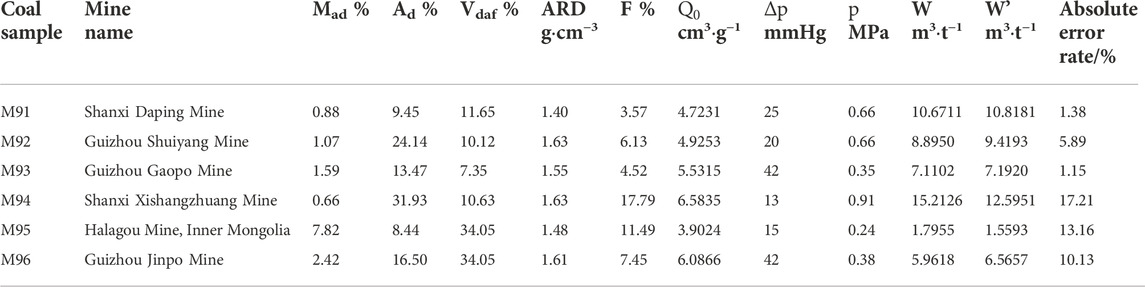
TABLE 3. Comparison of the deviation between the predicted value and measured value of coal seam gas content.
From Table 3, when the absolute coal seam gas pressure of Shanxi Daping Mine, Guizhou Shuiyang Mine, Guizhou Gaocheng Mine, Shanxi Xishangzhuang Mine, Inner Mongolia Halagou Mine and Guizhou Jinpo Mine are 0.66MPa, 0.66MPa, 0.35MPa, 0.91MPa, 0.24MPa and 0.38 MPa respectively, the range of predicted and measured coal seam gas content is 1.795–15.2126 m3/t. The maximum absolute deviation between predicted value and measured value is 2.6175 m3/t, the minimum absolute deviation is 0.0818 m3/t, and the average absolute deviation is 0.7018 m3/t. The maximum absolute error rate is 17.21%, the minimum absolute error rate is 1.15%, and the average absolute error rate is 8.15%.
From Figure 6, the broken line change trend of the predicted value W' of coal seam gas content in 6 coal mines tends to be consistent with the measured value W, especially in Shanxi Daping Coal Mine, Guizhou Gaopo Coal Mine and Inner Mongolia Halagou Coal Mine, and the two broken lines are close to coincidence, which meets the prediction requirements, indicating high accuracy and reliability of the coal seam gas content prediction model.
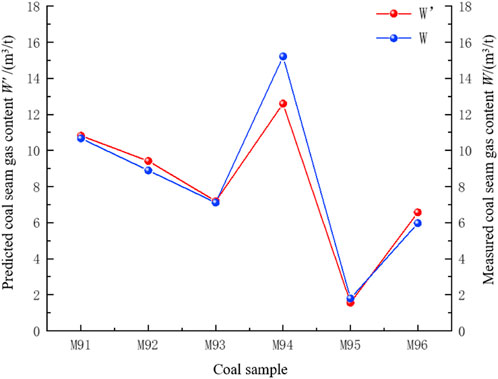
FIGURE 6. Comparison of predicted value W' and measured value W of coal seam gas content.
In this paper, the gas basic parameters and coal quality indexes of 90 coal samples from 90 coal mines in 13 provinces of China are determined, and a prediction model of coal seam gas content based on gas basic parameters and coal quality index is established. The following conclusions are mainly obtained:
1) Through the test of gas basic parameters and coal quality index of 90 coal mine samples, the curve estimation and multiple linear regression of the test data are carried out by using SPSS data software, and the multiple nonlinear regression models of gas adsorption constant a and
2) The effects of single factor
3) The prediction model of coal seam gas content based on gas basic parameters and coal quality index is established. Seven indexes in the model can be used to complete the experimental test within 24 h, which improves the measurement efficiency and reduces the measurement cost, and provides a solution to the problem that some coal samples cannot be determined by indirect method due to negative values of gas adsorption constant. Through the comparison between the predicted values W' and the measured values W of the six coal samples, the average absolute error rate of W' is 8.15%, which meets the prediction requirements. It follows from the above analysis that coal seam gas content prediction model is of instructive significance.
The original contributions presented in the study are included in the article/supplementary material, further inquiries can be directed to the corresponding author.
LD, HL, and RF contributed to conception and design of the study. HL and XC organized the experimental data. LD and HL performed the statistical analysis. LD and HL wrote the first draft of the manuscript. XC and RL wrote sections of the manuscript. All authors contributed to manuscript revision, read, and approved the submitted version.
This work is financially supported by Natural Science Foundation of Chongqing (No. CSTB2022NSCQ-MSX1080), Chongqing Science Fund for Distinguished Young Scholars (No. cstc2019jcyjjqX0019), National Natural Science Foundation of China (No. 51874348, 51974358, 52104239) and Science and Technology Innovation and Entrepreneurship Fund of China Coal Technology Engineering Group (No. 2019-TD-QN040) which are gratefully acknowledged.
The authors also thank the editor and reviewers very much for their valuable advices.
The authors declare that the research was conducted in the absence of any commercial or financial relationships that could be construed as a potential conflict of interest.
All claims expressed in this article are solely those of the authors and do not necessarily represent those of their affiliated organizations, or those of the publisher, the editors and the reviewers. Any product that may be evaluated in this article, or claim that may be made by its manufacturer, is not guaranteed or endorsed by the publisher.
Banerjee, A., and Chatterjee, R. (2021). A methodology to estimate proximate and gas content saturation with lithological classification in coalbed methane reservoir, Bokaro Field, India. Nat. Resour. Res. 30 (3), 2413–2429. doi:10.1007/s11053-021-09828-2
Chen, Q., Yang, H. M., Wang, Z. F., Chen, X. J., and Xia, H. H. (2012). The impact of low pressure point on determination results of methane adsorption constant based on high-pressure volumetric method for determing adsorption constant. Saf. Coal Mines 43 (09), 7–9. doi:10.13347/j.cnki.mkaq.2012.09.060
Cheng, B., Qiao, W., Yan, W. X., and Xiang, Y. B. (2019). Research progress on determination method of coal seam gas content in coal mine. Min. Saf. Environ. Prot. 46 (04), 98–103. doi:10.3969/j.issn.1008-4495.2019.04.022
Deng, N. (2021). Research status on direct measurement and sampling technology for coal seam gas content. Min. Saf. Environ. Prot. 48 (04), 113–117. doi:10.19835/j.issn.1008-4495.2021.04.021
Gao, B. B., Pan, J. Y., Liu, Y. P., and Yuan, M. S. (2015). Study on prediction model of seam gas content based partial least squares regression. J. Henan Polytech. Univ. Sci. 34 (2), 146–150. doi:10.16186/j.cnki.1673-9787.2015.02.002
Hao, T. X., and Sun, X. L. (2015). Analysis of factors affecting coal seam gas content and gray prediction for No.2 mine second panel in Huangling mining area. Coal Technol. 34 (1), 158–160. doi:10.13301/j.cnki.ct.2015.01.056
Hu, J. (2020). Experimental study on rapid determination of coal hardiness coefficient by crushing method. Min. Saf. Environ. Prot. 47 (1), 17–20. doi:10.19835/j.issn.1008-4495.2020.01.004
Lei, H. Y. (2022). Experimental study on influencing factors of initial gas emission velocity based on multiple liner regression. Saf. Coal Mines 53 (2), 9–15. doi:10.13347/j.cnki.mkaq.2022.02.002
Lei, H. Y. (2017). Influencing factors of negative value of gas adsorption quantity in gas adsorption constant tests. Saf. Coal Mines 48 (10), 143–147. doi:10.13347/j.cnki.mkaq.2017.10.039
Lei, H. Y., Pang, J. L., Che, Y. T., and Cao, J. (2018). Experimental study on calibration of calculation formula of gas content in coal seam by indirect method. Min. Saf. Environ. Prot. 45 (04), 37–40. doi:10.3969/j.issn.1008-4495.2018.04.008
Li, C. W., Wang, Y. L., Wang, Q. J., and Gao, X. (2020). Experimental study on accuracy of direct gas content determination. J. China Coal Soc. 45 (01), 189–196. doi:10.13225/j.cnki.jccs.YG19.1673
Li, D., Peng, S. P., Du, W. F., and Guo, Y. L. (2019). New method for predicting coal seam gas content. Energy Sources Part A Recovery Util. Environ. Eff. 41 (10), 1272–1284. doi:10.1080/15567036.2018.1545003
Li, X. J. (2014). Experimental research on the relationship between gas desorption index of drill cuttings and gas content. Saf. Coal Mines 45 (3), 8–12. doi:10.13347/j.cnki.mkaq.2014.03.003
Lin, H. F., Gao, F., Yan, M., Bai, Y., Xiao, P., and Xie, H. J. (2020). Study on PSO-BP neural network prediction method of coal seam gas content and its application. China Saf. Sci. J. 30 (9), 80–87. doi:10.16265/j.cnki.issn1003-3033.2020.09.012
Long, Q. M., Hu, Q. T., Zhang, Z. Y., and Ren, T. (2018). On factors affecting coalbed gas content measurement. Measurement 121, 47–56. doi:10.1016/j.measurement.2018.02.026
Lu, Z., Wang, L., Lv, M. Z., Lei, Y., Wang, H., and Liu, Q. Q. (2022). Experimental study on coal and gas outburst risk in strong outburst coal under different moisture content. Front. Earth Sci. 10, 782372. doi:10.3389/feart.2022.782372
Ma, S. Q., Liu, B. X., and Xie, H. (2022). Development of technology and device for rapid and direct determination of coal seam gas content. J. North China Inst. Sci. Technol. 19 (04), 111–117. doi:10.19956/j.cnki.ncist.2022.04.018
Malinnikova, O. N., Ul'yanova, E. V., Kharchenko, A. V., and Pashichev, B. N. (2020). Influence of coal microstructure on gas content of the face area. J. Min. Sci. 56 (3), 351–358. doi:10.1134/s106273912003683x
Plaksin, M. S., and Kozyreva, E. N. (2021). Determining the gas content of coal beds. Coke Chem. 64 (4), 144–147. doi:10.3103/s1068364x21040062
Saghafi, A. (2017). Discussion on determination of gas content of coal and uncertainties of measurement. Int. J. Min. Sci. Technol. 27 (5), 741–748. doi:10.1016/j.ijmst.2017.07.024
Scott, A. R. (2002). Hydrogeologic factors affecting gas content distribution in coal beds. Int. J. Coal Geol. 50 (1-4), 363–387. doi:10.1016/s0166-5162(02)00135-0
Si, L. L., Wei, J. P., Xi, Y. J., Wang, H. Y., Wen, Z. H., Li, B., et al. (2021). The influence of long-time water intrusion on the mineral and pore structure of coal. Fuel 290, 119848. doi:10.1016/j.fuel.2020.119848
Si, L. L., Zhang, H. T., Wei, J. P., Li, B., and Han, H. K. (2021). Modeling and experiment for effective diffusion coefficient of gas in water-saturated coal. Fuel 284, 118887. doi:10.1016/j.fuel.2020.118887
Tang, J. (2014). Research on influence of coal adsorption properties upon its gas diffusion characteristics. Min. Saf. Environ. Prot. 41 (6), 16–18. doi:10.3969/j.issn.1008-4495.2014.06.005
Wang, F. L., Zhao, X. S., Liang, Y. P., Li, X. L., and Chen, Y. L. (2018). Calculation model and rapid estimation method for coal seam gas content. Processes 6 (11), 223. doi:10.3390/pr6110223
Wang, J. L., Zhai, J. T., Qin, Y., Wang, L. L., and Ju, Y. W. (2019). Influencing factors analysis and prediction of the loss of gas content after gas drainage in Xutuan Mine of Huaibei, China. J. China Coal Soc. 44 (08), 2401–2408. doi:10.13225/j.cnki.jccs.KJ19.0486
Wang, L., Cheng, L. B., Cheng, Y. P., Liu, S. M., Guo, P. K., Jin, K., et al. (2016). A new method for accurate and rapid measurement of underground coal seam gas content. J. Nat. Gas Sci. Eng. 26, 1388–1398. doi:10.1016/j.jngse.2015.08.020
Wang, Y. J. (2015). Study on reverse projection of coalbed gas content using desorption of drill-cuttings. Coal Technol. 34 (12), 147–149. doi:10.13301/j.cnki.ct.2015.12.058
Wang, Y. P., Kang, J. H., Zhou, F. B., Yuan, L., and Pan, Z. (2022). Evaluation of lost gas in the borehole drilling stage: Implication for the direct method of coalbed methane content determination. J. Nat. Gas Sci. Eng. 105, 104711. doi:10.1016/j.jngse.2022.104711
Wang, Z. Q. (2022). Prediction method of coal and gas outburst intensity based on Digital Twin and Deep Learning. Front. Energy Res. 10, 891184. doi:10.3389/fenrg.2022.891184
Wei, G. Y., and Pei, M. (2019). Prediction of coal seam gas content based on PCA-AHPSO-SVR. J. Saf. Sci. Technol. 15 (3), 69–74. doi:10.11731/j.issn.1673-193x.2019.03.011
Wu, D. M., Cheng, Y. P., and An, F. H. (2011). Determination of gas pressure and gas content based on residual gas quantity of coal sample. J. Min. &Safety Eng. 28 (2), 315–318. doi:10.3969/j.issn.1673-3363.2011.02.028
Xiang, D. H. (2017). Analysis and prediction study on factors affecting gas content of coal seam. China Energy Environ. Prot. 39 (6), 216222–217218. doi:10.19389/j.cnki.1003-0506.2017.06.044
Xiao, P., Liu, X. X., and Zhao, Bo. (2022). Experimental study on gas adsorption characteristics of coals under different Protodyakonov's coefficient. Energy Rep. 8, 10614–10623. doi:10.1016/j.egyr.2022.08.212
Xu, G., Wang, L., Wang, H. T., Wang, K., and Feng, Y. Z. (2019). Prediction method of coal seam gas content based on grey theory and BP neural network. Coal Technol. 38 (11), 82–85. doi:10.13301/j.cnki.ct.2019.11.028
Zhang, X. S., Long, Q. M., Zhang, S. T., and Li, J. G. (2015). Influence of linear regression equation on coal adsorption constant. Saf. Coal Mines 46 (11), 171–174. doi:10.13347/j.cnki.mkaq.2015.11.048
Zhao, W., Chen, P. H., and Cao, Y. (2022). Prediction model of coal seam gas content based on ACSOA optimized BP neural network. Saf. Coal Mines 53 (1), 174–180. doi:10.13347/j.cnki.mkaq.2022.01.028
Zhao, X. B., and Jia, Z. W. (2019). Influence of ground stress on coal seam gas pressure and gas content. Fluid Dyn. Mater. Process. 15 (1), 53–61. doi:10.32604/fdmp.2019.04779
Zhao, Y., and Niu, X. G. (2022). Experimental study on work of adsorption gas expansion after coal and gas outburst excitation. Front. Earth Sci. 10, 886309. doi:10.3389/feart.2022.886309
Zhou, F. B., Kang, J. H., Wang, Y. P., and Zhang, R. (2022). Method of underground integrated automatic and accurate determination of coalbed gas content. J. China Coal Soc. 47 (08), 2873–2882. doi:10.13225/j.cnki.jccs.2022.0451
Zhou, H. Q. (2014). Analysis and discussion of some problems about gas content in coal seam. Min. Saf. Environ. Prot. 41 (5), 9097–9192. doi:10.3969/j.issn.1008-4495.2014.05.025
Zhou, J., Lin, H. F., Jin, H. W., Li, S. G., Yan, Z. G., and Huang, S. Y. (2022). Cooperative prediction method of gas emission from mining face based on feature selection and machine learning. Int. J. Coal Sci. Technol. 9 (1), 51. doi:10.1007/s40789-022-00519-8
Zhou, X. H., Niu, Y. P., Bai, G., and Zhang, X. W. (2019). Experimental study on factors affecting volume of CO2 adsorbed by coal. China Saf. Sci. J. 29 (12), 85–90. doi:10.16265/j.cnki.issn1003-3033.2019.12.014
Keywords: coal seam gas content, gas basic parameters, coal quality index, prediction model, absolute error
Citation: Dai L, Lei H, Cheng X and Li R (2023) Prediction of coal seam gas content based on the correlation between gas basic parameters and coal quality indexes. Front. Energy Res. 10:1096539. doi: 10.3389/fenrg.2022.1096539
Received: 12 November 2022; Accepted: 22 November 2022;
Published: 13 January 2023.
Edited by:
Feng Du, China University of Mining and Technology, ChinaReviewed by:
Gaoming Wei, Xi’an University of Science and Technology, ChinaCopyright © 2023 Dai, Lei, Cheng and Li. This is an open-access article distributed under the terms of the Creative Commons Attribution License (CC BY). The use, distribution or reproduction in other forums is permitted, provided the original author(s) and the copyright owner(s) are credited and that the original publication in this journal is cited, in accordance with accepted academic practice. No use, distribution or reproduction is permitted which does not comply with these terms.
*Correspondence: Hongyan Lei, 45338851@qq.com
Disclaimer: All claims expressed in this article are solely those of the authors and do not necessarily represent those of their affiliated organizations, or those of the publisher, the editors and the reviewers. Any product that may be evaluated in this article or claim that may be made by its manufacturer is not guaranteed or endorsed by the publisher.
Research integrity at Frontiers
Learn more about the work of our research integrity team to safeguard the quality of each article we publish.