 Yanping Li1,2
 Feng Hong
94% of researchers rate our articles as excellent or good
Learn more about the work of our research integrity team to safeguard the quality of each article we publish.
Find out more
ORIGINAL RESEARCH article
Front. Energy Res., 09 January 2023
Sec. Process and Energy Systems Engineering
Volume 10 - 2022 | https://doi.org/10.3389/fenrg.2022.1037539
This article is part of the Research TopicAdvance in Energy Security Engineering and Methane Emission Reduction ScienceView all 5 articles
With the increasing penetration of renewable energy in the power grid, which makes power plant equipment is always in changing operating conditions. The correlation between the main and auxiliary equipment of the unit is easy to lead a potential fault, therefore, the safety and reliability of the auxiliary equipment of thermal power units have become a more challenging issue in the case of large-scale renewable energy. Adaptive condition monitoring of the auxiliary equipment can reduce maintenance costs and improve reliability in the thermal power units. Most existing studies perform poorly at extracting features from distributed control systems data and make less use of time series data. A novel adaptive condition monitoring framework and early fault warning method based on long short-term memory and stack denoising auto-encoder network has been proposed for auxiliary equipment of power plant unit. The proposed framework has two main parts, which contain condition monitoring and adaptive early fault warning. The Mahalanobis distance of a reconstruction error is defined as the monitoring indicator to reflect the condition of the equipment. The Chebyshev inequality determines an adaptive threshold for early anomaly detection that applies to changeable working conditions. The effectiveness of the proposed method was verified by the actual case of the coal mill. The adaptive threshold method can obtain the advance time of 42s and 108s, respectively.
The integration of large-scale renewable energy sources is forcing more frequent changes in the operating conditions of thermal unit auxiliary equipment to maintain grid stability. Under the influence of variable operating conditions, the correlation between the primary and auxiliary equipment leads to an increase in the potential failure hazards of the unit. Therefore, the safety and reliability of the auxiliary equipment of thermal power units have become a more challenging issue in the case of large-scale renewable energy. An excellent early fault warning system can help operators detect potential fault signals at the early stage of the fault to prevent further fault development and ensure the safe and stable operation of power plants. In addition, it can improve the safety and reliability of auxiliary equipment significantly, and decrease unpredicted faults and maintenance costs of thermal power units (Agrawal et al., 2015). Consequently, intelligent condition monitoring and early fault warning of thermal power units have become a research hotspot.
Generally, the recent research on condition monitoring can be divided into three types: model-based, statistics-based, and data-based. The model-based approach focuses on building mathematical models for anomaly detection based on relevant principles. Agrawal et al. (Agrawal et al., 2015) reviewed various anomaly detection techniques for coal mills in power units. Guo et al. (Guo et al., 2014) developed an approach for condition monitoring and fault detection of the Tube-ball mill in power plant. Willersrud et al. (Willersrud et al., 2015) built an accurate analytical model to design an adaptive observer to observe the variation of parameters. However, many parameters in the mechanism model are difficult to measure on the production site, the model-based approach is complicated in practice. In addition, the noise and harsh environment in real industrial processes affect the reliability of the model. Therefore, the model-based approach has poor anomaly detection performance and possesses a limited range of applications. Widarsson et al. (Widarsson and Dotzauer, 2008) used the Bayesian network to analyze the balance of steam and fuel, and then the probability of the heat boiler leakage was calculated to realize the fault warning. Hajdarevic et al. (Hajdarevic et al., 2015) used a probabilistic neural network to perform early fault warning in thermal power plants. Kisi¢ et al. (Kisi¢ et al., 2012) adopted a T2 multivariate control chart to analyze the condition of coal grinding mills. The advantage of the statistics-based approach reduces the level of human intervention. However, it requires a large amount of fault data to complete anomaly monitoring. It is challenging because failure data for industrial equipment in operation is often difficult to obtain. With the development of artificial intelligence, it has become feasible to mine hidden features from operation data. The data-based approach built a condition monitoring model based on historical data, which makes it highly versatile and adaptable. Nikula et al. (Nikula et al., 2016) presented a data-driven method for monitoring boiler performance. Rostek et al. (Rostek et al., 2015) used artificial neural networks (ANN) for the early detection of abnormal conditions in fluidized bed boilers. Chen et al. (Chen et al., 2018) provided a KNN-based approach to condition monitoring and applied it to power plants. Hong et al. (Hong et al., 2019) implemented support vector regression (SVR) to monitor and diagnose of coal mill conditions. Although the above methods that rely on a priori knowledge can obtain good condition monitoring performance, they all require normal and fault data simultaneously. Fault data are scarce or even unavailable at the production site. Therefore, the development of an intelligent condition monitoring method using only normal data is significant for actual applications. Historical data from the distributed control system (DCS) of the thermal power units have recorded the health conditions of the thermal power units, which can be used for condition monitoring. In recent years, deep learning has gained attention for its excellent feature extraction and nonlinear representation capabilities, which make it easy to extract useful features from devices (Lecun et al., 2015; Li et al., 2021). A deep neural network has been widely applied in regarding industrial health prognostic issue (Lei et al., 2018; Zhao et al., 2019; Qin et al., 2021; Qin et al., 2022), which have achieved great success in health prognostic field. Qin et al. (Qin et al., 2022) proposed a slow-varying dynamics-assisted temporal CapsNet (SD TemCapsNet) to simultaneously learn the slow-varying dynamics and temporal dynamics from measurements for accurate RUL estimation. Lei et al. (Lei et al., 2018) review from data acquisition to RUL prediction that aims at predicting the accurate failure time before a system failure happens. Qin et al. (Qin et al., 2021) proposed a SoC estimation method by exploiting temporal dynamics of measurements and transferring consistent estimation ability among different temperatures. Deep learning is designed to provide extract hierarchical representations from input data by multi-layer nonlinear transformations, which is applicable to thermal power plant auxiliaries with highly nonlinear and associative relationships. It is time-consuming and costly to monitor multiple variables using multiple models. Thus, there is a need to find a condition monitoring method that does not require a complex feature extraction process and fault data. Different deep learning networks, such as autoencoder (AE) (Zhao et al., 2018), deep belief network (DBN) (Tamilselvan and Wang, 2013), convolutional neural network (CNN) (Li et al., 2017), denoising autoencoder (DAE) (Wang et al., 2018), stacked denoising autoencoder (SDAE) (Lu et al., 2017; Li et al., 2020), and sparse autoencoder (SAE) (Sun et al., 2016), have been investigated for condition monitoring and anomaly detection. Although the above methods can effectively achieve nonlinear relationships among DCS data, their ability to extract time-dependent relationships hidden in historical data is insufficient in the current study. To address this problem, a condition monitoring framework based on the long short-term memory (LSTM) approach has been proposed, which has shown its effectiveness in solving various machine learning problems involving time series data (Zhao et al., 2017; Lei et al., 2019; Wang et al., 2019; Hong et al., 2020; Pang et al., 2020). The experimental results of the above studies show that deep learning networks outperform the existing intelligent approaches such as SVM, ANN, and CNN (Lei et al., 2019). Pang et al. (Pang et al., 2020) proposed a new spatio-temporal fusion method for fault diagnosis of wind turbines. Zhao et al. (Zhao et al., 2017) proposed a deep learning network based on raw data, which combined CNN and bidirectional LSTM to monitor tool wear conditions. Wang et al. (Wang et al., 2019) proposed degradation assessment of rolling bearing based on convolutional neural network and deep long-short term memory network. Hong et al. (Hong et al., 2020) proposed a bed temperature prediction of CFB boilers based on LSTM. The above methods can effectively mine the nonlinear relationships among multivariate data to achieve good performance of condition monitoring, but the prerequisite requires feature selection and labeling information.
Autoencoder is an unsupervised neural network model. The process of obtaining implicit features from the input data is called encoding, and reconstructing the original input data with the new learned features is called decoding. The monitoring data of thermal power units are time-series related. The cumulative effect causes the performance changes over a period of time, which can take advantage of the excellent temporal data processing capability of LSTM. Inspired by the above studies, the hidden layer neurons of AE are replaced by LSTM neurons in this study. As a result, a condition monitoring and early fault warning method for the auxiliary equipment of thermal power units based on LSTM-SDAE is proposed. A nonlinear correlation between multiple variables and the time dependence of each variable can be captured by the LSTM-SDAE model simultaneously. The LSTM-SDAE network for condition monitoring proposed in this research provides timely warnings before abnormalities occur, which helps operators take preventive measures to prevent potential failures.
The contribution of our study is that: 1) deep extraction of time series features with the LSTM encoding and decoding structure. 2) introducing an adaptive threshold solution to adapt to the changeable working conditions of the equipment. 3) providing an unsupervised condition monitoring method that uses only normal data to achieve early fault warning of power plant equipment without label information.
The rest of the paper is organized as follows; a basic principle of the proposed method is introduced in Chapter 2. In Chapter 3, the improved SDAE is introduced, and the framework based on LSTM-SDAE is proposed for condition monitoring. A case study and verification results are shown in Chapter 4, and Chapter 5 elaborates on the conclusion.
AE is a symmetric network that uses unsupervised learning algorithms and consists of an encoder and a decoder. AE is a feedforward neural network to learn representative characteristics directly from data (Rumelhart et al., 1986; Zhao et al., 2019), the basic structure of AE is shown in Figure 1. The AE can learn the intrinsic feature from raw data directly, without the need to manually select the input variables. Encoding a high-dimensional input into a low-dimensional hidden variable is called the encoding process, while decoding the encoded input into a high-dimensional one is called the decoding process. The encoding and decoding processes are described as follows, respectively:
Here the input, hidden representation, and output are defined as x, h, and z, respectively.
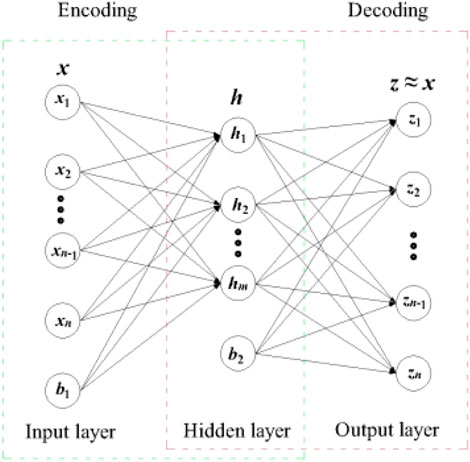
FIGURE 1. The structure of Auto-Encoder.
m, λ represent the sample numbers and the weight decay coefficient. The first term is the reconstruction loss between the actual value and the reconstructed value. The second term is the weight attenuation, which is used to indicate the strength of the weight decay and prevent over-fitting (Hu et al., 2020).
The harsh operating environment of industrial sites tends to produce random disturbances, sensor measurement errors, and other uncertainties. DAE is a class of auto-encoders that accept corrupted data as input and are trained to predict the original undamaged data as output. Noise is added to the input training data, and the auto-encoder learns more robust representations of the input data, which forces it to have a better generalization capability than AE (Vincent et al., 2010). The architecture of a DAE is illustrated in Figure 2. They are reconstructing the real original input from the data containing random noise. The actual data x can be recovered from the data containing random noise
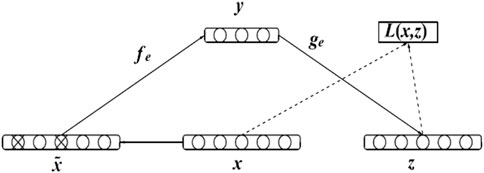
FIGURE 2. The architecture of DAE.
Shallow networks are limited in their ability to handle complex problems. Owing to its excellent nonlinear mapping capability to capture more intrinsic features, the SDAE network has the ability to solve complex problems in industrial production. The SDAE network is stacked by multiple DAEs to form a deep learning framework. Each layer of autoencoder is trained unsupervised to minimize the error between input and reconstructed output, the hidden representation of the (n-1)th DAE is obtained by the input of the nth DAE, and then the SDAE network is stacked by decoding the nth DAE, (n-1)th DAE,…1st DAE orderly (Vincent et al., 2010; Yang et al., 2019). During the training process of each DAE, greedy layer-wise pre-training is employed to conduct a deep framework without labeled information.
LSTM is a variant of a recurrent neural network (RNN) that can learn time-series dependencies by sharing parameters of layer weights. The LSTM layer achieves long and short-term memory control through the forgetting gate, the updating gate, and the output gate (Hochreiter and Schmidhuber, 1997). However, the introduction of the gate structure makes it possible to capture long-term dependencies and nonlinear dynamics between time series data points, as shown in the LSTM architecture in Figure 3.
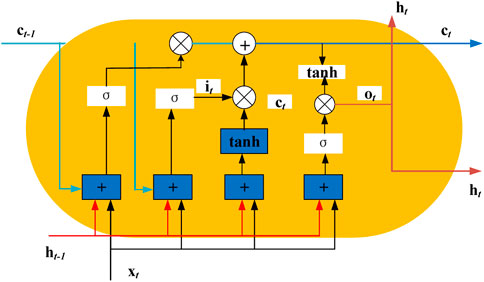
FIGURE 3. The basic structure of the LSTM block.
A classical LSTM architecture usually consists of a cell and three gates to control the flow of information within the LSTM cell. The forward calculation formula of LSTM is shown below:
where, it, ft, ct, ot represents the input gate, the forgetting gate, the cell state, and the output gate respectively, W and b represent the corresponding weight coefficient matrix and bias term, σ is the activation function (Greff et al., 2015). The sigmoid activation function and the tanh activation function are formulated as follows:
When providing early warning on the operating status of power generation equipment, it is necessary to determine whether the monitoring indicator exceeds the alarm threshold. The most common approach is to apply a fixed threshold to the monitoring indicator. If it exceeds the threshold, then a fault is detected. However, the fixed threshold approach does not take into account the effects of variable operating conditions, which can lead to missed or false alarms. Therefore, a suitable threshold is a key factor for early abnormality detection. In this study, a dynamic threshold is proposed based on probability theory that can be dynamically adjusted according to the changing operating conditions of the unit to reduce the number of false alarms. For any real number n > 0, the Chebyshev inequality is presented as follows (Chakraborty and Elzarka, 2019):
According to interval estimation in statistics, for a wide class of probability distributions, no more than
Since we only focus on the cases where the monitored value is greater than the threshold value, we consider the upper threshold
Only the mean value, the variance at time N-1, and the monitoring indicator value at time N must be considered for calculating the mean value according to Eqs. 15, 16. The threshold can be dynamically adjusted on the basis of the real-time mean and variance of the residual. Therefore, an adaptive threshold value that is updated in real time can be obtained according to Eq. 17. Here, n is chosen to be 2.
In order to realize the condition monitoring and early fault warning of the equipment in a power plant, a framework based on the LSTM-SDAE structure is presented in this study.
The LSTM-SADE framework with a sliding window size of 8 is illustrated in Figure 4. The details of the framework are shown as follows.
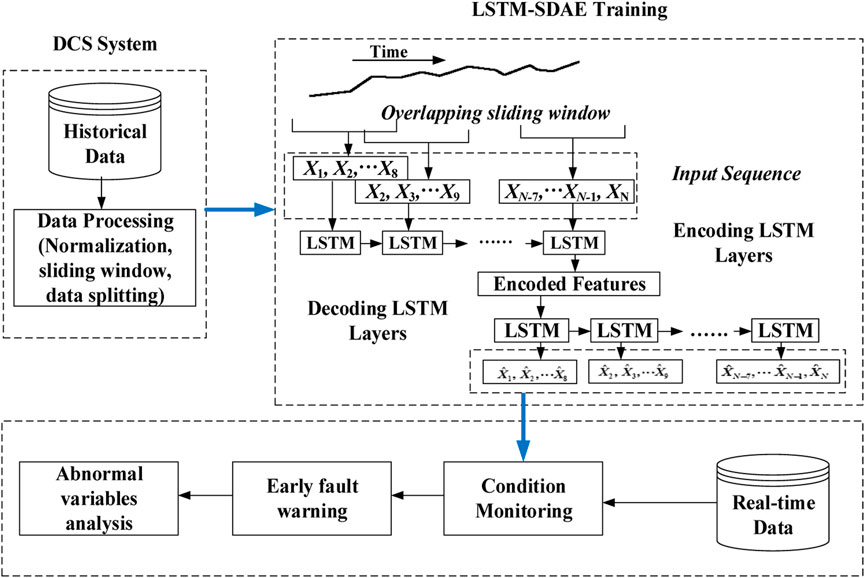
FIGURE 4. The LSTM-SDAE framework of condition monitoring and early fault warning.
The neurons in the hidden layer of AE were replaced by LSTM units, and the time series data of the equipment during normal operation were used as training data. LSTM-SDAE is an SDAE that uses LSTM to extract time-series features from the signal, combining the advantages of AE and LSTM. The LSTM-SDAE training is divided into two parts: LSTM encoders and LSTM decoders. The former encoding produces a hidden representation of the input data, which serves as input to the LSTM neuron for the next moment; the latter uses the hidden representation and the value predicted in the previous step to reconstruct the encoded time series. Subsequently, the monitoring indicators are calculated using the Mahalanobis distance (MD) of the reconstruction error obtained from the model output and the actual values of the model. Anomalies are identified by comparing with adaptive thresholds based on the Chebyshev inequality. Finally, the test data are used to verify the feasibility of the proposed method.
The reconstruction error (RE) which is calculated from the input of the LSTM-SDAE network and its reconstruction value is defined as a monitoring indicator. When an anomaly occurs, the monitoring indicator calculated by the reconstruction errors will deviate from the normal range. Most of the literature has usually used a similarity metric based on the Euclidean distance to measure the degree of deviation between the actual input and its reconstructed values (Jiao, 2018; Wang et al., 2018), which only considers the similarity of the distance but ignores the similarity of distribution. Unlike the Euclidean distance, MD not only excludes the correlation interference between variables but also has scale-invariant, giving univariate distance values for multivariate data to complete anomaly detection in different domains (de la Hermosa González-Carrato, 2018). Building a univariate monitoring indicator is critical for detecting anomalies easily and effectively (Lin and Chen, 2013; Chen et al., 2020). Therefore, the MD of the reconstruction error is chosen as the monitoring indicator in this paper.
The multivariate reconstruction errors of normal operating data
The monitoring indicator
Where,
The whole condition monitoring and early fault warning procedure is shown in Figure 5. First, data processing is vital to model training, including normalization and sliding windows. The LSTM-SDAE model is then constructed to represent the intrinsic features among the variables by training the LSTM-SDAE network layer by layer. Next, MD is obtained from a univariate monitoring indicator that represents the condition of the equipment. After that, due to the frequently changing working conditions and external disturbances in practice, a dynamic threshold based on the Chebyshev inequality is introduced to detect occurrences of early anomalies. Finally, compared with other methods, the data were tested to verify the feasibility and effectiveness of the proposed framework.
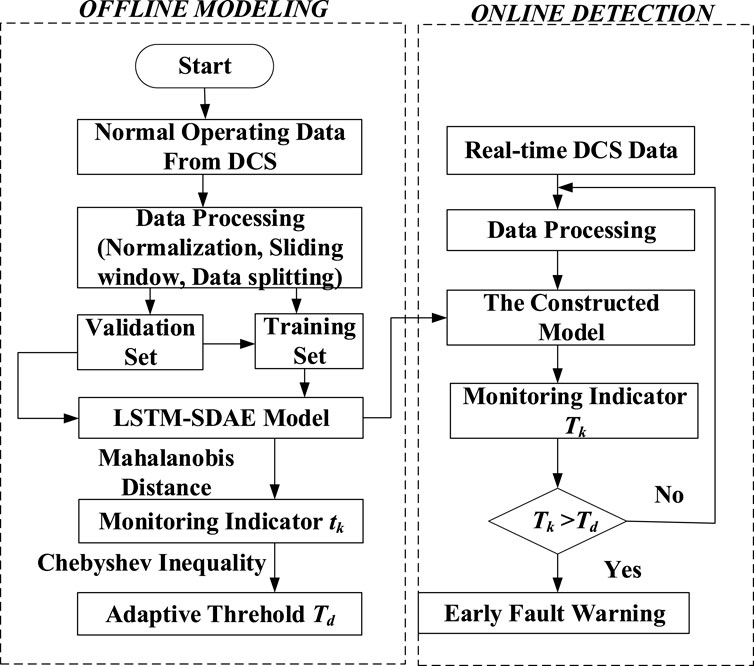
FIGURE 5. The flow chart of condition monitoring and early fault warning.
In fact, most equipment often goes through a series of degradation states before failure occurs, and if the various degradation states can be identified, further degradation and failure can be effectively prevented. Before a failure finally occurs, abnormal behavior in operation can be seen as an early signal of an impending failure. The effectiveness of the proposed method is demonstrated by a case study involving actual operational data collected from a 330 MW coal-fired unit in China. According to statistical data, the coal mill has the highest unplanned outage rate among auxiliary equipment of thermal power units. The coal mill is an essential component of coal-fired power plants, which affecting economic performance and reliability. If the load increases under flexible and variable operating conditions, the output of blending coal cannot adapt to the change of load, which will easily cause a blockage of the coal mill. Due to the blockage of coal mill, the amount of pulverized coal entering the boiler will be lower than the amount of coal supply, thus reducing the main steam pressure and unit load, which will reduce the outlet temperature of the coal mill, increase the differential pressure of the coal mill, and increase the mill current.
In this study, a medium-speed coal mill is used to illustrate the effectiveness of the proposed method in condition monitoring and early fault warning of auxiliary equipment in thermal power units. The dataset which including load-up, load-down, and steady-state was collected from DCS under normal operation. The sampling time is 6s, and a total of 10,600 sample points from 28-11-2015 to 02-12-2015 were obtained subsequently. The LSTM-SDAE model was trained with 8800 normal operating samples, and its performance was tested with 1800 samples. According to the operation log time recorded by the operator, the coal mill was found to be an abnormal blockage at the 1206th and 1382nd sample points. Seven parameters including the coal mill current, the inlet primary air flow, the coal feed flow, the inlet primary air temperature, the inlet primary air pressure, the outlet temperature of the coal mill, and the differential pressure between the inlet and outlet of the coal mill were selected as input variables in this research. The variables from DCS are shown in Table 1.
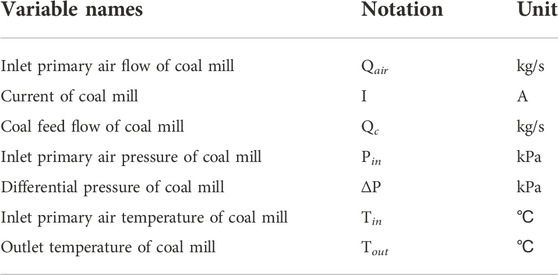
TABLE 1. Variables description.
Data preprocessing is vital in the performance of the model. Min-Max normalization is utilized on the training data to transform all variables to between 0 and 1 to avoid large prediction errors. Besides, the test data uses the same maximum and minimum values as the training data to ensure that both datasets are within the same scale. In addition, the input data and output data need to be modified to a tensor with a three-dimensional shape [nsample; ntimesteps; nfeatures], where nsample is the number of samples in the batch (including training, validation, and testing dataset sizes) and ntimesteps is the number of time steps, nfeatures are the features of the samples. By adopting moving window processing, the nonlinear correlation between multivariate variables and the time-dependent relationship between each variable can be extracted simultaneously. The sliding window size chosen for this study is 8.
The model is implemented in Python (Version 3.8, Anaconda) with Keras and Tensorflow at the backend and employs Adam as the optimizer. In this simulation, the hardware parameters are as follows: the CPU is Intel(R) i7 Core, the main frequency is 4.0 GHz, and the memory is 12 GB. Since the input data collected from DCS has multiple dimensions, four hidden layers were used to build this network. The layers, output shapes, and parameter numbers of this model are listed in Table 2.
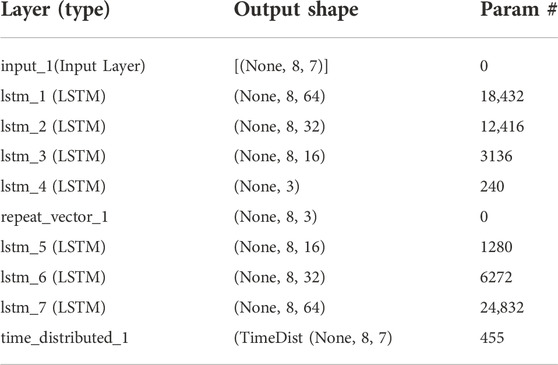
TABLE 2. LSTM-SDAE model and its layers.
The selection of appropriate hyper-parameters plays a crucial role in improving of model performance. All variables are collected as input data to reduce the loss of operational state information. Validation errors are used to select the model architecture with the best performance by iterative experiments. The optimal monitoring model based on LSTM-SDAE was established with the parameters which are listed in Table 3.
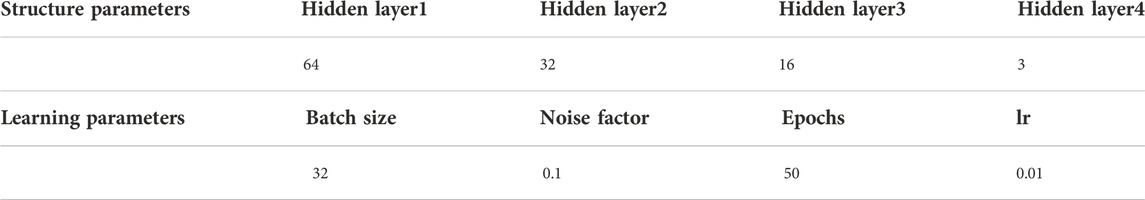
TABLE 3. Optimal parameters of LSTM-SDAE model.
The mean squared error (MSE) of the optimal monitoring model is within the industry’s allowable range, which can be used for condition monitoring and anomaly detection.
Taking the differential pressure and the outlet temperature of the coal mill as examples, the reconstructed results and the relative errors of the observed and reconstructed values are shown in Figure 6. The reconstructed values of these two variables are morphologically similar to the observed values, which indicates that the LSTM-SDAE model can deeply explore the nonlinear relationships in the operating data and thus effectively characterize the operating conditions of the coal mill. Therefore, the proposed method is helpful for further accurate and timely condition monitoring and early warning.
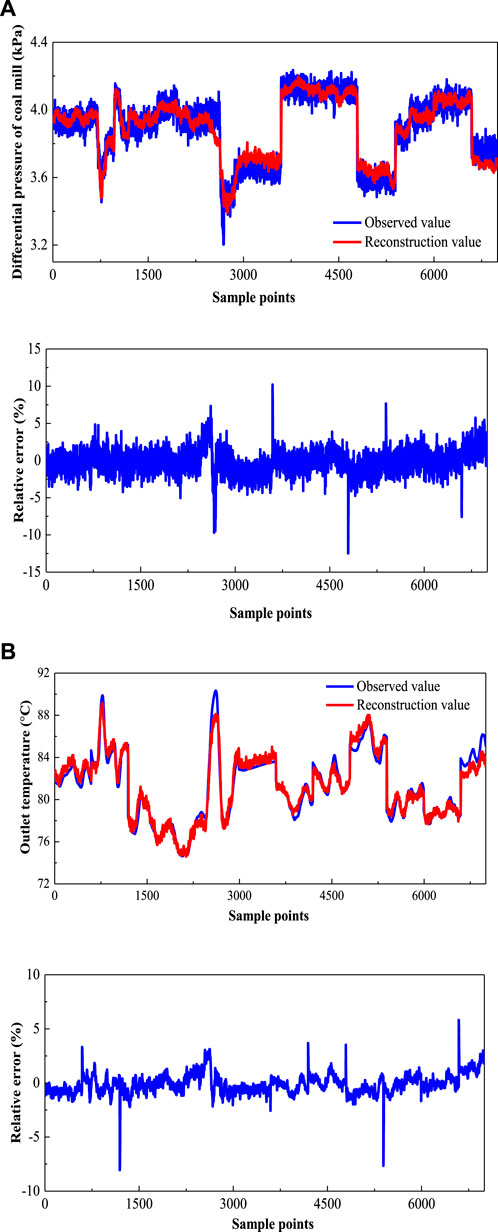
FIGURE 6. Reconstructed value and relative error: (A) reconstructed value and relative error of differential pressure (B) reconstructed value and relative error of outlet temperature.
As shown in Figure 7, it is observed that the adaptive threshold varies with the monitoring indicator under normal conditions, neither exceeding the threshold nor showing false positives. It is observable that the proposed method has good generalizability and is in good agreement with the physical principles of the coal mill. As can be seen in Figures 6, 7, this is reliable for ensuring good condition monitoring.
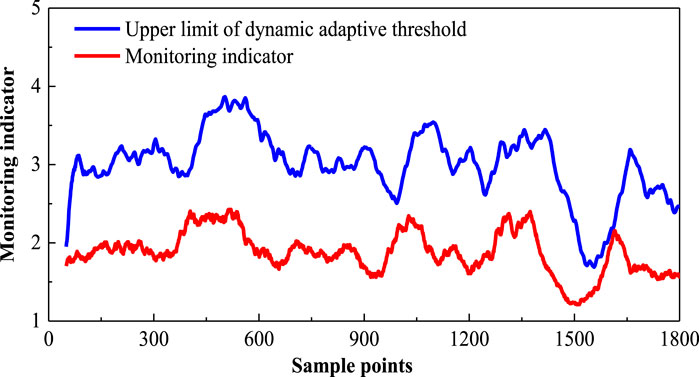
FIGURE 7. The monitoring indicator under normal condition.
Using the test data, the results of early fault warning are presented in Figure 8. The monitoring curve with an adaptive threshold of the coal mill blockage is shown in Figure 8A. To show the early warning effect more intuitively, the monitoring indicators are extracted from the 1000th sample to the 1400th sample, and the results are shown in Figure 8B. If the coal mill is severely blocked, the trend of the monitoring indicators will shift and then cross the threshold value. At the 1023rd and 1316th sampling points, the monitoring indicator crossed the threshold value, which indicates that an initial anomaly may have occurred. According to the operating mechanism of the coal mill, the main sign of coal mill blockage is the increasing of the coal mill current, which is due to the decrease of the coal feed flow, and the outlet temperature starts to decrease and the differential pressure starts to increase meanwhile. Therefore, the ratio of coal mill current to coal feed flow is increasing theoretically. Using actual DCS operating data, the ratio of mill current to coal feed flow is shown in Figure 9. The ratio tends to increase, indicating an anomaly, and the warning times for the 1206th and 1382nd samples were found to coincide with the times of the operator’s recorded operating log. In fact, the actual values of outlet temperature and differential pressure did not reach their DCS alarm limits at this instant, but a blockage warning was issued at this time. The warning times before the critical blockage occurred were nearly 18.3 min (183*6 s) and 6.6 min (66*6 s), respectively. Monitoring indicators remained above the threshold for a short time and returned to normal after adjustment by the field operator. It is clear that an alarm can be issued before the blockage starts. Consequently, the proposed scheme can give an early warning of the coal mill blockage in time to avoid further failure development. At the same time, it serves as a reference basis for the site operator to take appropriate measures for timely maintenance.
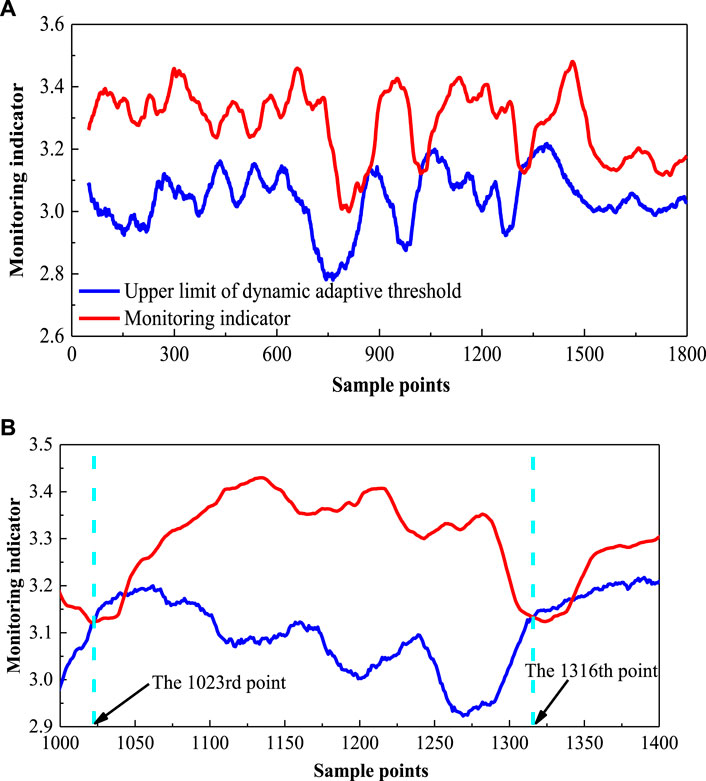
FIGURE 8. The results of early fault warning based on LSTM-SDAE (A) early fault warning result (B) enlarged view from the 1000th to the 1400th sample points.
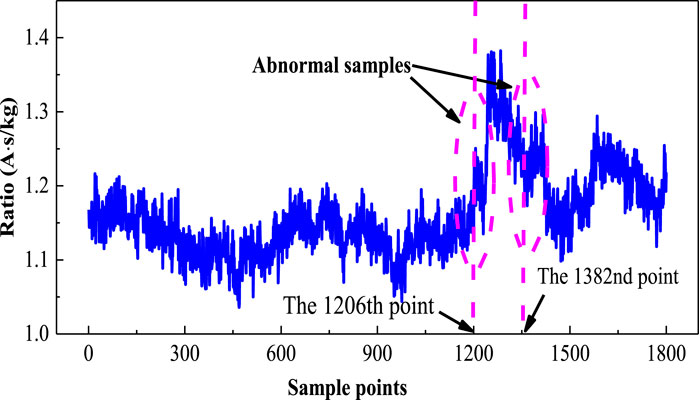
FIGURE 9. The ratio of coal mill current to coal feed flow.
The models of LSTM-SAE (the same structure except for noise factor) and the SDAE (the same structure except for hidden cells) were used for comparison to illustrate the effect of time-dependent manipulations on model accuracy. The comparison results of the model performance are shown in Table 4, which shows the proposed model can extract the internal characteristics adequately among the high-dimensional time series data of the coal mill. The maximum relative error of each variable is less than 1.2%, which can accurately reflect the dynamic behavior of the coal mill system.
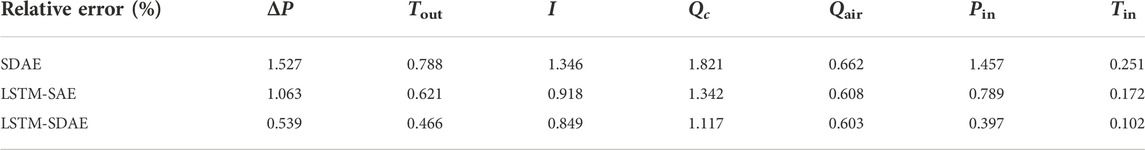
TABLE 4. Relative errors comparison of the three models.
In this study, mean squared error (MSE), root mean square error (RMSE), and mean absolute error (MAE) were used as performance evaluation criteria as shown in Eqs. 20–22.
RMSE determines the variance between the original signal Xk and the reconstructed signal Zk. m is the length of the data. The smaller the RMSE, MAE, and MSE, higher the accuracy of the constructed model is. The comparison results are presented in Table 5. It can be seen that the LSTM-SDAE model outperforms other methods, proving the effectiveness of the proposed method.
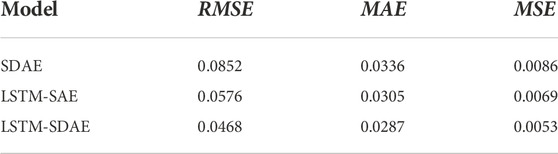
TABLE 5. Accuracy comparison of the three models.
From Table 5, it can be seen that the LSTM-SDAE model performs better than the LSTM-SAE model and SDAE model, which demonstrating the necessity of combining LSTM and denoising operation to process the input data as described in the previous chapter. The reason is that the LSTM-SDAE model can make full use of the ability that LSTM is good at handling the temporal dependence in multidimensional time-series data, which makes it perform better than the LSTM-SAE and SDAE models.
The comparison results of the early warning using adaptive and fixed thresholds are shown in Figure 10, which show that the warning times of the fixed threshold method are nearly 17.6 min (176*6s) and 4.8 min (48*6s), respectively. Compared to the fixed threshold, the method with an adaptive threshold can obtain 42 s and 108 s of advance, respectively. Additionally, when the operating conditions of the coal mill change frequently, a fixed threshold may easily lead to misjudgment during abnormality detection. Owing to drastic changes and disturbances in actual operation, an adaptive threshold determined by the Chebyshev inequality is more suitable for industrial sites. In summary, the results verify that the proposed method can handle monitoring data with time-series characteristics effectively, and can issue an early warning in advance, which is conducive to predictive maintenance.

FIGURE 10. The early warning results adopting adaptive threshold and fixed threshold (A) early warning result (B) enlarged view from the 1000th to the 1400th sample points.
Compared to the traditional method with a fixed threshold, the adaptive threshold method is more suitable for monitoring conditions in multiple working conditions of thermal power units. The comparison results show that the adaptive threshold method outperformed the fixed threshold method in terms of waning time, which strives for the time to take proper actions for operators and avoid further deterioration of the anomaly.
Utilizing historical data without label information, an unsupervised learning model based on LSTM-SDAE is proposed for condition monitoring and early fault warning. The feasibility of the proposed method is verified by an actual case study of coal mill blockage. The main contributions are summarized as follows: 1) The LSTM-SDAE model for intelligent condition monitoring is proposed, which takes advantage of the excellent multidimensional temporal data processing capability of LSTM and the ability of AE to extract essential features from raw data. The results show that the proposed LSTM-SDAE model has higher model reconstruction accuracy with smaller RMSE, MAE, and MSE than other methods. 2) Due to the high proportion of renewable energy consumption, the operating conditions of thermal power plants change frequently. An adaptive threshold based on Chebyshev’s inequality is proposed for anomaly detection and timely warning. In the typical case of coal mill blockage, the monitoring indicators have a clear rising trend before the actual alarm occurs, and the adaptive threshold method can issue early warnings of 18.3 min and 6.6 min, respectively. Meanwhile, compared with a fixed threshold, it can further achieve the warning times of 42 s and 108 s in advance, respectively. The proposed method has potential applications in other equipment condition monitoring, and the results have certain reference significance in the industrial field. In the future, the research will be used to evaluate the operational status of other equipment to infer the health of the entire unit.
The original contributions presented in the study are included in the article/supplementary material, further inquiries can be directed to the corresponding author.
YL: Methodology, Formal analysis, Investigation, Writing-Original Draft. FH: Conceptualization, Methodology, Writing-Review and Editing. LT: Investigation, Data Curation. JC: Methodology, Formal analysis. HD: Writing-Review and Editing. JL: Investigation.
This work was supported by the National Natural Science Foundation of China (No.52006062), Natural Science Foundation of Inner Mongolia (2022MS06014) and Research Program of Science and Technology at Universities of Inner Mongolia Autonomous Region (NJZY22210).
The authors declare that the research was conducted in the absence of any commercial or financial relationships that could be construed as a potential conflict of interest.
All claims expressed in this article are solely those of the authors and do not necessarily represent those of their affiliated organizations, or those of the publisher, the editors and the reviewers. Any product that may be evaluated in this article, or claim that may be made by its manufacturer, is not guaranteed or endorsed by the publisher.
Agrawal, V., Panigrahi, B. K., and Subbarao, P. (2015). Review of control and fault diagnosis methods applied to coal mills. J. Process Control 32, 138–153. doi:10.1016/j.jprocont.2015.04.006
Chakraborty, D., and Elzarka, H. (2019). Early detection of faults in HVAC systems using an XGBoost model with a dynamic threshold. Energy Build. 185, 326–344. doi:10.1016/j.enbuild.2018.12.032
Chen, J., Li, J., Chen, W., Wang, Y., and Jiang, T. (2020). Anomaly detection for wind turbines based on the reconstruction of condition parameters using stacked denoising autoencoders. Renew. Energy 147, 1469–1480. doi:10.1016/j.renene.2019.09.041
Chen, X., Wang, P., Hao, Y., and Zhao, M. (2018). Evidential KNN based condition monitoring and early warning method with applications in power plant. Neurocomputing 315, 18–32. doi:10.1016/j.neucom.2018.05.018
de la Hermosa González-Carrato, R. R. (2018). Wind farm monitoring using Mahalanobis distance and fuzzy clustering. Renew. Energy 123, 526–540. doi:10.1016/j.renene.2018.02.097
Feng, G., and Han, B. (2013). An adaptive threshold algorithm based on satisfactory filtering principle. Appl. Mech. Mat. 364, 179–182. doi:10.4028/www.scientific.net/amm.364.179
Greff, K., Srivastava, R. K., Koutník, J., and Steunebrink, B. R.LSTM (2015). A search space odyssey. IEEE Throughput Neur. Net. Lear. 28 (10), 1–11.
Guo, S., Wang, J., Wei, J., and Zachariades, P. (2014). A new model-based approach for power plant Tube-ball mill condition monitoring and fault detection. Energy Convers. Manag. 80, 10–19. doi:10.1016/j.enconman.2013.12.046
Hajdarevic, A., Dzananovic, I., Banjanovic-Mehmedovic, L., and Mehmedovic, F. (2015). Anomaly detection in thermal power plant using probabilistic neural network.” in 38th International Convention on Information and Communication Technology Electronics and Microelectronics,, 5. Opatija, 1118.
Hochreiter, S., and Schmidhuber, J. (1997). Long short-term memory. Neural Comput. 9, 1735–1780. doi:10.1162/neco.1997.9.8.1735
Hong, F., Long, D., Chen, J., and Gao, M. (2020). Modeling for the bed temperature 2D-interval prediction of CFB boilers based on long-short term memory network. Energy 194, 116733. doi:10.1016/j.energy.2019.116733
Hong, X., Xu, Z., and Zhang, Z. (2019). Abnormal condition monitoring and diagnosis for coal mills based on support vector regression. IEEE Access 7, 170488–170499. doi:10.1109/access.2019.2955249
Hu, Y., Ping, B., Zeng, D., Niu, Y., Gao, Y., and Zhang, D. (2020). Research on fault diagnosis of coal mill system based on the simulated typical fault samples. Measurement 161, 107864. doi:10.1016/j.measurement.2020.107864
Jiao, S. (2018). Health warning and fault diagnosis of pulverizing system based on syncretic similarity. J. Syst. Simul. 30 (2), 595–604.
Kisi¢, E., Petrovi¢, V., Vujnovi¢, S., Ðurovic, Z., and Ivezi¢, M. (2012). Analysis of the condition of coal grinding mills in thermal power plants based on the T2 multivariate control chart applied on acoustic measurements. Autom.Control Robot. 11 (2), 141.
Lecun, Y., Bengio, Y., and Hinton, G. (2015). Deep learning. Nature 521 (7553), 436–444. doi:10.1038/nature14539
Lei, J., Liu, C., and Jiang, D. (2019). Fault diagnosis of wind turbine based on long short-term memory networks. Renew. Energy 133, 422–432. doi:10.1016/j.renene.2018.10.031
Lei, Y., Li, N., Guo, L., Li, N., Yan, T., and Machinery health prognostics, J. Lin. (2018). Machinery health prognostics: A systematic review from data acquisition to RUL prediction. Mech. Syst. Signal Process. 104, 799–834. doi:10.1016/j.ymssp.2017.11.016
Li, H., Deng, J., Yuan, S., Feng, P., and Arachchige, D. D. K. (2021). Monitoring and identifying wind turbine generator bearing faults using deep belief network and EWMA control charts. Front. Energy Res. 9, 799039. doi:10.3389/fenrg.2021.799039
Li, S., Liu, G., Tang, X., Lu, J., and Hu, J. (2017). An ensemble deep convolutional neural network model with improved D-S evidence fusion for bearing fault diagnosis. Sensors 17 (8), 1729. doi:10.3390/s17081729
Li, Y., Hong, F., Tian, L., Liu, J., and Chen, J. (2020). Early warning of critical blockage in coal mills based on stacked denoising autoencoders. IEEE Access 8, 176101–176111. doi:10.1109/access.2020.3026918
Lin, J., and Chen, Q. (2013). Fault diagnosis of rolling bearings based on multifractal detrended fluctuation analysis and Mahalanobis distance criterion. Mech. Syst. Signal Process. 38 (2), 515–533. doi:10.1016/j.ymssp.2012.12.014
Lu, C., Wang, Z., Qin, W., and Ma, J. (2017). Fault diagnosis of rotary machinery components using a stacked denoising autoencoder-based health state identification. Signal Process. 130, 377–388. doi:10.1016/j.sigpro.2016.07.028
Nikula, R., Ruusunen, M., and Leiviskä, K. (2016). Data-driven framework for boiler performance monitoring. Appl. Energy 183, 1374–1388. doi:10.1016/j.apenergy.2016.09.072
Pang, Y., He, Q., Jiang, G., and Xie, P. (2020). Spatio-temporal fusion neural network for multi-class fault diagnosis of wind turbines based on SCADA data. Renew. Energy 161, 510–524. doi:10.1016/j.renene.2020.06.154
Qin, Y., Adams, S., and Yuen, C. (2021). Transfer learning-based state of charge estimation for lithium-ion battery at varying ambient temperatures. IEEE Trans. Ind. Inf. 17, 7304–7315. doi:10.1109/tii.2021.3051048
Qin, Y., Yuen, C., Shao, Y., Qin, B., and Li, X. (2022). Slow-varying dynamics-assisted temporal capsule network for machinery remaining useful life estimation. IEEE Trans. Cybern., 1–15. doi:10.1109/TCYB.2022.316468
Rostek, K., Morytko, Ł., and Jankowska, A. (2015). Early detection and prediction of leaks in fluidized-bed boilers using artificial neural networks. Energy 89, 914–923. doi:10.1016/j.energy.2015.06.042
Rumelhart, D. E., Hinton, G. E., and Williams, R. J. (1986). Learning representations by back-propagating errors. Nature 323, 533–536. doi:10.1038/323533a0
Sun, W., Shao, S., Zhao, R., Yan, R., Zhang, X., and Chen, X. (2016). A sparse auto-encoder-based deep neural network approach for induction motor faults classification. Measurement 89, 171–178. doi:10.1016/j.measurement.2016.04.007
Tamilselvan, P., and Wang, P. (2013). Failure diagnosis using deep belief learning based health state classification. Reliab. Eng. Syst. Saf. 115, 124–135. doi:10.1016/j.ress.2013.02.022
Vincent, P., Larochelle, H., Lajoie, I., Bengio, Y., and Manzagol, P.-A. (2010). Stacked denoising autoencoders: Learning useful representations in a deep network with a local denoising criterion. J. Mach. Learn. Res. 11, 3371
Wang, L., Zhang, Z., Xu, J., and Liu, R. (2018). Wind turbine blade breakage monitoring with deep autoencoders. IEEE Trans. Smart Grid 9 (4), 2824–2833. doi:10.1109/tsg.2016.2621135
Wang, Z., Ma, H., Chen, H., Yan, B., and Chu, X. (2019). Performance degradation assessment of rolling bearing based on convolutional neural network and deep long-short term memory network. Int. J. Prod. Res. 53 (13), 3931–3943. doi:10.1080/00207543.2019.1636325
Widarsson, B., and Dotzauer, E. (2008). Bayesian network-based early-warning for leakage in recovery boilers. Appl. Therm. Eng. 28 (7), 754–760. doi:10.1016/j.applthermaleng.2007.06.016
Willersrud, A., Blanke, M., Imsland, L., and Pavlov, A. (2015). Fault diagnosis of downhole drilling incidents using adaptive observers and statistical change detection. J. Process Control 30, 90–103. doi:10.1016/j.jprocont.2014.12.010
Wu, L., Yao, B., Peng, Z., and Guan, Y. (2017). An adaptive threshold algorithm for sensor fault based on the grey theory. Adv. Mech. Eng. 9 (2), 168781401769319–7. doi:10.1177/1687814017693193
Yang, C., Liu, J., Zeng, Y., and Xie, G. (2019). Real-time condition monitoring and fault detection of components based on machine-learning reconstruction model. Renew. Energy 133, 433–441. doi:10.1016/j.renene.2018.10.062
Zhao, H., Liu, H., Hu, W., and Yan, X. (2018). Anomaly detection and fault analysis of wind turbine components based on deep learning network. Renew. Energy 127, 825–834. doi:10.1016/j.renene.2018.05.024
Zhao, R., Yan, R., Chen, Z., Mao, K., Wang, P., and Gao, R. X. (2019). Deep learning and its applications to machine health monitoring. Mech. Syst. Signal Process. 115, 213–237. doi:10.1016/j.ymssp.2018.05.050
Keywords: condition monitoring, early fault warning, time-series, LSTM-SDAE, adaptive threshold
Citation: Li Y, Hong F, Tian L, Chen J, Du H and Liu J (2023) Condition monitoring and early fault warning of power plant auxiliary equipment using LSTM-SDAE model with an adaptive threshold. Front. Energy Res. 10:1037539. doi: 10.3389/fenrg.2022.1037539
Received: 06 September 2022; Accepted: 29 September 2022;
Published: 09 January 2023.
Edited by:
Feng Du, China University of Mining and Technology, Beijing, ChinaReviewed by:
Yan Qin, Nanyang Technological University, SingaporeCopyright © 2023 Li, Hong, Tian, Chen, Du and Liu. This is an open-access article distributed under the terms of the Creative Commons Attribution License (CC BY). The use, distribution or reproduction in other forums is permitted, provided the original author(s) and the copyright owner(s) are credited and that the original publication in this journal is cited, in accordance with accepted academic practice. No use, distribution or reproduction is permitted which does not comply with these terms.
*Correspondence: Feng Hong, aG9uZ2ZAbmNlcHUuZWR1LmNu
Disclaimer: All claims expressed in this article are solely those of the authors and do not necessarily represent those of their affiliated organizations, or those of the publisher, the editors and the reviewers. Any product that may be evaluated in this article or claim that may be made by its manufacturer is not guaranteed or endorsed by the publisher.
Research integrity at Frontiers
Learn more about the work of our research integrity team to safeguard the quality of each article we publish.