 Salman Raza Naqvi1*
 Syed Ali Ammar Taqvi2
 Asif Hussain Khoja3
 Imtiaz Ali4
 Muhammad Taqi Mehran1
 Wasif Farooq5
 Nakorn Tippayawong6
 Dagmar Juchelková7
 A.E. Atabani8
- 1School of Chemical and Materials Engineering (SCME), National University of Sciences and Technology, Islamabad, Pakistan
- 2Department of Chemical Engineering, NED University of Engineering and Technology, Karachi, Pakistan
- 3U.S.-Pakistan Centre for Advanced Studies in Energy (USPCAS-E), National University of Sciences and Technology (NUST), Islamabad, Pakistan
- 4Department of Chemical and Materials Engineering, King Abdulaziz University, Rabigh, Saudi Arabia
- 5Department of Chemical Engineering, King Fahd University of Petroleum and Minerals (KFUPM), Dhahran, Saudi Arabia
- 6Faculty of Engineering, Department of Mechanical Engineering, Chiang Mai University, Chiang Mai, Thailand
- 7Department of Electronics, Faculty of Electrical Engineering and Computer Science, VŠB—Technical University of Ostrava, Ostrava, Czechia
- 8Alternative Fuels Research Laboratory (AFRL), Energy Division, Department of Mechanical Engineering, Faculty of Engineering, Erciyes University, Kayseri, Turkey
Oily sludge is a hazardous waste stream of oil refineries that requires an effective process and an environment-friendly route to convert and recover valuable products. In this study, the pyrolytic conversion of the wet waste oil sludge was implemented in an autoclave pyrolyzer and a thermogravimetric analyzer (TGA) at 5°C/min, 20°C/min, and 40°C/min, respectively. The kinetic analysis was performed using model-free methods, such as Friedman, Kissenger–Akahira–Sunose (KAS), and Ozawa–Flynn–Wall (OFW) to examine the complex reaction mechanism. The average activation energy of wet waste oil sludge (WWOS) estimated from Friedman, KAS, and OFW methods was 198.68 ± 66.27 kJ/mol, 194.60 ± 56.99 kJ/mol, and 193.28 ± 54.88 kJ/mol, respectively. The activation energy increased with the conversion, indicating that complex multi-step processes are involved in the thermal degradation of WWOS. An artificial neural network (ANN) was employed to predict the conversion during heating at various heating rates. ANN allows complex non-linear relationships between the response variable and its predictors.
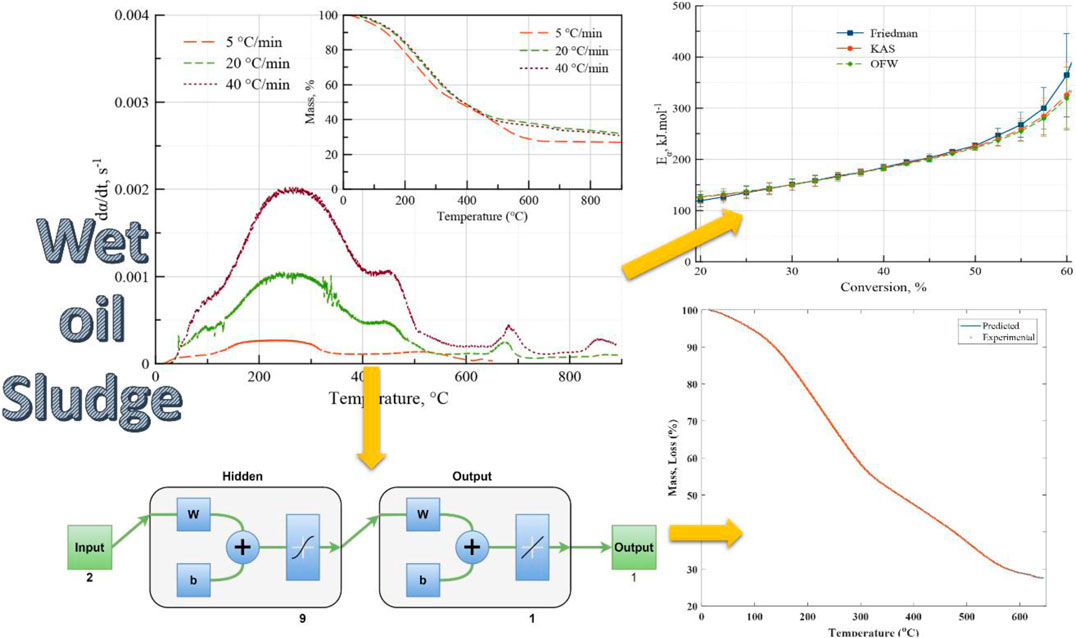
GRAPHICAL ABSTRACT
1 Introduction
Economic and social growth are linked to the demand for energy (Gai et al., 2021; Kumar Mishra and Mohanty, 2021). Carbon is one of the sources mainly obtained from fossil fuel, which serves as the primary source of energy and feedstock for the petrochemical industry (Mishra and Mohanty, 2020a). The exploitation of fossil fuel by refining generates a large quantity of oily sludge (Collin et al., 2020). Waste oil sludge (WOS) is a heterogeneous mixture of solids and oil (Cheng et al., 2017), which is accumulated in oil tanks, in slop oil emulsion tanks, in oil/water phase separators, and open ponds for different treatments in a petroleum refinery (Gao et al., 2020). It is a heterogeneous mixture containing organic and inorganic constituents (Verma et al., 2010), such as waste oil, water, and minerals (Chen et al., 2020). The disposal of WOS is environmentally challenging due to the presence of cyclic hydrocarbons (Heidarzadeh et al., 2009) such as benzene, phenols, and anthracene as well as heavy metals (Lin et al., 2018) and various other toxic materials (Liu et al., 2018). As a common practice, WOS ends up in a landfill or is burnt in the air. WOS is an unstable composition of cyclic hydrocarbons along with heavy metals. Its usage in landfilling could contaminate the underground water and burning causes serious air pollution.
Due to these problems, Resource Conservation and Recovery Act (RCRA) designated WOS as a hazardous compound (Gaur et al., 2020; Ghazizade et al., 2020). There is not a single method to treat the oily sludge. A combination of physical and chemical processes is used to treat it, and some of the treatments involve solvent extraction (Zhao et al., 2020), centrifugal separation (Wang et al., 2018), oil recovery using surfactants (Ramirez and Collins, 2018), oil recovery using ultrasonic field (Luo et al., 2020), freezing and thawing cycles (Hu et al., 2015), microwave (Tan et al., 2007), and ultrasonic irradiation (Xu et al., 2009). Each method has its own merits and demerits, but overall, the treatment or disposal of oily sludge is expensive owing to the costs of reagents and operating processes containing complex schemes and arrangements of the equipment. Oil recovery using surfactants presents another challenge as the effluents from the treatment process are often toxic and thus rendered as an additional source of pollution. Oily sludge disposal and recovery technologies were discussed in the literature. However, its effective utilization strategies toward green energy and a safer environment still require a comprehensive study.
Environment-friendly treatment of hazardous waste has attracted the attention of the scientific community in recent times. Pyrolysis is considered a promising option for waste treatment, owing to the conversion of biomass into various forms of energy (Mishra et al., 2020a). Pyrolysis is a simple and the least environmentally polluting process (Assad Munawar et al., 2021), which has shown its effectiveness in converting complex waste materials into volatiles and biochar (Hameed et al., 2020; Tang et al., 2020). Some of the previous works involving pyrolysis (Chang et al., 2000; Conesa et al., 2014; Mishra et al., 2019; Mishra and Mohanty, 2020b) focused on the quality and yield of the bio-oil (Gong et al., 2018) as a function of the pyrolysis temperature (Yang et al., 2019) and use of different additives (Cheng et al., 2017) and catalysts (Sikander et al., 2019). WOS may vary significantly from refinery to refinery and within a refinery in terms of the type of crude oil used, schemes of refinery operations, and the selection of different substances in different treatment processes such as coagulants (Verma et al., 2010), oxidizers (González et al., 2018), and electro-kinetic systems for oily sludge demulsification (Fellah Jahromi and Elektorowicz, 2018). The number of hydrocarbons may vary significantly (Hu et al., 2013) from 5 to 86% with wastewater (González et al., 2018) and minerals (Naqvi et al., 2018a). The variation in the composition poses a greater challenge to the industrial operations for its treatment.
The research needs to focus on the solid-state reaction mechanism of the complex-natured wet oily sludge. Extensive literature reviews suggested a lack of the WOS thermo-kinetic study with model-free methods. The combination of WOS with thermodynamics and machine learning in a slow pyrolysis process was not available. Therefore, this work aims to elucidate the process behavior by employing iso-conversional methods to estimate the activation energy of wet oil sludge. Pyrolysis experimentations were performed using an autoclave pyrolyzer unit to determine the pyrolysis’ product yield and oil composition. To the best of our knowledge, studies were scarce for identifying the multiple or single-step reaction scheme of hazardous oily complex compounds. This study also provides insight into the oily sludge conversion process and a multi-step complex reaction scheme. The pre-exponential coefficient was calculated from ASTM E1641-16 international standards. The thermodynamic properties (ΔH, ΔG, and ΔS) were obtained from the kinetic parameters (Ea, n, A). As aforementioned, there is no Artificial Neural Network (ANN) study on the hazardous oily complex compound found in the literature. This study provides the successful implementation of ANN models on mass loss data to study the slow pyrolysis process of WOS.
2 Materials and Methods
The wet waste oil sludge (WWOS) from the filter press at the bottom of the oil separating tank in a Pakistani oil refinery was collected. The received samples were tested for proximate and ultimate compositions. The ASTM international standard methods were followed to estimate the volatile matters, fixed carbon, and ash contents (Naqvi et al., 2019b). Elemental analysis was carried out using a PerkinElmer’s CHNS element analyzer (2400II, United States), whereas a higher heating value (HHV) was obtained from a bomb calorimeter (proximate analysis). The thermal behavior was envisaged in a thermogravimetric analyzer (TGA) (SDT Q600). An inert atmosphere was created inside the TGA by purging a continuous flow of 60 ml/min of N2 gas while heating from 25°C to 1,000°C at different constant heating rates of 5°C, 20°C, and 40°C/min.
2.1 Thermogravimetric Analysis
The TGA is an essential device for a precise measurement of the mass loss of a substance with changing numerous temperature values. The kinetic analysis was performed by the relative mass loss data at altering temperature values with respect to time.
2.1.1 Kinetic Analysis
The rate equation (Eq. 1),
where
where
where
Integration is proceeded after the rearrangement of the variables to deliver a reaction model in the integral form,
The right-hand side of the equation is not straightforward to work with. Several methods such as Friedman (Friedman, 1964), Kissinger–Akahira–Sunose (KAS) (Kissinger, 1957), and Ozawa–Flynn–Wall (OFW) (Takeo, 1965) use certain approximations (Flynn and Wall, 1966). Friedman, Kissinger–Akahira–Sunose (KAS), and Flynn–Wall–Ozawa (FWO) are model-free methods to evaluate the trend of activation energy during conversion (Mishra et al., 2019; Mishra et al., 2020b). Model-free methods are often employed as they don’t require a pre-assumption of the reaction mechanism. Friedman (Eq. 5) is a differential and linearized form of the rate equation whereas integral methods such as KAS (Eq. 6) and FWO (Eq. 7) are approximate solutions of a rate equation (Eq. 4). The Friedman method, in its true sense, is a better representative than the rest; however, the derivative in Friedman’s linear equation makes it sensitive to data noise which is the reason why other non-sensitive integral methods are necessary to subside the variations caused by the data noise.
where
The apparent activation energy,
2.1.2 Thermodynamic Analysis
The changes in the enthalpy (∆H) (Naqvi et al., 2019b; Naqvi et al., 2019a), Gibbs free energy (∆G) (Tahir et al., 2019), and entropy (∆S) (Tahir et al., 2020) can be determined from the activation energy
where
2.2 Autoclave Pyrolyzer Unit
The pyrolysis tests of WWOS samples were carried out in a single-mode autoclave pyrolyzer unit at different temperatures (350°C, 450°C, and 550°C) by keeping all other conditions (pressure and amount of sample) constant for each run. The autoclave pyrolyzer unit consisted of a 360 ml vessel made up of stainless steel (SS) material with 1 dm3 capacity. An amount of 150 g of wet, oily sludge sample was kept in the vessel (20.32 cm length × 10.16 cm I.D), which was airtight. The experimental setup in terms of a schematic diagram is shown in Figure 1.

FIGURE 1. Autoclave pyrolysis unit.
The system was heated at 10°C/min to the required temperature and sustained for 0.5 h to provide sufficient time for thermal degradation. Then, the release of pyrolysis products from the autoclave pyrolyzer unit was manually stopped. The vapor produced in the vessel evolved from the top of the vessel and was directed into the condenser, where the liquid products were condensed and collected. The non-condensable gases were usually expelled either into the atmosphere or collected in gas-sampling bags for analysis and characterization. The pyrolyzed solid product was collected from the bottom of the autoclave vessel after completing each experimental run. The yield of solid char and pyrolysis liquid was determined in each experiment by weighing products and the sample used in each experimental run whereas the yield of gases by the difference. The yield of the product is obtained by using Eq. 11.
2.3 Predictive Model Development Using Feed Forward Neural Network
A multilayer perceptron (MLP) based feed-forward back propagation neural network (FFBPN) was employed in this study to simulate the mass loss of WWOS obtained from the pyrolysis experiments conducted in TGA by maintaining an inert atmosphere. The variation in mass and conversion rates at different temperatures and under different heating rates has been modeled using an ANN. The ANN has been developed for a long time (Klemeš and Ponton, 1992) with many variations (Ponton and Klemeš, 1993; Shahbaz et al., 2020; Rashid et al., 2021). The FFBPN model has been widely used in the literature owing to its good pattern classifier and overall efficiency capability (Hafeez et al., 2020; Arshad et al., 2021). The proposed feed-forward network is a supervised learning technique comprised of three-layered architecture for data prediction, that is, the input, the hidden, and the output layers [(Naqvi et al., 2019a; Naqvi et al., 2018b) Naqvi, 2019 #65]. Each layer is connected through weights and biases. The nonlinear function can be adjusted using the weights and biases in the hidden layer.
For the development of the feed-forward neural network (FFNN), the input layer was fed with heating rate and temperature. The output layer was fed with weight loss (%). The data has been normalized in the range of [0–1] to improve network performance. 70% of the data was used to train the network, while 30% of the remaining data was divided equally in the validation and testing of the network. The number of neurons in the hidden layer has been adjusted iteratively to achieve the minimum mean square error (MSE) and maximum R2 values (Naqvi et al., 2020). For the training of the network, Levenberg–Marquardt (LM) function has been used. Back propagation (BP) is widely used in neural network modeling. It is generally known as a supervised learning technique, which is used for nonlinear mapping. Therefore, it has been used in this study. Table 1 shows the various parameters used for the training of the feed-forward BP network to predict the mass loss (%) of wet oily sludge.

TABLE 1. Key parameters for the development of the feed-forward neural network (FFNN) model.
The mass loss (%) of WWOS at various heating rates was simulated using 10 different models for the heating rate of 5°C/min by changing the number of neurons in the hidden layers. This study has also been conducted with two other heating rates (20 and 40°C/min). Table 2 shows the network performance results based on MSE and R2 for the mass loss (%) prediction at the heating rate of 5 °C/min for different topologies. It can be witnessed that the values of MSE and R2 for training, validation, and testing be varied by changing the number of neurons in the hidden layer from 1 to 10. The minimum value of MSE and the maximum value R2 were found to be [6.22 e−05 5.34 e−05 1.20 e−04] and [9.99 e−01 9.99 e−01 9.99 e−01] for training, validation, and testing, at 9 neurons in the hidden layer and 9 neurons was selected for the hidden layer in the network. The selected network architecture was found to be [2 × 9 × 1].
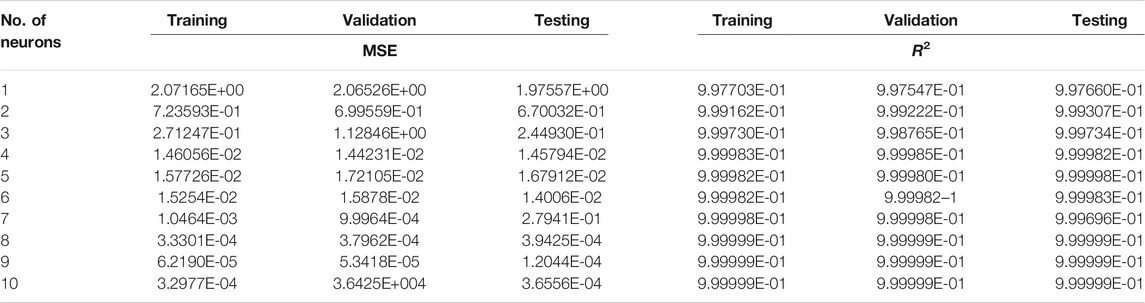
TABLE 2. Neural network performance by varying the number of neurons in the hidden layer.
3 Results and Discussion
3.1 Material Characterization
The freshly received WWOS had 34.27% of moisture content. The sludge’s oil content was 24%, with a volatile matter of 40.73% and HHV of 15.65 MJ/kg. The amounts of carbon, hydrogen, and oxygen were 35.78, 3.10, and 59.58%. The oily sludge’s physicochemical composition makes it suitable for thermochemical conversion with 14.5% of ash, reducing the requirement of the catalyst during the conversion process.
3.2 Thermal Behavior
The thermograms (TG and DTG curves) of WWOS under an inert atmosphere are illustrated in Supplementary Figure S1. It shows the variation in mass and conversion rates at different temperatures and under different heating rates. The mass loss started at a reasonably low temperature owing to the vaporization and evaporation of low boiling volatiles and water. A slight shift in the peaks toward high temperatures can be identified with a significant increase in the degradation rate of WWOS at a higher heating rate. The shift of the peak toward higher temperature indicates the delay in the escaping of the gases from the material structure. The thermal characteristics of WWOS at different heating rates were obtained from (DTG) the curves in Supplementary Figures S2(A–C) at 5, 10, and 20°C/min. The obtained values are reported in Supplementary Table S1 and plotted in Supplementary Figure S2D. It is evident that
3.3 Iso-conversional Methods
The Friedman, KAS, and OFW methods rely on linear curve fittings for a specific conversion (iso-conversion) at various heating rates.
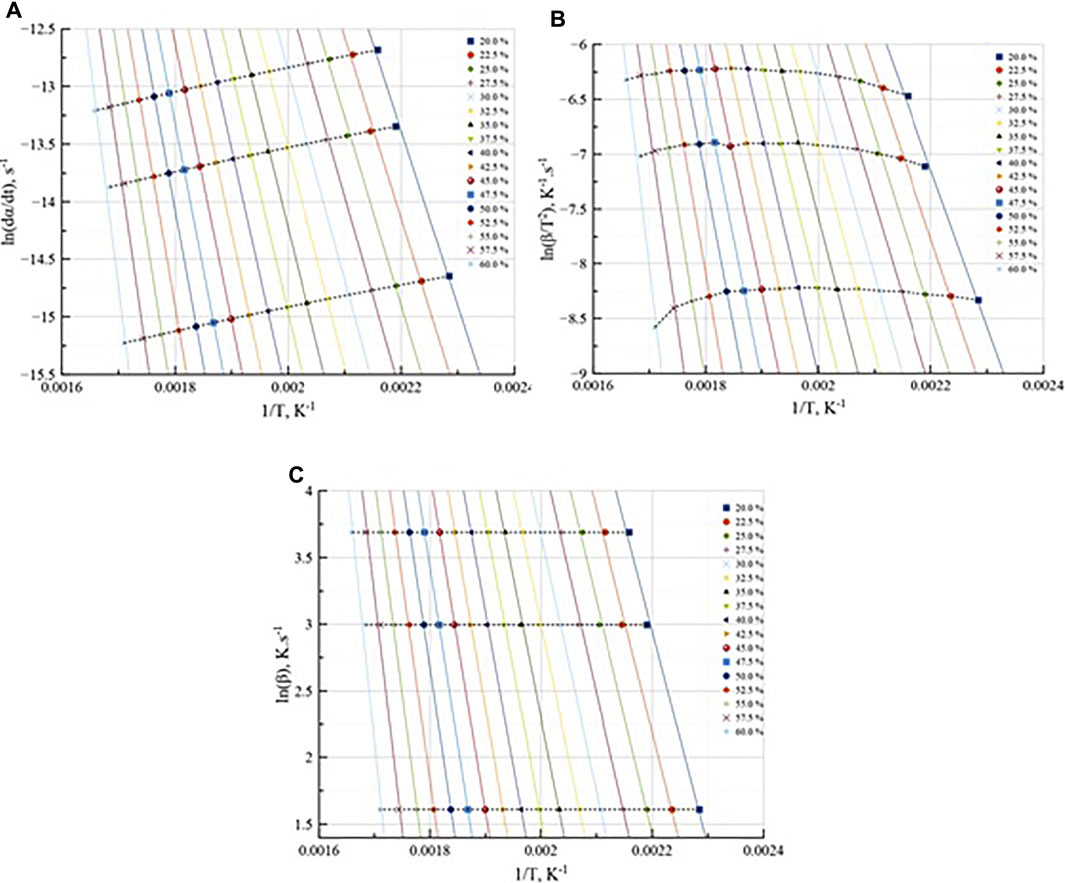
FIGURE 2. Iso-conversional plots of (A) Friedman; (B) KAS, and (C) OFW at various conversions and three heating rates of wet waste oil sludge.
Table 3 summarizes the evolution of
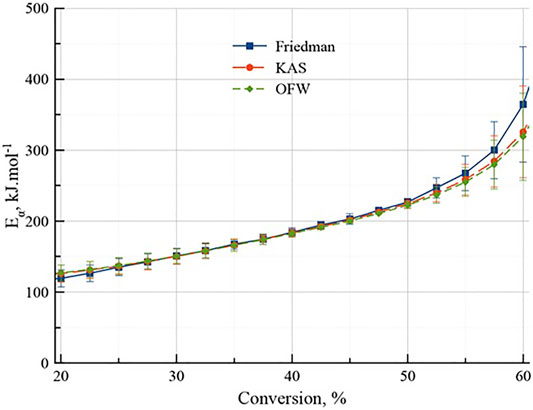
FIGURE 3. Variation of the activation energy of wet waste oil sludge (WWOS) with conversion estimated from different methods.
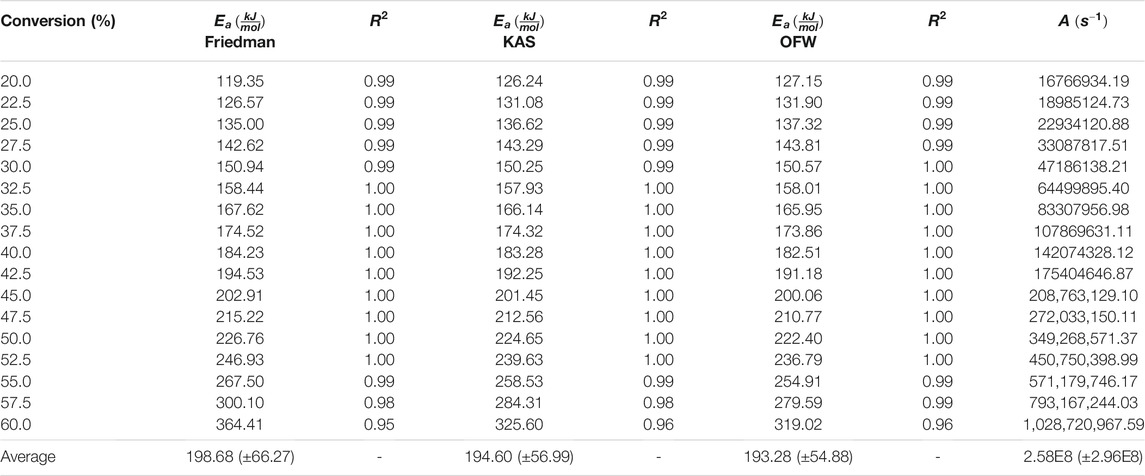
TABLE 3. Activation energies obtained from the Friedman, KAS, and OFW methods and pre-exponential coefficients estimated from the ASTM E1641-16 method considering the first-order reaction mechanism at 20°C/min of wet waste oil sludge.
A summary of the kinetic studies performed on the oily sludge is given in Supplementary Table S2. The average activation energy of WWOS in this study was higher than the earlier reported values in the literature. Ma et al. (2019) reported a similar trend in the activation energy. The authors attributed the increase in the activation energy at a greater extent of conversion to the complex thermal conversion and variability in the composition, which is normally associated with WWOS obtained from oil refineries.
3.4 Thermodynamic Analysis
The constants
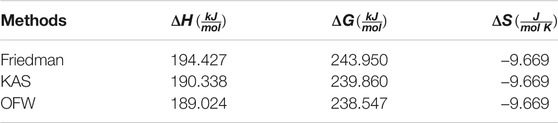
TABLE 4. Thermodynamic parameters of wet oil sludge using the activation energy obtained from the Friedman, KAS, and OFW methods and A calculated from the ASTM E1641-16 method considering the first-order reaction mechanism at 20°C/min.
3.5 Yield and Oil Composition
The yield of liquid, solid, and gaseous products obtained from the pyrolysis of WWOS at various isothermal temperatures of 350°C, 450°C, and 550°C are depicted in Figure 4. The calculated values shown in the table are the mean values and the standard deviations of at least three pyrolyses operated at the specific temperature. It was found that as the pyrolysis temperature increased, the yield of pyrolysis liquid increased (30.67–39.00 wt%), the gas yield increased (16.98 wt%–19.84 wt%), and the solid yield decreased (52.35–41.16 wt%). The higher yield of pyrolysis liquid and gas occurred owing to secondary cracking at higher temperatures. The solid yield decreased at elevated temperatures, which was also confirmed by the thermogravimetric analysis (Tang et al., 2019). Similar observations were observed in the literature (Gong et al., 2020). Lin et al. (2018) investigated the oily sludge in the U-shaped reactor for saturation-enriched light oil production. It was observed that temperature played a significant role in maximum liquid production. Song et al. (2019) reported different properties of the products obtained from the pyrolysis of oily sludge carried out in a pyrolysis-magnetic separation reactor. The pyrolysis liquid was composed of water and tar. Pyrolysis product yields were observed at different temperatures. It was also reported that the pyrolysis temperature increased the yield of water, tar, and gas, while a corresponding decrease in the yield of solids was also reported. These studies conclude that 550°C was the optimum temperature to obtain the maximum liquid yield using pyrolysis.
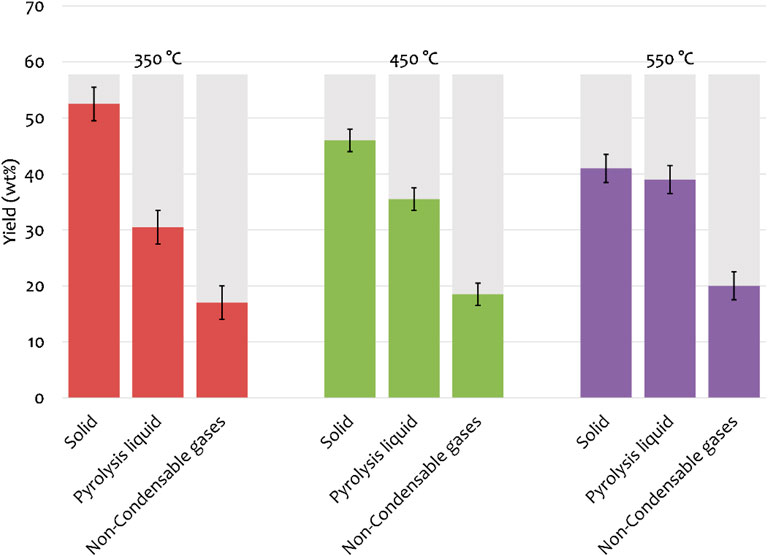
FIGURE 4. Yield of pyrolysis products.
GC–MS obtained the composition of oils produced from pyrolysis of wet oily sludge at different temperatures: 350°C, 450°C, and 550°C. The elements acknowledged in the fractions analyzed have been classified into six aliphatic groups, methyl aliphatic, aromatic and polycyclic aromatic compounds, nitriles and amides, alcohols, and oxygen-containing compounds such as carboxylic acids, esters, and ketones. Supplementary Table S3 shows the distribution according to the percentage area of various compounds. These main compounds consisted of hydrocarbons, such as alkanes, aromatics, oxygenates, and others. The aliphatic compounds included alkanes, alkenes, alkynes, their derivates, and compounds with a carbon number from C5 to C20 like trichloromethane, pentadecane, cetane, hexadecane, nonene, and nonadecane. The aromatic and polycyclic aromatic compounds included phenol, toluene, styrene, pyrrole, benzene, acetonitrile, pyridine, methylpyridine, phenols, benzene propane nitrile, indole, and p-cresol. The alcohol group contained compounds having an OH group attached, for example, 2-Furanmethanol and 1-Dodecanol. The carboxylic acids (O=C-OH), esters (O-C=O), nitriles (C≡N), and amides (O=C-NH2) were heavy compounds linked with long aliphatic chains with carbon atoms up to 20. As the temperature increased from 350°C to elevated temperatures such as 450°C and 550°C, the area percentage of alkanes was the most abundant in the following order: 75.48% > 76.41% > 76.92%. The higher temperature facilitated the formation of aromatics, polycyclic aromatics, alcoholic compounds, and heavy compounds.
3.6 Neural Network Modeling
In this study, the predictive modeling based on the neural network has been successfully proposed for the TGA of WWOS at different heating rates of 5°C/min, 20°C/min, and 40°C/min. The model results for TGA at a heating rate of 5°C/min, such as training performance, error histogram, and regression plots, have been discussed in this section. However, the results obtained from the predictive modeling of TGA at a heating rate of 5°C/min, 20°C/min, and 40°C/min are shown in Figures 5A–C; Supplementary Figures S3A–C; Supplementary Figures S4A–C). As mentioned earlier, the best neural network architecture was found to be [2 × 9 × 1] with a minimum training MSE of 6.219e−5 and a maximum R2 value of 99.99.
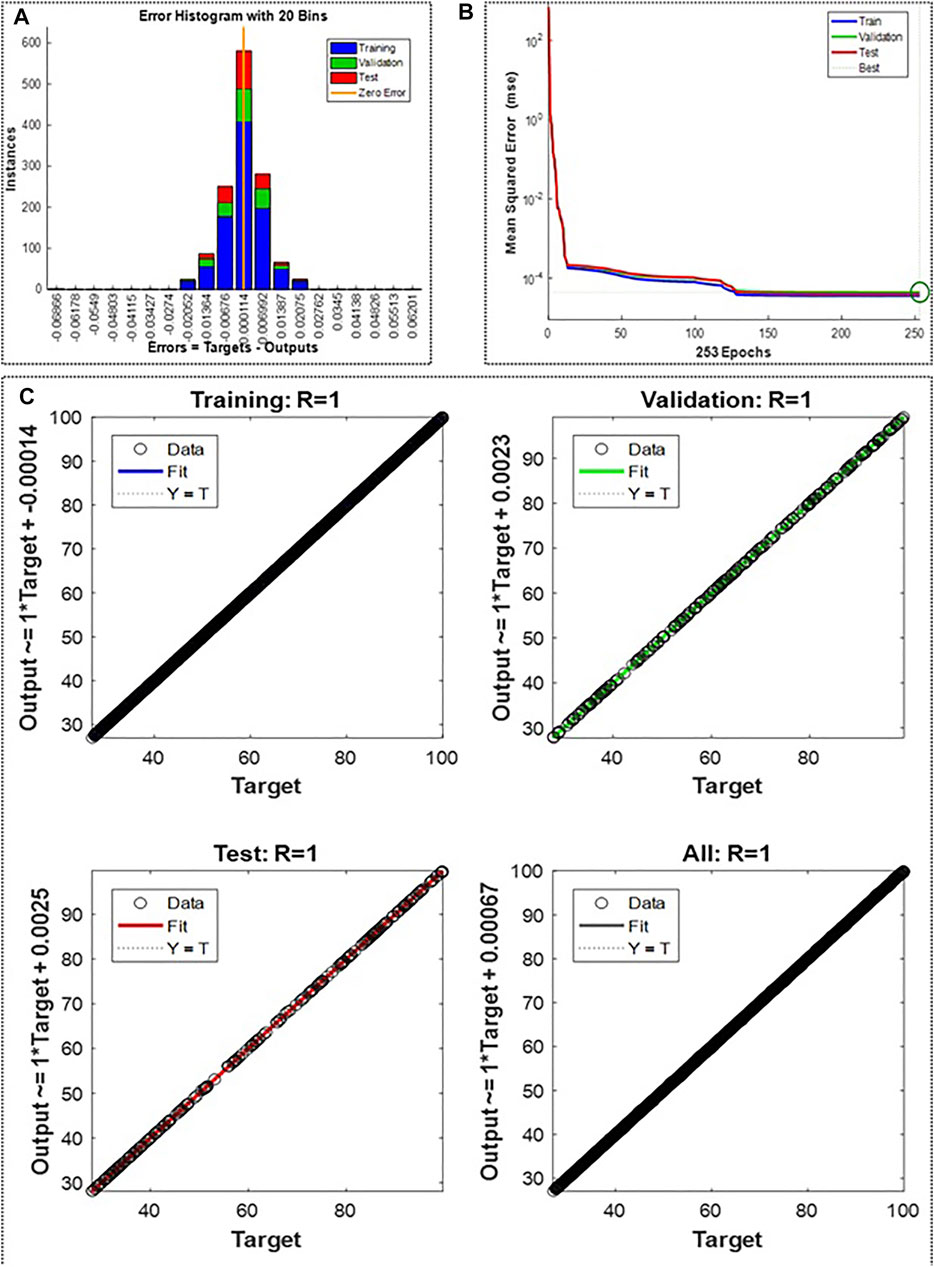
FIGURE 5. Error Histogram (A), training performance (B), and regression plots (C) of TGA for wet oily sludge at 5°C/min.
The model performance, training, and regression plots are shown in Figure 5. The error histogram is shown in Figure 5A, representing the normal distribution of errors across zero. Figure 5A shows that the error between the experimental and simulated mass% lies in the range of [−0.06 to +0.06]. Since the errors between actual and predicted values are low, it depicts that the model is well trained and can be further utilized. For the prediction of new output data, Figure 5B shows the performance plot using MSE for mean square error for training, validation, and testing of a network with 9 hidden neurons in the hidden layer. It can be observed that the minimum error has been achieved at 253 epochs. Figure 5C shows the training, validation, and testing regression plots. It can be observed that very few errors have been obtained between the target and output values, which demonstrates a strong correlation. The results show that the value of R2 in all the training, validation, and testing plots is close to 1. A good fit between the experimental and predicted data was achieved, as shown in Figure 6. The results explained that the proposed network is in good agreement with the experimental results and could be extensively applied to predict TGA for various waste sludge with nonlinear nature (Bong et al., 2020; Prabhakaran et al., 2020).
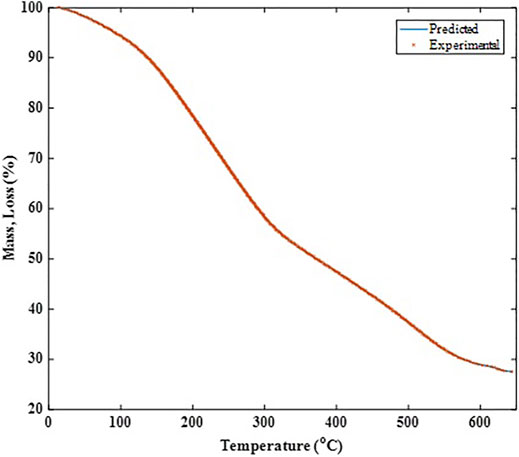
FIGURE 6. Predicted values in agreement with experimental results.
4 Conclusion
Pyrolysis characteristics of industrial wet oil sludge in an inert atmosphere of nitrogen were investigated using a thermogravimetric analyzer at 5°C/min, 20°C/min, and 40 °C/min. Activation energies at different conversion levels were estimated from Friedman, KAS, and OFW methods. According to Friedman, KAS, and OFW methods, the average activation energy was 198.68 kJ/mol, 194.60 kJ/mol, and 193.28 kJ/mol. The increase in the activation energy on conversion showed that the conversion process might have followed a multi-step complex reaction scheme. Positive
Data Availability Statement
The original contributions presented in the study are included in the article/Supplementary Material; further inquiries can be directed to the corresponding author.
Author Contributions
SN, ST, AK, IA, and MM proposed the main idea and methodology and performed the experiments. WF and NT contributed toward validation and modeling. DJ and AA provided suggestions to improve the manuscript.
Conflict of Interest
The authors declare that the research was conducted in the absence of any commercial or financial relationships that could be construed as a potential conflict of interest.
Publisher’s Note
All claims expressed in this article are solely those of the authors and do not necessarily represent those of their affiliated organizations, or those of the publisher, the editors, and the reviewers. Any product that may be evaluated in this article, or claim that may be made by its manufacturer, is not guaranteed or endorsed by the publisher.
Acknowledgments
The authors would like to acknowledge the National University of Sciences and Technology for their technical support.
Supplementary Material
The Supplementary Material for this article can be found online at: https://www.frontiersin.org/articles/10.3389/fenrg.2021.782139/full#supplementary-material
References
Arshad, U., Taqvi, S. A. A., and Buang, A. (2021). Modelling of the Minimum Ignition Temperature (MIT) of Corn Dust Using Statistical Analysis and Artificial Neural Networks Based on the Synergistic Effect of Concentration and Dispersion Pressure. Process Saf. Environ. Prot. 147, 742–755. doi:10.1016/j.psep.2020.12.040
Assad Munawar, M., Khoja, H. A., Hassan, M., Liaquat, R., Naqvi, S. R., Mehran, M. T., et al. (2021). Biomass Ash Characterization, Fusion Analysis and its Application in Catalytic Decomposition of Methane. Fuel 285, 119107. doi:10.1016/j.fuel.2020.119107
Bong, J. T., Loy, A. C. M., Chin, B. L. F., Lam, M. K., Tang, D. K. H., Lim, H. Y., et al. (2020). Artificial Neural Network Approach for Co-pyrolysis of Chlorella Vulgaris and Peanut Shell Bsinary Mixtures Using Microalgae Ash Catalyst. Energy 207, 118289. doi:10.1016/j.energy.2020.118289
Chang, C.-Y., Shie, J.-L., Lin, J.-P., Wu, C.-H., Lee, D.-J., and Chang, C.-F. (2000). Major Products Obtained from the Pyrolysis of Oil Sludge. Energy Fuels 14 (6), 1176–1183. doi:10.1021/ef0000532
Chen, Z., Zheng, Z., Li, D., Chen, H., and Xu, Y. (2020). Continuous Supercritical Water Oxidation Treatment of Oil-Based Drill Cuttings Using Municipal Sewage Sludge as Diluent. J. Hazard. Mater. 384, 121225. doi:10.1016/j.jhazmat.2019.121225
Cheng, S., Wang, Y., Fumitake, T., Kouji, T., Li, A., and Kunio, Y. (2017). Effect of Steam and Oil Sludge Ash Additive on the Products of Oil Sludge Pyrolysis. Appl. Energ. 185, 146–157. doi:10.1016/j.apenergy.2016.10.055
Collin, T., Cunningham, R., Jefferson, B., and Villa, R. (2020). Characterisation and Energy Assessment of Fats, Oils and Greases (FOG) Waste at Catchment Level. Waste Manage. 103, 399–406. doi:10.1016/j.wasman.2019.12.040
Conesa, J. A., Moltó, J., Ariza, J., Ariza, M., and García-Barneto, A. (2014). Study of the thermal Decomposition of Petrochemical Sludge in a Pilot Plant Reactor. J. Anal. Appl. Pyrolysis 107, 101–106. doi:10.1016/j.jaap.2014.02.009
Fellah Jahromi, A., and Elektorowicz, M. (2018). Electrokinetically Assisted Oil-Water Phase Separation in Oily Sludge with Implementing Novel Controller System. J. Hazard. Mater. 358, 434–440. doi:10.1016/j.jhazmat.2018.07.032
Flynn, J. H., and Wall, L. A. (1966). A Quick, Direct Method for the Determination of Activation Energy from Thermogravimetric Data. J. Polym. Sci. B Polym. Lett. 4 (5), 323–328. doi:10.1002/pol.1966.110040504
Friedman, H. L. (1964). Kinetics of thermal Degradation of Char-Forming Plastics from Thermogravimetry. Application to a Phenolic Plastic. J. Polym. Sci. C: Polym. Symposia 6 (1), 183–195. doi:10.1002/polc.5070060121
Gai, L., Varbanov, P. S., Fan, Y. V., Klemeš, J. J., and Romanenko, S. V. (2021). Trade-offs between the Recovery, Exergy Demand and Economy in the Recycling of Multiple Resources. Resour. Conservation Recycling 167, 105428. doi:10.1016/j.resconrec.2021.105428
Gao, N., Jia, X., Gao, G., Ma, Z., Quan, C., and Naqvi, S. R. (2020). Modeling and Simulation of Coupled Pyrolysis and Gasification of Oily Sludge in a Rotary kiln. Fuel 279, 118152. doi:10.1016/j.fuel.2020.118152
Gaur, V. K., Sharma, P., Sirohi, R., Awasthi, M. K., Dussap, C.-G., and Pandey, A. (2020). Assessing the Impact of Industrial Waste on Environment and Mitigation Strategies: A Comprehensive Review. J. Hazard. Mater. 398, 123019. doi:10.1016/j.jhazmat.2020.123019
Ghazizade, M. J., Koulivand, H., Safari, E., and Heidari, L. (2020). Petrochemical Waste Characterization and Management at Pars Special Economic Energy Zone in the South of Iran. Waste Manag. Res. 39 (2), 199–208. doi:10.1177/0734242x20922585
Gong, Z., Liu, C., Wang, M., Wang, Z., and Li, X. (2020). Experimental Study on Catalytic Pyrolysis of Oil Sludge under Mild Temperature. Sci. Total Environ. 708, 135039. doi:10.1016/j.scitotenv.2019.135039
Gong, Z., Wang, Z., Wang, Z., Fang, P., and Meng, F. (2018). Study on Pyrolysis Characteristics of Tank Oil Sludge and Pyrolysis Char Combustion. Chem. Eng. Res. Des. 135, 30–36. doi:10.1016/j.cherd.2018.05.027
González, M. A., Lora, E. E. S. L., Palacio, J. C. E., and del Olmo, O. A. A. (2018). Hydrogen Production from Oil Sludge Gasification/biomass Mixtures and Potential Use in Hydrotreatment Processes. Int. J. Hydrogen Energ. 43 (16), 7808–7822. doi:10.1016/j.ijhydene.2018.03.025
Hafeez, A., Taqvi, S. A. A., Fazal, T., Javed, F., Khan, Z., Amjad, U. S., et al. (2020). Optimization on Cleaner Intensification of Ozone Production Using Artificial Neural Network and Response Surface Methodology: Parametric and Comparative Study. J. Clean. Prod. 252, 119833. doi:10.1016/j.jclepro.2019.119833
Hameed, Z., Naqvi, S. R., Naqvi, M., Ali, M., Taqvi, S. A. A., Gao, N., et al. (2020). A Comprehensive Review on Thermal Coconversion of Biomass, Sludge, Coal, and Their Blends Using Thermogravimetric Analysis. J. Chem. 2020, 5024369. doi:10.1155/2020/5024369
Heidarzadeh, N., Gitipour, S., and Abdoli, M. A. (2009). Characterization of Oily Sludge from a Tehran Oil Refinery. Waste Manag. Res. 28 (10), 921–927. doi:10.1177/0734242x09345794
Hu, G., Li, J., and Hou, H. (2015). A Combination of Solvent Extraction and Freeze Thaw for Oil Recovery from Petroleum Refinery Wastewater Treatment Pond Sludge. J. Hazard. Mater. 283, 832–840. doi:10.1016/j.jhazmat.2014.10.028
Hu, G., Li, J., and Zeng, G. (2013). Recent Development in the Treatment of Oily Sludge from Petroleum Industry: A Review. J. Hazard. Mater. 261, 470–490. doi:10.1016/j.jhazmat.2013.07.069
Kissinger, H. E. (1957). Reaction Kinetics in Differential Thermal Analysis. Anal. Chem. 29 (11), 1702–1706. doi:10.1021/ac60131a045
Klemeš, J. J., and Ponton, J. W. (1992). An Analysis of the Efficiency of Neural Nets Application for Simulation of Distillation Processes. Theor. Foundations Chem. Eng. 26 (3), 412–424.
Kumar Mishra, R., and Mohanty, K. (2021). Kinetic Analysis and Pyrolysis Behavior of Low-Value Waste Lignocellulosic Biomass for its Bioenergy Potential Using Thermogravimetric Analyzer. Mater. Sci. Energ. Tech. 4, 136–147. doi:10.1016/j.mset.2021.03.003
Lin, B., Huang, Q., and Chi, Y. (2018). Co-pyrolysis of Oily Sludge and rice Husk for Improving Pyrolysis Oil Quality. Fuel Process. Techn. 177, 275–282. doi:10.1016/j.fuproc.2018.05.002
Liu, Y., Ran, C., Siddiqui, A. R., Mao, X., Kang, Q., Fu, J., et al. (2018). Pyrolysis of Textile Dyeing Sludge in Fluidized Bed and Microwave-Assisted Auger Reactor: Comparison and Characterization of Pyrolysis Products. J. Hazard. Mater. 359, 454–464. doi:10.1016/j.jhazmat.2018.07.055
Luo, X., Gong, H., He, Z., Zhang, P., and He, L. (2020). Research on Mechanism and Characteristics of Oil Recovery from Oily Sludge in Ultrasonic fields. J. Hazard. Mater. 399, 123137. doi:10.1016/j.jhazmat.2020.123137
Ma, Z., Xie, J., Gao, N., and Quan, C. (2019). Pyrolysis Behaviors of Oilfield Sludge Based on Py-GC/MS and DAEM Kinetics Analysis. J. Energ. Inst. 92 (4), 1053–1063. doi:10.1016/j.joei.2018.07.001
Mishra, R. K., Kumar, V., and Mohanty, K. (2020). Pyrolysis Kinetics Behaviour and thermal Pyrolysis of Samanea Saman Seeds towards the Production of Renewable Fuel. J. Energ. Inst. 93 (3), 1148–1162. doi:10.1016/j.joei.2019.10.008
Mishra, R. K., and Mohanty, K. (2020). Kinetic Analysis and Pyrolysis Behaviour of Waste Biomass towards its Bioenergy Potential. Bioresour. Technol. 311, 123480. doi:10.1016/j.biortech.2020.123480
Mishra, R. K., and Mohanty, K. (2020). Pyrolysis Characteristics, Fuel Properties, and Compositional Study of Madhuca Longifolia Seeds over Metal Oxide Catalysts. Biomass Conv. Bioref. 10 (3), 621–637. doi:10.1007/s13399-019-00469-3
Mishra, R. K., Mohanty, K., and Wang, X. (2020). Pyrolysis Kinetic Behavior and Py-GC-MS Analysis of Waste Dahlia Flowers into Renewable Fuel and Value-Added Chemicals. Fuel 260, 116338. doi:10.1016/j.fuel.2019.116338
Mishra, R. K., Sahoo, A., and Mohanty, K. (2019). Pyrolysis Kinetics and Synergistic Effect in Co-pyrolysis of Samanea Saman Seeds and Polyethylene Terephthalate Using Thermogravimetric Analyser. Bioresour. Technol. 289, 121608. doi:10.1016/j.biortech.2019.121608
Naqvi, S. R., Ali, I., Nasir, S., Ali Ammar Taqvi, S., Atabani, A. E., and Chen, W.-H. (2020). Assessment of Agro-Industrial Residues for Bioenergy Potential by Investigating Thermo-Kinetic Behavior in a Slow Pyrolysis Process. Fuel 278, 118259. doi:10.1016/j.fuel.2020.118259
Naqvi, S. R., Bibi, A., Naqvi, M., Noor, T., Nizami, A.-S., Rehan, M., et al. (2018). New Trends in Improving Gasoline Quality and Octane through Naphtha Isomerization: a Short Review. Appl. Petrochem Res. 8 (3), 131–139. doi:10.1007/s13203-018-0204-y
Naqvi, S. R., Hameed, Z., Tariq, R., Taqvi, S. A., Ali, I., Niazi, M. B. K., et al. (2019a). Synergistic Effect on Co-pyrolysis of rice Husk and Sewage Sludge by thermal Behavior, Kinetics, Thermodynamic Parameters and Artificial Neural Network. Waste Manage. 85, 131–140. doi:10.1016/j.wasman.2018.12.031
Naqvi, S. R., Tariq, R., Hameed, Z., Ali, I., Naqvi, M., Chen, W.-H., et al. (2019b). Pyrolysis of High Ash Sewage Sludge: Kinetics and Thermodynamic Analysis Using Coats-Redfern Method. Renew. Energ. 131, 854–860. doi:10.1016/j.renene.2018.07.094
Naqvi, S. R., Tariq, R., Hameed, Z., Ali, I., Taqvi, S. A., Naqvi, M., et al. (2018). Pyrolysis of High-Ash Sewage Sludge: Thermo-Kinetic Study Using TGA and Artificial Neural Networks. Fuel 233, 529–538. doi:10.1016/j.fuel.2018.06.089
Naqvi, S. R., Tariq, R., Hameed, Z., Ali, I., Taqvi, S. A., Naqvi, M., et al. (2018). Pyrolysis of High-Ash Sewage Sludge: Thermo-Kinetic Study Using TGA and Artificial Neural Networks. Fuel 233, 529–538. doi:10.1016/j.fuel.2018.06.089
Ponton, J. W., and Klemeš, J. (1993). Alternatives to Neural Networks for Inferential Measurement. Comput. Chem. Eng. 17 (10), 991–1000. doi:10.1016/0098-1354(93)80080-7
Prabhakaran, S. S. P., Swaminathan, G., and Joshi, V. V. (2020). Energy Conservation – A Novel Approach of Co-combustion of Paint Sludge and Australian lignite by Principal Component Analysis, Response Surface Methodology and Artificial Neural Network Modeling. Environ. Techn. Innovation 20, 101061. doi:10.1016/j.eti.2020.101061
Ramirez, D., and Collins, C. D. (2018). Maximisation of Oil Recovery from an Oil-Water Separator Sludge: Influence of Type, Concentration, and Application Ratio of Surfactants. Waste Manage. 82, 100–110. doi:10.1016/j.wasman.2018.10.016
Rashid, T., Taqvi, S. A. A., Sher, F., Rubab, S., Thanabalan, M., Bilal, M., et al. (2021). Enhanced Lignin Extraction and Optimisation from Oil palm Biomass Using Neural Network Modelling. Fuel 293, 120485. doi:10.1016/j.fuel.2021.120485
Serio, M. A., Hamblen, D. G., Markham, J. R., and Solomon, P. R. (1987). Kinetics of Volatile Product Evolution in Coal Pyrolysis: experiment and Theory. Energy Fuels 1 (2), 138–152. doi:10.1021/ef00002a002
Shahbaz, M., Taqvi, S. A. A., Inayat, M., Inayat, A., Sulaiman, S. A., McKay, G., et al. (2020). Air Catalytic Biomass (PKS) Gasification in a Fixed-Bed Downdraft Gasifier Using Waste Bottom Ash as Catalyst with NARX Neural Network Modelling. Comput. Chem. Eng. 142, 107048. doi:10.1016/j.compchemeng.2020.107048
Siddiqui, M. N. (2010). Catalytic Pyrolysis of Arab Heavy Residue and Effects on the Chemistry of Asphaltene. J. Anal. Appl. Pyrolysis 89 (2), 278–285. doi:10.1016/j.jaap.2010.09.006
Sikander, U., Samsudin, M. F., Sufian, S., KuShaari, K., Kait, C. F., Naqvi, S. R., et al. (2019). Tailored Hydrotalcite-Based Mg-Ni-Al Catalyst for Hydrogen Production via Methane Decomposition: Effect of Nickel Concentration and Spinel-like Structures. Int. J. Hydrogen Energ. 44 (28), 14424–14433. doi:10.1016/j.ijhydene.2018.10.224
Song, Q., Zhao, H., Jia, J., Zhang, F., Wang, Z., Lv, W., et al. (2019). Characterization of the Products Obtained by Pyrolysis of Oil Sludge with Steel Slag in a Continuous Pyrolysis-Magnetic Separation Reactor. Fuel 255, 115711. doi:10.1016/j.fuel.2019.115711
Tahir, M. H., Çakman, G., Goldfarb, J. L., Topcu, Y., Naqvi, S. R., and Ceylan, S. (2019). Demonstrating the Suitability of Canola Residue Biomass to Biofuel Conversion via Pyrolysis through Reaction Kinetics, Thermodynamics and Evolved Gas Analyses. Bioresour. Techn. 279, 67–73. doi:10.1016/j.biortech.2019.01.106
Tahir, M. H., Mahmood, M. A., Çakman, G., and Ceylan, S. (2020). Pyrolysis of Oil Extracted Safflower Seeds: Product Evaluation, Kinetic and Thermodynamic Studies. Bioresour. Techn. 314, 123699. doi:10.1016/j.biortech.2020.123699
Takeo, O. (1965). A New Method of Analyzing Thermogravimetric Data. Bull. Chem. Soc. Jpn. 38 (11), 1881–1886. doi:10.1246/bcsj.38.1881
Tan, W., Yang, X. G., and Tan, X. F. (2007). Study on Demulsification of Crude Oil Emulsions by Microwave Chemical Method. Separat. Sci. Techn. 42 (6), 1367–1377. doi:10.1080/01496390701193736
Tang, Q., Chen, Y., Yang, H., Liu, M., Xiao, H., Wu, Z., et al. (2020). Prediction of Bio-Oil Yield and Hydrogen Contents Based on Machine Learning Method: Effect of Biomass Compositions and Pyrolysis Conditions. Energy Fuels 34 (9), 11050–11060. doi:10.1021/acs.energyfuels.0c01893
Tang, X., Wei, X., and Chen, S. (2019). Continuous Pyrolysis Technology for Oily Sludge Treatment in the Chain-Slap Conveyors. Sustainability 11 (13), 3614. doi:10.3390/su11133614
Verma, S., Prasad, B., and Mishra, I. M. (2010). Pretreatment of Petrochemical Wastewater by Coagulation and Flocculation and the Sludge Characteristics. J. Hazard. Mater. 178 (1), 1055–1064. doi:10.1016/j.jhazmat.2010.02.047
Wang, J., Han, X., Huang, Q., Ma, Z., Chi, Y., and Yan, J. (2018). Characterization and Migration of Oil and Solids in Oily Sludge during Centrifugation. Environ. Techn. 39 (10), 1350–1358. doi:10.1080/09593330.2017.1329352
Xu, N., Wang, W., Han, P., and Lu, X. (2009). Effects of Ultrasound on Oily Sludge Deoiling. J. Hazard. Mater. 171 (1), 914–917. doi:10.1016/j.jhazmat.2009.06.091
Yang, C., Li, R., Zhang, B., Qiu, Q., Wang, B., Yang, H., et al. (2019). Pyrolysis of Microalgae: A Critical Review. Fuel Process. Techn. 186, 53–72. doi:10.1016/j.fuproc.2018.12.012
Keywords: oily sludge, slow pyrolysis, iso-conversional methods, thermodynamic analysis, activation energy
Citation: Naqvi SR, Ammar Taqvi SA, Khoja AH, Ali I, Mehran MT, Farooq W, Tippayawong N, Juchelková D and Atabani A (2022) Valorization of Wet Oily Petrochemical Sludge via Slow Pyrolysis: Thermo-Kinetics Assessment and Artificial Neural Network Modeling. Front. Energy Res. 9:782139. doi: 10.3389/fenrg.2021.782139
Received: 23 September 2021; Accepted: 16 December 2021;
Published: 04 February 2022.
Edited by:
Umakanta Jena, New Mexico State University, United StatesReviewed by:
Ranjeet Kumar Mishra, Indian Institute of Technology Madras, IndiaMuhammad Sajjad Ahmad, Hebei University of Technology, China
Copyright © 2022 Naqvi, Ammar Taqvi, Khoja, Ali, Mehran, Farooq, Tippayawong, Juchelková and Atabani. This is an open-access article distributed under the terms of the Creative Commons Attribution License (CC BY). The use, distribution or reproduction in other forums is permitted, provided the original author(s) and the copyright owner(s) are credited and that the original publication in this journal is cited, in accordance with accepted academic practice. No use, distribution or reproduction is permitted which does not comply with these terms.
*Correspondence: Salman Raza Naqvi, c2FsbWFuLnJhemFAc2NtZS5udXN0LmVkdS5waw==