 Peng Tao
 Yan Cui
 Jiayuan Liang
- 1Department of Electronics and Institute of Technology, Shantou University, Shantou, China
- 2Key Lab of Digital Signal and Image Processing of Guangdong Province, Shantou University, Guangdong, China
In this paper, basic soft-switching technology is proposed based on hard switching, and then the basic soft-switching technology is optimized, and an improved soft-switching technology is proposed to improve the conversion efficiency by reducing the switching loss. The simulation results show that the conversion efficiency of hard and basic soft switching is 94.3 and 96.1%, but the conversion efficiency of improved soft switching optimized on the basis of basic soft switching is only 95.8%. To solve this problem, an innovative soft-switching technology is put forward in this paper, and its conversion efficiency is as high as 96.3%, which is superior to the basic soft-switching technology.
Introduction
With coal, oil, natural gas, and other fossil fuels increasingly being exhausted, the problem of energy shortage in the world has gradually emerged (Hirsch, 2008; Luo G. et al., 2021; Freeman et al., 2020), and the development of new green energy has become the only way to solve such problems (Hojnik et al., 2021). At present, the newly developed green energy sources include solar, wind, tidal, and geothermal energy and so on (Burnett and Hefner, 2021; Darwesh and Ghoname, 2021; Luo X. et al., 2021; ZOU et al., 2021). The most reliable and convenient energy among these new energy sources is solar energy. This paper includes how to use solar energy efficiently to maximize the conversion efficiency of a photovoltaic (PV) power-generation system. A solar PV power-generation system has the following advantages: pollution-free energy, a flexible application site that is not interfered with by geographical location, high power quality, low loss, and multiple policy support (Qi et al., 2021).
To improve the conversion efficiency of a PV power-generation system, soft-switching technology is proposed in this paper (Aiswariya et al., 2021; Engelkemeir et al., 2019; Genc and Koc, 2017; Yinghua et al., 2012; Pakdel and Jalilzadeh, 2016). As early as the early 1970s, foreign scholars put forward series and parallel resonance (Tkachenko and Baklanov, 2015), and soft-switching technology just uses resonance principles to make the current or voltage in the switching device change sinusoidally and implement a quick soft shutdown and soft open. Soft-switching converters can be divided into four types: ZCS-PWM, ZVS-PWM, ZCT-PWM, and ZVT-PWM. This paper mainly introduces ZVT-PWM. The reason why the ZVT-PWM converter is adopted is that the ZVT converter can avoid the problem of excessive turn-off loss caused by diode reverse recovery and greatly improves conversion efficiency (Ismail and Sebzali, 1998; Jahdi et al., 2011; Kumar et al., 2015).
In the second section, according to the physical equivalent circuit model of PV cells, the output characteristics of PV modules are simulated. The third section introduces the topological structure of basic and improved soft switching. Simulation and Eexperimental Aanalysis is based on Multisim to build a DC-DC BOOST circuit (Mirzaei and Rezvanyvardom, 2020; Faraji et al., 2019; Charin et al., 2013; Pahlavandust and Yazdani, 2020; Öztürk et al., 2018). First, IRFZ24N, a power switch tube suitable for a high-frequency circuit environment and a Schottky diode MBR7545 with a moderate forward voltage drop and a large reverse voltage value are selected from Multisim, and the duty ratio in the circuit is analyzed according to the maximum power point (MPP) of the PV module. Then, Proteus is used to reduce the time of tracking the MPP. Finally, to reduce the switching and conduction loss and improve the conversion efficiency, an innovative soft-switching technology is introduced and compared with the basic soft-switching technology, and the improved soft-switching technology shows the superiority and innovation of innovative soft switching in all aspects.
Single- and Multipeak Output Characteristics of Photovoltaic Array
A PV cell is a kind of nonlinear DC power supply, which cannot be supplied at will. The equivalent circuit of a PV cell is shown in Figure 1.
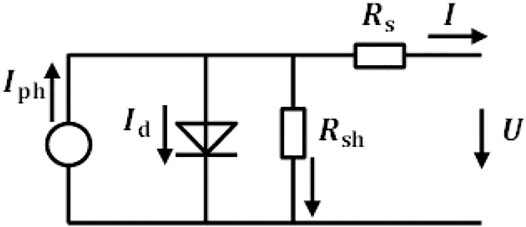
FIGURE 1. Equivalent circuit of PV cell.
The equivalent circuit model is as follows:
in which I is the output current of the solar panel, U is the output voltage of the solar panel,
Because the resistance value of the equivalent series resistance is extremely small, it can be almost ignored, and the resistance value of the equivalent parallel resistance is large, so
The models of the above equivalent circuits are all based on the standard
Output Characteristics of Photovoltaic Array Without Shading
Under the condition of no shading, the single-peak characteristic curve is obtained without considering the external environmental factors. In this section, under the standard environmental conditions (1000 W/m, 25°C), the characteristic curves of the unshaded PV cells are simulated experimentally by Simulink Figures 2, 3.
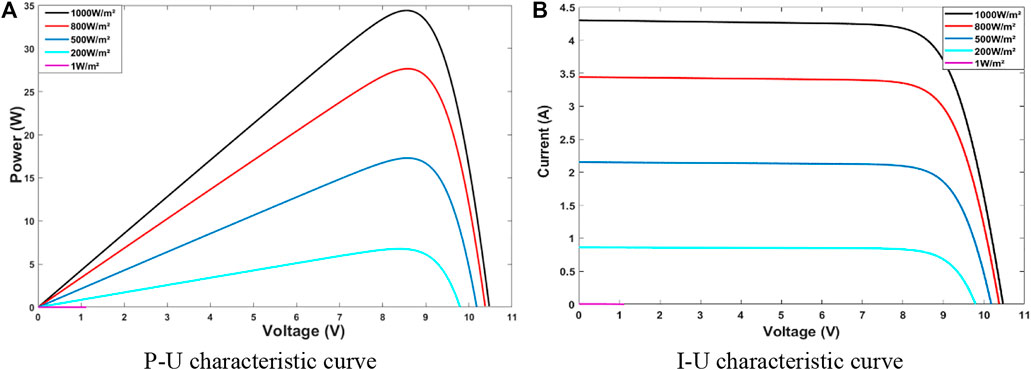
FIGURE 2. P-U and I-U characteristic curves under the same temperature and different light intensity under uniform conditions.
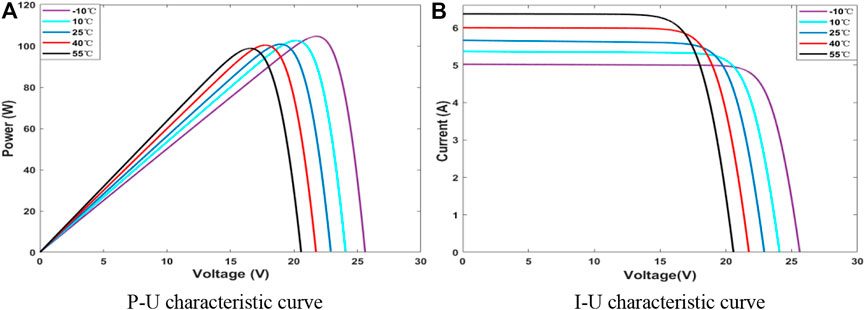
FIGURE 3. I–U characteristic curve under the same illumination intensity and different temperatures under uniform conditions.
At the same temperature, with the PV cell value changed, the PV array parameters of uniform simulation are as follows Table 1 and Table 2:
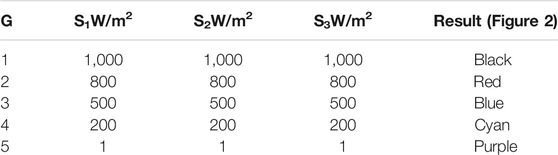
TABLE 1. PV arrays under the same temperature and different voltage values (illumination intensity).

TABLE 2. PV arrays at different temperatures with the same voltage (light intensity).
Parameters of the PV array simulated uniformly under the same illumination and changing temperature are as follows:
Through the simulation results, it can be seen that the single peak point in the P-U simulation diagram is generally on the right side, and the output power of PV modules first increases and then decreases with the increase of output voltage while the output current remains unchanged and then decreases rapidly with the increase of output voltage.
Output Characteristics of Photovoltaic Array With Shading
This section mainly shows that, in practical engineering applications, PV modules are interfered with by various factors, such as surface dust and dark clouds, which lead to the output power of some PV modules being significantly lower than other parts and accordingly bringing about the phenomenon of multiple peaks or inflection points (Veerapen and Wen, 2016; Mirza et al., 2019; Zhou et al., 2021). Three PV panels are connected in series to form a PV array, and each PV panel is connected in reverse parallel with a bypass diode. However, due to the shunt effect of the bypass diode, the PV arrays do not match, resulting in multiple local extreme points in the P-U characteristic curve, named multipeak characteristics. In this section, the PV array is simulated by Simulink with different illumination intensities at the standard atmospheric temperature to study the condition with shading. The parameters are shown in Table 3:
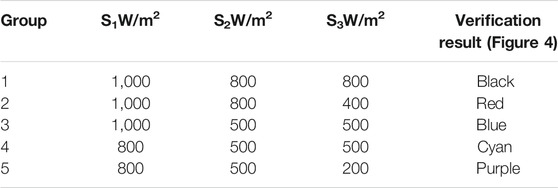
TABLE 3. PV array under shielding condition.
Through the simulation experiment in Figure 4, it can be concluded that the P-U characteristic curve of the PV array with different illumination intensities under the shading condition presents multipeaks. Taking Group 2 in Table 3 as an example, there are three local MPPs in the P-U characteristic curve of the PV array when the open circuit voltage of the PV array is
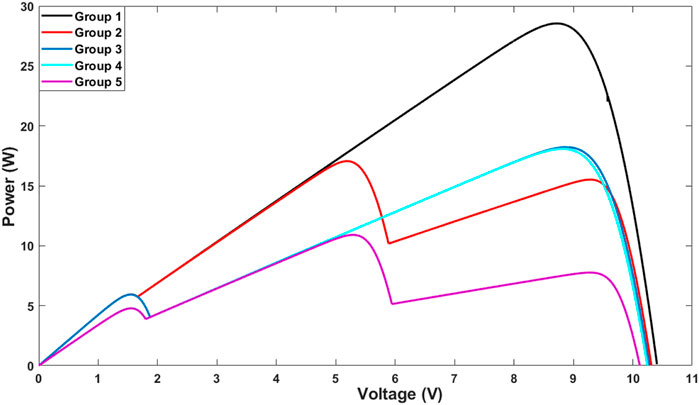
FIGURE 4. P-U characteristic curve of different illumination intensity under shielding condition.
Through some references and practical research simulation experiments, this paper concludes that, for an n × m PV array, the total number of cells is m, and the total number of different voltage differences of cells is n. The characteristics of each single cell in the PV array are basically the same, so the output characteristics have nothing to do with which specific cell is shaded and only with the overall parameters in the PV array. If the shielding situation is the same, the output characteristics of the PV array must be basically the same.
Research on Several Soft-Switching Technologies
Traditional Hard-Switching and Basic Soft-Switching Technology
The switching tubes of traditional Boost circuits generally operate in a hard-switching mode during the switching process. Hard switching began to develop in the 1960s, and it greatly reduced the volume and weight of the device and improved the overall efficiency. However, the power switch tube of the DC-DCPWM converter, which works in a series of hard-switching conditions, is accompanied by the increase of switching frequency and produces serious electromagnetic interference (EMI), which greatly reduces efficiency (Khaled et al., 2020).
According to the power electronics textbook (Society, 1981), the integral of switching on and off loss of the switch tube under the hard-switching technology is expressed as follows.
The total losses of turn on and off in that cycle are
Among them,
Interrupt capability transformation through abrupt switching processes is called hard switching, and the soft-switching process resonates through inductance L and capacitance C. In this paper, to improve the conversion efficiency of the PV power-generation system, basic soft-switching technology is proposed first. Figures 5, 6 are the Boost circuit topology and the main power waveform diagrams of basic soft switching, respectively.
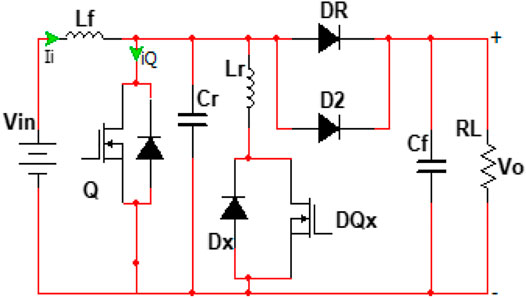
FIGURE 5. Topology of basic ZVT soft-switching Boost circuit.
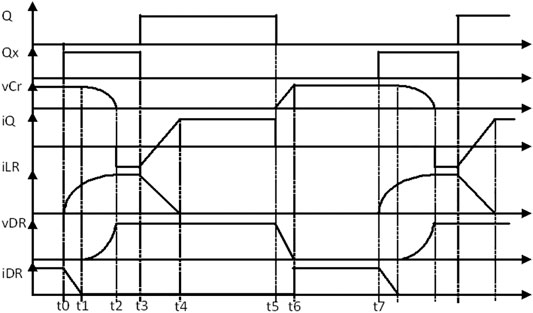
FIGURE 6. Main working power waveform.
As can be seen from Figure 6, although basic soft switching has achieved great optimization compared with traditional hard switching, basic soft switching also has many disadvantages. 1) In the case of high-input voltage and light load, the zero voltage condition is almost difficult to meet. 2) Interval and circulation energy need to be dealt with in one switching cycle. 3) Although the basic soft-switching technology improves the efficiency of the main power switch device in the circuit, the auxiliary switch tube is still in the hard-switching state, which results in switching loss that cannot be ignored. Even the switching loss offsets part of the loss that is reduced due to soft switching, which gives rise to the difficulty in improving the efficiency of the whole circuit.
Improved Soft Switching
In 2004, H. Bodur and A.F. Bakan proposed an improved soft-switching topology as is shown in Figure 7. Based on the basic ZVT-PWM Boost converter soft-switching topology, only by adding a diode and a capacitor to the auxiliary resonance network can both the main switch and the auxiliary switch complete soft switching and become improved soft switching (Simon and Das, 2014).
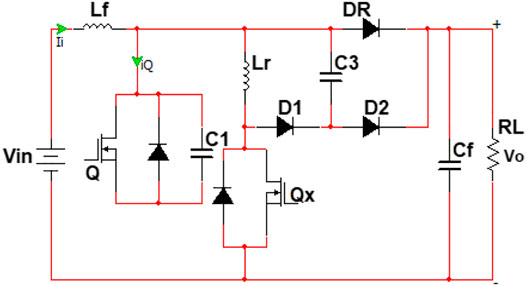
FIGURE 7. Topology of improved ZVT soft-switching Boost circuit.
Before discussing Figure 7, the following assumptions should be made: All components of the circuit are ideal. The capacitance of the output filter is relatively large enough, and the
The first four time periods in Figure 7 are in the resonance process, and at the end of the fourth time period, the following two modes are discussed according to whether the voltage at both ends of
It satisfies the initial conditions:
Mode 2 represents the case in which the resonant inductance is large, and the duration of a complete cycle is
Initial conditions are
It can be seen from Figure 8 that improved soft switching overcomes the fatal defect of basic soft switching; that is, the switching loss is too large, but improved soft switching increases the conduction loss of the auxiliary switch tube, which makes it difficult to improve the overall conversion efficiency of the circuit.
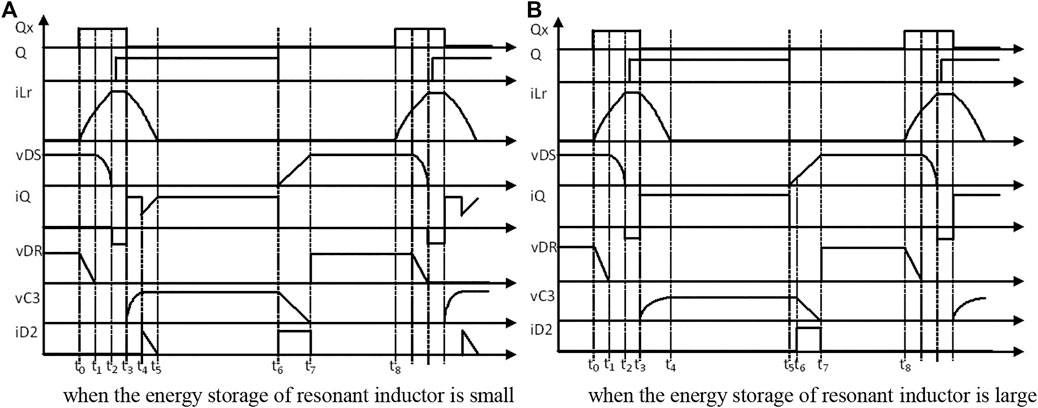
FIGURE 8. Main power waveform diagram. (A) When the energy storage of the resonant inductor is small (C) When the energy storage of the resonant inductor is large.
Simulation and Experimental Analysis
The MPP of PV modules is found based on Multisim, and the duty cycle is adjusted according to the MPP. The advantages and disadvantages of basic and improved soft switches are analyzed. On this basis, an innovative soft-switching technology is proposed to reduce the switching and conduction losses of auxiliary switch tubes. In this section, the MPP is tracked in Proteus first, and then three different methods are adopted to compare and analyze the four technologies in this paper to verify the efficiency and feasibility of the innovative soft-switching technology.
Figure 9 uses Proteus to simulate and track the MPP. The experimental results show that the parameters in Eq. 13 are superior to other parameters that can greatly speed up the tracking speed, there is no oscillation near the MPP, and the average tracking time is only 163 ms.
FIGURE 9. Tracking time of MPP of soft switching.
Oscilloscope Area Method
Under the frequency of 20 KHZ and standard experimental conditions, the hard switches and various types of soft switches are simulated, respectively, and their areas are calculated. The conversion efficiency is obtained by dividing the output area by the input area. To make the calculation result more accurate, this paper adopts the average value of 30 calculation results.
In a period of 0.00005 s, around the MPP voltage of 9.067 V, adjust the duty cycle of the hard soft switching so that the input voltage of the hard soft switching is close to the MPP voltage. Read at this time. The simulation results in Figure 10 show that the conversion efficiency of the hard switching is about 94.382%. Similarly, the other three soft-switching technologies are measured with this method. The simulation results show that the conversion efficiency of basic soft switching is about 96.181%, that of improved soft switching is about 95.950%, and that of innovative soft switching is about 96.398%.
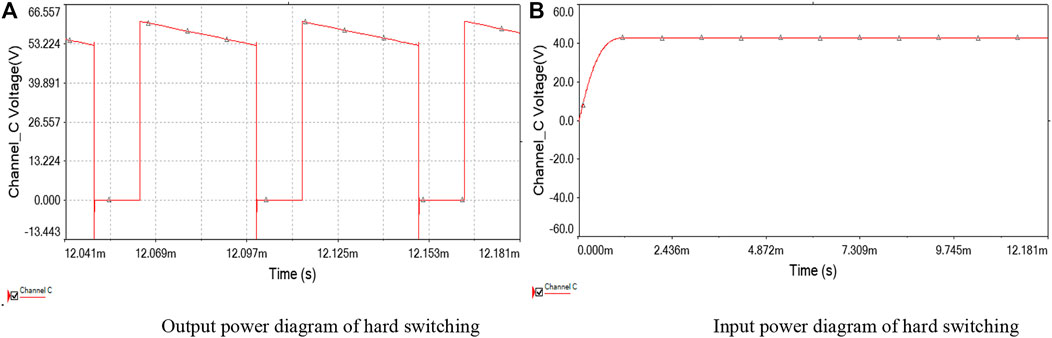
FIGURE 10. Schematic diagram of hard and soft switching.
The improved soft switching adds a capacitor and a diode based on basic soft switching, and they can improve the conversion efficiency by reducing the switching loss in theory. However, the increased Schottky diode greatly increases the diode conduction loss while reducing the switching loss, so the conduction loss is far greater than the switching loss. Innovative soft switching is improved on the basis of these two types of soft switches. Simulation results show that the conversion efficiency is the highest, which proves the high efficiency of innovative soft switching. To verify the accuracy of this method, two other different methods are applied to calculate the conversion efficiency and compared with this method to obtain accurate values.
Product Method of Ammeter and Voltmeter
In this section, the product methods of ammeter and voltmeter are used to compare with the oscilloscope area method and verify the accuracy of the conversion efficiency. On the basis of the schematic diagram in Figure 11, the input and output terminals are connected in series with a multimeter and then adjusted to the current level, and the corresponding power is calculated according to the values of the input and output current at this time.
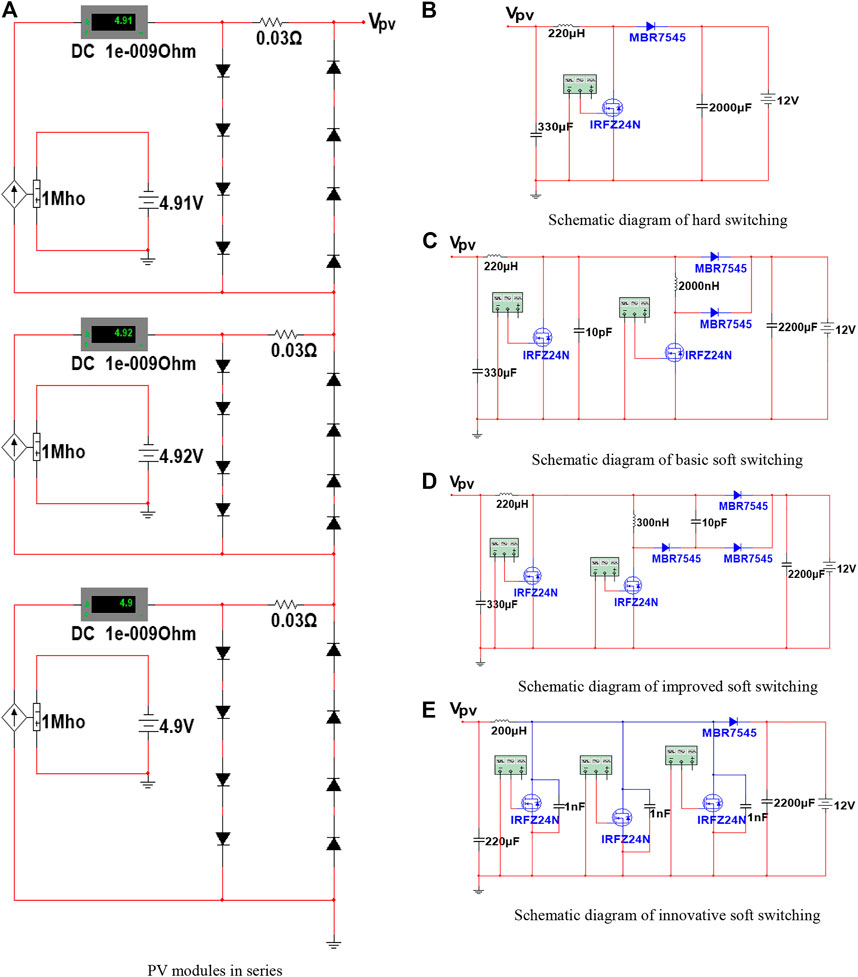
FIGURE 11. Hard switching input and output power diagram.
According to the method of MPP in Oscilloscope Area Method, the simulation results show that the conversion efficiency of hard switching in Figure 12 is about 94.293%, that of basic soft switching is about 96.145%, that of improved soft switching is about 95.882%, and that of innovative soft switching is about 96.305%.
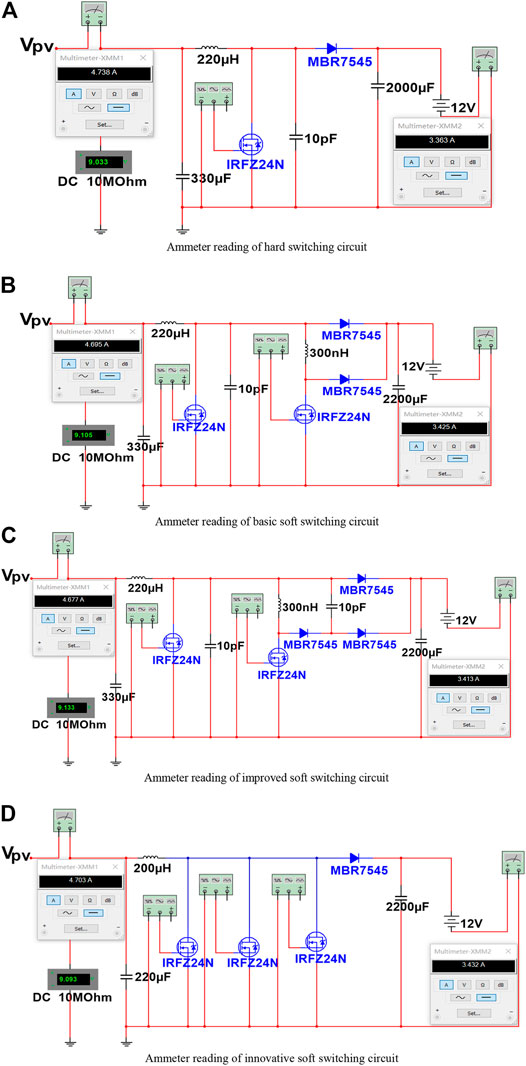
FIGURE 12. Ammeter reading of hard and soft switching.
Multimeter Direct Reading Method
To verify which method, 4.1 or 4.2, is more accurate, this section connects a multimeter to the input and output ends, respectively, based on the schematic diagrams of various types of hard and soft switches. Unlike the second method, there is no specific current source in Multisim, so this method uses a current-controlled voltage source to convert the voltage signal and then connects the multiplier to the multimeter and finally adjusts the multimeter to the voltage level.
Under the experimental conditions in Oscilloscope Area Method and Product Method of Ammeter and Voltmeter, the conversion efficiency of hard switching in Figure 13 is about 94.308%, that of basic soft switching is about 96.159%, that of improved soft switching is about 95.895%, and that of innovative soft switching is about 96.310% Table 4 is the data summation.
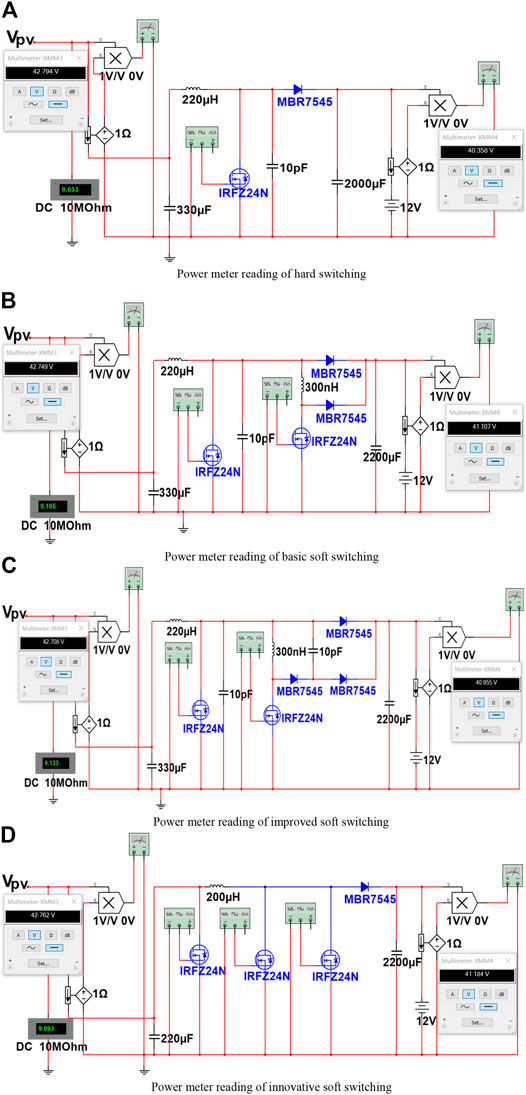
FIGURE 13. Power meter readings for hard and soft switches.
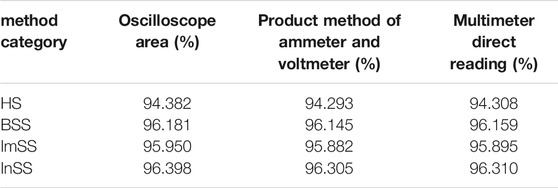
TABLE 4. Statistics on conversion efficiency.
Conclusion
The innovative soft switching proposed in this paper can effectively optimize the dynamic and steady-state performance of MPPT and greatly shorten its average tracking time. In addition, this method is simple, convenient, and has little efficiency loss. The fourth section uses Multisim to calculate the conversion efficiency of four kinds of hard and soft switches with three different measuring methods. The experimental results show that the measured results are almost equal, and the error is only within 0.1%. Second, it also verifies that improved soft switching optimizes the shortcomings of basic soft switching, but it also has a more fatal problem. To solve this problem, innovative soft switching is proposed in this paper. Simulation results show that the conversion efficiency of innovative soft switching can reach 96.3%, and its tracking speed is also the most efficient. It can be seen from Figure 9 that MPP can be tracked in only 162 ms.
To sum up, innovative soft switching technology can greatly improve the conversion efficiency and average tracking time and promote the rapid development of the PV industry (Zhao and Wang, 2020).
Data Availability Statement
The original contributions presented in the study are included in the article/Supplementary Material, further inquiries can be directed to the corresponding author.
Author Contributions
PT: As the first author of the paper, I conducted simulation experiments and data modification, and completed the writing of the paper YC: Give guidance and provide literature JL: Check your paper for errors and Modify the format of the paper.
Funding
This work was supported by the Key Lab of Digital Signal and Image Processing of Guangdong Province under grant 190827105585418.
Conflict of Interest
The authors declare that the research was conducted in the absence of any commercial or financial relationships that could be construed as a potential conflict of interest.
Publisher’s Note
All claims expressed in this article are solely those of the authors and do not necessarily represent those of their affiliated organizations, or those of the publisher, the editors, and the reviewers. Any product that may be evaluated in this article, or claim that may be made by its manufacturer, is not guaranteed or endorsed by the publisher.
References
Aiswariya, S., Muthulakshmi, S., Naganathan, G. S., Senthilkumar, M., and Rasheka, B. (2021). Design and Simulation of a Soft Switched Converter for Renewable Energy Systems. Mater. Today Proc., 2214–7853. doi:10.1016/j.matpr.2021.03.321
Burnett, J. W., and Hefner, F. (2021). Solar Energy Adoption: A Case Study of South Carolina. Electr. J. 34, 106958. doi:10.1016/j.tej.2021.106958
Charin, C., Iqbal, S., and Taib, S. (2013). A New Soft Switching PWM DC-DC Converter with Auxiliary Circuit and Centre-Tapped Transformer Rectifier. Proced. Eng. 53, 241–247. doi:10.1016/j.proeng.2013.02.032
Darwesh, M. R., and Ghoname, M. S. (2021). Experimental Studies on the Contribution of Solar Energy as a Source for Heating Biogas Digestion Units. Energ. Rep. 7, 1657–1671. doi:10.1016/j.egyr.2021.03.014
Emami, Z., Farzanefard, H., and Motahari, S. R. (2010). “EMI Evaluation in Hard Switching and Soft Switching PWM Flyback Converters,” in 2010 1st Power Electronic & Drive Systems & Technologies Conference (PEDSTC), Tehran, Iran, February 17–18, 2010), 46–51. doi:10.1109/PEDSTC.2010.5471857
Engelkemeir, F., Gattozzi, A., Hallock, G., and Hebner, R. (2019). An Improved Topology for High Power Soft-Switched Power Converters. Int. J. Electr. Power Energ. Syst. 104, 575–582. doi:10.1016/j.ijepes.2018.07.049
Faraji, R., Adib, E., and Farzanehfard, H. (2019). Soft-switched Non-isolated High Step-Up Multi-Port DC-DC Converter for Hybrid Energy System with Minimum Number of Switches. Int. J. Electr. Power Energ. Syst. 106, 511–519. doi:10.1016/j.ijepes.2018.10.038
Freeman, G. M., Apt, J., and Moura, J. (2020). What Causes Natural Gas Fuel Shortages at U.S. Power Plants? Energy Policy 147, 111805. doi:10.1016/j.enpol.2020.111805
Genc, N., and Koc, Y. (2017). Experimental Verification of an Improved Soft-Switching cascade Boost Converter. Electr. Power Syst. Res. 149, 1–9. doi:10.1016/j.epsr.2017.04.015
Hirsch, R. L. (2008). Mitigation of Maximum World Oil Production: Shortage Scenarios. Energy Policy 36, 881–889. doi:10.1016/j.enpol.2007.11.009
Hojnik, J., Ruzzier, M., Fabri, S., and Klopčič, A. L. (2021). What You Give Is what You Get: Willingness to Pay for green Energy. Renew. Energ. 174, 733–746. doi:10.1016/j.renene.2021.04.037
Ismail, E. H., and Sebzali, A. J. (1998). A New Class of Quasi-Square-Wave Resonant Converters with ZCS. Energ. Convers. Manage. 39, 1559–1569. doi:10.1016/S0196-8904(98)00028-4
Jahdi, S., Fry, M., and Lai, L. L. (2011). Energy Saving in Drives Using ZCT ZVT DC-DC Converters, PWM Inverters in Variable Speed Compressor Applications. 7th Int. Conf. Compressors their Syst. 2011, 283–294. doi:10.1533/9780857095350.6.283
Kang, I. H., Kim, S. C., Bahng, W., Joo, S. J., and Kim, N. K. (2012). Accurate Extraction Method of Reverse Recovery Time and Stored Charge for Ultrafast Diodes. IEEE Trans. Power Electron. 27, 619–622. doi:10.1109/TPEL.2011.2161889
Khaled, U., Farh, H., Alissa, S., Abanmi, A., and Aldraimli, O. (2020). Efficient Solution of the DC-link Hard Switching Inverter of the PV System. J. King Saud Univ. - Eng. Sci. 32, 425–431. doi:10.1016/j.jksues.2018.09.001
Luo, G., Liu, S., Yan, X., and Guo, Y. (2021). Institutional Constraints to China's Low Carbon Transition: A Case Study of China's Coal-To-Gas Program. Struct. Change Econ. Dyn. 57, 121–135. doi:10.1016/j.strueco.2021.01.005
Luo, X., Liu, Y., Feng, P., Gao, Y., and Guo, Z. (2021). Optimization of a Solar-Based Integrated Energy System Considering Interaction between Generation, Network, and Demand Side. Appl. Energ. 294, 116931. doi:10.1016/j.apenergy.2021.116931
Mirza, A. F., Ling, Q., Javed, M. Y., and Mansoor, M. (2019). Novel MPPT Techniques for Photovoltaic Systems under Uniform Irradiance and Partial Shading. Solar Energy 184, 628–648. doi:10.1016/j.solener.2019.04.034
Mirzaei, A., and Rezvanyvardom, M. (2020). High Voltage Gain Soft Switching Full Bridge Interleaved Flyback DC-DC Converter for PV Applications. Solar Energy 196, 217–227. doi:10.1016/j.solener.2019.11.032
Moshksar, E., and Ghanbari, T. (2018). A Model-Based Algorithm for Maximum Power point Tracking of PV Systems Using Exact Analytical Solution of Single-Diode Equivalent Model. Solar Energy 162, 117–131. doi:10.1016/j.solener.2017.12.054
Öztürk, S., Poşpoş, P., Utalay, V., Koç, A., Ermiş, M., and Çadırcı, I. (2018). Operating Principles and Practical Design Aspects of All SiC DC/AC/DC Converter for MPPT in Grid-Connected PV Supplies. Solar Energy 176, 380–394. doi:10.1016/j.solener.2018.10.049
Pahlavandust, M., and Yazdani, M. R. (2020). Single-switch Boost DC-DC Converter with Zero-Current-Switching, High Power Density and Low Electromagnetic Interference. AEU - Int. J. Electron. Commun. 121, 153229. doi:10.1016/j.aeue.2020.153229
Pakdel, M., and Jalilzadeh, S. (2016). A Novel Topology and Control Strategy for a Soft-Switched Single-phase Grid Connected Inverter. J. Electr. Syst. Inf. Technol. 3, 81–93. doi:10.1016/j.jesit.2015.11.011
Qi, L., Jiang, M., Lv, Y., Zhang, Z., and Yan, J. (2021). Techno-economic Assessment of Photovoltaic Power Generation Mounted on Cooling Towers. Energ. Convers. Manage. 235, 113907. doi:10.1016/j.enconman.2021.113907
Shiva Kumar, S., Panda, A. K., and Ramesh, T. (2015). A ZVT-ZCT PWM Synchronous Buck Converter with a Simple Passive Auxiliary Circuit for Reduction of Losses and Efficiency Enhancement. Ain Shams Eng. J. 6, 491–500. doi:10.1016/j.asej.2014.10.018
Simon, S., and Das, J. (2014). “PV Powered Soft Switched Boost Converter Using MPPT Control,” in 2014 Annual International Conference on Emerging Research Areas: Magnetics, Machines and Drives (Kottayam, India: AICERA/iCMMD)), 1–6. doi:10.1109/AICERA.2014.6908250
Society, P. (1981). Electric Power Systems Textbooks. IEEE Trans. Power Apparatus Syst. PAS-100, 4255–4262. doi:10.1109/TPAS.1981.316977
Tkachenko, G. I., and Baklanov, A. N. (2015). A Method of Resonant Series-Parallel Identification. Proced. Eng. 129, 690–694. doi:10.1016/j.proeng.2015.12.092
Veerapen, S., and Huiqing Wen, H. (2016). “Shadowing Effect on the Power Output of a Photovoltaic Panel,” in 2016 IEEE 8th International Power Electronics and Motion Control Conference (Hefei, China: IPEMC-ECCE Asia), 3508–3513. doi:10.1109/IPEMC.2016.7512858
Xin-gang, Z., and Wei, W. (2020). Driving Force for China's Photovoltaic Industry Output Growth: Factor-Driven or Technological Innovation-Driven? J. Clean. Prod. 274, 122848. doi:10.1016/j.jclepro.2020.122848
Yinghua, Y., Honglin, G., Xinhua, W., and Jinfei, T. (2012). Study on Soft Switching Technology to Reduce Electromagnetic Interference of PWM Inverter. Energ. Proced. 17, 384–390. doi:10.1016/j.egypro.2012.02.110
Zhou, C.-g., Huang, L., Ling, Z.-x., and Cui, Y.-b. (2021). Research on MPPT Control Strategy of Photovoltaic Cells under Multi-Peak. Energ. Rep. 7, 283–292. doi:10.1016/j.egyr.2021.01.068
Keywords: soft switching, maximum power point, high conversion efficiency, innovative, multi peak characteristic
Citation: Tao P, Cui Y and Liang J (2021) Research on Efficient Soft Switching Based on MPPT of PV Power Generation System. Front. Energy Res. 9:728789. doi: 10.3389/fenrg.2021.728789
Received: 22 June 2021; Accepted: 20 July 2021;
Published: 07 September 2021.
Edited by:
Bo Yang, Kunming University of Science and Technology, ChinaReviewed by:
Fusheng Li, Southern Power Grid Research Institute. Co., Ltd., ChinaKaiping Qu, China University of Mining and Technology, China
Copyright © 2021 Tao, Cui and Jiayuan Liang. This is an open-access article distributed under the terms of the Creative Commons Attribution License (CC BY). The use, distribution or reproduction in other forums is permitted, provided the original author(s) and the copyright owner(s) are credited and that the original publication in this journal is cited, in accordance with accepted academic practice. No use, distribution or reproduction is permitted which does not comply with these terms.
*Correspondence: Yan Cui, eWN1aUBzdHUuZWR1LmNu