 Kurt A. Rosentrater*
 Lu Yang
- Iowa State University, Ames, IA, United States
The production of bio-based ethanol has been one of the fastest growing industries in the United States during the past decade. Thus, wider exploration of ethanol coproduct uses is necessary in the ethanol plant. Currently, process steams such as whole stillage, thin stillage, and syrup are processed into distiller dried grains with solubles and fed to livestock. The storability of whole stillage, thin stillage, and syrup influences the economic and energetic balances of fuel ethanol production. However, there are few investigations of the shelf life for these products or how to measure these quantities. The objectives of this research were to test physical and biological properties of whole stillage, thin stillage, and syrup and determine storability and allowable shelf life for these materials as influenced by storage temperature levels. Using standard laboratory methods, several properties were determined, including moisture content, water activity, thermal properties (conductivity, resistivity, volumetric heat capacity, and diffusivity), color, mold development, and CO2 production. Also, the separation processes due to settling were observed over 72 h. The thin stillage and whole stillage had relative high average moisture contents of 92% (w.b.) and 87% (w.b.), respectively, and a mean water activity of 0.99; the high water content marked samples easily susceptible to rapid spoilage. Time had a significant effect (p < 0.05) on properties of coproducts. Both thin stillage and whole stillage samples got mold growth after 5 days incubation at 32°C. Thin stillage had the greatest separation rate in the settling experiment. However, syrup had a relative low average moisture content of 62% and an average water activity of 0.92. No mold growth and settling separation happened in syrup samples. There was no evidence showing that a linear relationship exists between Hunter L*, a* and b*, and mold growth. The Solvita® test showed that high-temperature treatment caused high CO2 production in all samples. The exponential models described the relationship between storage time (from 0 to 5 days at 25 and 35°C) and CO2 concentration for the three coproducts. This study is a first step to explore opportunities for utilizing valuable components from these coproducts. Follow-up study should work on separation processes to concentrate the valuable components of these coproducts. Exploring the potential value of ethanol coproducts could maintain and improve the profitability of the ethanol industry.
Introduction
The corn ethanol industry has evolved into an invaluable economic engine for communities across the nation. In 2014, the fuel ethanol production in the United States (U.S.) was 54,131 m3, which supported 83,949 direct jobs in the agricultural sector and 295,265 indirect jobs across all sectors of the economy (RFA, 2015). Also, the ethanol industry makes an enormous and overlooked contribution to the production animal feed supply. In the ethanol process, one-third of every bushel of grain that enters the ethanol process is enhanced and sent to the animal feed market. Distiller grains, the corn gluten feed, and the corn gluten meal are the major coproducts which are used to feed livestock. Only the starch portion of the grain is used to produce ethanol; the remaining protein, fat, and fiber pass through the process. These nutrient-dense coproducts are primarily fed to livestock, including beef cattle, dairy cows, swine, poultry, and fish in nations around the world. In 2014, the ethanol industry produced as estimated 39 billion kilograms of feed, making the renewable fuel sector become the largest animal feed processing segment in the United States (RFA, 2015).
Ethanol production from corn is mainly classified into two types, namely, wet milling and dry grinding. In the U.S., dry grinding is more predominant in ethanol production plants. In dry grinding ethanol processing, corn is ground into a fine powder which is then cooked to form starch. The enzymes, alpha-amylase, and glucoamylase are added to liquefy and hydrolyze the starch slurry into simple sugars for fermentation. Yeast is used to ferment the simple sugars to alcohol. The resulting mash called beer is distilled to separate ethanol with whole stillage. The whole stillage is then centrifuged to concentrate the solids, wet distiller grains (WDGs), from the supernatant. Thin stillage from the supernatant which contains the unfermented components (oil, fiber, protein, and minerals) and fermentation byproducts is then sent to an evaporator to make condensed distiller solubles (CDSs). WDG and CDS are blended and dried in a large rotary drum dryer, resulting in the distiller dried grains with solubles (DDGSs). The properties of DDGS have drawn great interest to researchers in the area of ethanol production over the years, especially to those in the animal feeding industry. DDGS is sold as a feed ingredient for livestock due to its high proportion of nutritional components, especially protein, fat, and other key nutrients (Table 1). The relatively high content of protein affects the market value of DDGS. In addition, the low moisture content (10–13%) in DDGS helps to prevent microbial degradation and to maintain product stability (Rosentrater and Muthukumarappan, 2006; Kim et al., 2007; Bhadra et al., 2009).
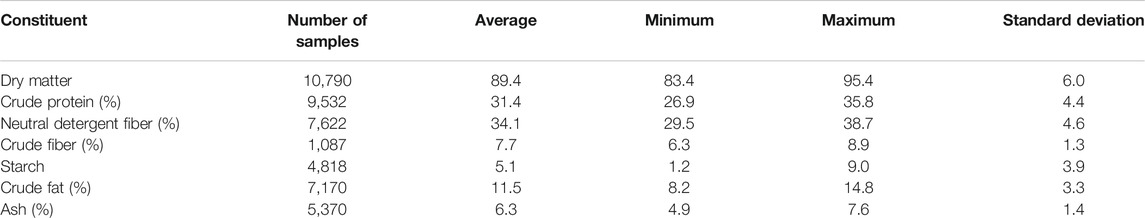
TABLE 1. Typical chemical composition (all constituents on a dry matter basis) for corn-based DDGS (DairyOne, 2021).
However, drying distiller grains requires energy and time and costs money; as a result, DDGSs are more expensive than other distiller grains (Gordon, 2008). To lower operational costs, some other distiller grains could be considered as an alternative animal feed ingredient. Whole stillage is the product from the distiller tank and is then sent to a centrifuge to produce the liquid fraction (thin stillage) and solid fraction (wet distillers’ grains). The thin stillage is then sent to the evaporator to make CDSs. The mixture of WDGs and CDSs is called wet distiller grains with solubles (WDGSs), which can be used as an ingredient in animal feed. However, WDGS has 30–35% moisture content and is less efficient to transport due to its short shelf life (Dooley et al., 2008). As a consequence, WDGS needs to be delivered rapidly and utilized by animal feeding operation nearby an ethanol plant.
The recent growth of fuel ethanol production brought up an increased availability of ethanol coproducts for animal food; thus, the interest in using the coproducts which are produced upstream of the DDGS process also increased. Increasing using the upstream products in the marketplace, for instance, the whole stillage, thin stillage, and syrup, the environmental impacts, such as greenhouse gas emission, and the overall energy consumption throughout the drying process and fuel ethanol production could be significantly reduced. Thus, the storability of whole stillage, thin stillage, and syrup plays a significant role in economic and energetic balances in the animal feeding market.
While many studies have focused on properties of DDGS, little has examined the properties of upstream components [e.g., whole stillage, thin stillage, and syrup (CDSs)]. In order to fully understand the potential value of these upstream coproducts, this study worked on physical and biological properties of whole stillage, thin stillage, and syrup to provide the background for future research. The physical properties provide the information necessary to design and utilize unit operations, including handling, storage, and processing, while the biological analyses provide information about potential valuable component change over time. Thus, the objectives of this study were to 1) determine various physical and biological properties of whole stillage, thin stillage, and syrup and 2) determine allowable shelf life for these three coproducts as influenced by different storage temperature levels.
Materials and Methods
Initial Characterization
Fresh whole stillage, thin stillage, and syrup were collected from the Lincolnway Energy plant in Nevada, Iowa. The samples were stored in sealed plastic buckets with a screwed lid in a refrigerator at 4°C until needed.
Initial properties of whole stillage, thin stillage, and syrup were characterized at the outset of the experiment (t = 0 day). The initial properties (Figure 1) included moisture content, water activity, thermal conductivity, thermal resistivity, thermal diffusivity, volumetric specific heat, separation due to settling, and color analysis. The settling test was evaluated using two replications, and the rest of the tests were determined using three replications.
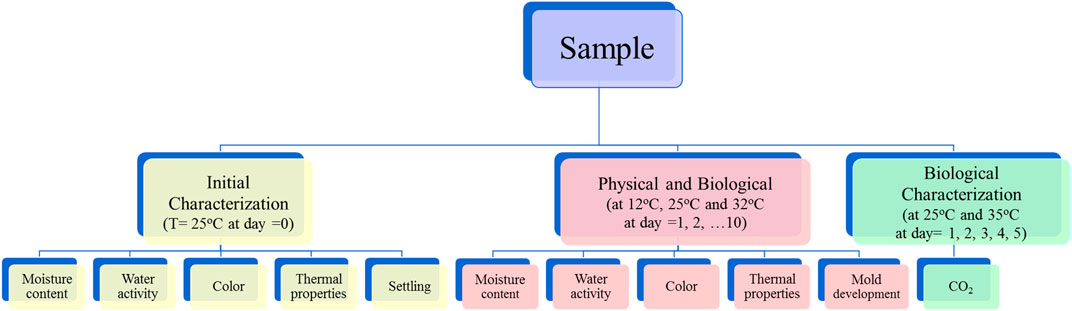
FIGURE 1. Experimental approach used in this study.
Moisture Content and Water Activity
Moisture content was determined following the standard method S352.2 (ASAE 2004) using a forced-convection laboratory oven (Heratherm, Thermo Scientific Inc., Odessa, TX) at 103°C for 2 h. Twenty to 30 g of each sample was transferred into aluminum moisture containers of known masses from Petri dishes. They were dried at 103°C for 2 h, placed on the working bench to cool to room temperature, and then weighed.
Water activity was measured using a calibrated water activity meter (Aqualab, Decagon Devices Inc., Pullman, WA) and tested at room temperature (24 ± 1°C). Samples were placed in plastic dishes, and each dish had the sample of the same depth (1 mm).
Thermal Properties
Thermal conductivity, resistivity, diffusivity, and volumetric specific heat were determined with a thermal property meter (KD2, Decagon Devices, Inc., Pullman, WA) that utilized the line heat source probe technique. Two randomly selected samples from each temperature condition were poured into 50 ml glass beakers. The sample in each beaker had the same depth (40 ml).
Color
Samples were transferred to metal dishes. The color was measured using a spectrocolorimeter (CR-400 Chroma Meter, Konica Minolta, Ramsey, NJ) using the L*-a*-b* opposable color scales (Hunter Associates Laboratory, 2002) according to the manufacturer’s guidelines. To measure color, each metal dish containing a sample was placed under the machine’s sample observation port, and the three reflectance spectra measurements were collected.
Separation due to Settling
For the settling test, products were homogenized and then placed into conical settling columns. Two conical settling columns were assigned for each product. The six conical settling columns were placed on the horizontal lab table at room temperature (25°C). The volume of the top layer and bottom layer of each column was recorded hourly in the first 7 h period, and then, the results were only reported at the 24th and 72nd h.
Physical and Biological Characterization of Samples Over Time
Homogenized, fresh whole stillage, thin stillage, and syrup were evenly distributed into 180 sterile, plastic (100 × 15 mm) Petri dishes at room temperature. Each dish contained the same depth (10 mm). A total of 60 Petri dishes of each coproduct were divided into three groups. Each group (20 Petri dishes) with lids containing samples was assigned to one of three incubation temperatures: 12, 25, and 32°C. Three different temperatures were used to understand how these coproducts behave as the temperatures changes during storage or processing. 25°C was chosen to set at average room temperature; 12°C as chosen to predict behavior as products are processed in cooling operations or during storage under winter conditions; 35°C was chosen to predict behavior as products are processed in heating operations or during storage under late summer conditions. The observation period was 10 days.
At 1-day interval, two randomly selected dishes containing each coproduct at each temperature treatment were analyzed for moisture content, water activity, thermal properties, color, and the presence of mold, as shown in Figure 1. Two replications were utilized for each test. Changes in the response variables (moisture content, water activity, thermal properties, color, and visual changes in mold) were examined over time during the experiments.
Mold Observation
For the randomly selected samples on each day, the presence of visible mold in the Petri dish was assessed by inspection using the following progressive rating system: 0, no visible mold; 1, any visible mold (<50% of the surface colonized); and 2, extensive colonized (>50% of the surface colonized).
Biological Characterization of Samples Over Time
Solvita® Technology
Woods End Labs has developed the Solvita® system, which is a measurement system that has applications for soil, compost, manure, and grain assessments (https://solvita.com). One type measures ammonia (NH3), and the other is for carbon dioxide (CO2) in a low and high range. The Solvita® technology assesses a component of sample health by measuring carbon dioxide emissions which are primarily due to microbial respiration. Each Solvita® test kit consists of a 273 ml glass jar, a color scale, and a packet containing a polystyrene paddle that has a CO2-sensitive gel surface on one side (Figure 2). The gel changes color according to the CO2 concentration in the jar due to the pH buffer that is on the gel surface. The CO2 produced by microbes inside the jar will diffuse into the gel, neutralize the buffer, and cause a pH drop which will lead to color change on the gel surface. The color number is determined by comparing the color of the gel with the colors on the color card (Figure 2). The numbers on the color card are assigned to a series of colors that associate with the processing of color changes as the CO2 concentration increases in the jar. According to Woods End Laboratory, CO2 concentrations greater than 3.02% (color 5) will not be measurable (https://solvita.com).
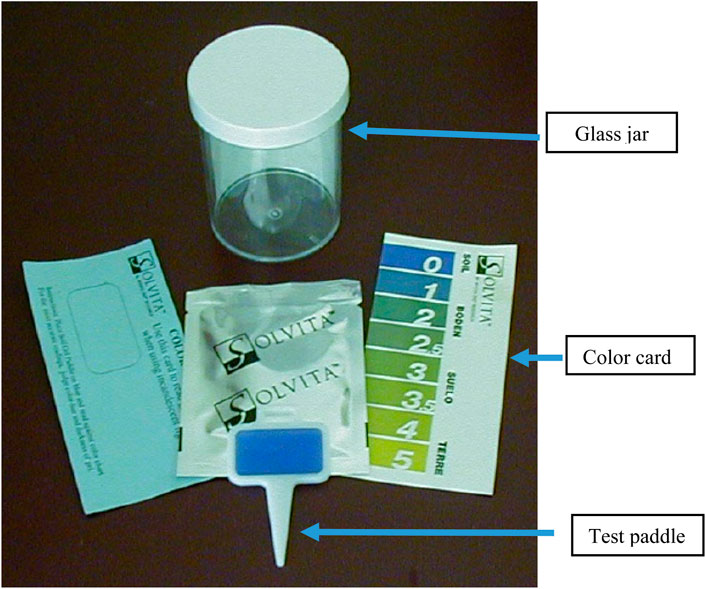
FIGURE 2. Solvita® test kit used to measure CO2 evolution over time.
Chitrakar et al. (2006) tested this kit for shelled corn and concluded that the equipment was able to quantify the storage conditions of shelled corn. They quantified effects of moisture content and incubation time on fungal growth in shelled corn. Moog et al. (2008) used Solvita® kits to measure the fungal susceptibility of shelled corn that had been rewetted to 21% moisture content and incubated at 24°C. Due to the successful use of the Solvita® test kit in measuring CO2 production from a variety of sources, this method was well suited for analysis of distiller grains from ethanol production, such as whole stillage, thin stillage, and syrup.
Experimental Design and Sampling
Coproduct samples (5 ml) were poured into a Solvita® glass jar with a Solvita® paddle, and the jar was sealed. For each coproduct, two glass jars were assigned to one of two incubation temperatures: 25 and 35°C. Two different temperatures were used to understand how these products behave as their temperatures are adjusted during storage or processing: 25°C was to set at average room temperature, and 35°C was chosen to predict behavior as products are processed in heat operations or during storage under late summer conditions.
CO2 production (carbon mineralization or respiration) was used to estimate aerobic stability. CO2 production was quantified by observing the color of the paddle gel surface in the sealed glass jar containing the sample at every 24 h during the 5-day experiment (Figure 1). To minimize air exchange between the outside atmosphere and the air in the jars, the paddles were not removed, and the surface colors were observed through the jars. Two measurements of a sample were collected. A regression analysis was used to assess the correlation within 5-day respiration from Solvita® gel.
Data Analysis
Formal statistical analyses on all collected data were performed by Microsoft Excel v. 2013 (Microsoft Corporation, Redmond, WA) and JMP Pro v. 12 (JMP Campus Dr, Cary, NC) software using a Type I error rate (α) of 0.05 and included summary statistics, which are given as means ± 1SD; ANOVA (analysis of variance), General Linear Models (to test for differences over time); and nonlinear regression.
Results and Discussion
Initial Characterization
Initial properties of whole stillage, thin stillage, and syrup results are summarized in Table 2, which provides replications; minimum, maximum, and mean values; and the standard deviation for each parameter studied. Many of the properties generally have relatively low variability, with the coefficient of variation values ranging from 0 for moisture content in whole stillage and thin stillage samples to 0.3 for conductivity in whole stillage. Resistivity appeared to exhibit high variation though, which may have been due to the nature of insufficiently mixed solids and water (although this was not examined).
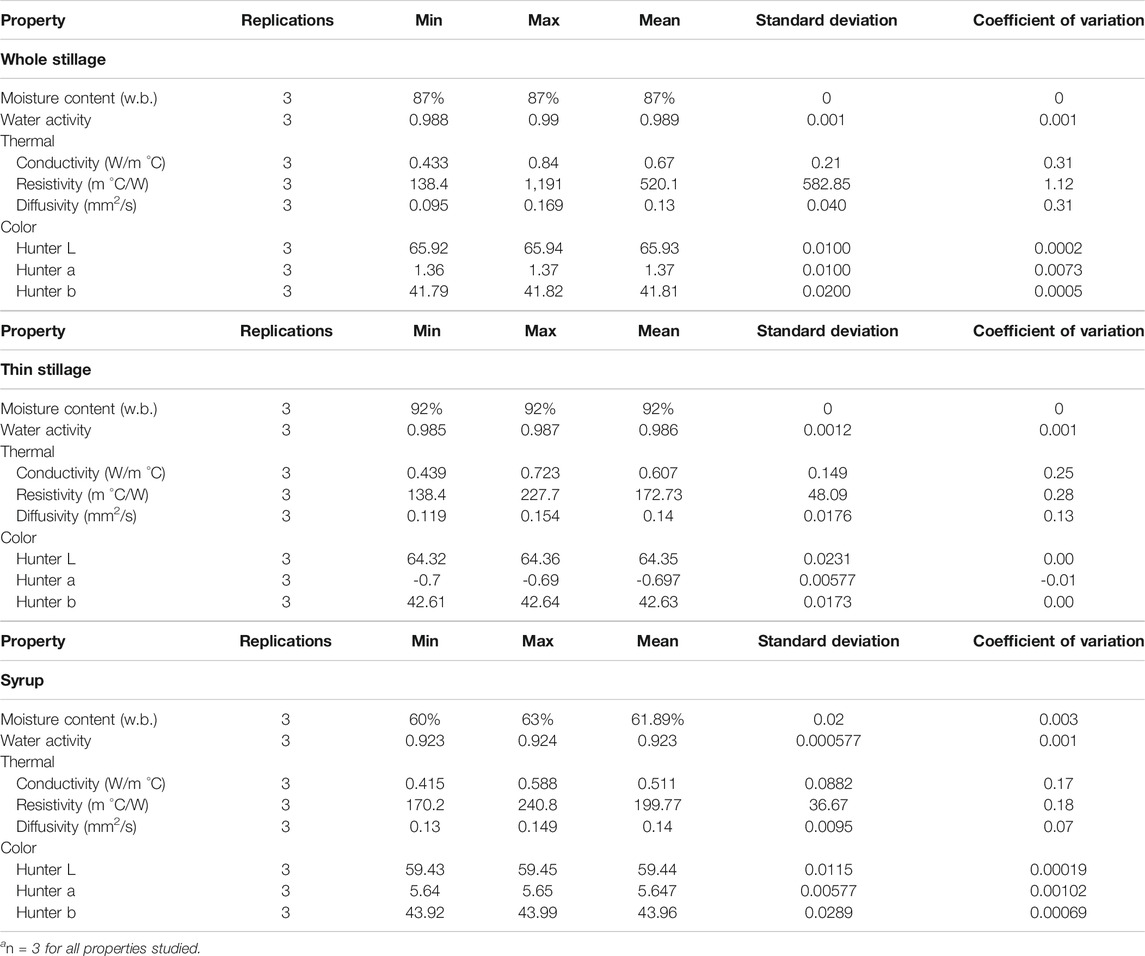
TABLE 2. Initial properties of whole stillage, thin stillage, and syrup at t = 0. a
Moisture Content and Water Activity
Moisture content and water activity relate to the product’s shelf life. Moisture content is the amount of water contained in a material, including “bound” and “free” water. However, water activity in food is the “free” water that can support the growth of microorganisms.
The samples in this study had initial average moisture contents of 87% (w.b.) in whole stillage, 92% (w.b.) in thin stillage, and 62% (w.b.) in syrup (Table 2). Since thin stillage is the liquid fraction of whole stillage, it was expected to have the highest initial moisture content. The high moisture contents of both whole stillage and thin stillage make them highly susceptible to rapid spoilage and microbial growth. In order to keep the products from spoiling and to reduce the cost associated with transpiration, the moisture content would need to be reduced to approximately 6% (w.b.) in whole stillage and ∼11% (w.b.) in thin stillage, which is the recommended moisture content for feed products, as it allows them to be microbiologically safe and reduces the cost of transport (Beauchat, 1981; Wang et al., 1997). When comparing with whole stillage and thin stillage, syrup had a relative low moisture content (62% w. b.), but it is still at high risk of spoilage. The shelf life for these coproduct streams with a high moisture content usually ranged from 4 to 7 days depending on storage conditions (Tjardes and Wright 2002).
Correspondingly, the mean water activities in these three materials were 0.99 in both whole stillage and thin stillage and 0.92 in syrup (Table 2). The parameter of water activity quantities the amount of “free” water available for use by microorganisms and chemical agents and therefore is a measure of a material’s susceptibility to spoilage and deterioration. Usually, products with no free water (aw = 0.0) are not at risk for spoilage. However, materials with free surface water (aw = 1.0) are at high risk for rapid degradation. Not surprisingly, whole stillage, thin stillage, and syrup all had very high values of water activity (greater than 0.9), which indicate that these three materials appear to be at high risk of spoilage by microorganism growth.
The moisture content and water activity data collected from whole stillage and thin stillage in this study were similar to values published from others (Byun, 2008; Wood, 2013). However, the data of syrup were slightly less than those of a previous study (Wood, 2013); the difference could come from the different experimental and sampling procedures and various locations of sample generating.
Thermal Properties
Understanding how the product thermal properties behave is essential in design and utilization of unit operations, like how heating or cooling the product may be needed during the process.
The measurement of thermal conductivity indicates the ability of a substance to transfer heat via conduction and serves as a way of predicting the rate of energy loss by the material (Stroshine, 2001). The mean thermal conductivity of whole stillage was determined to be 0.67 W/(moC), while it was approximately 0.607 W/(moC) in thin stillage and 0.511 W/(moC) in syrup. The thermal conductivity of DDGS ranged from 0.06 to 0.08 W/(moC) (Rosentrater, 2006). The thermal conductivity value of DDGS is less than the experimental data collected from whole stillage, thin stillage, and syrup, which was due to the relative high moisture content of these three coproducts. It can be concluded that whole stillage, thin stillage, and syrup have a higher thermal conductivity than DDGS, which means that these coproducts have a higher heat-transfer rate via the conduction process.
Thermal diffusivity measures a substance’s ability to conduct heat relative to its ability to store heat (Stroshine, 2001). The average thermal diffusivities for both thin stillage and syrup were 0.14 mm2/s, while that for whole stillage was 0.13 mm2/s (Table 2).
The thermal diffusivity of DDGS ranged from 0.13 to 0.15 mm2/s (Rosentrater, 2006). The diffusivity value of DDGS was very close to the experimental data of whole stillage, thin stillage, and syrup because these three coproducts are the upstream components of DDGS. Value-added processing, such as lipid separation, often depends on a heating step prior to centrifugation; thermal properties are key to optimizing these types of processes.
Color
The initial color of the three coproducts can be found in Table 2. At the outset of the experiment (t = 0), color does show some variation between the three coproducts. The L* value (brightness to darkness) varied from 59.44 to 65.93, the a* value (redness to greenness) was −0.7 to 5.65, and the b* value (yellowness to blueness) varied from 41.81 to 42.63. When comparing the average color scale data for these three coproducts, whole stillage had the largest positive L* value, which indicated that it was the brightest. Thin stillage had the lowest negative a* value, which showed that it was initially the greenest. In addition, the largest positive b* value demonstrated that syrup was the most yellow. According to the DDGS values from a published study (Rosentrater, 2006), L* ranged from 43.48 to 48.8, a* was from 8.3 to 9.7, and b* ranged from 19.4 to 23.0. These results indicated that whole stillage, thin stillage, and syrup in this study were initially bright, greener, and more yellow, respectively, compared to the DDGS from the previous study. Color is typically an indirect, nondestructive indicator of manufacturing consistency, nutrient damage during processing, resulting nutrient digestibility, etc.
Separation due to Settling
Settling was used to separate the particle from the liquid. As time goes on, the interface between the liquid and solid changes from nonexistent at the beginning to having very distinct edges at the end.
The results were plotted with time to the ratio of top volume and bottom volume (Figure 3). Two replications were combined into a single regression line for each coproduct. A logarithmic model was fitted to each set of dates, except for syrup. No separation happened in syrup (Figure 3C). The R2 values of thin stillage and whole stillage were 0.98 and 0.89, respectively. Based on the R2 value, the regression equation was able to determine the ratio of the volume change during storage. Since the data were collected every hour during the first 7 h and then the results were only reported at time points of 24 h and 72 h, the data are more intensive in the first 7 h. For thin stillage and whole stillage (Figures 3A,B), the volume ratio of the top layer and bottom layer increased significantly in the first 7 h and then slowly increased. However, the ratio increased more dramatically in thin stillage, which means that the particle moved faster in thin stillage (Figure 3A).
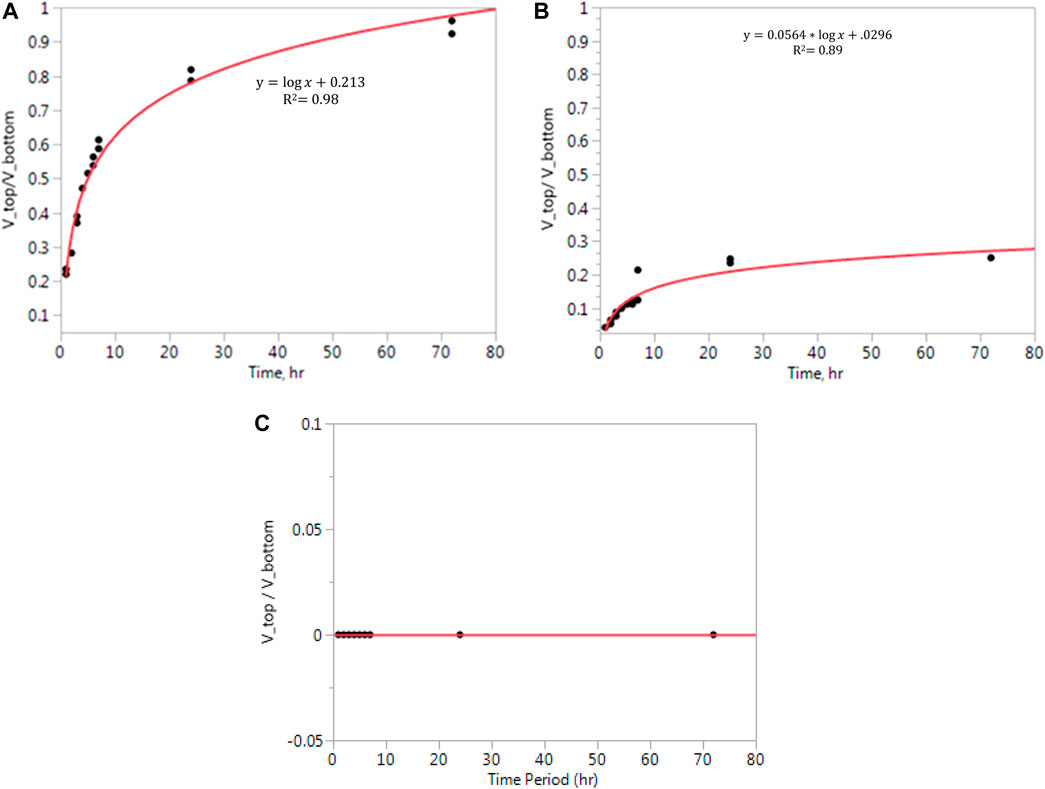
FIGURE 3. (A) Settling results of Vtop/Vbottom in stillage. (B) Settling results of Vtop/Vbottom in whole stillage. (C) Settling results of Vtop/Vbottom in the syrup sample.
The effect of settling is necessary to design material mixing, handling, and storage processes. Typically, a slurried coproduct needs to be re-homogenized after a period of time in storage due to the settling of the various constituents. In this study, sedimentation happened in whole stillage and thin stillage after 1 h of storage, which indicated that these coproducts need be re-homogenized after 1 h. To fully characterize the behavior of a coproduct that contains the solid and liquid over time, detailed shelf life and aging studies are needed to evaluate the mixing requirements needed to re-homogenize the coproduct at different ages to keep it fresh and maximize the shelf life. Condensed syrup, on the other hand, did not exhibit this rapid sedimentation, likely due to the particle sizes vis-à-vis Stoke’s law, which reduced the settling rate. These behaviors are important to understand, especially when these liquid coproduct streams are being viewed as potential streams for separating specific components for value-added uses (i.e., proteins, lipids, and fibers).
Physical and Biological Characterization of Samples Over Time
Moisture Content
Moisture content indicates the amount of water in the sample. Moisture content is related to the freshness and stability for the storage of the material. The moisture contents (w.b) of whole stillage, thin stillage, and syrup are summarized in Figure 4. The whole stillage was found to have a moisture content about 4% less than that of thin stillage at about 93% (w.b) after the first day incubation at three temperature treatments. Since thin stillage is the liquid fraction of whole stillage, it was expected to have the highest overall moisture content (97% in the wet basis). Syrup is the product from evaporation where much of the liquid is removed. Thus, the overall moisture content of syrup was about 65% (w.b). In this study, temperature and time treatments had significant effects (p < 0.05) on moisture contents of these three coproducts (Table 3), especially the effect of time treatments (p < 0.0001) (Table 3). As expected, the samples in the 32°C incubation had the lowest moisture at the end of day 10 (Figure 4) due to the highest temperature causing the greatest evaporation rate. High moisture contents generally have short shelf lives due to high susceptibility to microbial growth.
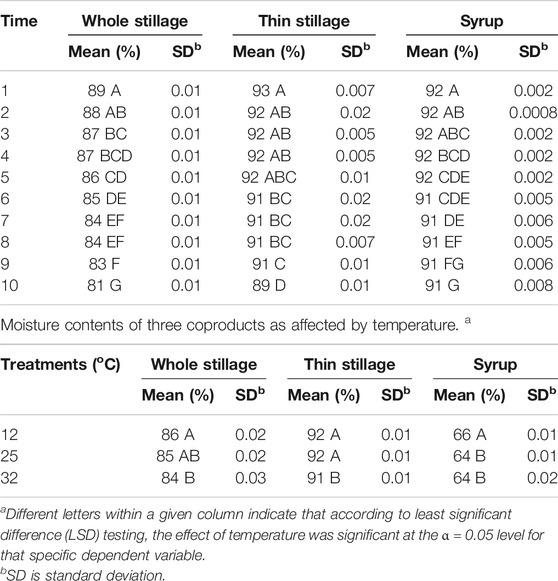
TABLE 3. Moisture contents of three coproducts over time. a
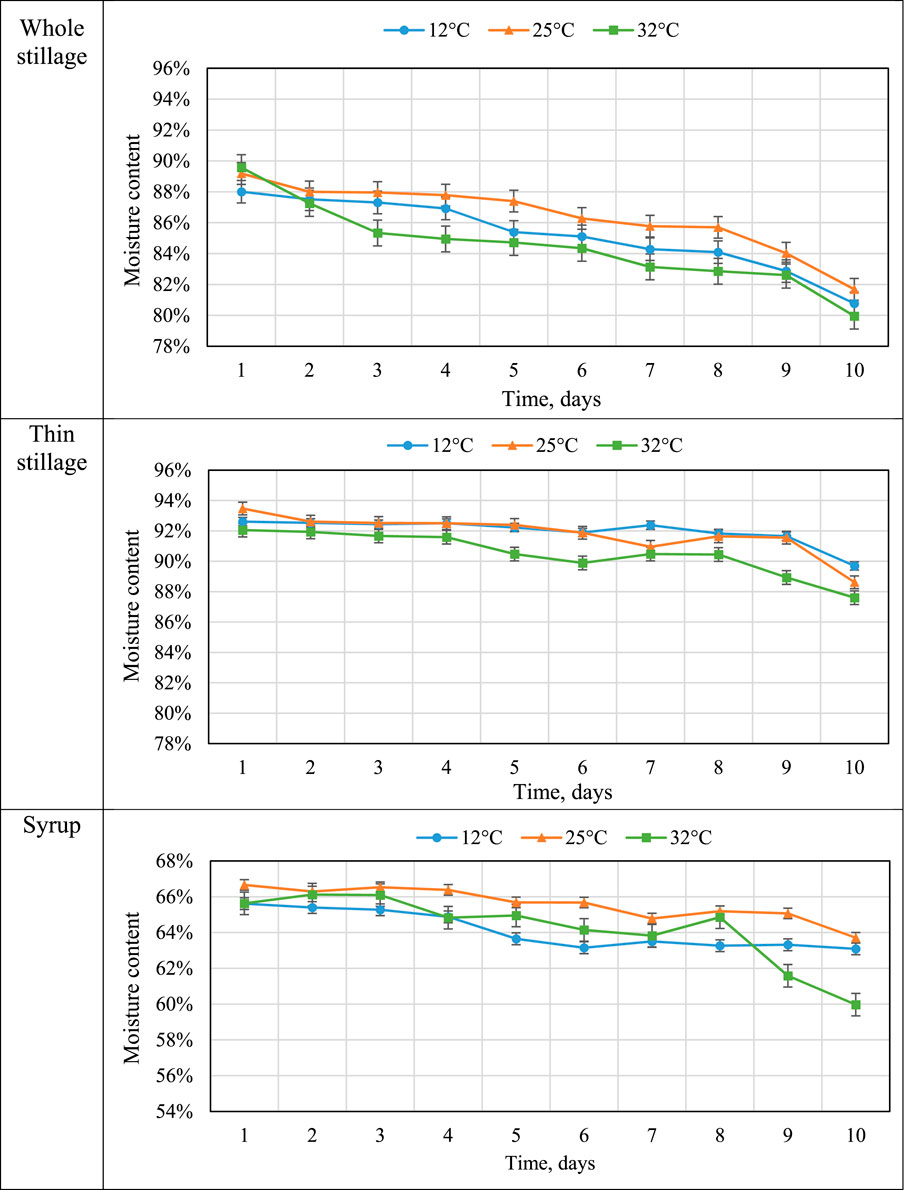
FIGURE 4. Average moisture content changes over time. Error bars denote 1 standard deviation.
Water Activity
Water activity measures the amount of “free” water available for use by microorganisms and chemical agents and is therefore a measure of a material’s susceptibility to spoilage. Thus, products with no free water (aw = 0.0) are not at risk for degeneration, while materials with free water (aw = 1.0) are at high risk for rapid spoilage (Rosentrater and Lehman, 2008; Lehman and Rosentrater, 2012). Figure 5 describes the mean values of water activity of the three coproducts changing over time. In general, the values of water activity in the three materials decreased over the 10-day experiment, but the values were still high. The “free” water in whole stillage and thin stillage ranged from 0.96 to 0.98 at the end of the experiment, while the value of water activity in syrup changed from 0.92 to around 0.9 (Figure 5). The results indicated that all the three coproducts were highly susceptible to rapid degradation. The samples incubated at 12 and 25°C had a lower water activity value, compared with the samples at 32°C, likely due to high temperature reducing the water content. Table 4 show that temperature and time treatments had effects on water activity of the coproducts; especially, the effects of time treatments were significant (p < 0.0001) (Table 4).
FIGURE 5. Mean water activity changing over time. Error bars denote 1 standard deviation.
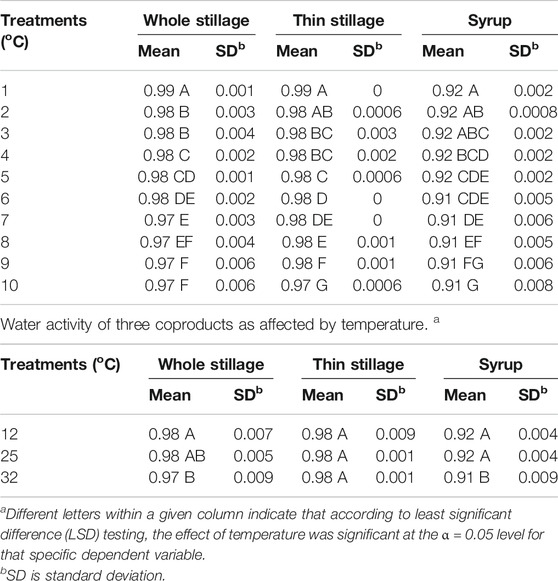
TABLE 4. Water activity of three coproducts over time. a
Mold Observation
Visible mold is an indicator of progressing spoilage that is easily assessed, and therefore, the development of molds on whole stillage, thin stillage, and syrup was measured by visual inspection and assignment of the numerical rating. Table 5 demonstrate that temperature and time treatments had significant effects (p < 0.05) on mold growth on whole stillage and thin stillage. Figure 6 show the mold development over time on whole stillage and thin stillage. When samples were held at the 32°C incubator, mold first appeared at day 5 on the surface of both whole stillage and thin stillage samples. For 25°C treatment, whole stillage grew mold at the fifth day, and the first mold was observed on thin stillage at day 6. Compared with the 32 and 25°C treatments, samples had a longer shelf life for the 12°C treatment, as expected. The appearance of mold in whole stillage and thin stillage was between 8 and 9 days. Surprisingly, no mold was found on the surface of syrup at any of the three temperature conditions during the 10-day experiment. This was likely due to high concentrations of sugars and other chemical constituents which could have led to decreased mold development vis-à-vis the other coproducts.
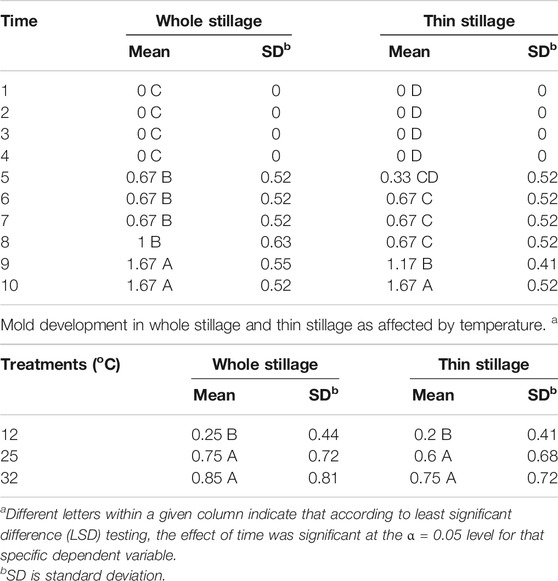
TABLE 5. Mold development in whole stillage and thin stillage over time. a
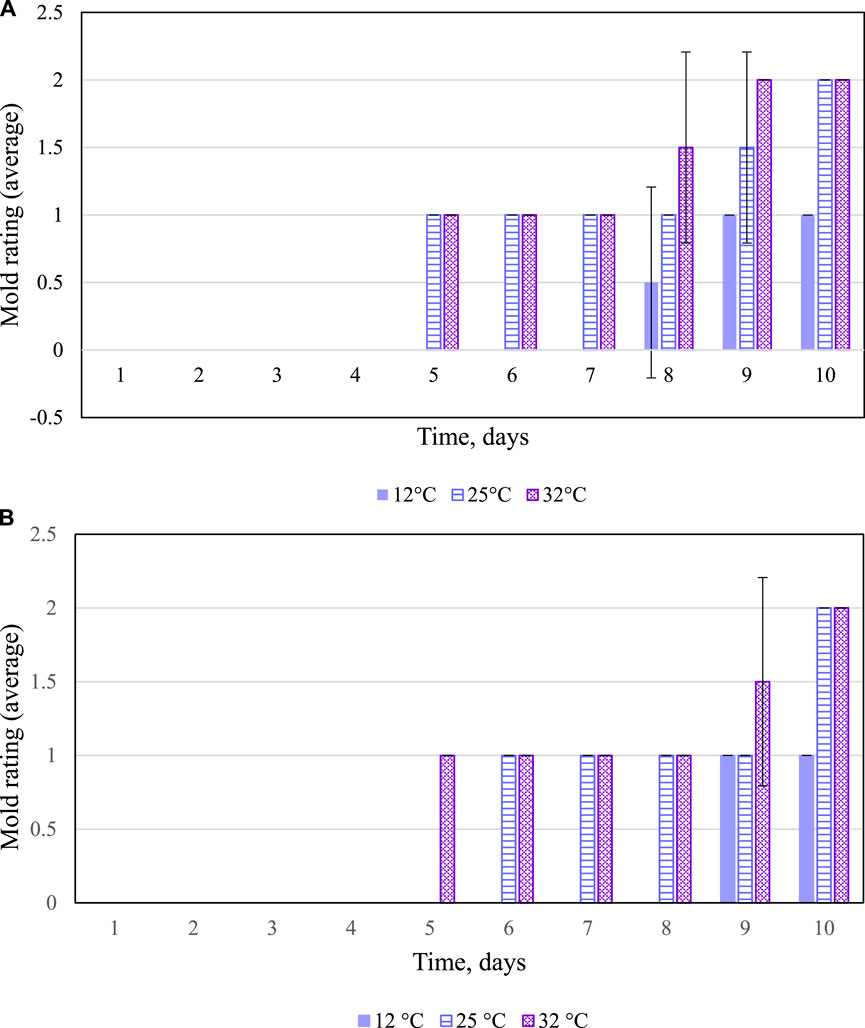
FIGURE 6. (A) Mold development in whole stillage. Error bars denote 1 standard deviation. (B) Mold development in thin stillage. Error bars denote 1 standard deviation.
Color
The presence of the mold on the surface causes visual color changes in the visual observation of the samples. In a previous study, the Hunter L*, a*, and b* color parameters were not as straightforward as microbial growth and activity in the distiller’s wet grains (Rosentrater and Lehman, 2008; Lehman and Rosentrater, 2012). The color values of the three coproducts are summarized in Figures 7–9. In the current study, color (Hunter L*, a*, and b*) appeared to change over time, but these changes did not directly correspond with the mold growth.
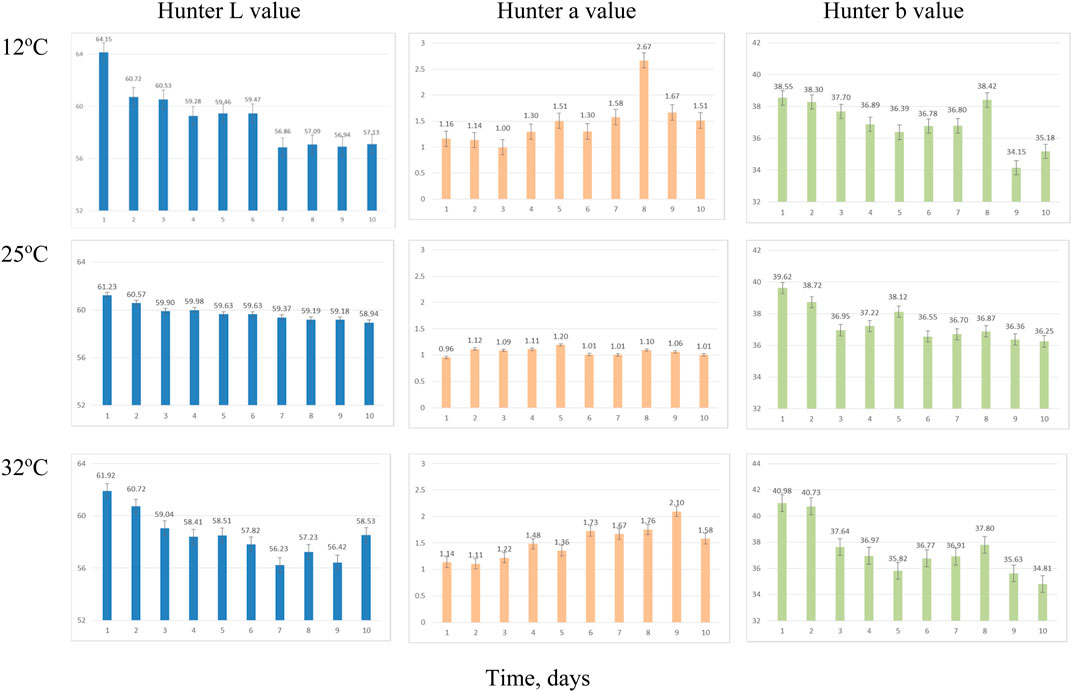
FIGURE 7. Average Hunter color values change over time for whole stillage sampling due to incubation temperatures. Error bars denote 1 standard deviation.
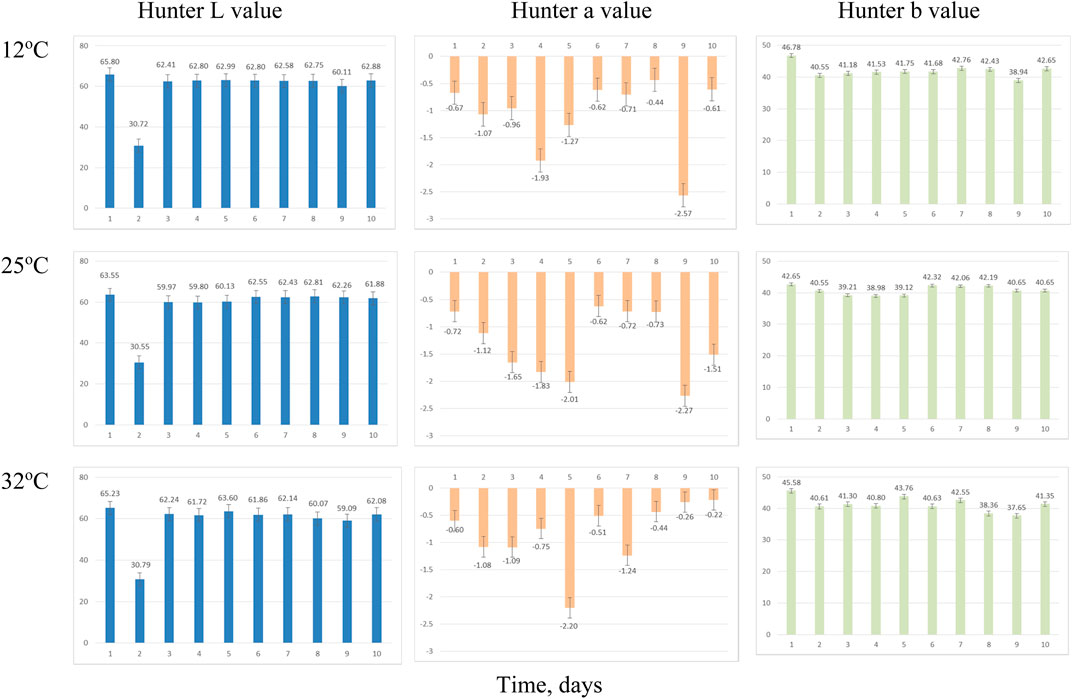
FIGURE 8. Average Hunter color values change over time for thin stillage sampling due to incubation temperatures. Error bars denote 1 standard deviation.
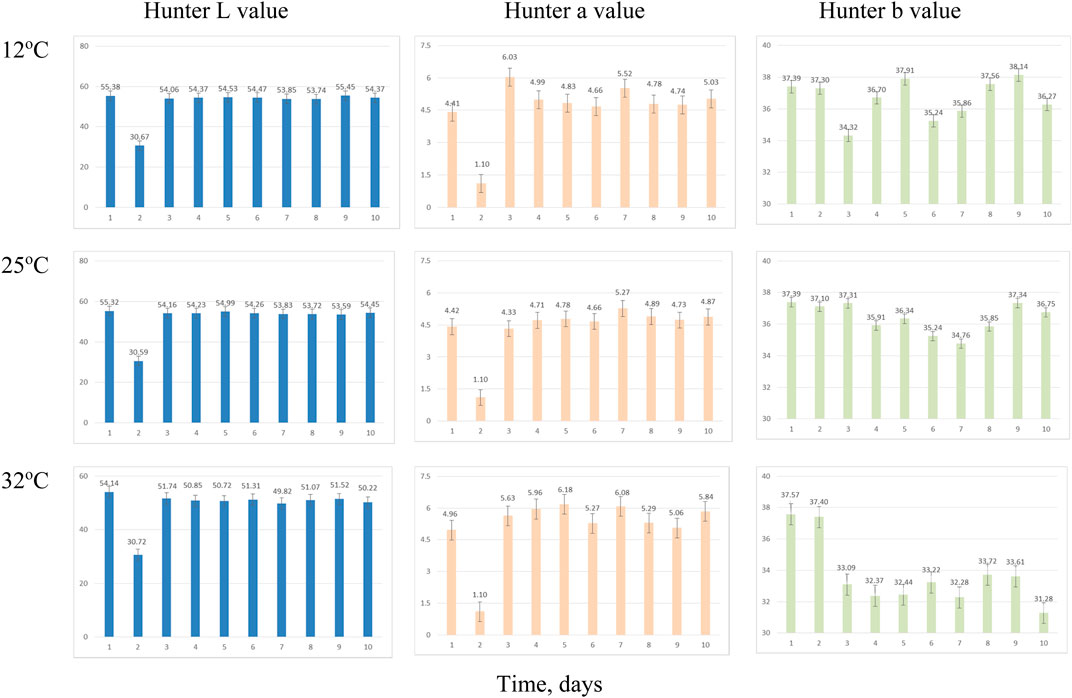
FIGURE 9. Average Hunter color values over time for syrup sampling due to incubation temperatures. Error bars denote 1 standard deviation.
Hunter L* decreased as the retention time increased in all three coproducts at any of the three temperature treatments. Day 2’s data for thin stillage and syrup appear different due to equipment error. There was a significant (p < 0.001) time effect on the Hunter L* value, which changed over time on these three coproducts (Table 6). However, no observable correlation between temperature/time and the L* value was detected in the three coproducts. A previous study mentioned that the Hunter L* did not predict any of the microbial stability parameters very well on the distiller’s wet grains (Rosentrater and Lehman, 2008; Lehman and Rosentrater, 2012). Similarly, storage time had a significant effect (p < 0.05) on Hunter a* and b* values (Table 6). However, for the most part, temperature was not found to be significant on Hunter L*, a*, and b* values (Table 7), except the case of the Hunter a* value in whole stillage samples (Table 7).
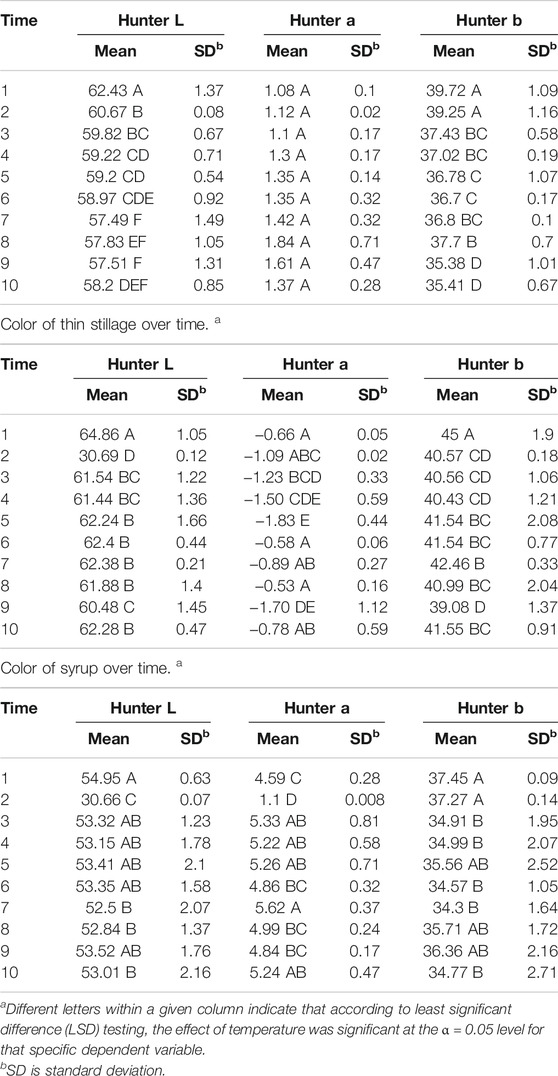
TABLE 6. Color of whole stillage over time. a
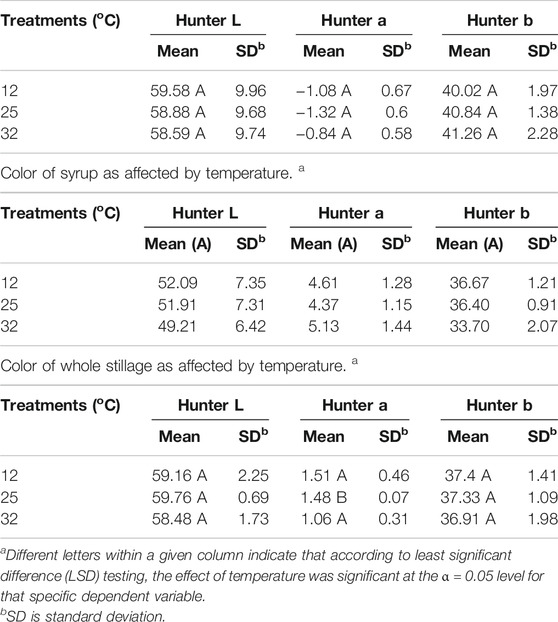
TABLE 7. Color of thin stillage as affected by temperature. a
The changes of Hunter a* and b* values were related to the some of the first appearance of mold on samples. In whole stillage (Figure 7), the value of Hunter a* and b* suddenly changed at day 8 when the ambient temperature was 12°C (Figure 7). A similar situation was found in thin stillage samples in the 12°C incubator. Even though Hunter a* and b* values had some noticeable changes with the first appearance of mold on the whole stillage and thin stillage at 12°C temperature treatment (Figure 7), there is no evidence showing a linear relationship existing between Hunter a* and b* and mold growth.
Biological Characterization of Samples Over Time
Before the CO2 kit results can be used by the grain industry to define degradation levels, the relationship between a sample’s kit color readings and the CO2 concentration in the test kit jar must be understood.
The following equation is used to analyze the conversion of color readings (0.5–5) to the percent of CO2 in the test kit jar (Stroshine, 2000):
CO2 production is an indicator of microbial activity. In tests on samples of whole stillage, thin stillage, and syrup in this study, the results of tests on the coproducts show that the color numbers ranged from 1.0 to 5.0 when paddles were inserted during the 5-day experiment. Obviously, a sample with a color number of 5.0 is highly susceptible to mold growth, whereas a sample with a color number of 1.0 has a low susceptibility. The CO2 concentration corresponding to color number is shown in Table 8.
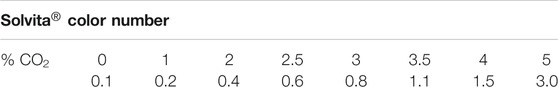
TABLE 8. CO2 concentration corresponding to Solvita® color numbers.
Figure 10 summarize storage time versus percent CO2 for whole stillage, thin stillage, and syrup incubated at 25 and 35°C, respectively. The effect of temperature and time treatment on CO2 production was significant (p < 0.05). As expected, CO2 production was the greatest at 35°C and moderate at 25°C for the three coproducts. An exponential model (this was chosen based on prior understanding of microbial growth kinetics) was fitted to each set of data (Figures 10). R2 ranged from 0.58 to 0.95, which showed that most models were of fairly good fit. Because the equipment cannot capture the results exceeding the maximum measurable CO2 concentration, the CO2 concentration did not change once it hit the maximum measurable level. Ultimately, this information can be used to help develop the prediction of shelf life for these products. To date, this has not yet been pursued. Indeed, CO2 evolution is key to predicting shelf life as this is a result of microbial growth; tying this to observable mold growth, color changes, and ultimately actual microbial species and numbers present could lead to a powerful tool for both ethanol plants and livestock producers.
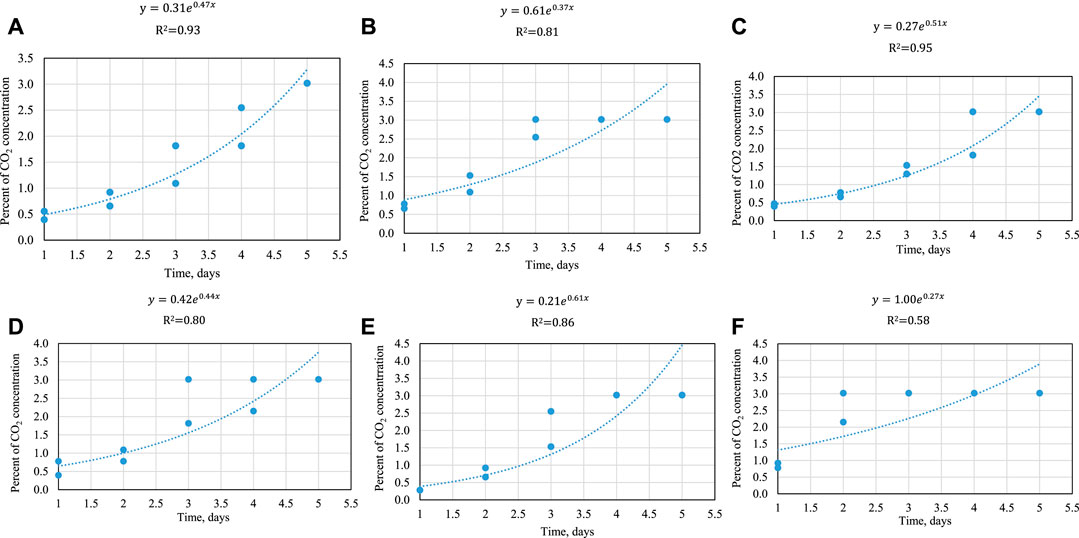
FIGURE 10. (A) % CO2 evolution over time in whole stillage at 25°C. Each point represents one reading. (B) % CO2 evolution over time in whole stillage at 35°C. Each point represents one reading. (C) % CO2 evolution over time in thin stillage at 25°C. Each point represents one reading. (D) % CO2 evolution over time in thin stillage at 35°C. Each point represents one reading. (E) % CO2 evolution over time in syrup at 25°C. Each point represents one reading. (F) % CO2 evolution over time in syrup at 35°C. Each point represents one reading.
Conclusion
DDGS is primarily sold as a feed ingredient for livestock due to its high proportion of nutritional components and low moisture content. However, drying DDGS requires energy and time and costs money; as a result, DDGS is more expensive than other distiller products. Whole stillage, thin stillage, and CDSs (syrup) may be alternative materials to feed livestock. This study examined various physical and biological properties, including moisture content, water activity, thermal properties, color, mold growth, and CO2 production, to provide baseline property data.
The initial thin stillage and whole stillage samples had high average moisture contents of 92% (w.b.) and 87% (w.b.), respectively, and an average water activity of 0.99; the high water content marked these samples as easily susceptible to rapid spoilage. Time had significant effects (p < 0.0001) on the values of moisture content and water activity in these three coproducts. Both thin stillage and whole stillage samples showed the first mold growth after 5 days’ incubation at 32°C because the high temperature increased microorganism activities. Thin stillage had the greatest separation rate due to settling.
Syrup had an average initial moisture content of 62% and a water activity of 0.92. No mold growth and settling separation happened in syrup samples. There was no evidence showing linear relationships between Hunter L*, a* and b*, and mold growth. The Solvita® testing showed that high-temperature treatment caused high CO2 production in all samples. The exponential models described the relationship between storage time (from 0 to 5 days at 25 and 35°C) and CO2 concentration for the coproducts.
This study examined physical and biological properties of whole stillage, thin stillage, and syrup to provide information on material handling, processing, and potential valuable component changes over time. Thus, the study is just a first step to explore opportunities for utilizing valuable components from these coproducts. Follow-up studies should work on separation processes to concentrate the valuable components of these coproducts. Exploring the potential value of ethanol coproducts could maintain and improve the profitability of the ethanol industry.
Data Availability Statement
The raw data supporting the conclusions of this article will be made available by the authors, without undue reservation.
Author Contributions
KR conceived the study; LY conducted the laboratory work, conducted the statistics, and drafted the paper; and KR conducted additional statistics and edited the paper.
Conflict of Interest
The authors declare that the research was conducted in the absence of any commercial or financial relationships that could be construed as a potential conflict of interest.
Publisher’s Note
All claims expressed in this article are solely those of the authors and do not necessarily represent those of their affiliated organizations, or those of the publisher, the editors, and the reviewers. Any product that may be evaluated in this article, or claim that may be made by its manufacturer, is not guaranteed or endorsed by the publisher.
References
Beauchat, L. R. (1981). Microbial Stability as Affected by Water Activity. Cereal Foods World 26 (7), 345–349.
Bhadra, R., Muthukumarappan, K., and Rosentrater, K. A. (2009). Flowability Properties of Commercial Distillers Dried Grains with Solubles (DDGS). Cereal Chem. 86 (2), 170–180.
Byun, J. (2008). Ultilization and Charaterization of Corn-Based By-Products from the Ethnaol Production Facilities. Lincoln, NE: University of Nebraska, Department of Chemical and Biomolecular Engineering. PhD Thesis.
Chitrakar, S., Bern, C. J., and Shrestha, D. S. (2006). Quantifying Corn Deterioration Due to Fungal Growth by Use of Co2-Sensitive Gel. Appl. Eng. Agric. 22 (1), 81–86. doi:10.13031/2013.20174
DairyOne (2021). Feed Composition Library. Available online: https://dairyone.com/services/forage-laboratory-services/feed-composition-library/. (Accessed July 29, 2021).
Dooley, F., Cox, M., and Cox, L. (2008). Distillers Grain Handbook: A Guide for Indiana Producers to Using DDGS for Animal Feed. West Lafayette, Indiana: Report for Indiana Corn Marketing Council.
Gordon, K. (2008). Storing Distillers Grains. Retrieved from: http://beefmagazine.com/markets/feed/0501-storing-wet-distillers-grains. (Accessed May 27, 2016).
Hunter Associates Laboratory (2002). Universal Software User’s Manual (Version 2.5). Reston, VA: Hunter Associates Laboratory.
K. A. Rosentrater, K. (2006). Some Physical Properties of Distillers Dried Grains with Solubles (Ddgs). Food Process Eng. Inst. Division ASABE 22 (4), 589–595. doi:10.13031/2013.21212
Kim, Y., Mosier, N., Hendrickson, R., Ezeji, T., Blaschek, H., Dien, B., et al. (2007). Composition of Corn Dry-Grind Ethanol By-Products: DDGS, Wet Cake, and Thin Stillage. Bioresource Tech. 99, 5165–5176.
Lehman, M., and Rosentrater, K. (2012). Aerobic Stability of Distillers Wet Grains as Influenced by Temperature. Retrieved from: http://onlinelibrary.wiley.com/doi/10.1002/jsfa.5803/full. (Accessed May 27, 2016).doi:10.1002/jsfa.5803
L. Wang, L., R. A. Flores, R., and L. A. Johnson, L. (1997). Processing Feed Ingredients from Blends of Soybean Meal, Whole Blood, and Red Blood Cells. Trans. ASABE. 40 (3), 691–697. doi:10.13031/2013.21288
Moog, D. P. J., Stroshine, R. L., and Seitz, L. M. (2008). Relationship of Shelled Corn Fungal Susceptibility to Carbon Dioxide Evolution and Kernel Attributes. Cereal Chem. 85 (1), 19–26. doi:10.1094/CCHEM-85-1-0019
RFA (2015). Going Global: 2015 Ethanol Industry Outlook. Washington, D.C.: Renewable Fuels Association. Available at: http://www.ethanolrfa.org/wp-content/uploads/2015/09/c5088b8e8e6b427bb3_cwm626ws2.pdf. (Accessed May 27, 2016).
Rosentrater, K., and Lehman, M. (2008). Predicting Stability of Distillers Wet Grains with Color Analysis. Retrieved from: http://link.springer.com/article/10.1007%2Fs11947-008-0090-x#page-1. (Accessed May 27, 2016).
Rosentrater, K. A., and Muthukumarappan, K. (2006). Corn Ethanol Coproducts: Generation, Properties, and Future Prospects. Int. Sugar J. 108 (1295), 648–657.
Stroshine, R. (2000). Evaluation of Woods End Test Kits for Determine the Storability of Shelled Corn. West Lafayette, Indiana: Purdue University.
Stroshine, R. (2001). Physical Properties of Agricultural Materials and Food Products. West Lafayette: Purdue University.
Tjardes, K., and Wright, C. (2002). Feeding Corn Distiller’s Coproducts to Beef Cattle. Extension Extra 2036. Brookings, SD: South Dakota State University.
Keywords: biofuels, coproducts, properties, stillage, storage
Citation: Rosentrater KA and Yang L (2021) Toward an Understanding of Physical and Biological Properties of Corn-Based Whole Stillage, Thin Stillage, and Condensed Distillers Solubles and Changes Thereof During Storage. Front. Energy Res. 9:722950. doi: 10.3389/fenrg.2021.722950
Received: 09 June 2021; Accepted: 12 August 2021;
Published: 08 October 2021.
Edited by:
Jalel Labidi, University of the Basque Country, SpainReviewed by:
Zhaoxian Xu, Nanjing University of Science and Technology, ChinaVivekanand Vivekanand, Malaviya National Institute of Technology, India
Copyright © 2021 Rosentrater and Yang. This is an open-access article distributed under the terms of the Creative Commons Attribution License (CC BY). The use, distribution or reproduction in other forums is permitted, provided the original author(s) and the copyright owner(s) are credited and that the original publication in this journal is cited, in accordance with accepted academic practice. No use, distribution or reproduction is permitted which does not comply with these terms.
*Correspondence: Kurt A. Rosentrater, S2Fyb3NlbnRAaWFzdGF0ZS5lZHU=