 Soo Hyun Shin1†
 Hee Dong Chae1,2†
 Arya Suprana1,3†
 Saeed Jerban1
 Eric Y. Chang1,4
 Lingyan Shi3
 Robert L. Sah3Jeremy H. Pettus5Gina N. Woods5
 Jiang Du1,3,4*
- 1Department of Radiology, University of California, San Diego, San Diego, CA, United States
- 2Department of Radiology, Seoul National University Hospital, Seoul, Republic of Korea
- 3Department of Bioengineering, University of California, San Diego, San Diego, CA, United States
- 4Radiology Service, Veterans Affairs San Diego Healthcare System, San Diego, CA, United States
- 5Department of Medicine, University of California, San Diego, San Diego, CA, United States
Osteoporosis (OP) is a metabolic bone disease that affects more than 10 million people in the USA and leads to over two million fractures every year. The disease results in serious long-term disability and death in a large number of patients. Bone mineral density (BMD) measurement is the current standard in assessing fracture risk; however, the majority of fractures cannot be explained by BMD alone. Bone is a composite material of mineral, organic matrix, and water. While bone mineral provides stiffness and strength, collagen provides ductility and the ability to absorb energy before fracturing, and water provides viscoelasticity and poroelasticity. These bone components are arranged in a complex hierarchical structure. Both material composition and physical structure contribute to the unique strength of bone. The contribution of mineral to bone’s mechanical properties has dominated scientific thinking for decades, partly because collagen and water are inaccessible using X-ray based techniques. Accurate evaluation of bone requires information about its components (mineral, collagen, water) and structure (cortical porosity, trabecular microstructure), which are all important in maintaining the mechanical integrity of bone. Magnetic resonance imaging (MRI) is routinely used to diagnose soft tissue diseases, but bone is “invisible” with clinical MRI due to its short transverse relaxation time. This review article discusses using ultrashort echo time (UTE) sequences to evaluate bone composition and structure. Both morphological and quantitative UTE MRI techniques are introduced. Their applications in osteoporosis are also briefly discussed. These UTE-MRI advancements hold great potential for improving the diagnosis and management of osteoporosis and other metabolic bone diseases by providing a more comprehensive assessment of bone quantity and quality.
Introduction
Osteoporosis (OP) is a progressive bone disease that is characterized by low bone mass and structural deterioration (1). Fractures are among the most dramatic sequelae. OP affects more than 10 million people in the USA and causes more than two million fractures, with an annual cost estimated at about $19 billion (2). The need for focused preventive strategies has become a major public health priority.
The current standard technique for assessing bone fracture is dual-energy X-ray absorptiometry (DXA), which can only provide information on bone mineral density (BMD) (3). However, the majority of fractures cannot be explained by BMD alone. Bone is a composite material consisting of, by volume, mineral (~43%), organic matrix (~35%), and water (~22%) (4, 5). While bone mineral provides stiffness and strength (6), collagen provides ductility and the ability to absorb energy before fracturing (7), and water contributes to viscoelasticity and poroelasticity (8). These bone components are arranged in a complex hierarchical structure (9). Both material composition and physical structure contribute to the unique strength of bone. The contribution of mineral to bone’s mechanical properties has dominated scientific thinking; however, accurate evaluation of bone requires information about its components (mineral, collagen, water) and structure (cortical porosity, trabecular microstructure), which are all important in maintaining the mechanical integrity of bone (10).
Unfortunately, no single modality can evaluate all bone components and structures. DXA can only measure areal BMD without information about bone collagen, water, and bone microstructure. Computed tomography (CT) can measure volumetric BMD and capture bone structure without information about bone collagen and water (11). Conventional CT has a spatial resolution that is too low to evaluate cortical porosity. High-resolution peripheral quantitative CT (HR-pQCT) can assess bone porosity but cannot resolve smaller pores (e.g., pores with diameters less than 83 µm) (12, 13). Micro CT (µCT) is the reference standard for evaluating cortical porosity but cannot be used for in vivo applications (14). Magnetic resonance imaging (MRI) is routinely used to diagnose soft tissue diseases, but bone is “invisible” with clinical MRI due to its short transverse relaxation time (15, 16). This review paper aims to summarize the recent developments in ultrashort echo time (UTE) MRI techniques for direct imaging of bone.
Materials and methods
This narrative review was conducted to synthesize the most relevant advancements and applications of UTE MRI, particularly focusing on the authors’ contributions and other key studies in the field. The UTE-type sequences include two-dimensional (2D) and 3D UTE (15–28) zero echo time (ZTE) (25–36), pointwise encoding time reduction with radial acquisition (PETRA) (37–39), Cartesian variable TE (vTE) (40), water- and fat-suppressed proton projection MRI (WASPI) (41), sweep imaging with Fourier transformation (SWIFT) (42), hybrid acquisition-weighted stack of spirals (AWSOS) (43), ramped hybrid encoding (RHE) (44), and Looping Star (45). A simple search on Pubmed shows more than 600 papers on direct imaging of bone using the various UTE-type sequences. It is difficult to summarize all the published articles in this review. The selection of articles was primarily guided by the authors’ expertise and their understanding of the pivotal developments in UTE MRI research.
In conventional MRI, bone produces near zero signal, leading most clinicians to rely on plain radiography or CT as the primary modality for bone evaluation. The lack of detectable signals can be mainly attributed to the bone’s short mean apparent transverse relaxation time (T2) or apparent transverse relaxation time (T2*) components. T2 or T2* relaxation time refers to the time constant that describes the rate at which excited protons lose phase coherence due to interactions with surrounding tissues in MRI, with short T2* values indicating a rapid decay of transverse magnetization. Long T2* tissues retain a detectable signal level at the time of the measurement of the MR signal, allowing them to remain visible in conventional pulse sequences. In contrast, short T2* tissues such as bone, tendons, ligaments, and menisci lose most of their signal before spatial encoding, resulting in undetectable signals during signal acquisition, making these tissues appear dark or “invisible” on conventional MRI scans.
For simplicity, T2* values can be categorized into five groups: <0.01 ms (supershort), 0.01–1 ms (ultrashort), 1–10 ms (short), 10–100 ms (intermediate), and 100–4000 ms (long) (16). Echo time (TE) is the interval between the delivery of the RF pulse and the measurement of the MR signal. It determines the time the system waits before measuring the signal. A general rule is that the effective TE should match the T2* of the tissue for optimal detectability. Recent advances in hardware have enabled gradient-recalled echo (GRE) sequences with much reduced TEs to capture signals from short T2 tissues. However, conventional sequences, such as fast spin echo (FSE) and GRE, cannot produce echo times shorter than 1 ms on clinical MRI systems. Therefore, tissues with ultrashort T2 values, such as bone, require specialized techniques for effective signal detection.
Recently, a group of UTE-type sequences, including 2D and 3D UTE, ZTE, PETRA, vTE, WASPI, SWIFT, AWSOS, RHE, and Looping Star sequences, with nominal TEs of 0.1 ms or less have been developed to directly image short-T2 tissues (15–45). While a short TE is essential for imaging bone, it alone is insufficient due to the low proton density in bone (i.e., ~22% water by volume in normal bone). Effective suppression of long-T2 signals is crucial for achieving high-contrast images of bone. Quantitative UTE imaging can provide valuable insights into bone structure and components. In the next section, we will review technical developments in morphological and quantitative UTE imaging of bone. Their applications in osteoporosis will also be briefly discussed.
Results
Part I: technical developments in morphological UTE MRI
With the UTE technique, bone signal with an ultrashort transverse relaxation time can be captured. However, UTE MRI is primarily T1-weighted with negative contrast between bone and neighboring musculoskeletal tissues, such as muscle and marrow fat, which have far higher proton densities than that of bone. A key issue for high contrast morphological imaging of bone is the efficient suppression of long T2 signals from surrounding muscle and marrow fat (46). Different contrast mechanisms have been developed for this purpose.
UTE with echo subtraction
One basic approach to enhancing contrast in UTE imaging is subtracting two images acquired at distinct echo times (TEs). In the dual-echo UTE imaging technique with echo subtraction, bone contrast is acquired by subtracting a second echo image from a first echo image which is equivalent to T2 bandpass filtering (19). Signals from long T2 tissues experience minimal decay by the time of the second echo, while the signal from bone undergoes significant decay by the time of the second echo. As a result, long T2 tissues show a high signal in the second echo, while bone shows a signal void. Subtraction of the second echo image from the first echo image leads to suppression of long T2 signals, leaving bone signal minimally unaffected, creating high contrast for cortical bone. Rescaled subtraction (46), where the first UTE free induction decay (FID) image is scaled down prior to subtraction to lower signal from long-T2 tissues in the first compared to the second echo, works more efficiently in creating high positive contrast for short-T2 species, especially cortical bone, which has a much lower mobile proton density than surrounding muscle or fat. Figure 1 shows an example of 3D dual-echo UTE imaging with rescaled subtraction applied to the tibia of a healthy volunteer. Conventional 3D UTE imaging provides a relatively high signal but negative contrast for the tibia (Figure 1A). Regular echo subtraction presents a positive contrast between bone and muscle, but a negative contrast between cortical bone and fat, as fat also has a short T2* (Figure 1C). The contrast between bone and fat/muscle increases using the rescaled subtraction technique (Figures 1D–F). However, subtraction techniques are sensitive to patient motion, which can cause misalignment between the source images and result in artifacts.
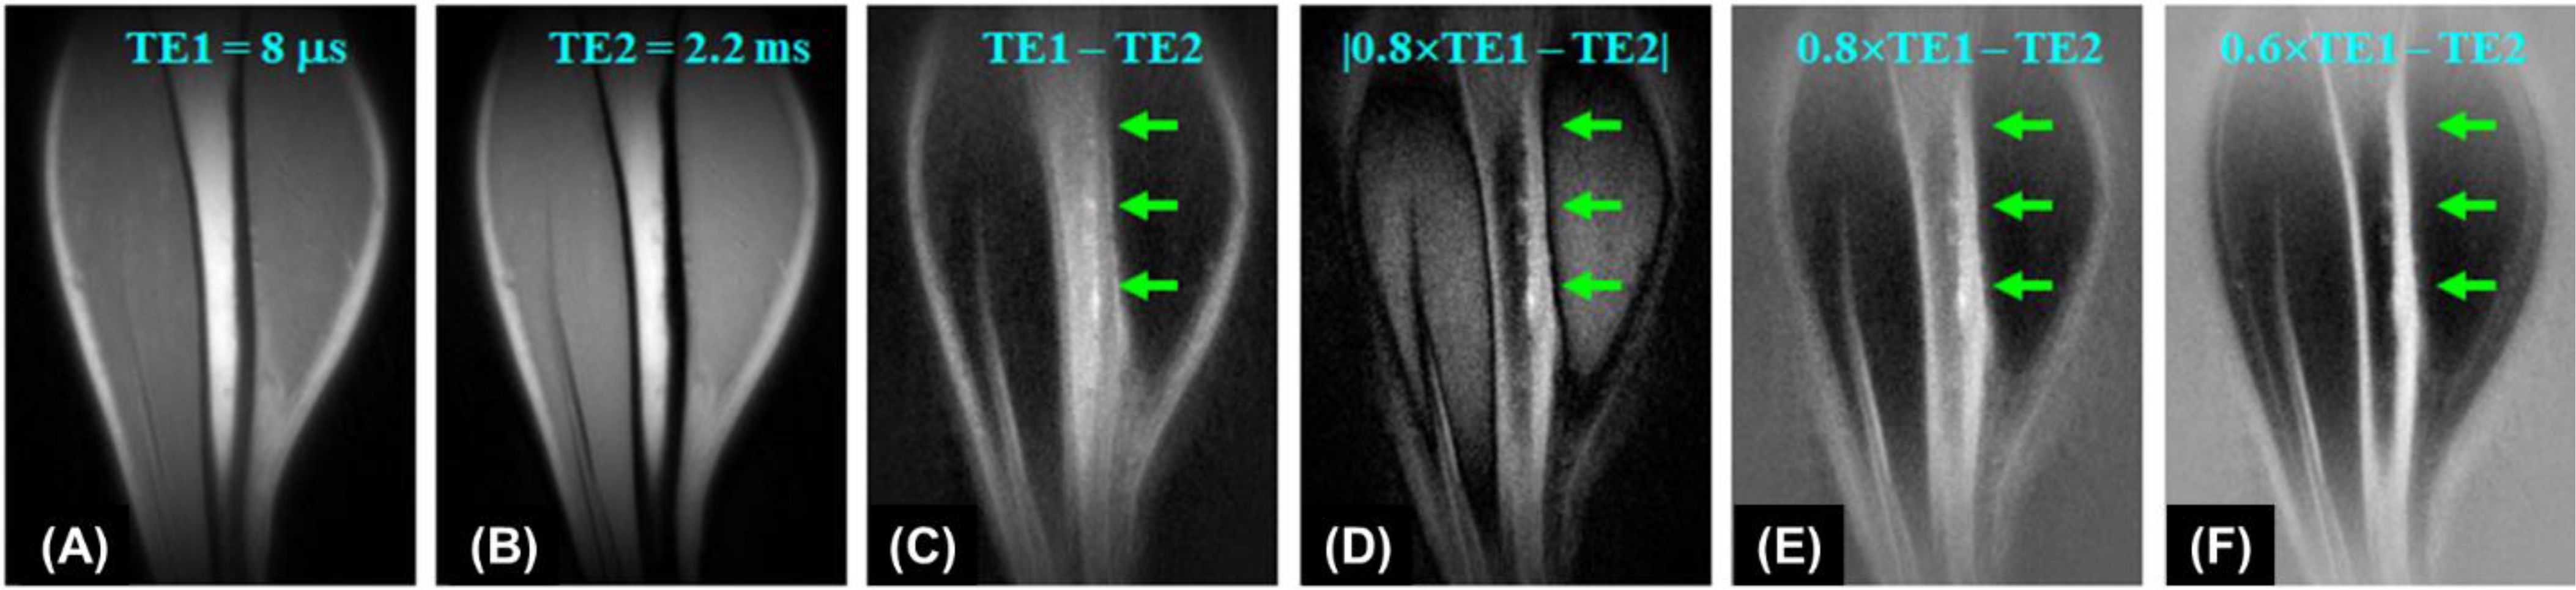
Figure 1. 3D UTE imaging of the tibia of a volunteer with dual TEs of 8 µs (A) and 2.2 ms (B). Subtraction of the second echo (TE = 2.2 ms) from the first one (TE = 8 µs) shows limited contrast for cortical bone due to a high signal from marrow fat (C). Higher bone contrast is achieved by scaling down the first echo UTE image by a factor of 0.8 and using absolute pixel intensity in the subtraction image (D). Bone contrast can be further enhanced by allowing negative signal intensity in long-T2 tissues (E, F). From Ref. (46), with permission.
UTE with long T2 saturation
Preparation pulses can be employed to selectively suppress signals from long T2 components, improving contrast by allowing better visualization of short T2 tissues (47–49). In UTE imaging with long T2 saturation, saturation pulses are used to suppress the signals from long T2 tissues, such as muscle and bone marrow fat, which typically produce higher signals than bone. For example, a 90° pulse with a relatively long duration and a low amplitude can flip the longitudinal magnetization of long T2 tissues into the transverse plane, where a large spoiling gradient can subsequently dephase the transverse magnetization (48). In comparison, bone magnetization is barely excited by this long saturation pulse as the decay rate of bone exceeds the excitation rate. Therefore, a long 90° pulse can be used with a large spoiling gradient to suppress long T2 tissues, leaving bone to be subsequently detected by UTE data acquisition. T2 selective RF excitation (TELEX) can be used to increase bone contrast (47). Dual-band long-T2 suppression pulses further improve the suppression of signals from muscle and fat (49). However, residual signals from muscle and marrow fat due to B1 and B0 inhomogeneities may still compromise bone contrast.
UTE with off-resonance saturation
Off-resonance saturation with subtraction can generate contrast for short T2 components by utilizing the broader absorption line shape of short T2 tissues, such as bone, compared to long T2 tissues like muscle or fat, making them more sensitive to off-resonance RF radiation (50). UTE imaging with off-resonance saturation contrast (UTE-OSC) employs a high-power saturation pulse placed a few kHz off the water peak to preferentially saturate signals from bone, leaving long T2 muscle and fat signals largely unaffected (50). Subtraction of UTE images with off-resonance saturation from basic UTE images can effectively suppress signals from muscle and fat, creating high bone contrast.
UTE with adiabatic inversion
One limitation of saturation techniques that utilize hard RF pulses is their sensitivity to B0 and B1 inhomogeneities, making them less robust compared to adiabatic inversion (18). The adiabatic inversion recovery UTE (IR-UTE) contrast mechanism employs a long adiabatic inversion pulse to invert the longitudinal magnetizations of long-T2 water (e.g., muscle) and long-T2 fat (18, 21, 24, 51). The duration of the adiabatic inversion pulse is much longer than bone T2* (18). As a result, the longitudinal magnetizations of muscle and marrow fat are fully inverted, while the bone magnetization is not inverted but largely saturated by the long adiabatic inversion pulse (51). The UTE data acquisition starts at an inversion time (TI) adjusted so that the inverted long T2 magnetizations approach the null points, leaving the uninverted bone magnetization being selectively detected by UTE data acquisition. The adiabatic inversion pulse has a relatively broad spectral bandwidth, thereby insensitive to B1 and B0 inhomogeneities. The IR-UTE technique allows uniform inversion of long T2 magnetizations, providing robust high contrast imaging of bone (18, 21). Figure 2 shows representative IR-UTE images of cortical bone in the forearm, which is depicted with excellent image contrast but invisible with conventional clinical FSE sequences.
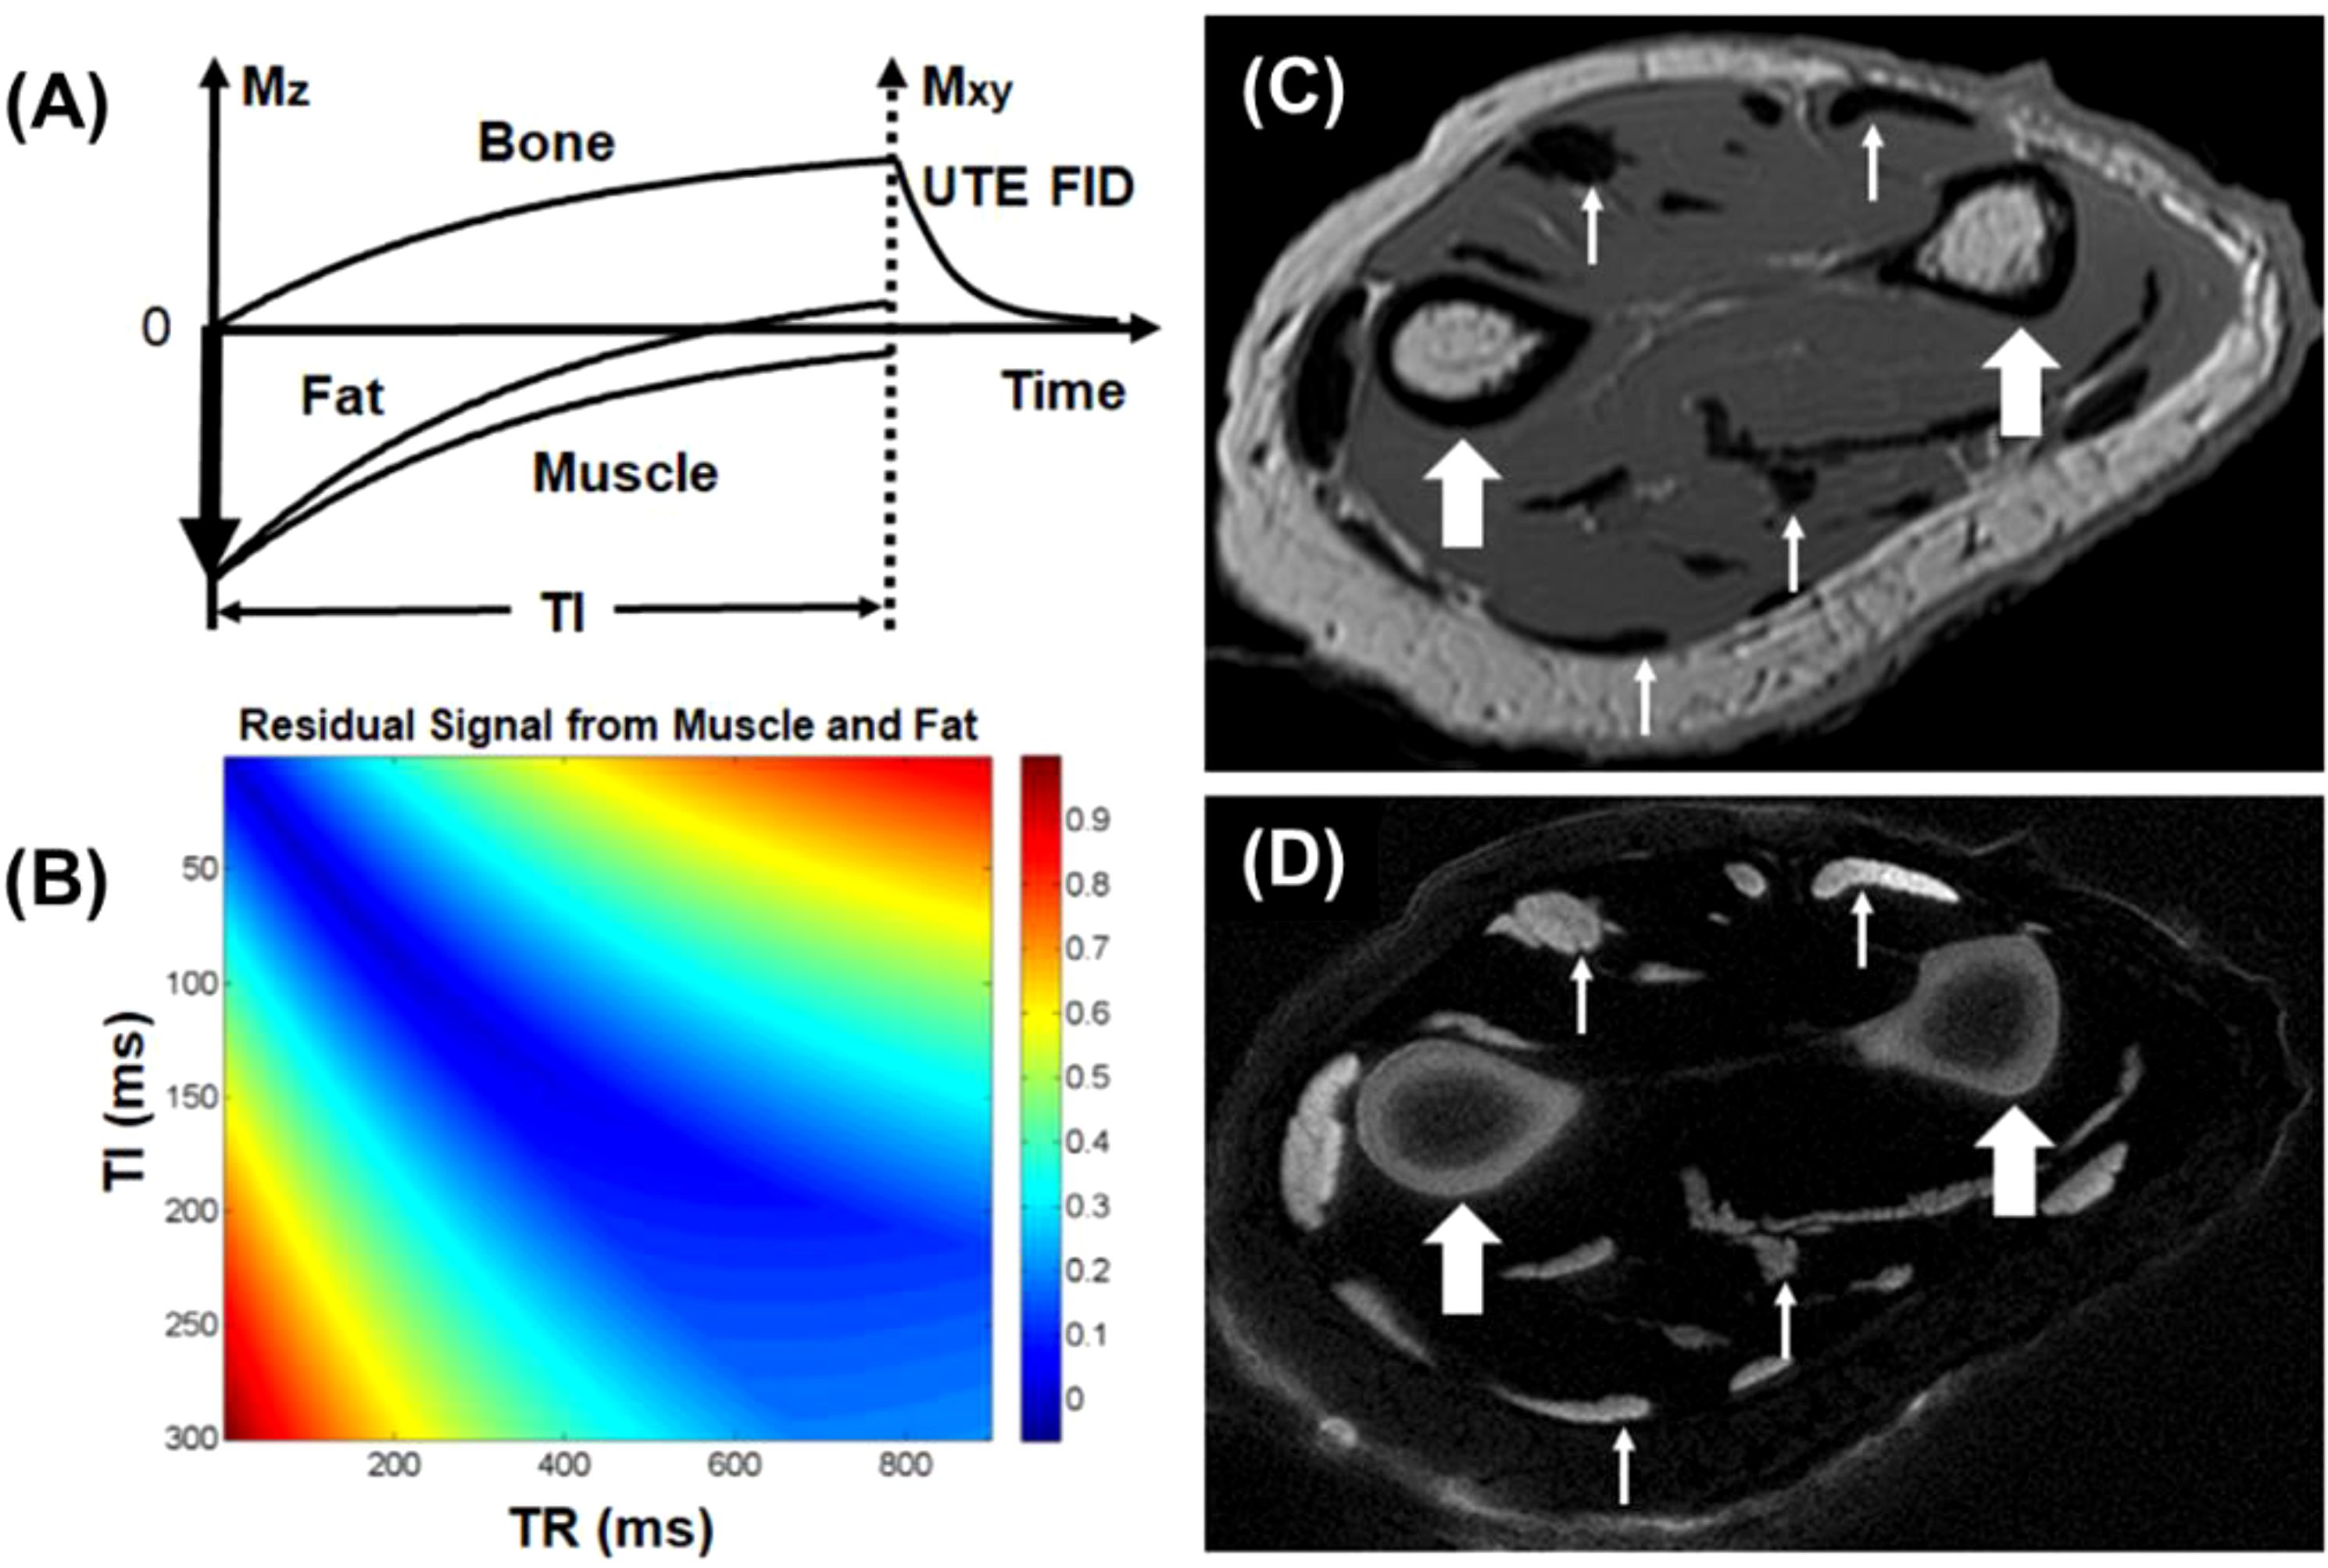
Figure 2. The IR-UTE sequence inverts the longitudinal magnetizations of long T2 muscle and fat with a long adiabatic inversion pulse (duration = 8.64 ms) (A). The longitudinal magnetization of bone is largely saturated, recovers during TI, and is subsequently detected by the UTE data acquisition (B). Clinical FSE imaging of the forearm shows pure signal void for cortical bone (thick arrows), tendons, and aponeuroses (thin arrows) (C). The IR-UTE sequence shows high signal and contrast for cortical bone (thick arrows) and other short T2 tissues (thin arrows) (D). From Ref. (21), with permission.
UTE with double adiabatic inversion
A single inversion pulse can reduce the signal from fat and long T2* components (such as muscle) by up to 80% (21). However, using dual inversion pulses allows for the complete nulling of both, providing more effective signal suppression (52–54). The double adiabatic inversion recovery UTE sequence (double-IR-UTE) employs two identical adiabatic inversion pulses (duration of ~6 ms) with the same center frequency to sequentially invert the longitudinal magnetizations of long T2 species, followed by multispoke UTE data acquisition (55). The two adiabatic inversion pulses are applied with pre-defined inversion times TI1, which is the time between the centers of the two adiabatic inversion pulses, and TI2, which is the time from the center of the second adiabatic inversion pulse to the center spoke of the multispoke acquisition. Robust long T2 suppression can be achieved by timing the center spoke at the null point. Long T2 transverse magnetizations acquired before the null point are of opposite polarity to those acquired after the nulling point, leading to cancellation in the regridding process during image reconstruction and, therefore, efficient suppression of long T2 signals from muscle and marrow fat. Bone magnetization is not inverted but saturated by the two long adiabatic inversion pulses, recovers after the second TI2, and is subsequently detected by UTE data acquisition. The advantage of double-IR-UTE is the robust suppression of long T2 tissues with a broad range of T1s, such as fat and muscle, which can be nulled simultaneously using specific combinations of TI1 and TI2. The double-IR-UTE sequence is insensitive to inhomogeneities in the B1 and B0 fields due to the use of adiabatic inversion pulses with relatively broad spectral bandwidths. Figure 3 shows double-IR-UTE imaging of the knee joint in a healthy volunteer, which shows high signal from short- and ultrashort-T2 species, such as the patellar tendon and cortical bone.
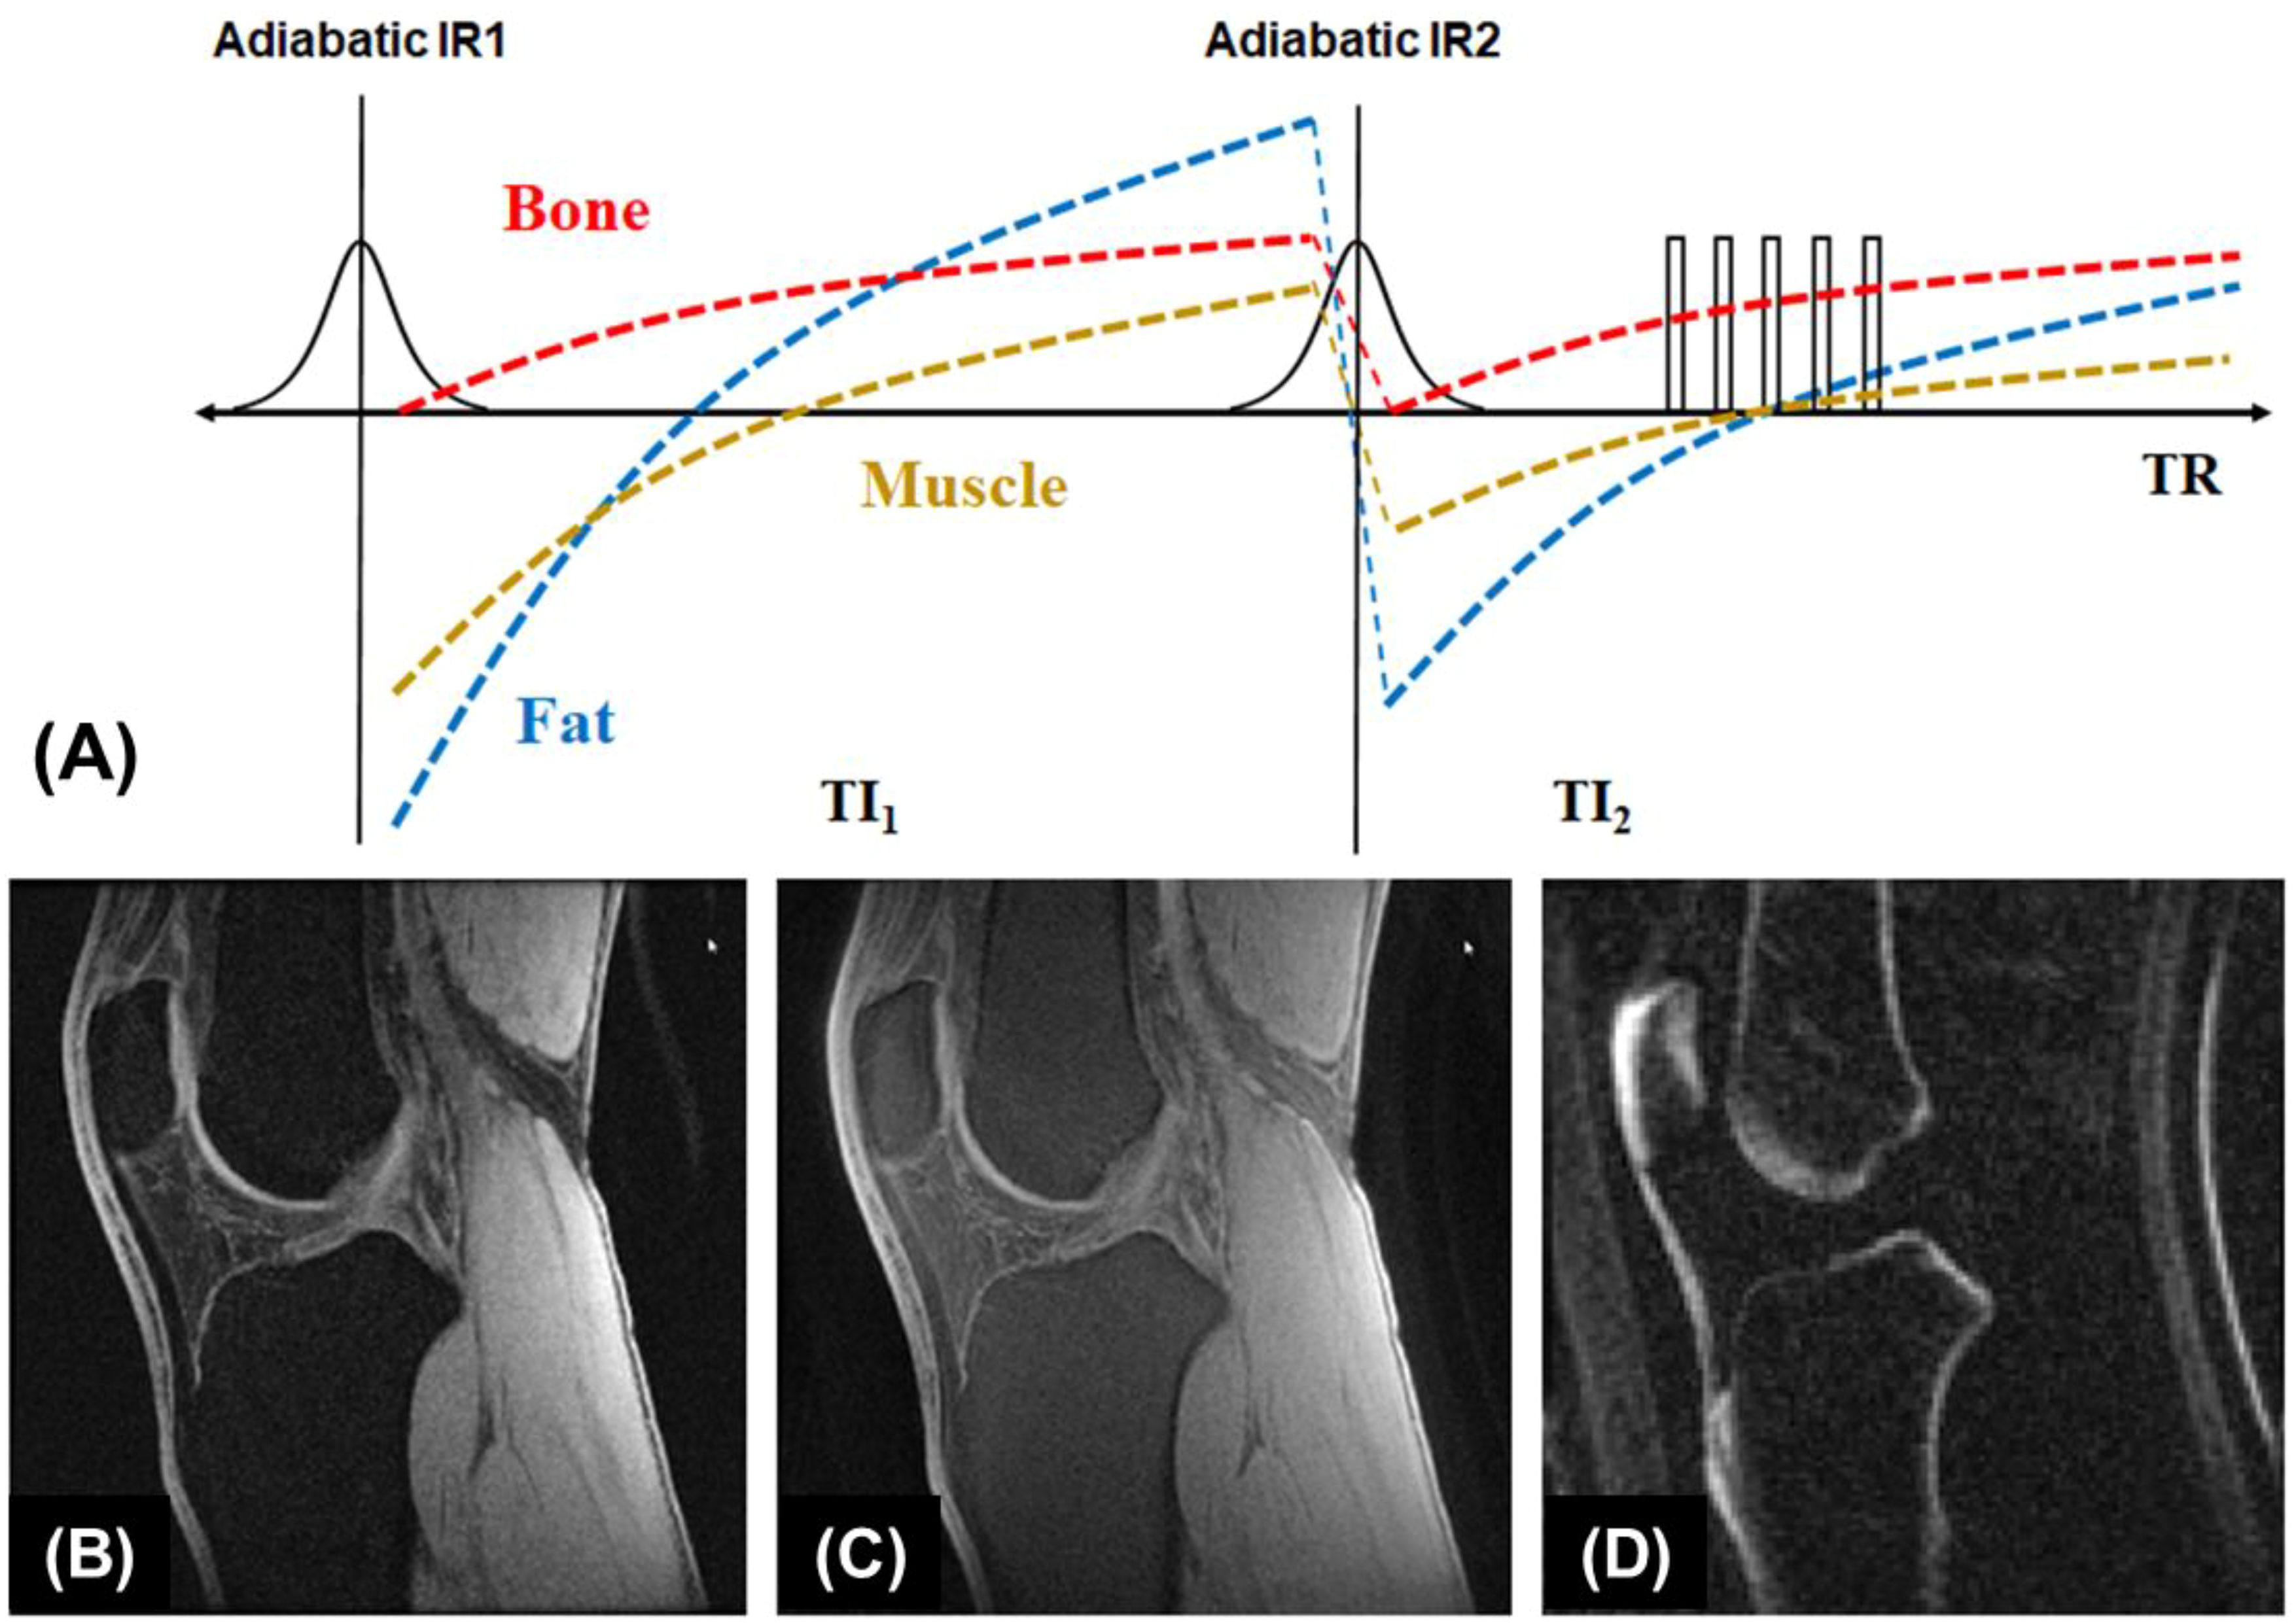
Figure 3. The double-IR-UTE sequence employs two identical adiabatic inversion pulses for simultaneous suppression of long T2 muscle and fat with different T1s, followed by 3D UTE data acquisition to produce high contrast imaging of bone (A). The knee joint of a 31-year-old volunteer was subject to clinical GRE (B), fat-saturated UTE (C), and double-IR-UTE (D) imaging. The double-IR-UTE sequence shows excellent suppression of muscle and fat, providing high contrast for the patellar tendon and cortical bone (D). From Ref. (55), with permission.
UTE with relaxation-parameter contrast
UTE data acquisition can be combined with relaxation-parameter contrast (56). UTE with relaxation parameter contrast and subtraction exploits the sensitivity of bone proton magnetization to both T2 and RF pulse duration. Excitation pulse parameters are selected to determine the extent of concurrent relaxation and excitation. The RF pulse duration and amplitude can be changed to adjust the relaxation dependence of bone contrast. To selectively detect signals from magnetization within a specific range of T2 values, two RF pulse durations are chosen so that the sensitivity transition between them brackets the range of interest. Two UTE datasets with similar imaging parameters but different RF excitation pulses are acquired. Bone contrast is created by subtraction of the two UTE images, as shown in Figure 4.
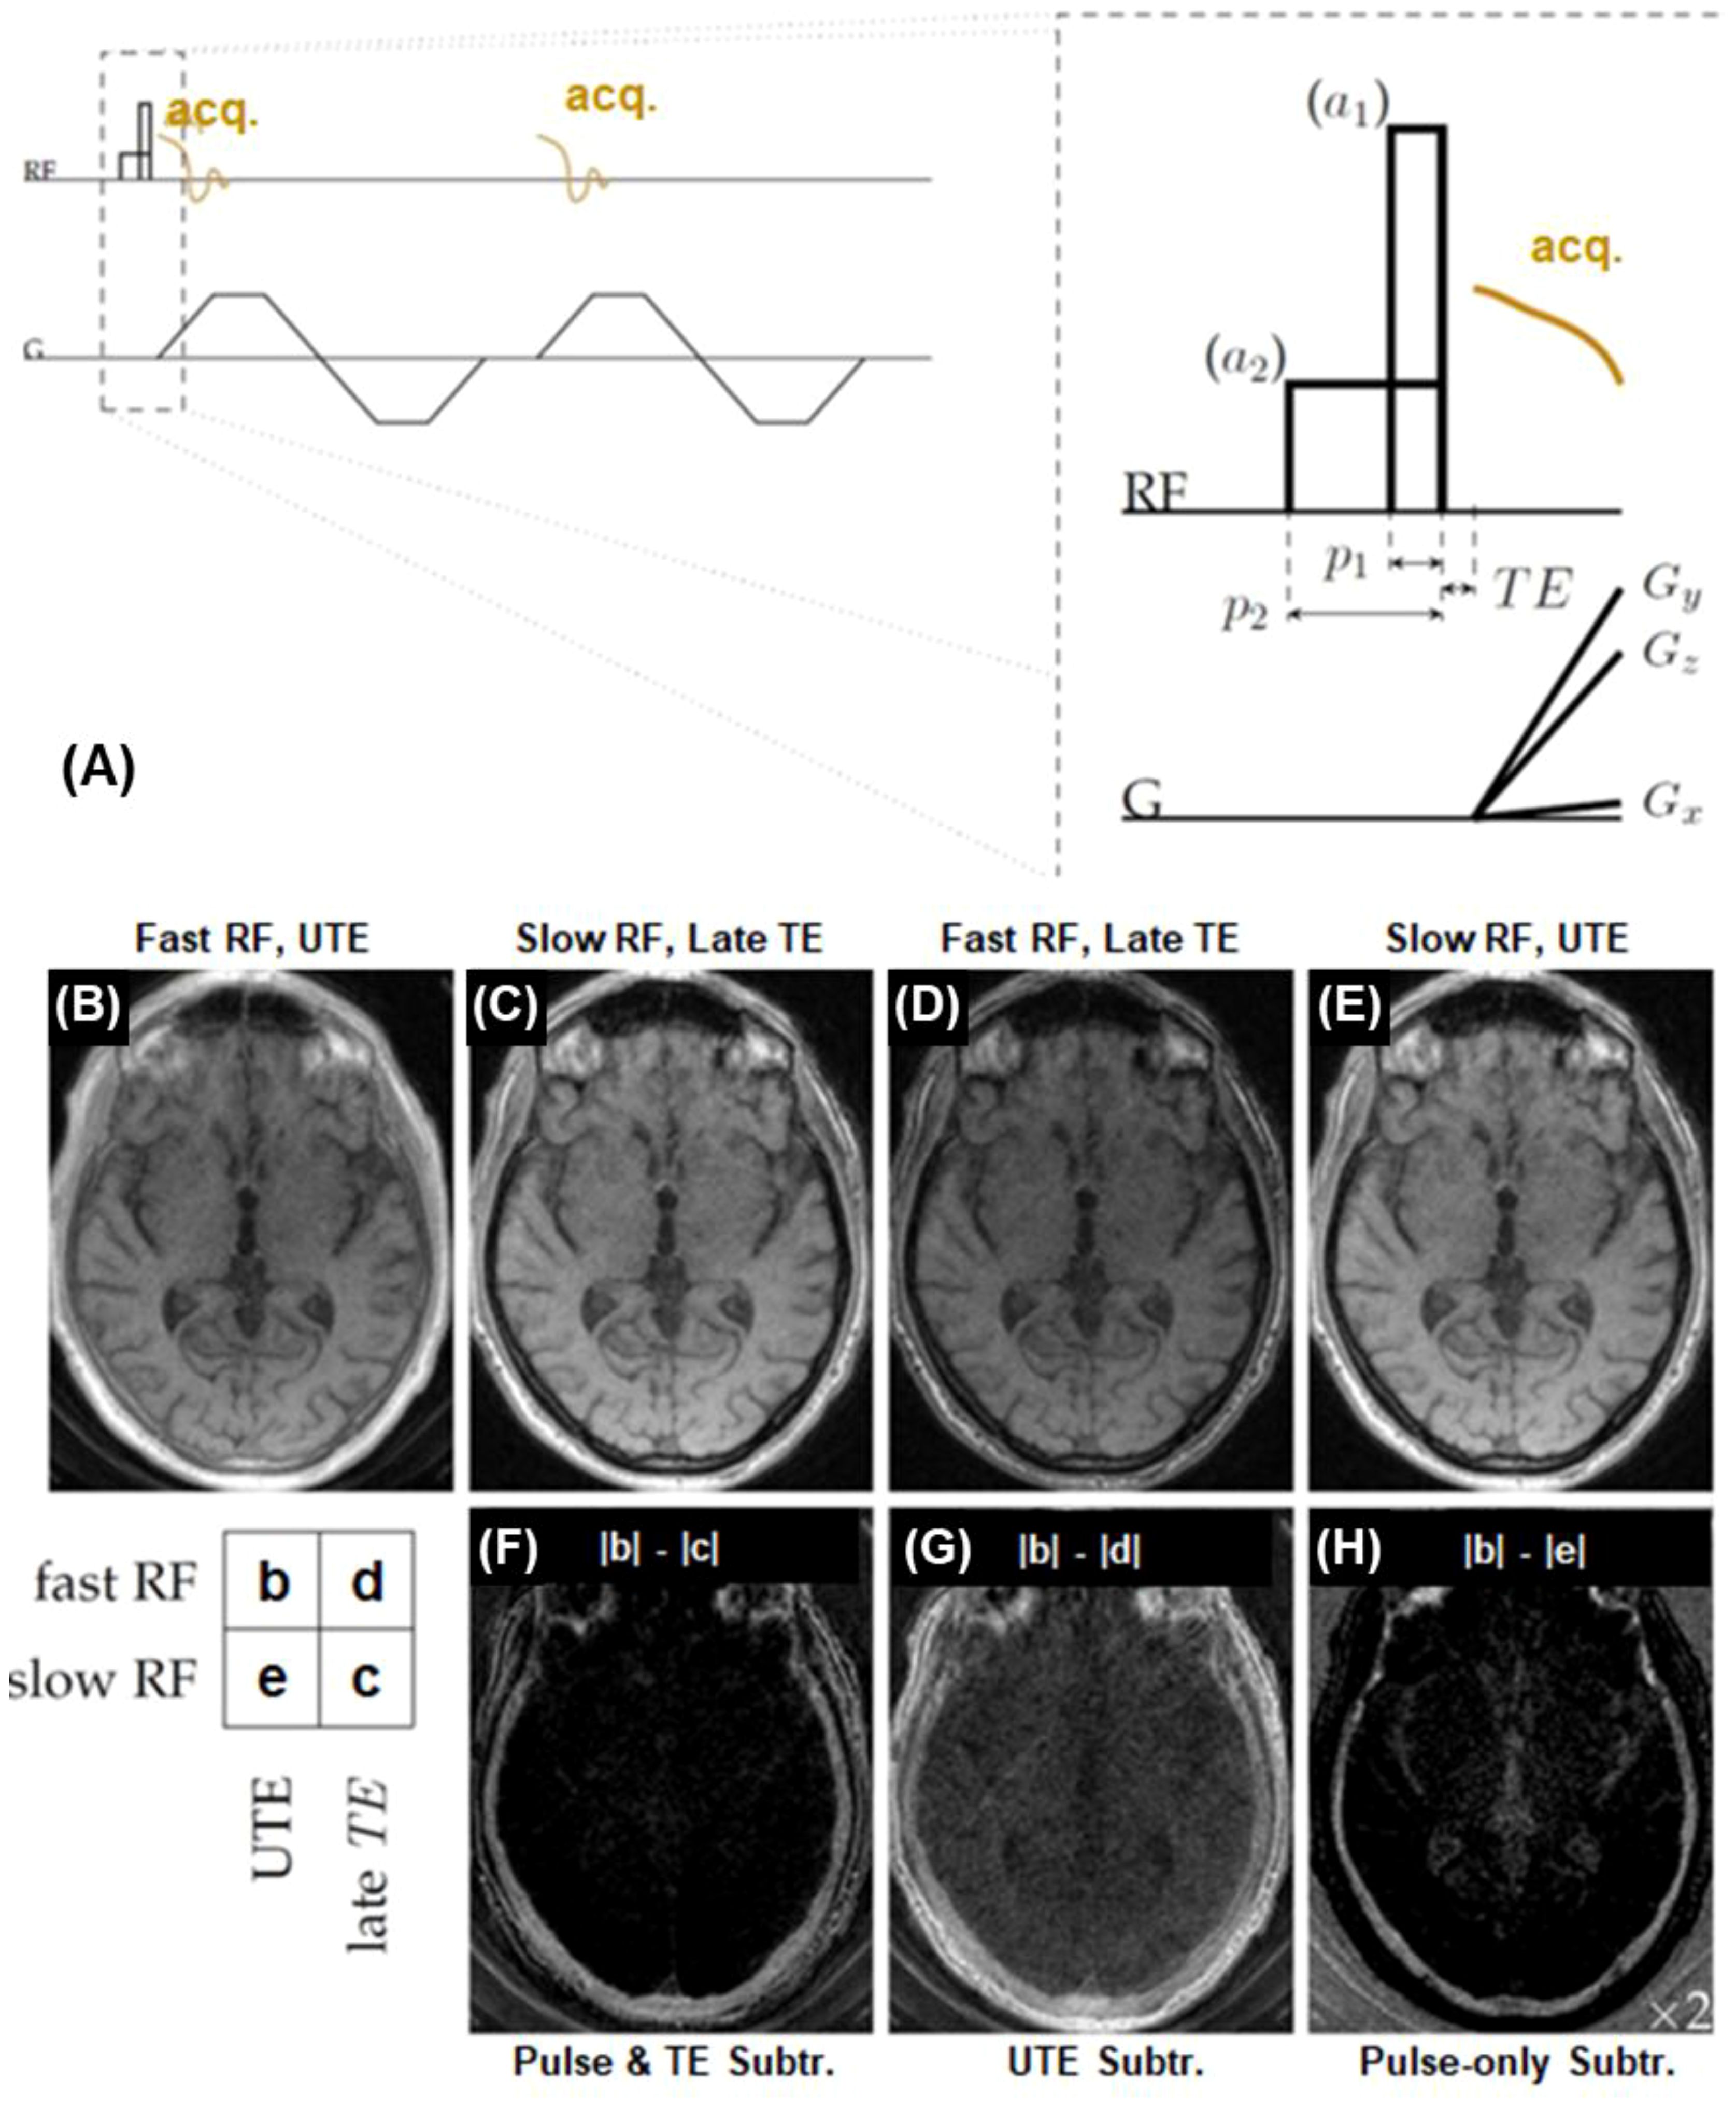
Figure 4. Bone imaging with the relaxation-parameter contrast mechanism, which is based on two hard RF pulses with different durations but equal pulse areas to generate T2-selective excitation (A). The contrast mechanism can be combined with single or dual-echo UTE data acquisition using two RF amplitudes (a1 and a2) and pulse durations (p1 and p2) with equal pulse areas. An example is shown on a volunteer’s skull, including UTE with a short RF pulse of 24.47 μT and a TE of 34 µs (B), UTE with a long RF pulse of 1.53 μT and a TE of 2.0 ms (C), UTE with a short RF pulse and a longer TE of 2.0 ms (D), and UTE with a long RF pulse and a TE of 34 µs (E). The difference image (|b|-|c|) (F) depicts cortical bone more specifically than the conventional UTE subtraction difference image (|b|-|d|) (G), and captures more bone signal than the pulse-only difference image (|b|–|e|) (H). From Ref. (56), with permission.
UTE with dual-RF and dual-echo (DURANDE)
The 3D DURANDE UTE sequence and bone-selective image reconstruction have been proposed for rapid bone imaging (57). This technique acquires two dual-echo UTE datasets following short and long RF pulses, with encoding gradients varying continuously along the entire pulse train to halve the total imaging time. The DURANDE UTE sequence employs two rectangular RF pulses (RF1 and RF2), differing in duration and amplitude but having the same pulse area applied alternately in successive TR periods along the entire pulse train. Two echoes at a short TE and a long TE are collected from the beginning of the gradient ramp-up within each TR. As a result, four echoes are produced and combined via a view-sharing approach to generate two independent k-space datasets during image reconstruction. Accelerated UTE bone imaging can be achieved by using the sparsity of bone voxels in the corresponding subtraction images.
Short TR adiabatic inversion recovery UTE MRI of trabecular bone
In STAIR-UTE, 3D IR-UTE data are acquired with a short TR and a high flip angle within specific absorption rate (SAR) limits for clinical imaging (58–60). The short TR and TI combination is selected to achieve robust suppression of long-T2 muscle and marrow fat regardless of their different T1 values. Multiple spokes are acquired for efficient volumetric imaging of cortical and trabecular bone (60). The STAIR-UTE sequence is more efficient than other UTE or ZTE techniques, such as the spectral presaturation with IR UTE (SPIR-UTE), in selective imaging of trabecular bone (61). Figure 5 shows STAIR-UTE images of the spine and SPIR-UTE images of the fingers. The SPIR-UTE images showed T2* values of 2.42 ± 0.56 for the capitate, which is much longer than the T2* of 0.31 ± 0.01 ms for the trabecular bone of the spine measured on STAIR-UTE images (60, 61), or the T2* value of ~0.3 ms for the cortical bone (62). The much longer T2* values suggest that SPIR-UTE imaging of the trabecular bone is subject to significant long-T2 signal contamination. In comparison, STAIR-UTE-measured T2* values for the trabecular bone are close to those measured for cortical bone, suggesting that bone marrow fat is completely suppressed and only signal from trabeculae is selectively detected in STAIR-UTE imaging (60).
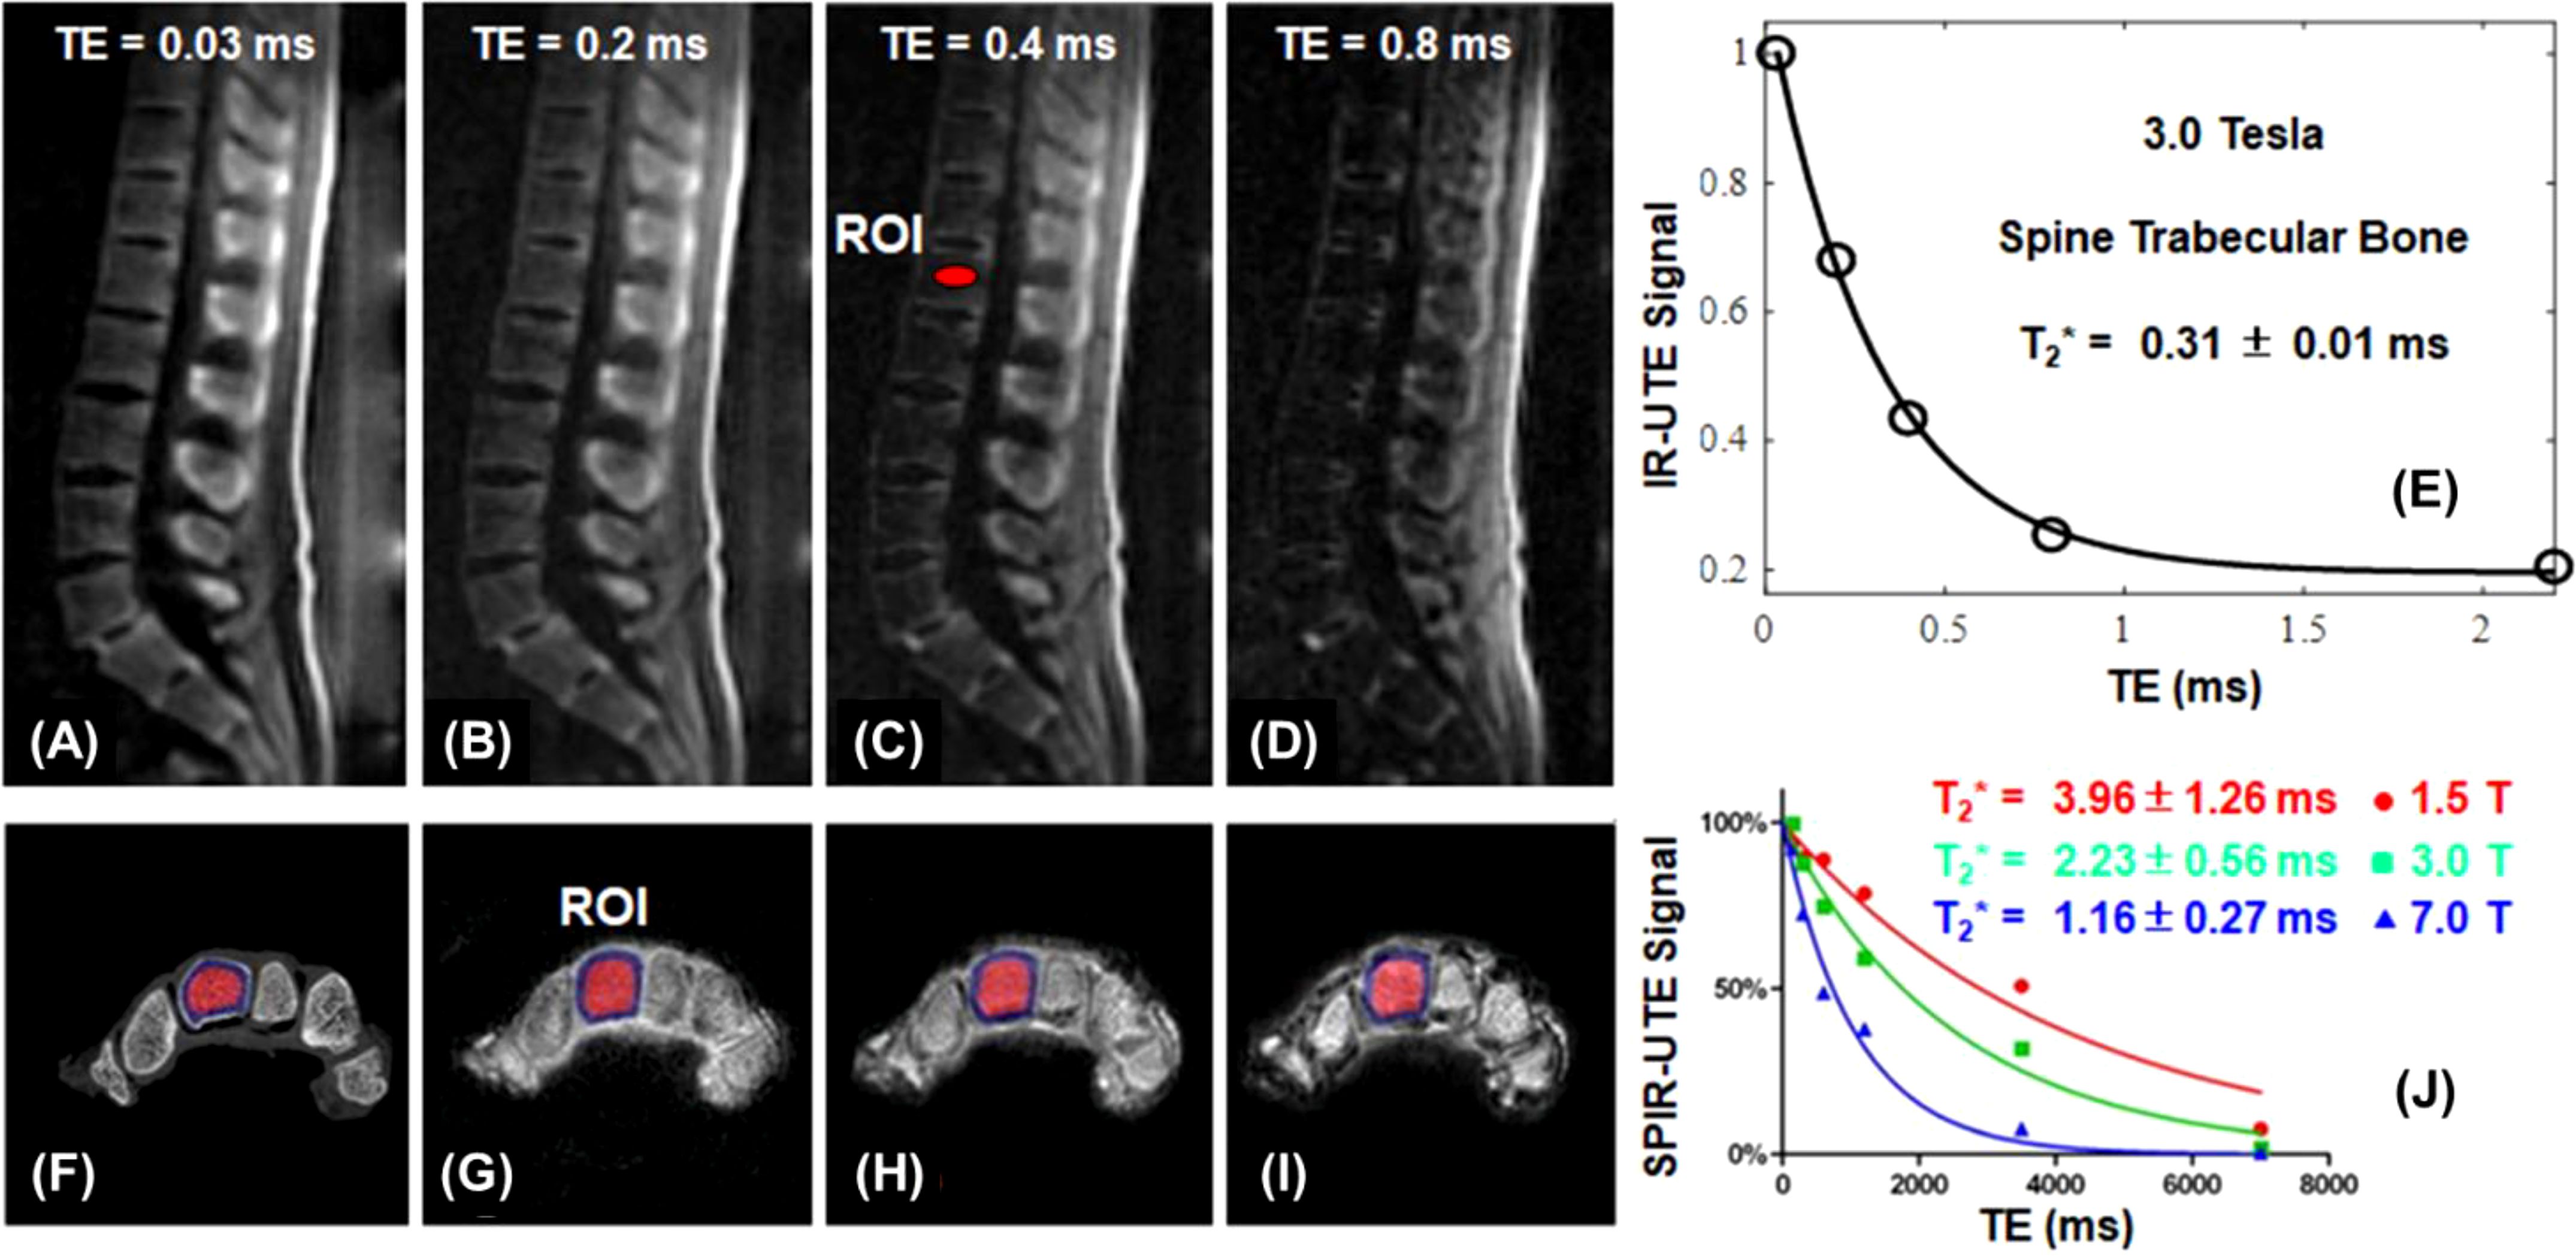
Figure 5. STAIR-UTE imaging of trabecular bone in the spine of a 36-year-old male volunteer with TEs of 0.032 ms (A), 0.2 ms (B), 0.4 ms (C), and 0.8 ms (D) at 3T, and the single-component T2* fitting (E). µCT (F) and SPIR-UTE imaging of trabecular bone in the fingers at 1.5 T (G), 3.0 T (H), 7.0 T (I), and the corresponding single component T2* fitting (J). STAIR-UTE imaging of trabecular bone in the spine shows a short-T2* of 0.31 ± 0.01 ms at 3.0 T, while SPIR-UTE imaging of trabecular bone in the fingers shows short-T2* values of 1.16 ± 0.27 ms at 7.0 T, 2.23 ± 0.56 ms at 3.0 T, and 3.96 ± 1.26 ms at 1.5 T, respectively. From Refs. (60, 61), with permission.
UTE on the fat peak for trabecular bone imaging
Past research has focused on high resolution imaging of marrow to indirectly detect trabecular microstructure (5, 63, 64). Two major challenges exist: the high susceptibility at the marrow/bone interface and the multiple fat peaks, both of which significantly reduce T2*, leading to low marrow signal (misclassified as bone) and overestimation of trabecular volume. UTE is insensitive to T2* shortening. However, UTE employs non-Cartesian radial sampling, which is sensitive to chemical shift artifacts (65). UTE imaging on the fat peak resolves this issue (66). Bone is off-resonance in fat-centered imaging, but it has a much lower signal than marrow, and the off-resonance artifact is negligible. Figure 6 shows UTE and clinical GRE imaging of a trabecular bone sample from a 65-year-old male donor. UTE on the water peak shows strong chemical shift artifacts, which are significantly reduced in UTE imaging on the fat peak. Trabecular bone thickness is overestimated at longer TEs (e.g., TE = 1.1, 2.2, 3.3, or 4.4 ms) or with the clinical GRE sequence. UTE imaging on the fat peak is expected to perform even better in older osteoporotic or diabetic patients who typically have a higher fat fraction in the marrow.
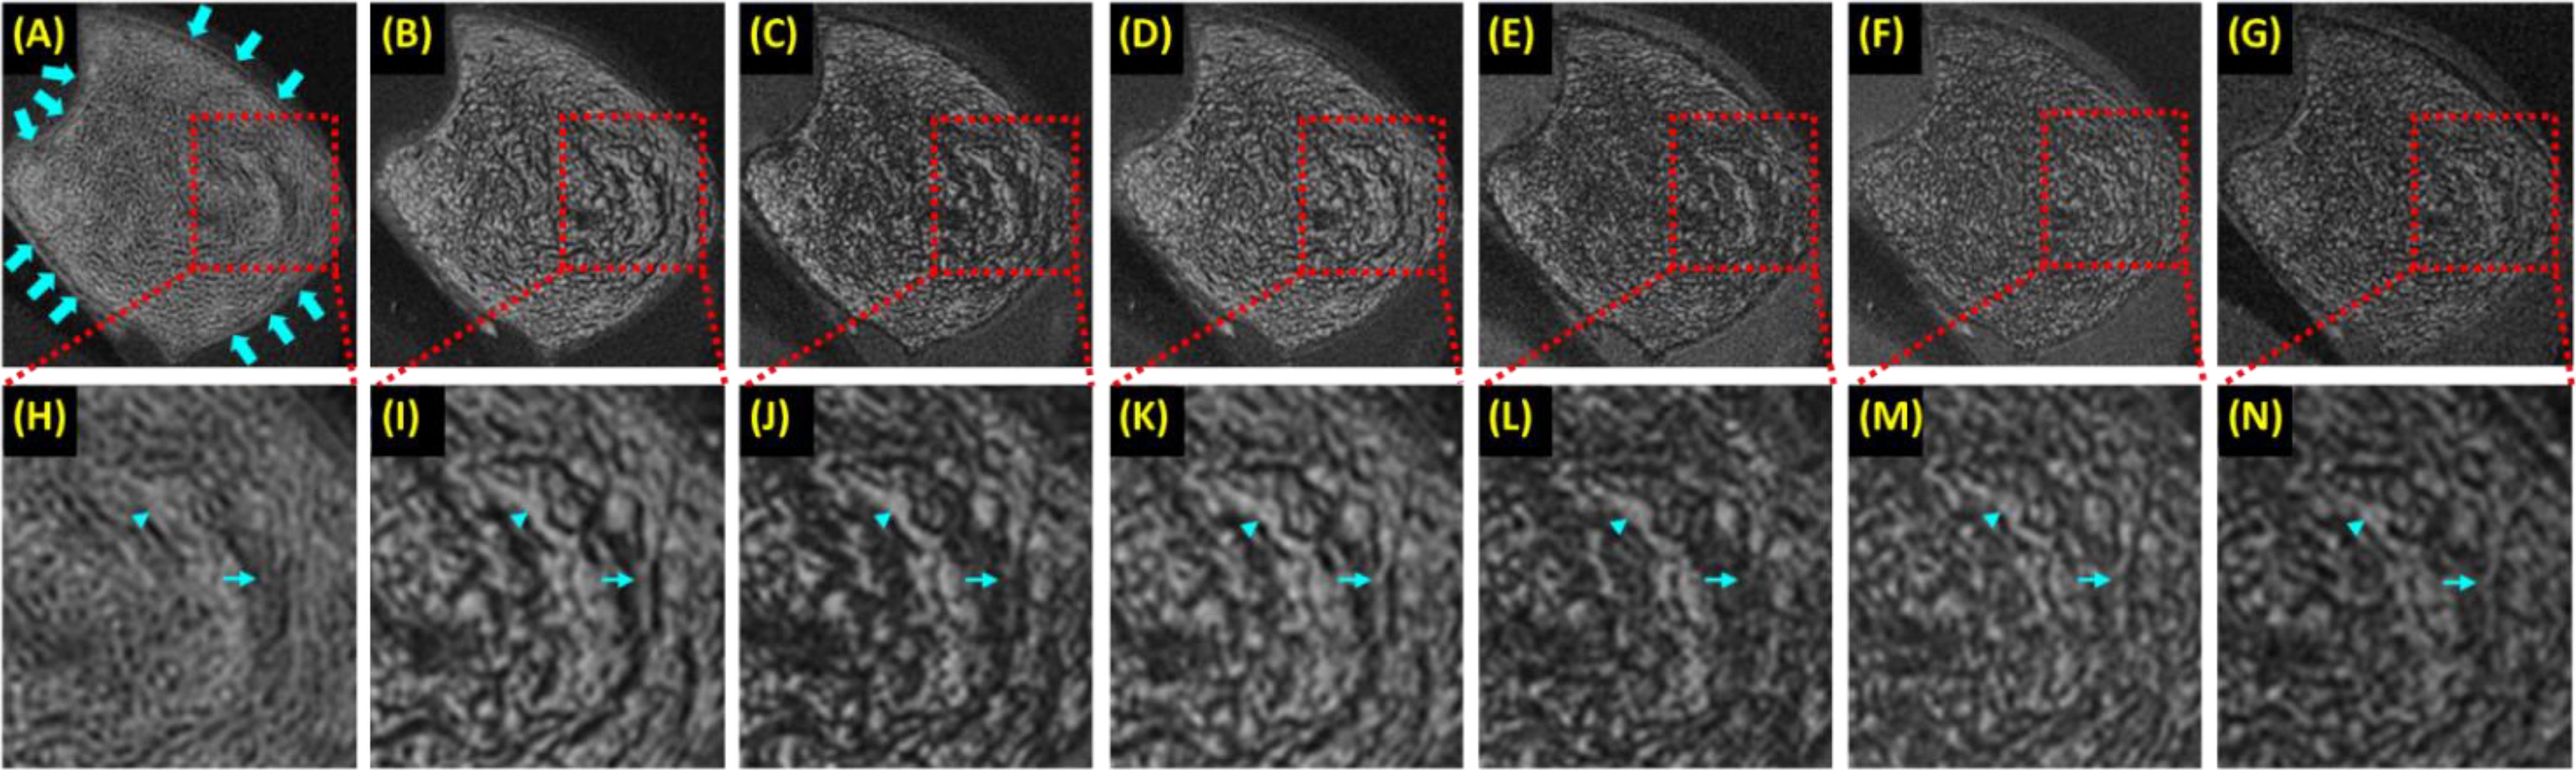
Figure 6. A trabecular bone specimen imaged with 3D UTE on the water peak at TE of 0.03 ms (A) and on the fat peak at TEs of 0.03 ms (B), 1.1 ms (C), 2.2 ms (D), 3.3 ms (E), and 4.4 ms (F), and clinical 3D GRE at TE of 4.4 ms (G), with the zoomed regions indicated with the red dashed-line boxes shown in the second row (H-N). UTE images on the water peak show significant chemical shift artifacts, manifesting as blurred trabecular bone structure and ringing artifacts [arrows in (A)]. The more significant fat signal loss was observed at longer TEs (C-F, J-M) due to the strong susceptibility between bone/marrow interface and at TEs of 1.1 ms (C, J) and 3.3 ms (E, L) due to fat/water signal cancellation, with both leading to overestimation of trabecular thickness. From Ref. (66) with permission.
ZTE MRI of cortical bone
ZTE employs a short rectangular pulse excitation followed by readout gradient flat-top sampling to minimize the effective TE (29). A small flip angle (1-2°) is typically used to minimize the dead-time gap, which causes a spherical void in the center of k-space. A variety of approaches have been developed to address this k-space gap and associated low frequency artifacts in the reconstructed images (33). The repetition time (TR) is minimized to speed up data acquisition. Higher receiver bandwidths (62.5-83.3 kHz) are recommended to mitigate chemical shift artifacts. Bias field correction, contrast inversion, and background segmentation are employed for CT-like bone contrast (34–36). The principal difference between ZTE and UTE sequences is the temporal order of setting the spatial encoding gradient and RF excitation (33). UTE offers the freedom to adjust TE, a feature not possible in ZTE imaging. UTE also allows high flip angles, a significant advantage in direct bone imaging using the STAIR contrast mechanism (60). On the other hand, the ZTE sequence acquires k-space data after the readout gradients are fully ramped up, avoiding fidelity issues introduced by gradient ramping (33). ZTE has a shorter effective TE and can detect signal from shorter T2 species. ZTE can be applied in many of the same applications and with many of the same magnetization preparation methods as UTE.
Other UTE-type sequences for bone imaging
Many other UTE-type sequences have been developed for bone imaging. These sequences can be combined with each of the above contrast mechanisms for high-contrast imaging of bone. For example, adiabatic inversion recovery-based preparations can be combined with ZTE (29–36), vTE (40), AWSOS (43), RHE (44), and PETRA (37–39) sequences for high contrast imaging of cortical bone and other short-T2 tissues, respectively. On-resonance long-T2 suppression or off-resonance short-T2 saturation can be applied to SWIFT, PETRA, WASPI, RHE, and ZTE sequences to create short-T2 contrast. For example, SWIFT with off-resonance saturation has been used to image the interface between cartilage and subchondral bone (67). A systematic study of the above contrast mechanisms combined with ZTE, vTE, WASPI, SWIFT, AWSOS, PETRA, RHE, and Looping Star sequences remains to be investigated, and their SNR and CNR efficiency remains to be compared.
Part II: technical development in quantitative UTE imaging
Quantitative UTE MRI techniques have been developed to evaluate bone MR relaxation properties such as T1 and T2* relaxation times, and tissue properties such as total water proton density (TWPD), bound water proton density (BWPD), pore water proton density (PWPD), macromolecular proton density (MMPD), magnetization transfer ratio (MTR), susceptibility, and perfusion (24–26).
Bone T1 relaxation time
T1 relaxation is a fundamental MR tissue property and describes how fast the longitudinal magnetization recovers to the steady state. Many T1 measurement techniques have been combined with UTE acquisitions to provide accurate T1 measurements of bone, such as saturation recovery UTE (18), inversion recovery UTE (68), UTE with variable repetition time (UTE-VTR) (69), and UTE with variable flip angle (UTE-VFA) methods (70). The UTE-VTR method is sensitive to B1 inhomogeneity. The actual flip angle imaging (AFI) method has been widely used for 3D B1 mapping (71). By combining UTE and AFI techniques, it is possible to use a pair of interleaved UTE acquisitions with a short TR (e.g., 20 ms) and a longer TR (e.g., 100 ms) to produce accurate B1 mapping for bone (69). Furthermore, combining UTE-VTR and UTE-AFI (UTE-AFI-VTR) provides accurate T1 mapping for bone with B1 correction. A short T1 of ~250 ms was reported for cortical bone (69).
Bone T2* relaxation time
Bone water exists as pore water residing in the macroscopic pores and as loosely bound water attached to the organic matrix (72). UTE sequences can detect pore water with a longer T2* of ~3 ms and loosely bound water with an ultrashort T2* of ~0.3 ms (62, 73–76). IR-UTE or STAIR-UTE allows partial inversion and nulling of pore water with longer T2*, leaving bound water with ultrashort T2* to be selectively imaged (21, 60, 77). Figure 7 shows single- and bi-component fitting of UTE and IR-UTE images of a bovine cortical bone sample (77). Excellent bi-component fitting was achieved to show the existence of two distinct water components: bound water with a short T2* of 0.26 ms (72.4% by volume) and pore water with a longer T2* of 1.56 ms (27.6%). The IR-UTE images show a single component with T2* ~0.31 ms, suggesting that pore water is efficiently suppressed and bound water selectively imaged (77).
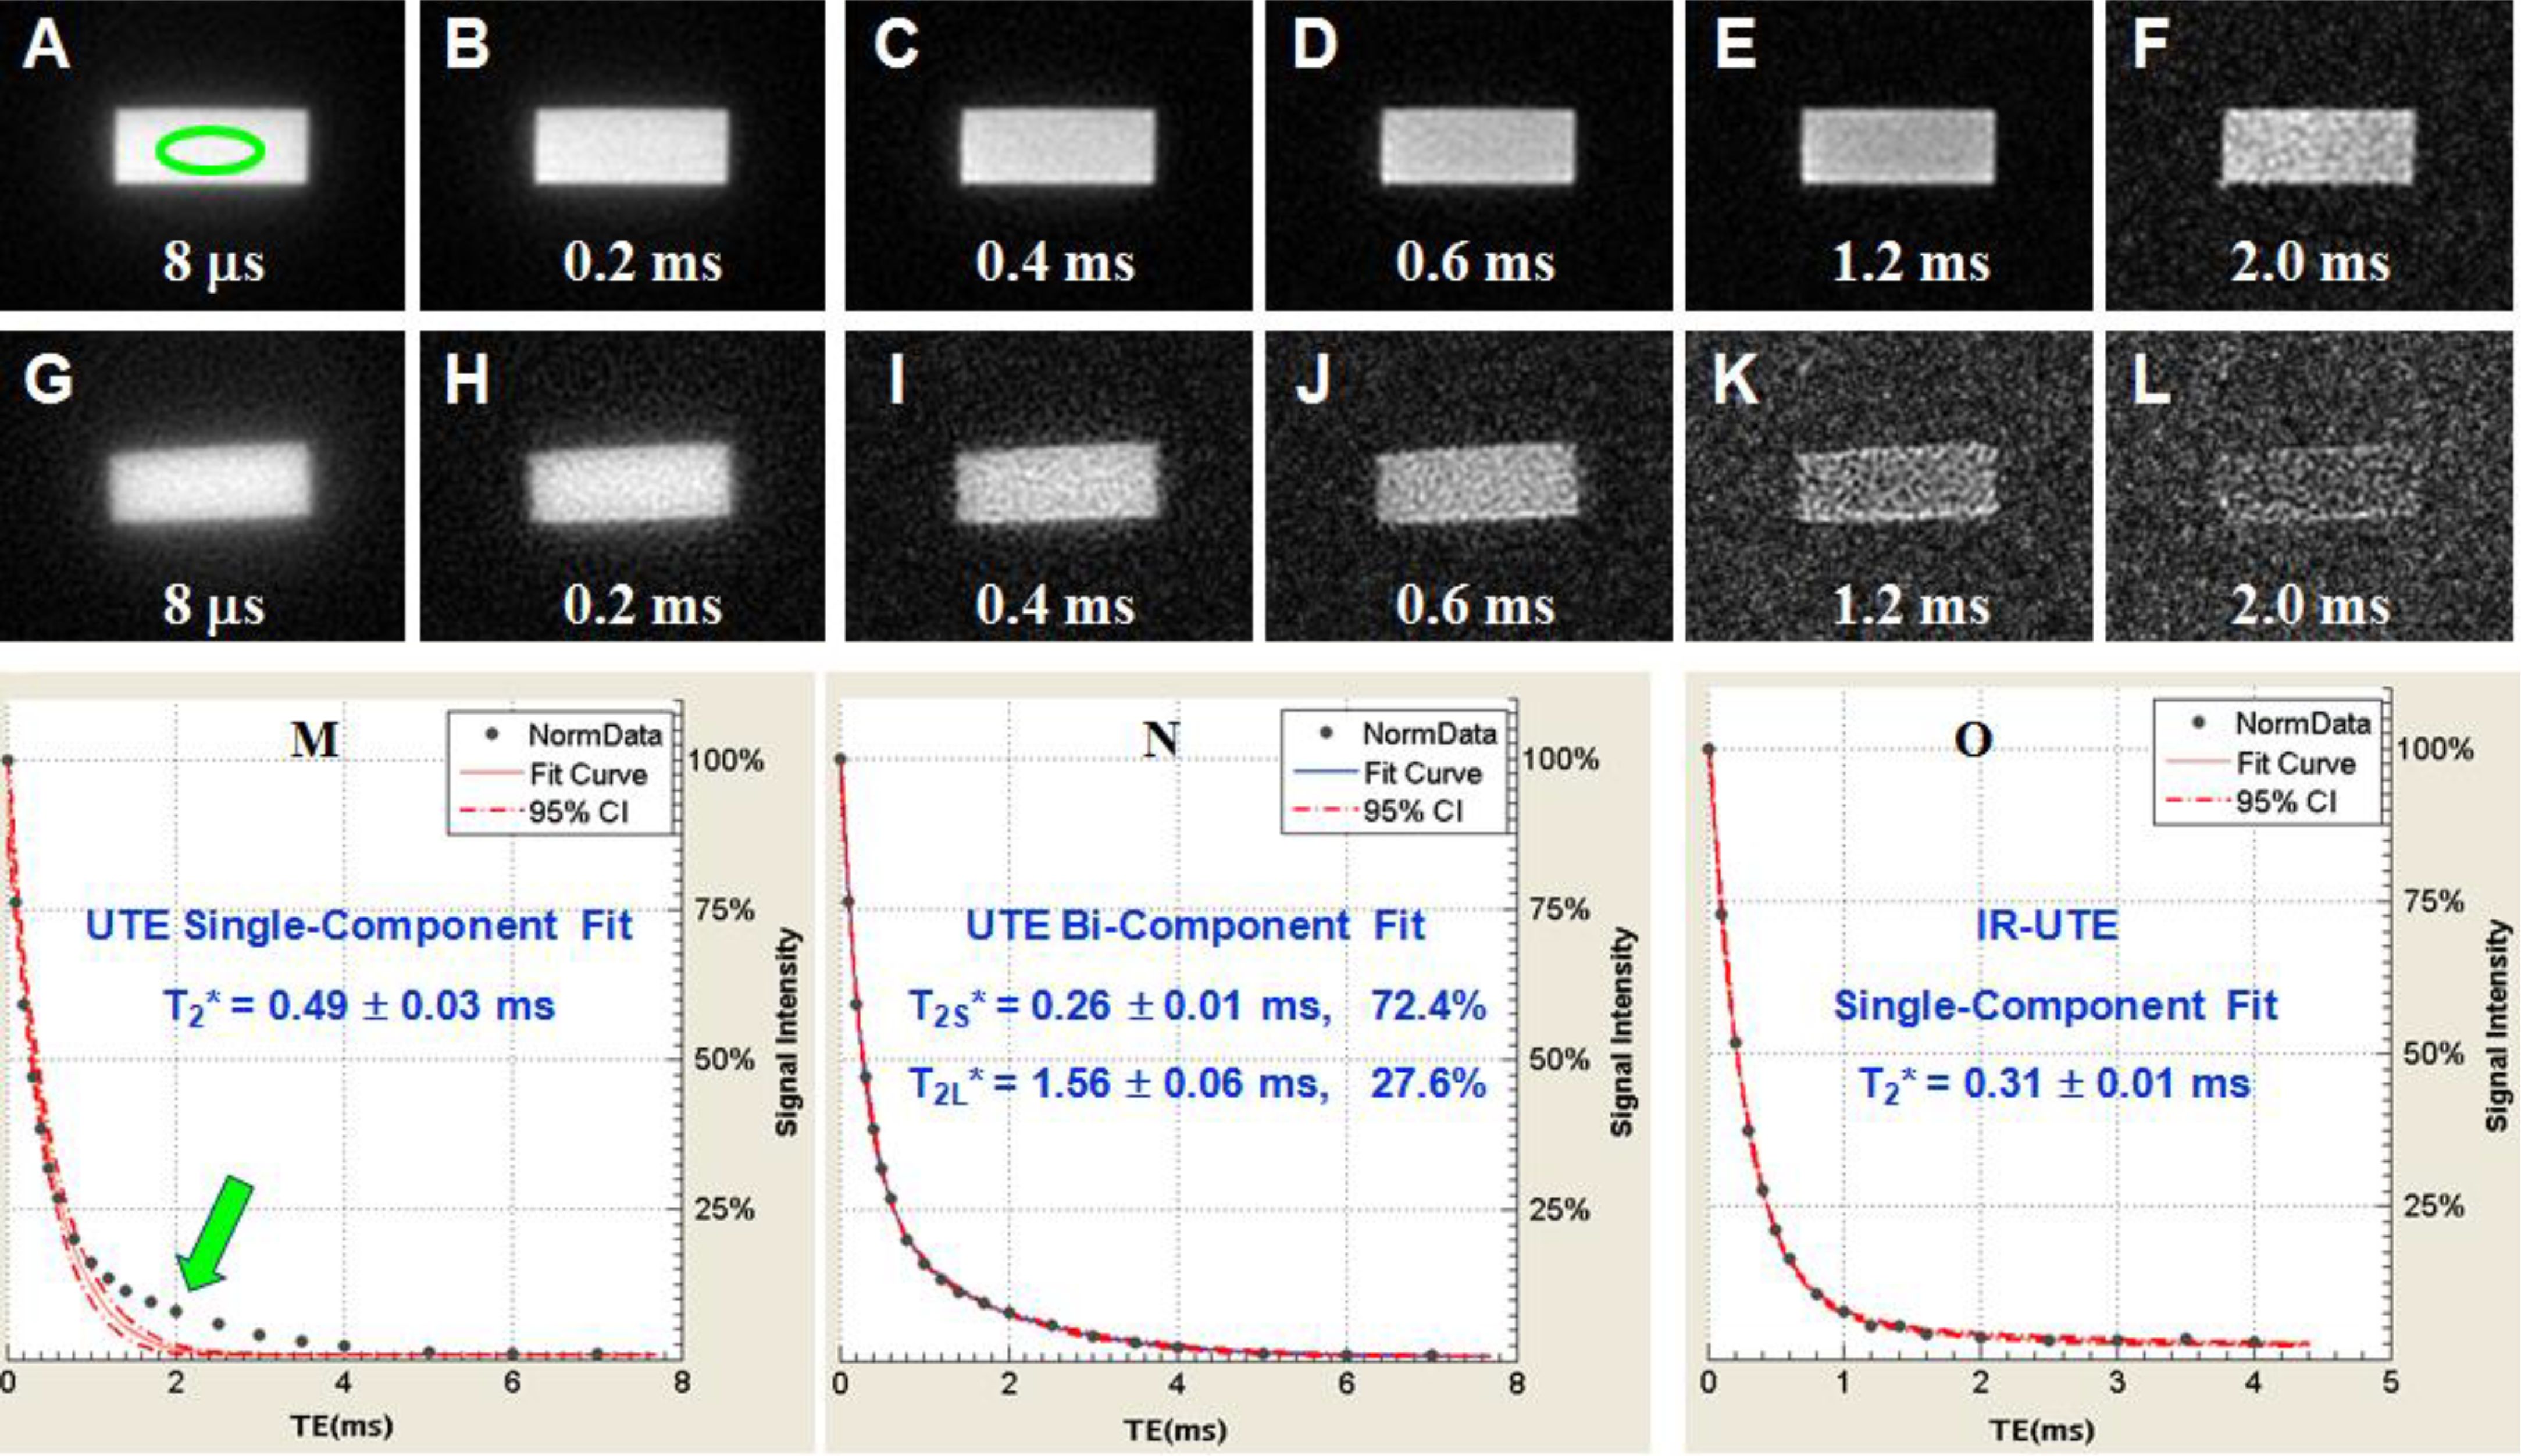
Figure 7. UTE imaging of a sectioned bovine cortical bone with TEs of 8 μs to 2 ms (A-F), IR-UTE with TEs of 8 μs to 2 ms (G-L). Single- (M) and bi-component (N) fitting suggest two components: bound water with a short T2*~0.26 ms and pore water with a T2* ~1.56 ms. IR-UTE images show one component with a T2* of ~0.31 ms (O), consistent with bound water imaging. From Ref. (77) with permission.
UTE-MT modeling of MMF and exchange rates
There is another group of protons, collagen backbone protons, which have extremely short T2* relaxation times and are invisible with UTE sequences. UTE magnetization transfer (UTE-MT) modeling can measure collagen backbone proton fraction and exchange rates between water and collagen protons (73–75, 78–83). Figure 8 shows UTE-MT imaging of a bovine bone sample. Excellent two-pool MT modeling and MT parameters mapping were achieved using a Gaussian lineshape (79). The lower half of this bone sample shows increased variations in UTE image signal intensity and MT parameters, suggesting an abnormality that needs further investigation.
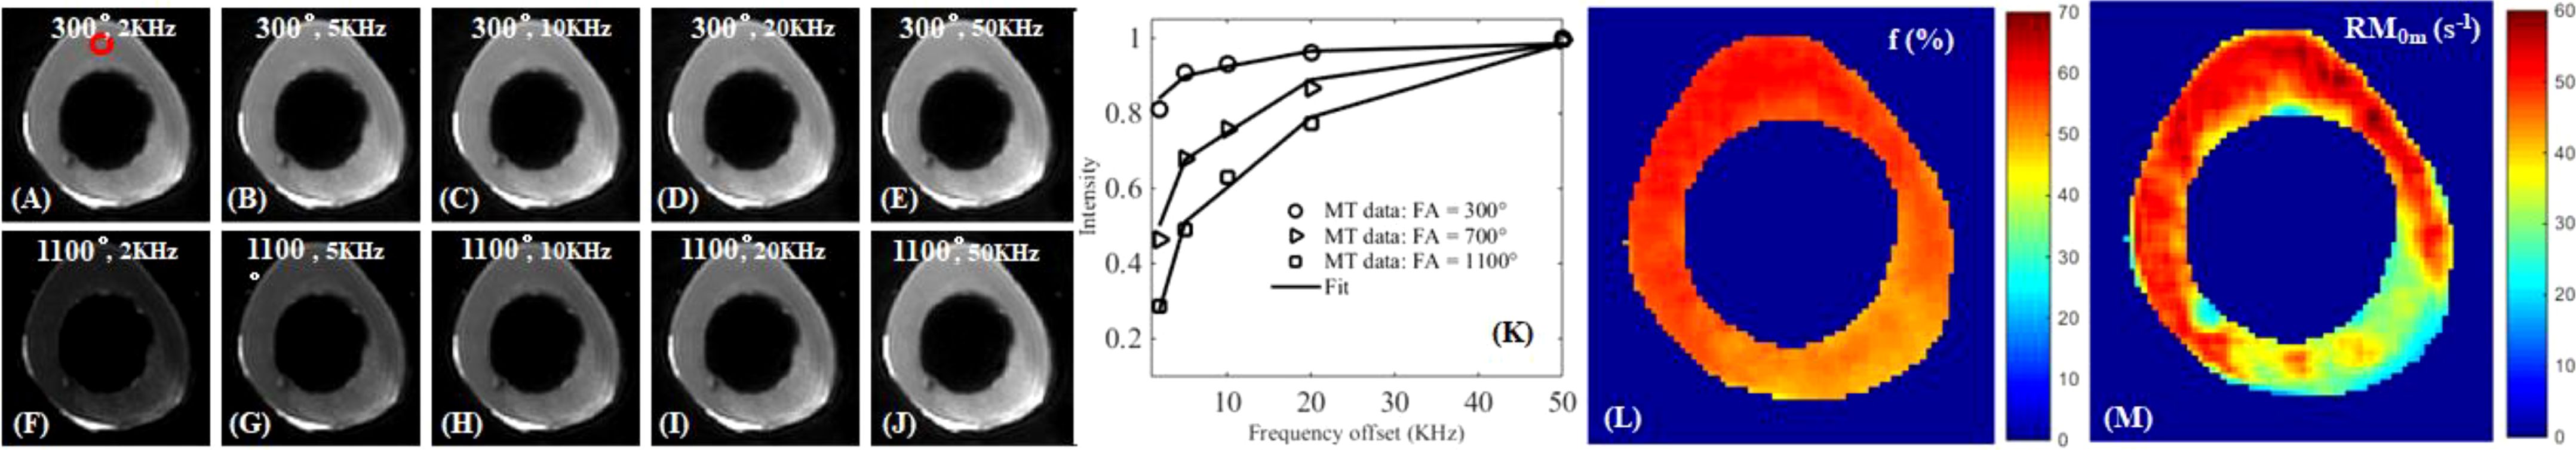
Figure 8. UTE-MT imaging of cortical bone with an MT power of 300° and frequency offsets of 2 kHz (A), 5 kHz (B), 10 kHz (C), 20 kHz (D), 50 kHz (E), and 1100° and 2 kHz (F), 5 kHz (G), 10 kHz (H), 20 kHz (I), 50 kHz (J), and two-pool fitting (K) with maps of macromolecular fraction [MMF or f; (L)] and exchange rate [RM0m; (M)]. From Ref. (79) with permission.
UTE mapping of water and collagen protons
UTE sequences can be used to map TWPD, BWPD, PWPD, and MMPD (20–23, 25, 76, 84–91). TWPD can be estimated by comparing the UTE MRI signal of bone with an external reference with known proton density (20, 21, 76, 84–88). BWPD can be measured with IR-UTE or STAIR-UTE, which efficiently suppresses pore water (21, 23, 60). PWPD can be quantified by subtracting bound water from total water. MMPD can be quantified by combining total water proton density with macromolecular fraction (MMF) (91). Figure 9 shows 3D mapping of TWPD, BWPD, PWPD, and MMPD for tibial midshaft of a 35-year-old healthy female, a 76-year-old female with osteopenia, and a 57-year-old female with OP, respectively (91). The OP patient has higher PWPD but lower MMF and MMPD, consistent with increased porosity and loss of mineral/collagen.
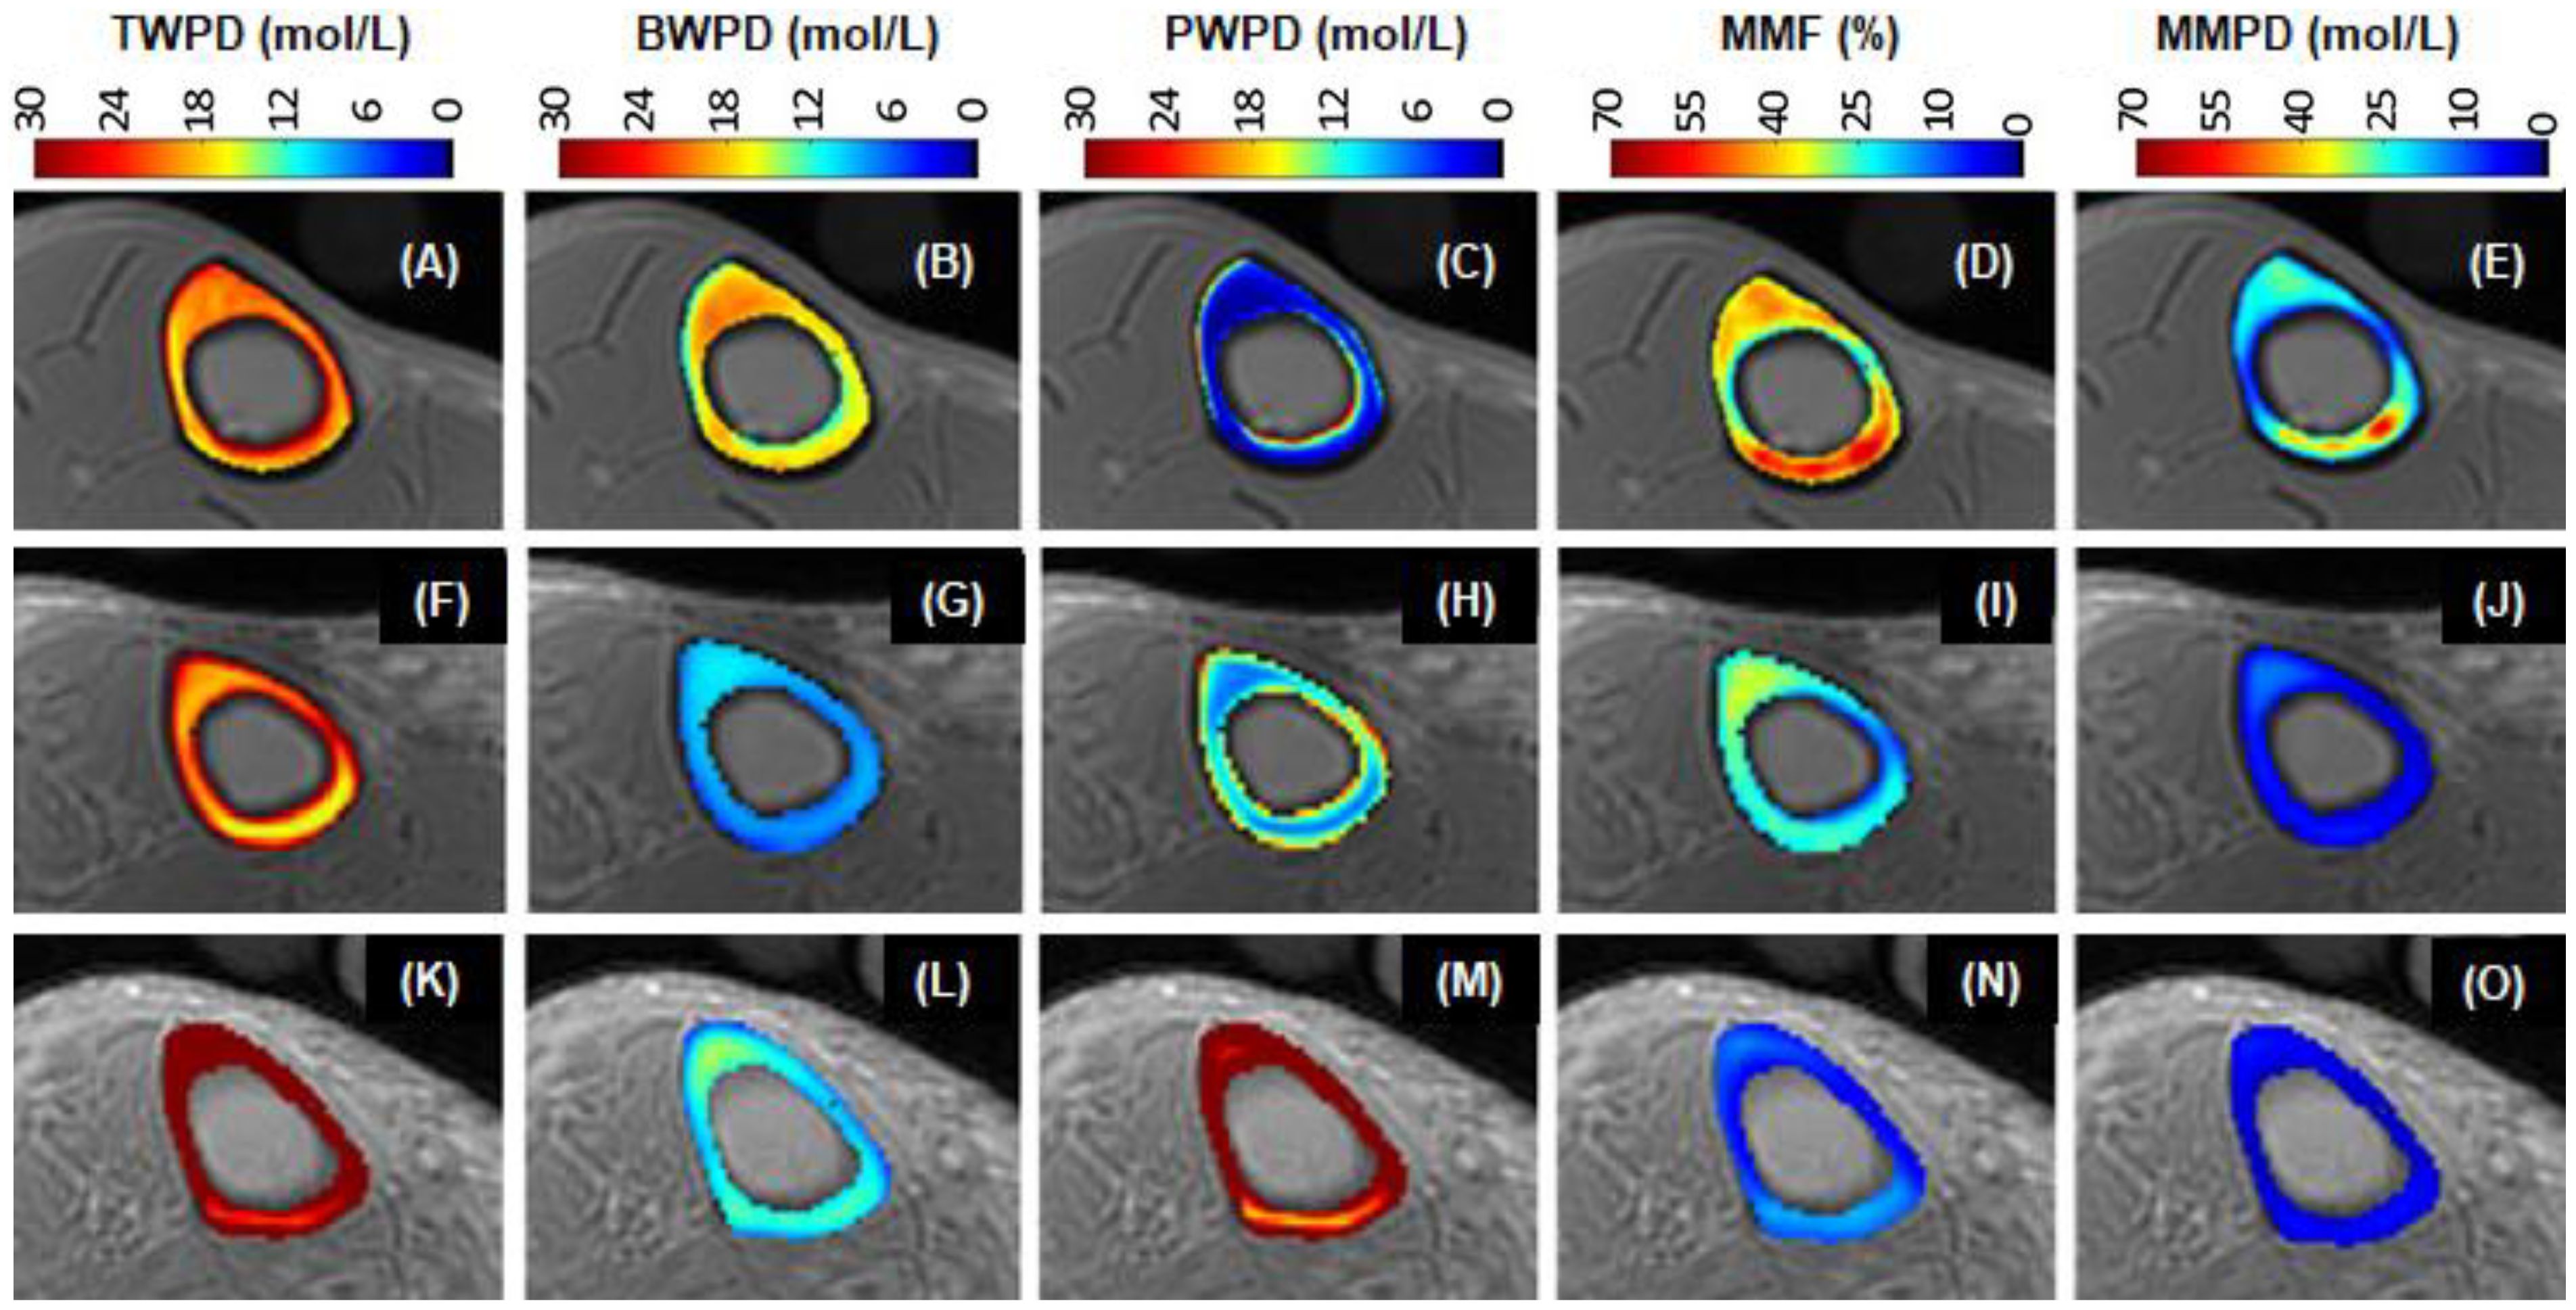
Figure 9. UTE maps of TWPD (A, F, K), BWPD (B, G, L), PWPD (C, H, M), MMF (D, I, N), and MMPD (E, J, O) of a 35-year-old healthy (1st row), a 76-year-old osteopenia (2nd row), and a 57-year-old OP (3rd row) females. The OP patient has the highest PWPD but the lowest MMF and MMPD. From Ref. (91) with permission.
UTE quantitative susceptibility mapping
Susceptibility is an important material property. QSM techniques can estimate calcium and iron accumulation in the brain (92). Bone susceptibility is more challenging to measure due to the lack of signal. UTE can detect phase evolution in cortical and trabecular bone. The phase changes with increasing TEs can be used to evaluate bone susceptibility using various algorithms such as Morphology Enabled Dipole Inversion (MEDI) (93). UTE with QSM (UTE-QSM) provides information about bone susceptibility, which is indirectly related to bone mineral (93–98). Figure 10 shows UTE-QSM and µCT-measured volumetric BMD (vBMD) of a human bone sample, with an excellent linear correlation between QSM and vBMD (n=9). UTE-QSM can reliably evaluate vBMD in cortical bone. Similar results are also observed for trabecular bone.
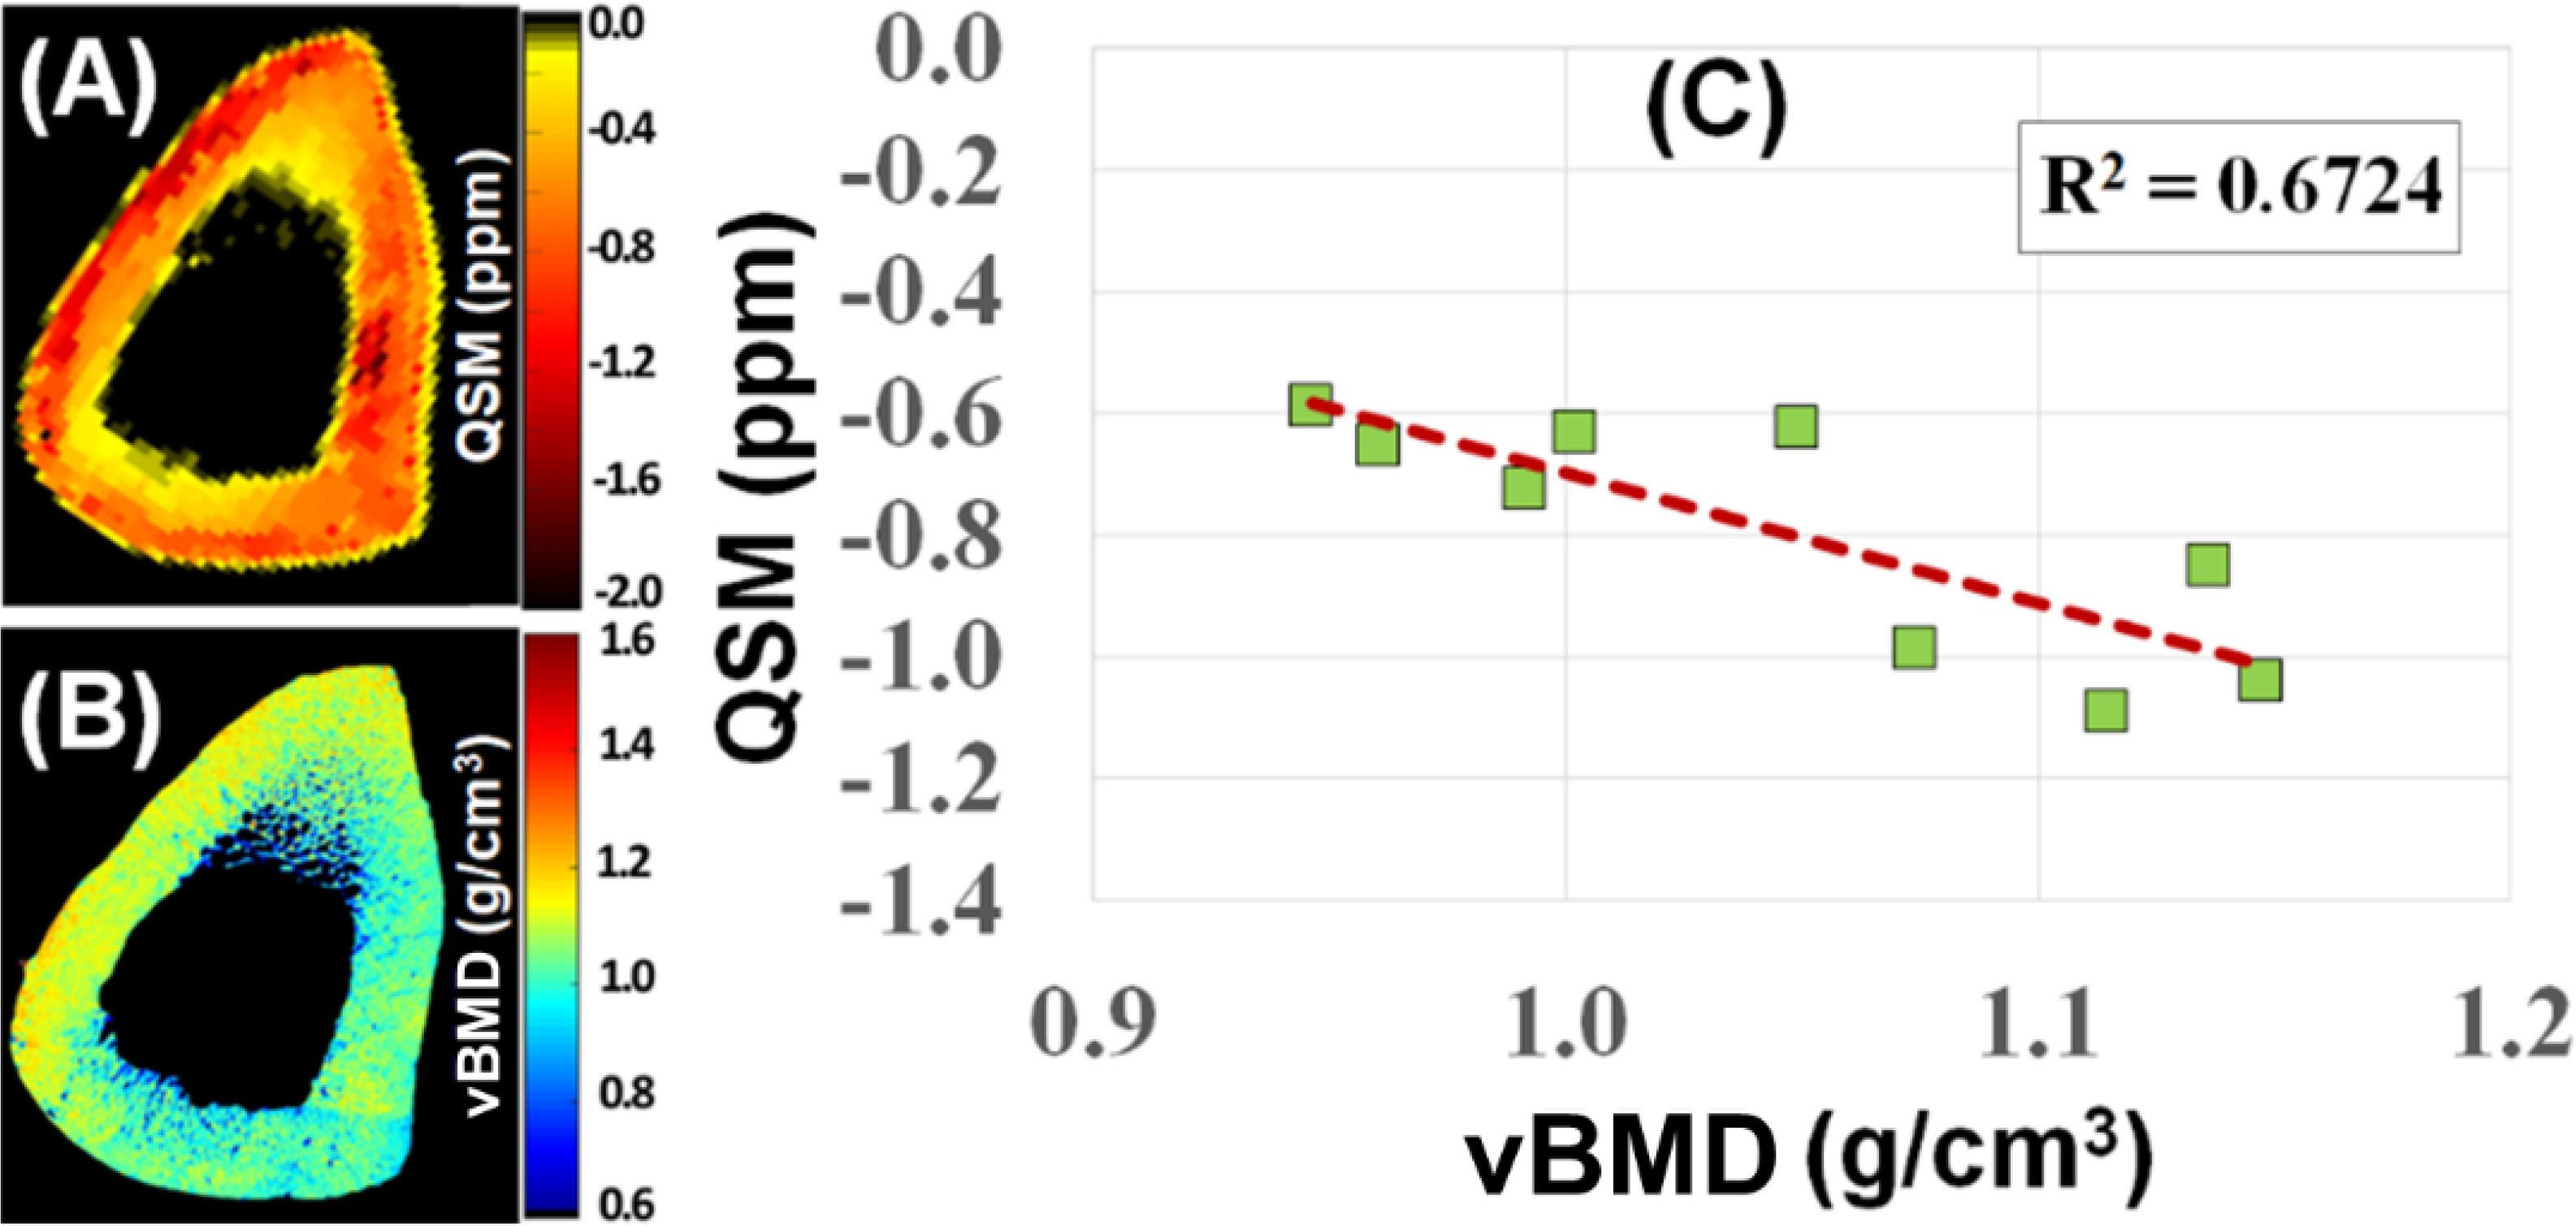
Figure 10. UTE-QSM (A) and µCT volumetric BMD (vBMD) (B) maps of a human cortical bone sample. A negative correlation (R2 = 0.6724) was observed between QSM and vBMD (n=9) (C). From Ref. (98) with permission.
UTE perfusion
There is a close association between bone perfusion and bone remodeling and fracture repair (99–102). Increased cortical bone turnover and inflammation are also associated with increased blood flow (99). There is a strong correlation between bone perfusion and BMD (101, 102). However, the nature of bone makes it difficult to investigate perfusion. The techniques applicable to many soft tissues are difficult or impossible to apply to bone. For example, dynamic contrast-enhanced MRI (DCE-MRI) can be used to study perfusion in various tissues and organs. The technique employs fast T1-weighted images to capture signal changes induced by exogenous intravascular nondiffusible gadolinium-based contrast agents as a function of time. Conventional DCE-MRI can study perfusion in the marrow of trabecular bone (103), but cannot study perfusion in cortical bone due to the lack of detectable signal. Dynamic UTE imaging has been developed to evaluate perfusion in cortical bone (104, 105). A recent study reported dynamic 2D UTE imaging of the tibial midshaft of a 38-year-old healthy volunteer and found ~20% signal enhancement after intravenous gadolinium contrast injection (105). Kinetic analysis demonstrated a Ktran of 0.23 ± 0.09 min-1 and Kep of 0.58 ± 0.11 min-1 for the tibial midshaft of this volunteer. DCE-UTE can potentially be used to evaluate bone remodeling and fracture recovery.
Other UTE-type sequences for bone quantification
Bone components (water, collagen, mineral) and microstructure (cortical porosity, trabecular structure) can be qualified by many other UTE-type sequences such as ZTE (25–36), PETRA (37–39), vTE (40), WASPI (41), and SWIFT (42). For example, WASPI has been used to image bone water and the solid matrix of bone (106). SWIFT has been shown to be able to identify the presence and extent of dental caries and fine structures of the teeth, including cracks and accessory canals (107). Furthermore, solid-state 31P MRI can be achieved with UTE-type sequences by focusing on the 31P peak (108). 31P UTE MRI can map phosphorus content, assess bone mineral density, and differentiate between mature and newly remodeled bone (108, 109).
Part III: applications in OP
UTE-measured pore water to assess cortical porosity
UTE MRI can be used to measure pore water concentration in cortical bone (23, 76, 84–88). A recent study showed a high correlation (R2 = 0.72; P < 0.0001) between μCT porosity and pore water concentration in 32 cadaveric human cortical bone samples (Figure 11) (77). Water residing in the microscopic pores of cortical bone is expected to behave more like “free” water with much longer T2* relaxation time than water bound to the organic matrix. Therefore, separating pore water from bound water is easy, allowing accurate pore water mapping without requiring ultrahigh spatial resolution to resolve the small pores. This is confirmed by the high correlation with an R2 of 0.72 between μCT porosity and pore water concentration in cortical bone. μCT porosity is consistently lower than pore water content assessed by UTE MRI. Pore water content in cortical bone is also significantly correlated with its mechanical properties (110–112). In another study, UTE MRI, μCT, and histomorphometry were performed on tibial samples from 11 donors. UTE-measured pore water content showed significant correlations (R2>0.25) with histomorphometry-based lacunae and small Haversian canals, which are below the detectable range of μCT at 9 μm. The μCT-based porosity showed strong correlations with histomorphometric porosity and pore size when considering all pores or only large pores (R>0.70, P<0.01). Correlations were poor when considering only small pores in histomorphometric analyses (R<0.3) (88). Therefore, pore water in smaller pores can be detected by UTE MRI but not by μCT imaging.
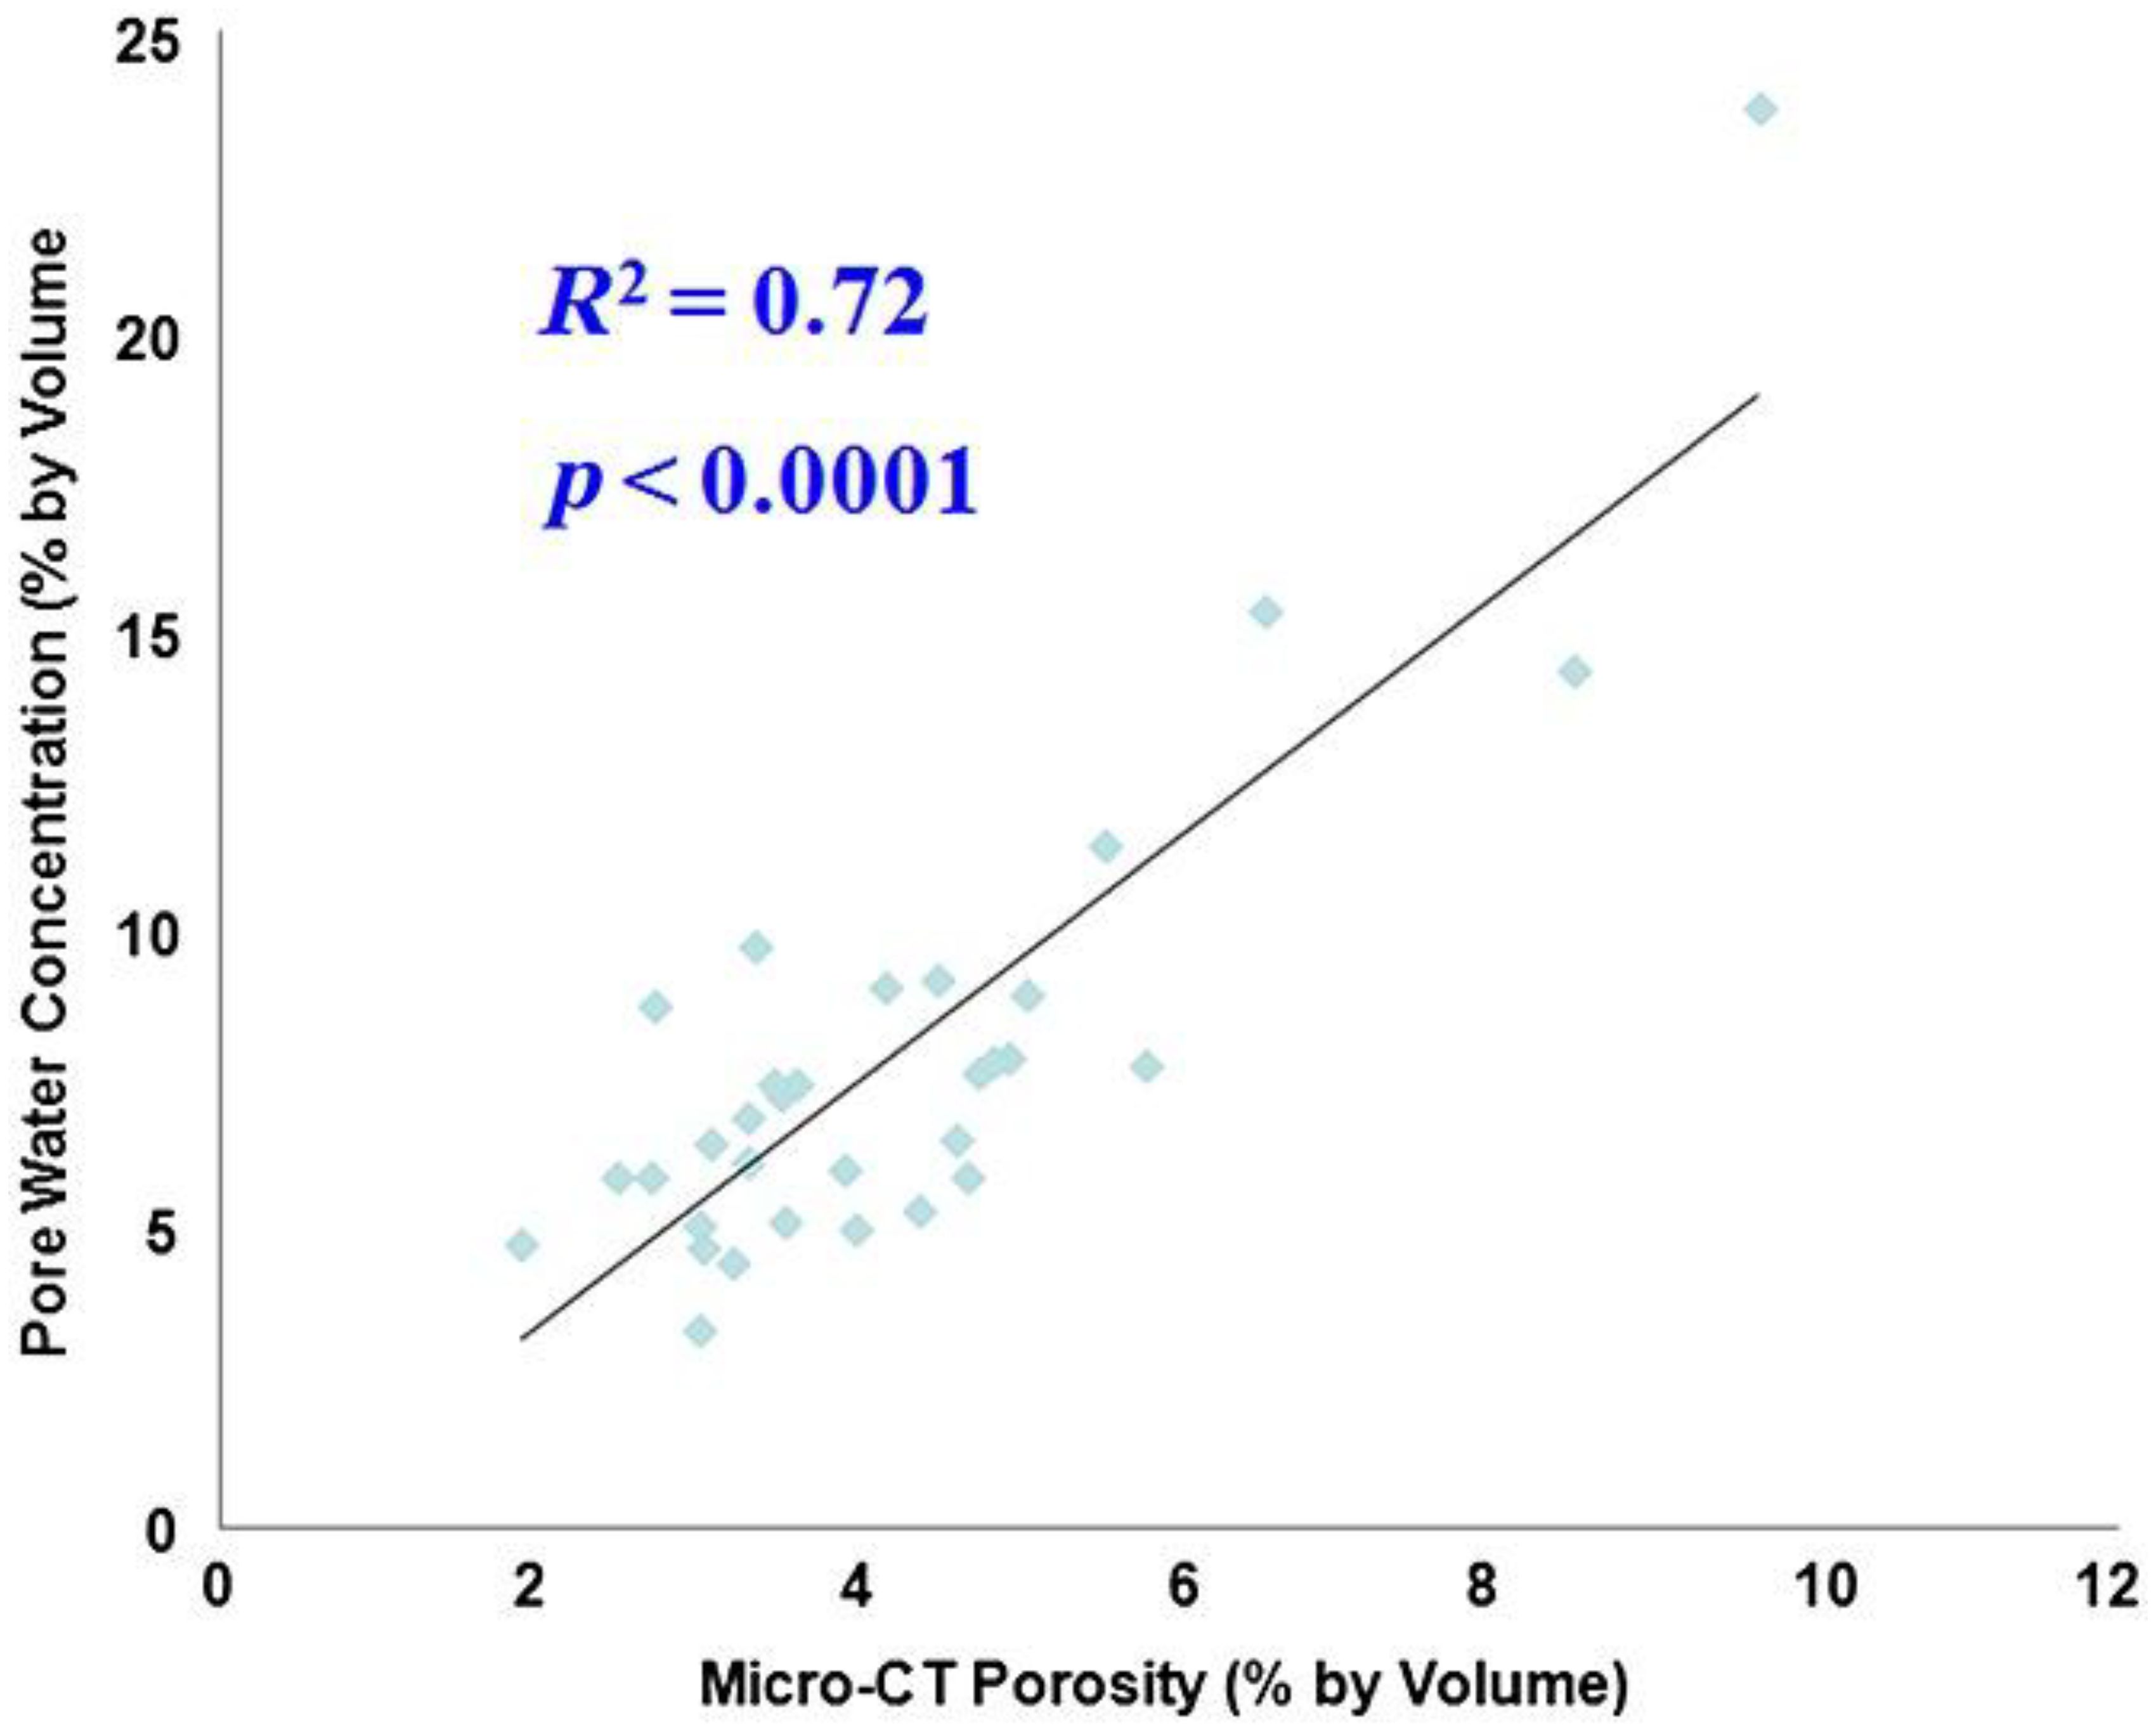
Figure 11. Correlation between UTE-measured pore water concentration and μCT-measured porosity in cadaveric human cortical bone samples (n = 32). A high correlation (R2 = 0.72; P < 0.0001) was observed between UTE pore water concentration and μCT porosity, suggesting that UTE sequences can reliably access pore water in cortical bone using a clinical MR scanner. From Ref. (77) with permission.
UTE measured bound water to assess bone organic matrix density
UTE MRI can map bound water in cortical and trabecular bone (21, 23, 60). Bound water is a surrogate of bone organic matrix density and negatively correlates with bone mineral density, as shown in Figure 12 (113). It is also reported that bound water in human cortical bone decreases with age, although osteonal remodeling throughout life with only modest changes in tissue mineral density or ash fraction with age after skeletal maturation (114). Bound water and bone density are directly correlated with human cortical bone’s material strength (72, 84, 111, 112).
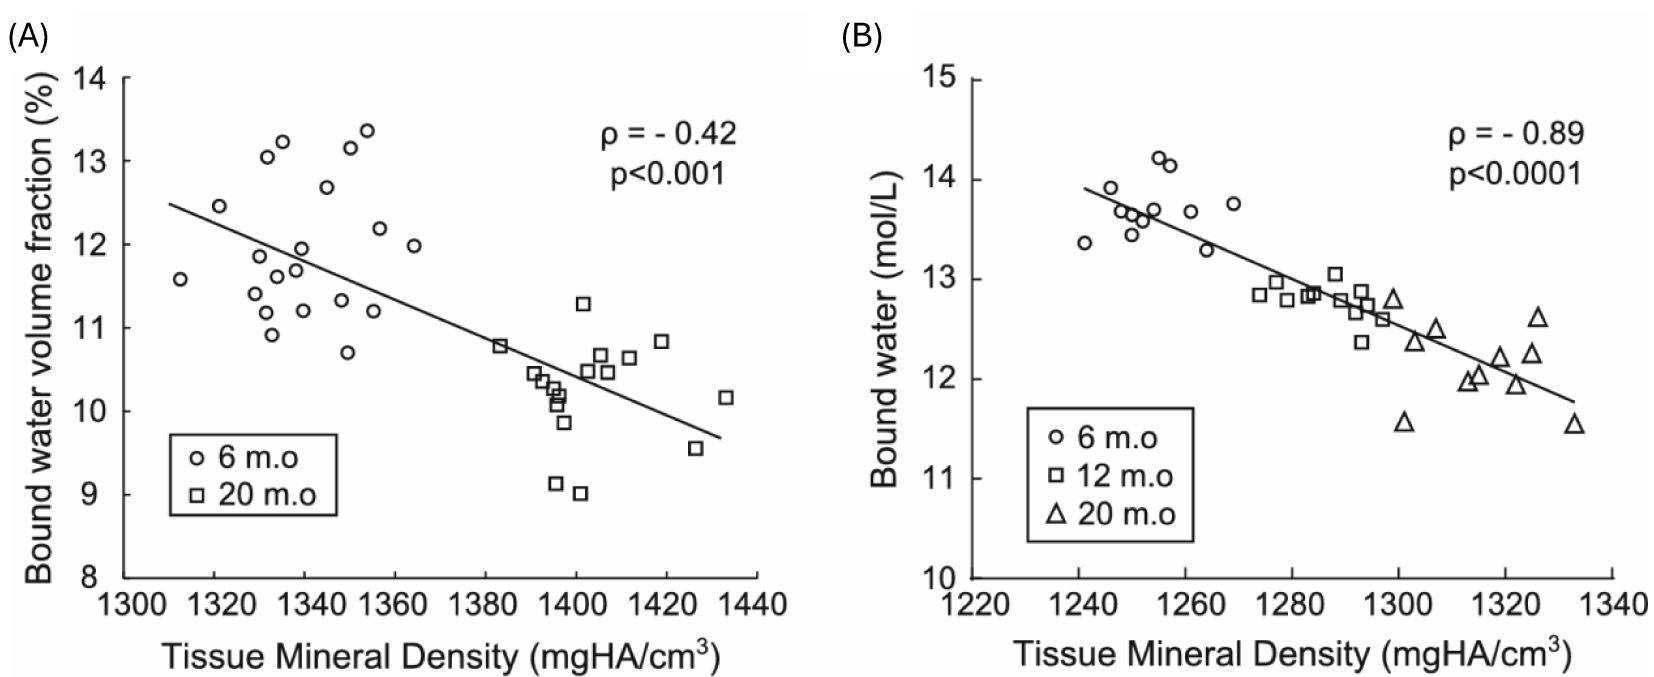
Figure 12. Bound water decreases as mineralization increases in rodents throughout life, as evidenced in mice (A) and rats (B), where bound water was calculated as the volume fraction of the bone tissue volume (%) or as the concentration of protons (mol/L) in the bone tissue volume in which μCT determined the latter. Spearman’s rank correlation was performed to calculate the correlation coefficient (ρ). From Ref. (113) with permission.
UTE-MT measures to assess bone mechanical properties
UTE-MT can indirectly assess collagen backbone protons, providing information about cortical porosity and mechanical properties (73, 81–83). A recent study reported a moderate to strong negative correlation between UTE magnetization transfer ratio (MTR) and μCT porosity (R2 = 0.46–0.51), while a moderate positive correlation was observed between MTR and yield stress (R2 = 0.25–0.30) and failure stress (R2 = 0.31–0.35).A weak positive correlation (R2 = 0.09–0.12) between MTR and Young’s modulus at all off-resonance saturation frequencies was also observed (115). UTE-MT measured MTR provides quantitative information on cortical bone and is sensitive to μCT porosity and biomechanical function. MMF derived from UTE-MT imaging can assess mechanical failures after bone stress injury, which is difficult to evaluate using other techniques (83). In another study (73), fibular samples (n=14) were subject to cyclic loading using a 4-point bending setup (Figure 13). Loading was applied to reduce bone stiffness by 20%. Then, bone samples were imaged with UTE MRI and μCT before and after loading. MMF from two-pool UTE-MT modeling decreased by 12% on average, while μCT porosity measured at 6 μm voxel size showed no significant change. A representative sample is shown in Figure 13, with averaged MMF decreasing from 63% to 55% (p=0.0001), but no detectable changes in μCT porosity (73).
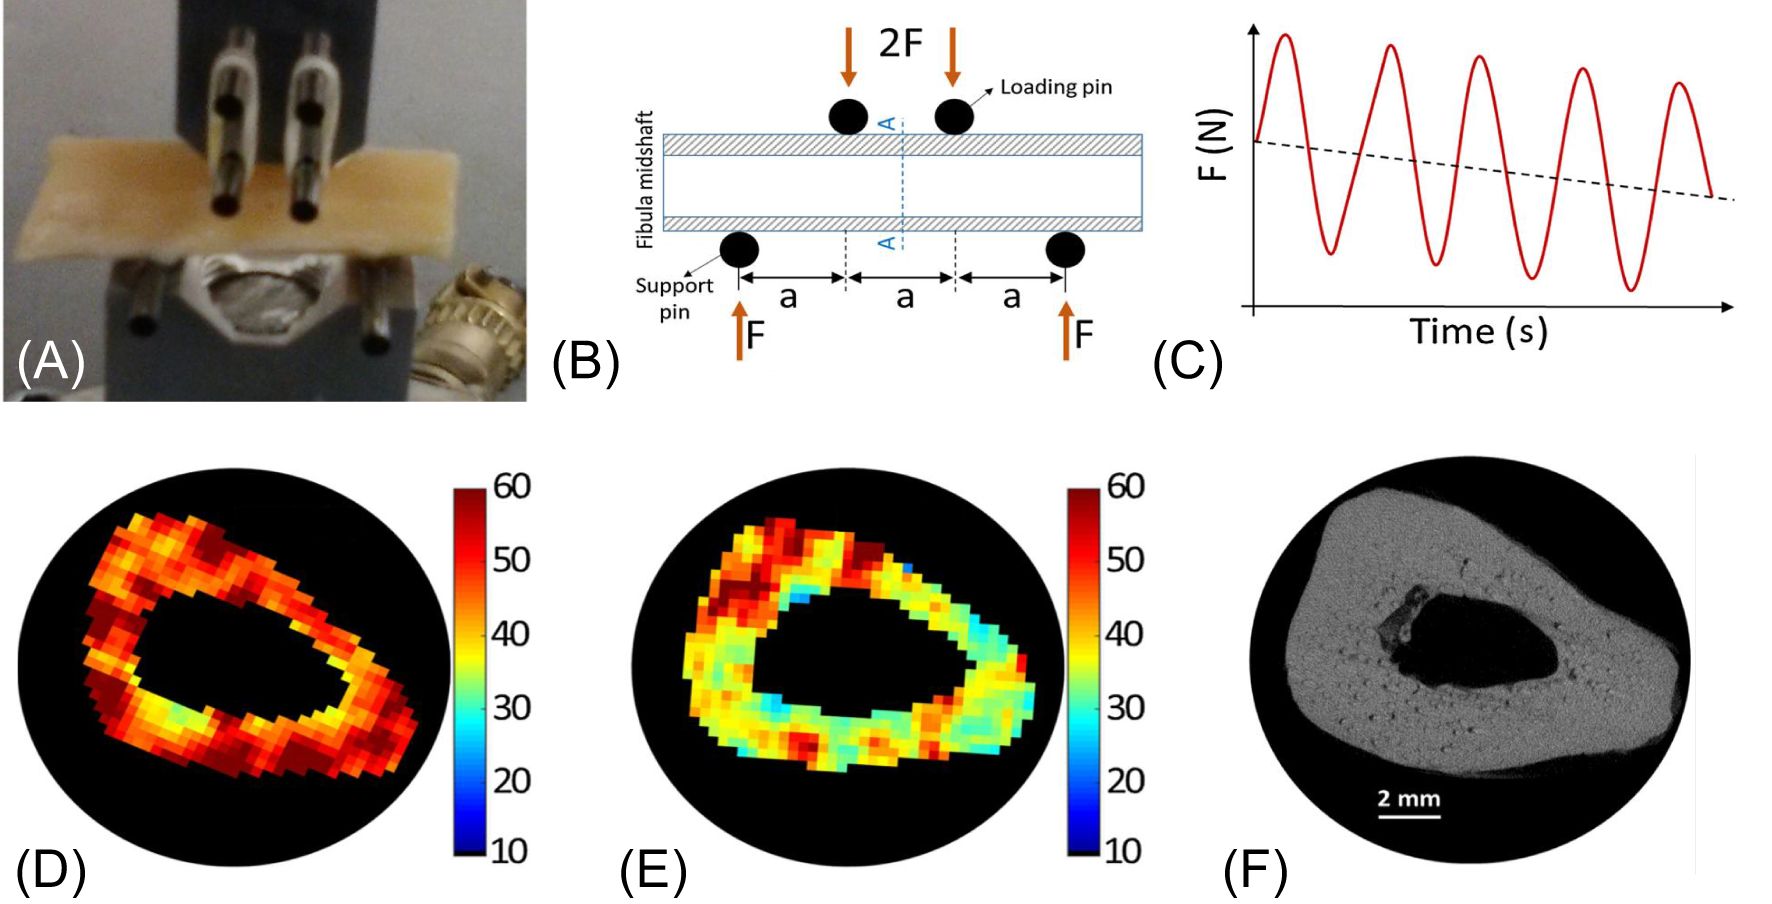
Figure 13. A representative 4-point bending setup and force-time diagram (A-C), as well as MMF maps before (D) and after (E) loading with marked changes but little change in µCT image and porosity map (F). From Ref. (73) with permission.
UTE biomarkers for comprehensive assessment of bone and fracture risk
In recent years, many studies have shown that UTE MRI can provide markers of cortical bone porosity, morphologic structure, mineralization, and osteoid density, which are useful measures of bone health (20–23, 76, 84–91, 116–120). In a recent study, Jones et al. reported UTE MRI of 15 participants with OP and 19 without OP (117). The OP group showed elevated pore water (11.6 mol/L vs. 9.5 mol/L; P = 0.007) and total water densities (21.2 mol/L vs. 19.7 mol/L; P = 0.03), and lower cortical bone thickness (4.8 mm vs. 5.6 mm; P < 0.001) and 31P density (6.4 mol/L vs. 7.5 mol/L; P = 0.01) than the non-OP group, respectively. Meanwhile, there was no evidence of a difference in bone water (BW) or 31P-to-BW concentration ratio. Furthermore, pore and total water densities were inversely associated with DXA and HR-pQCT measured BMD (P < 0.001) (117). In another study, Jerban et al. investigated the differences in water and collagen contents in tibial cortical bone between female osteopenia (OPe) patients, osteoporosis (OPo) patients, and young participants (Young) using a clinical 3T scanner (91). They found MMF, BWPD, and MMPD were significantly lower in OPo patients than in the young group, whereas T1, TWPD, and PWPD were significantly higher in OPo patients. The largest OPo/Young average percentage differences were found in MMF (41.9%), PWPD (103.5%), and MMPD (64.0%), with PWPD significantly higher (50.7%), while BWPD significantly lower (16.4%) in OPe than the Young group on average. Meanwhile, MMF was significantly lower (27%) in OPo patients compared with OPe group (91). As a result, UTE-MRI measured TWPD, PWPD, and MMF were recommended to evaluate individuals with OPe and OPo. Manhard et al. also demonstrated the feasibility of quantitatively mapping bound and pore water in vivo in human cortical bone with practical human MR imaging constraints (84). Jacobson et al. reported a comprehensive set of UTE MRI biomarkers to assess cortical bone. They found the UTE MRI-derived porosity index and signal-intensity-based estimated BMD correlated with the HR-pQCT variables (porosity: r = 0.73, p = 0.006; BMD: r = 0.79, p = 0.002) (120).
UTE MRI has also been used to assess fracture risk. In a recent study, Nyman et al. quantified bound water concentration (Cbw) and pore water concentration (Cpw) in the radius and tibia as predictors of bone fragility (121). Maps of Cbw and Cpw were acquired from the uninjured distal third radius of 20 patients who experienced a fragility fracture of the distal radius (Fx) and 20 healthy controls (Non-Fx), and from the tibia mid-diaphysis of 30 women with clinical OP (low T-scores) and 15 women without OP (normal T-scores). They found Cbw was significantly lower (p = 0.0018) and Cpw was higher (p = 0.0022) in the Fx group than in the Non-Fx group. The area-under-the-receiver operator characteristics curve (AUC with 95% confidence intervals) was 0.73 (0.56, 0.86) for hip BMD (best predictors without MRI) and 0.86 (0.70, 0.95) for the combination of Cbw and Cpw (best predictors overall), as shown in Figure 14. Meanwhile, Cbw was significantly lower (p = 0.0005) in women with OP (23.8 ± 4.3 1H mol/L) than in women without OP (29.9 ± 6.4 1H mol/L). They also found that it was Cbw, not Cpw, which was sensitive to bone-forming osteoporosis medications over 12 months. Their results are largely consistent with the study by Gallant et al. (122), who found the hydroxyl groups on raloxifene provided a possible explanation for the therapeutic effect of raloxifene, a Food and Drug Administration (FDA)-approved agent that is designed to treat bone loss, decrease fracture risk, and improve bone mechanical properties. The benefits of raloxifene treatment are essentially independent of bone mass changes and are mediated by an increase in matrix-bound water as measured by UTE MRI. The study suggests a cell-independent mechanism that can be utilized for novel pharmacological approaches to enhancing bone strength (122).
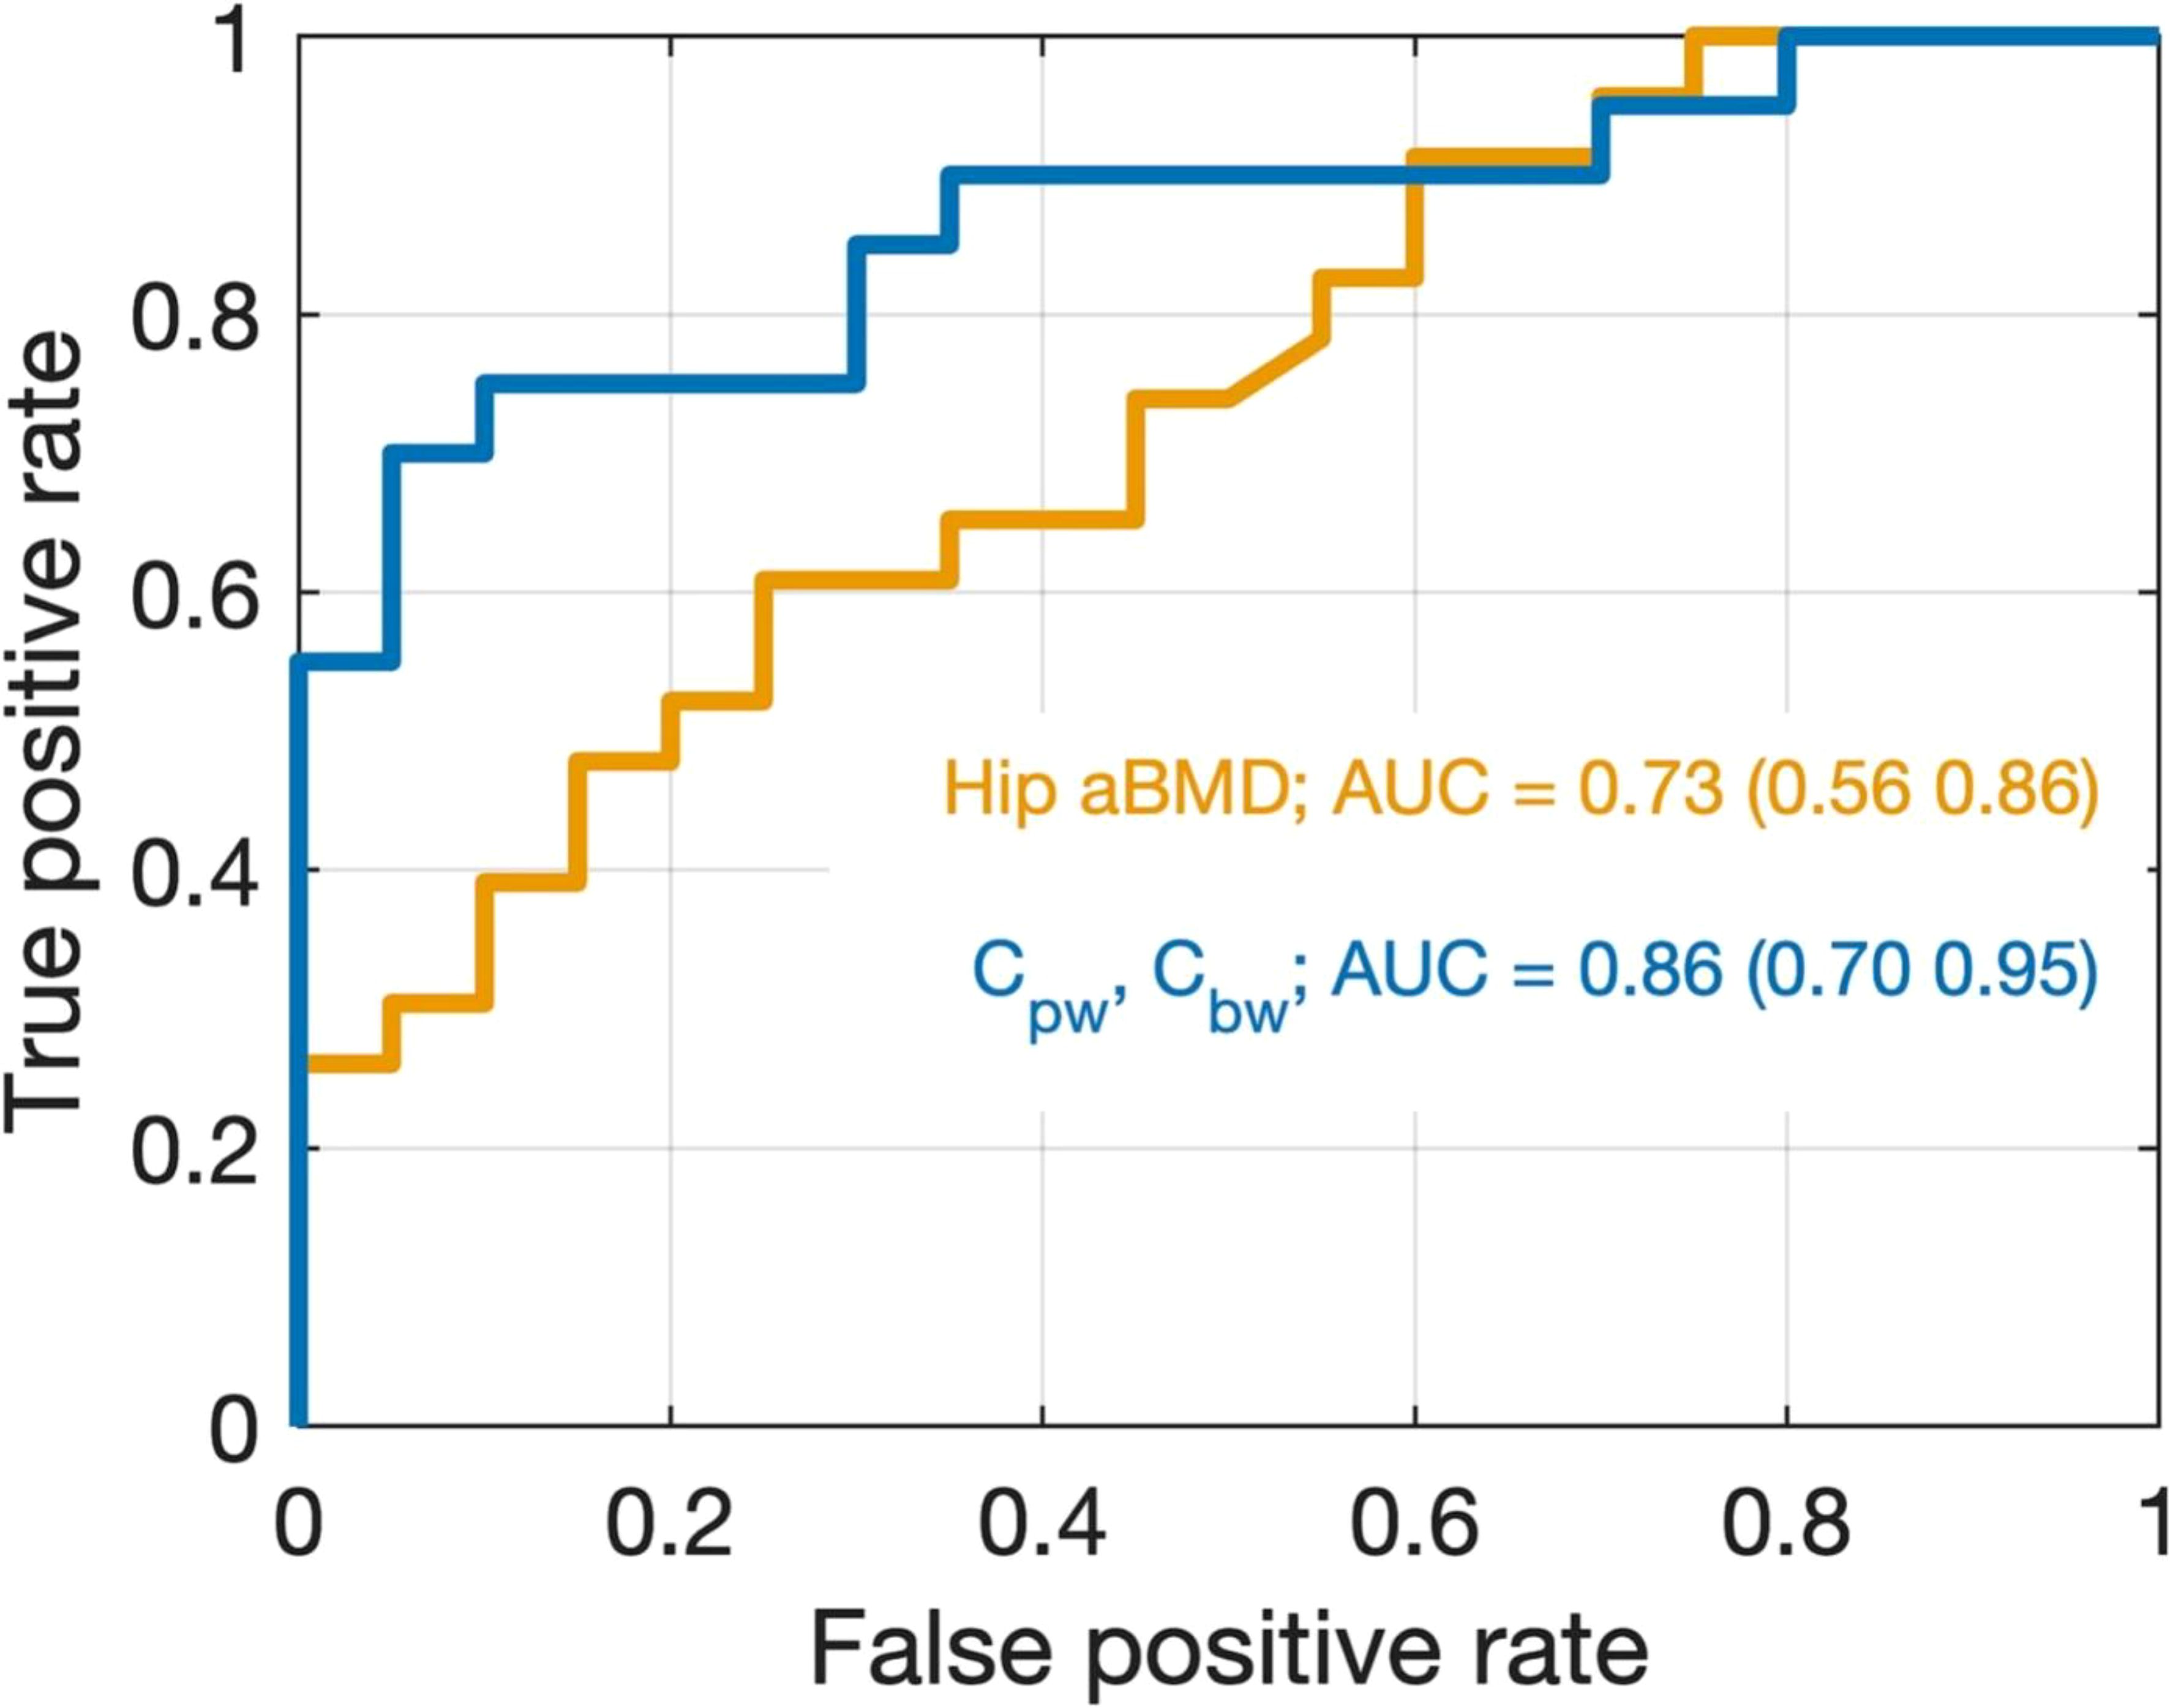
Figure 14. Receiver operating characteristic (ROC) curves for discriminating between non-fracture and distal radius fracture cases using two logistic regression models. The model in orange uses only hip BMD as a predictor which was the best model found without the inclusion of UTE MRI data. The model in blue uses both Cpw and Cbw as predictors, which was the best overall model. Although the 95% CIs of the AUCs overlap, the data are trending toward the conclusion that the UTE MRI better discriminates Fx from Non-Fx patients than does DXA in the present study. From Ref. (121) with permission.
Contrast-enhanced UTE to monitor fracture repair
Bone is highly vascularized. Perfusion plays an important role in the growth and development of bone as well as in disease and healing (99–102). Reduced perfusion is observed in the trabecular bone of patients with OP (98). It is believed that decreased osseous vascularity contributes to increased fracture risk (123). Reduced perfusion occurs in synchrony with reduced BMD in vertebral trabecular bone (124). UTE can be used to evaluate bone perfusion (104, 105). There is an extensive enhancement in blood vessels due to fracture of the tibial plateau two days after injury, with specific enhancement of the periosteum distinguished from that of blood vessels, as shown in Figure 15 (104). Even without contrast enhancement, UTE can detect callus formation from a 22-year-old male with a fractured tibia examined 3 weeks after injury (125).
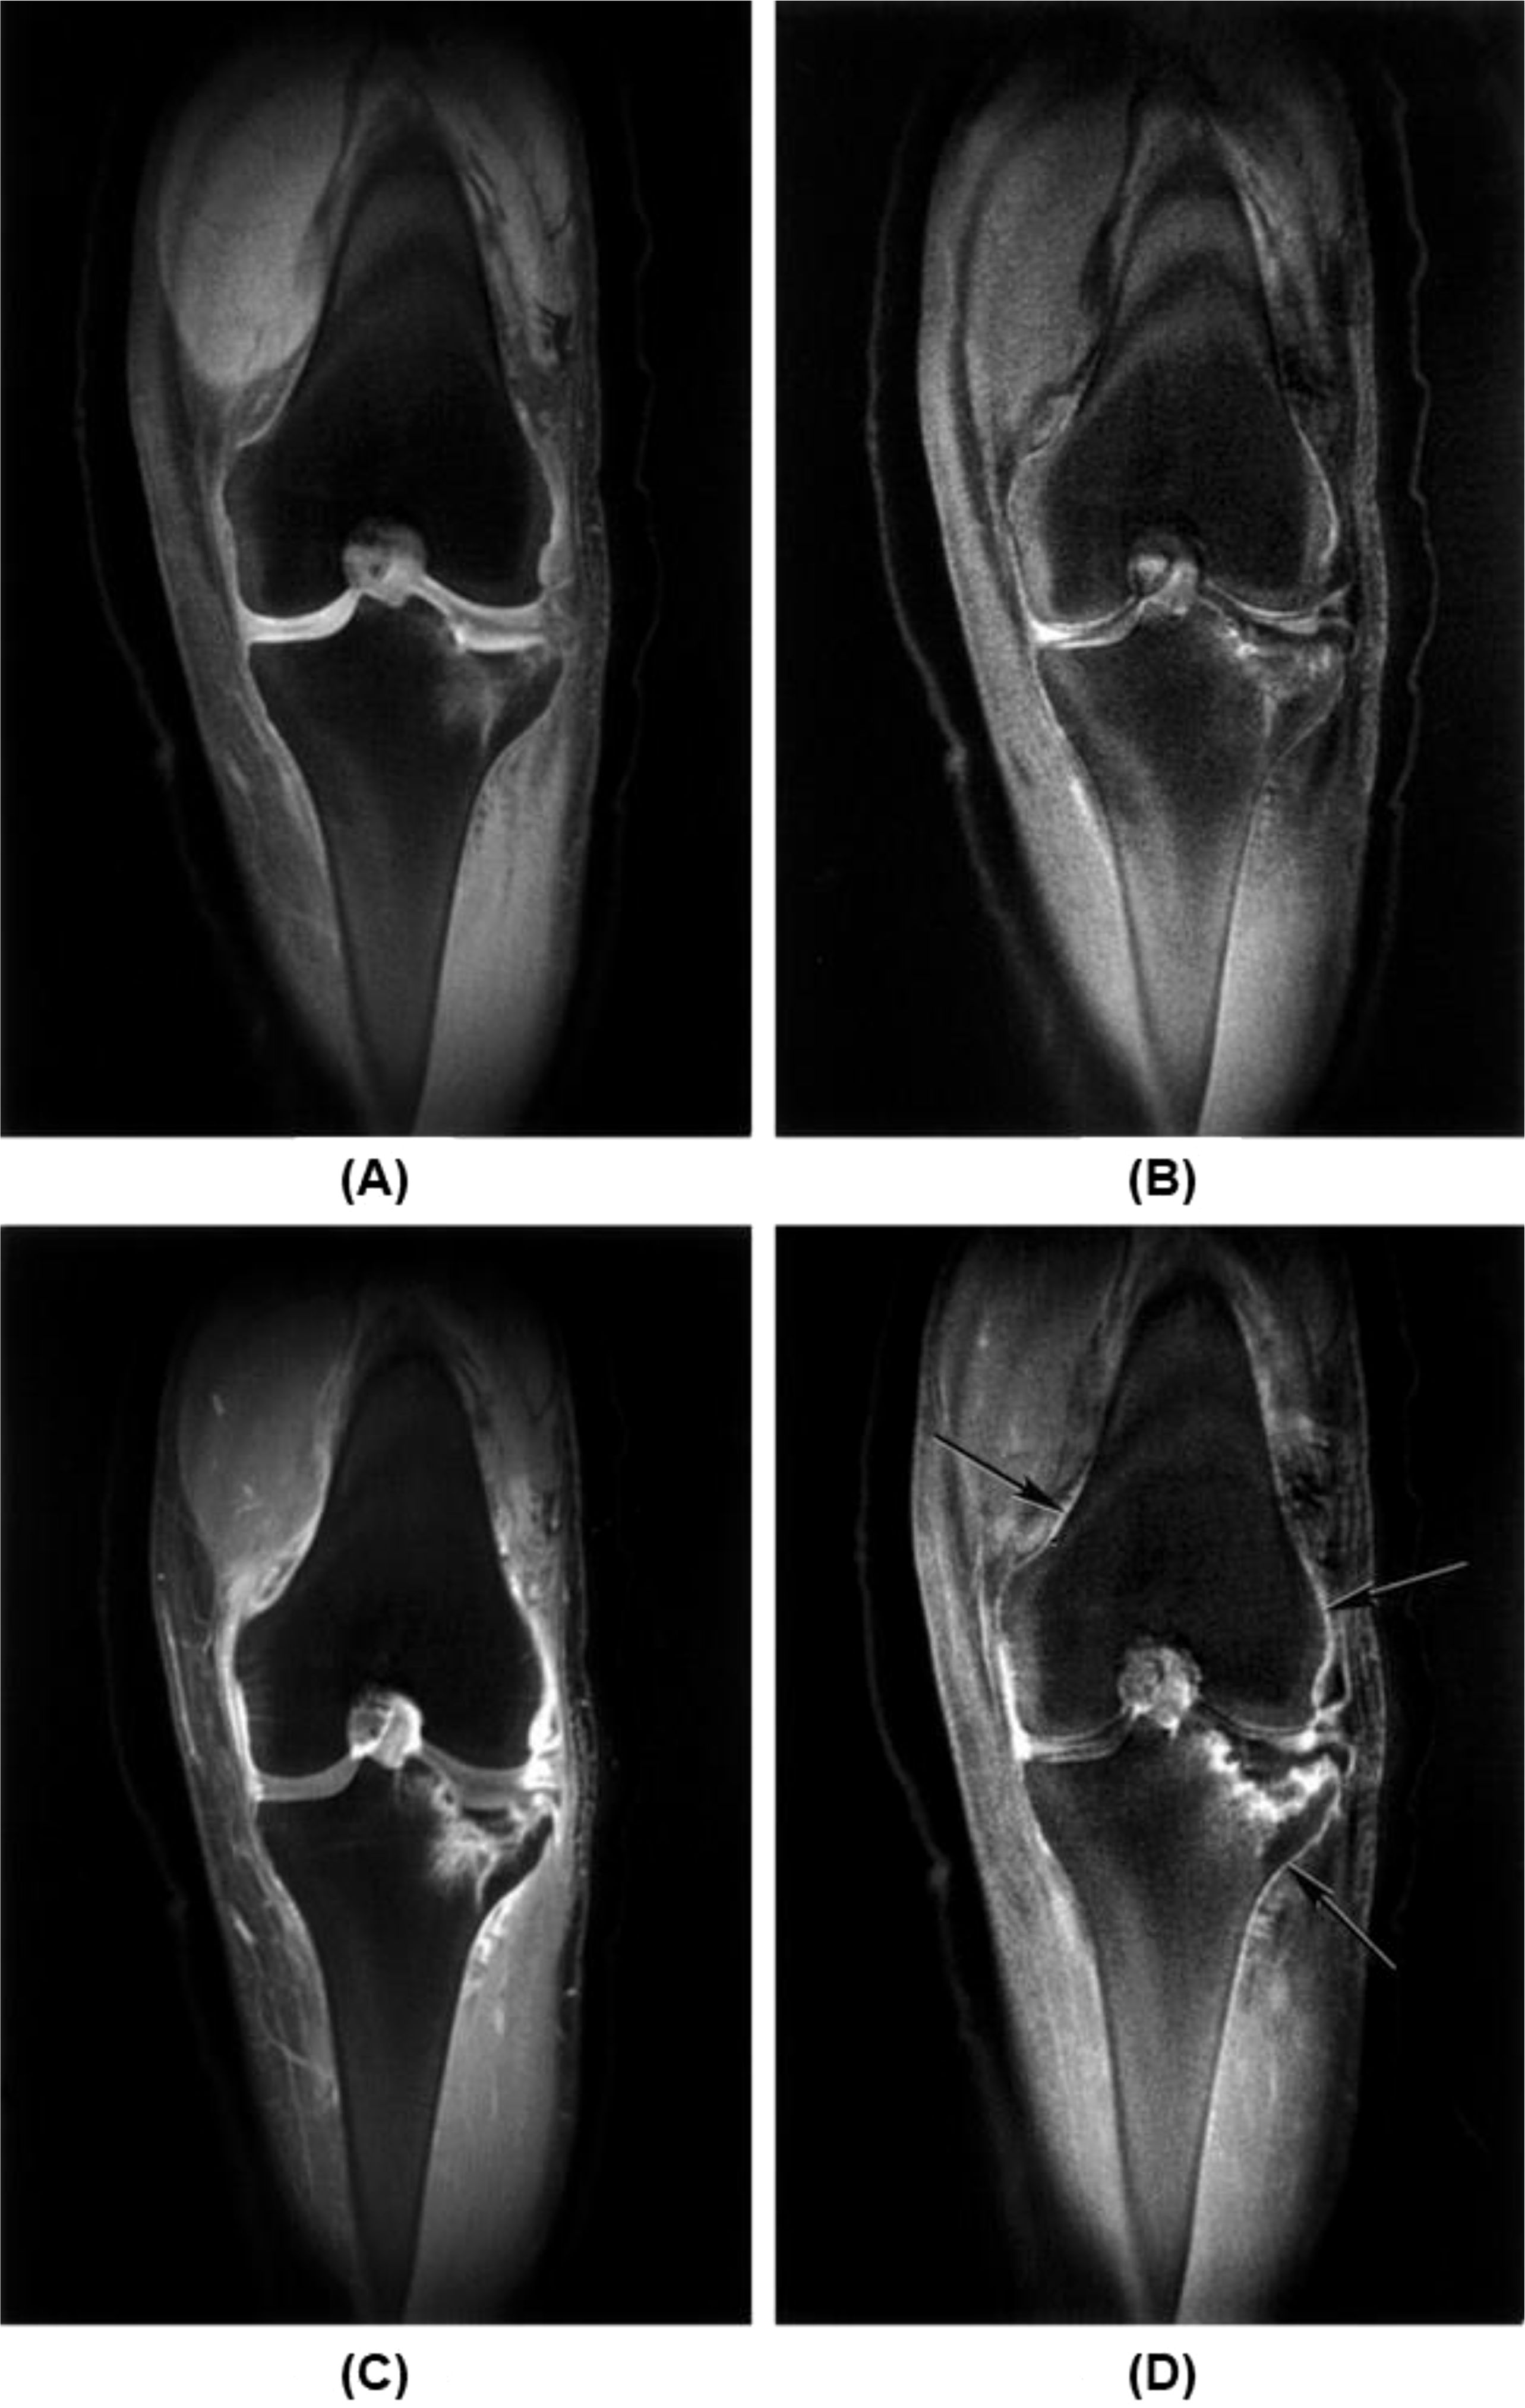
Figure 15. Fracture of tibial plateau 2 days after injury is seen with coronal fat-suppressed UTE (TR/TE=500/0.08 ms) (A) and echo subtraction (TE=0.08 minus TE=17.7 ms) (B) images before enhancement and the corresponding images (C, D) after enhancement, with extensive enhancement in blood vessels in (C) and specific enhancement of the periosteum in (D). From Ref. (104) with permission.
Discussion
UTE-MRI techniques offer significant advancements in assessing cortical and trabecular bone properties, providing valuable insights beyond traditional imaging methods, such as DXA, CT, HR-pQCT, ultrasound, and conventional MRI (24–26). High signal and contrast can be created for cortical and trabecular bone through a series of contrast mechanisms outlined in this review article. Techniques like ZTE MRI offer a radiation-free alternative for generating CT-like bone contrast. A series of quantitative UTE MRI techniques are also introduced. The ability to quantify total, bound, and pore water content has shown strong correlations with bone microstructure, mechanical properties, and age-related changes, making them promising biomarkers for evaluating fracture risk and osteoporosis. More advanced techniques, such as UTE-QSM and UTE-MT (72, 73, 77–83, 92–98, 126–128), enable us to evaluate bone mineral content and organic matrix density. Dynamic UTE imaging provides information about bone perfusion and modeling and can be used to monitor fracture healing (104, 105).
The UTE MRI techniques may provide new opportunities in assessing bone properties and fracture risk in not only osteoporosis but also other metabolic diseases such as osteopenia, osteomalacia, Paget’s disease, hypophosphatasia, chronic kidney disease–mineral and bone disorder, diabetes, etc. For example, type 2 diabetes (T2D) is characterized by normal or high BMD but impaired bone strength (129–131). Animal and specimen studies indicate that brittle behavior in T2D bone is primarily due to a substantial reduction in collagen capacity for deformation (132–138). High glucose levels lead to the creation of advanced glycation end-products (AGEs), which cause non-enzymatic crosslinking, thereby increasing brittleness of the otherwise elastic collagen fibers and reducing bone toughness (132–138). Quantitative magnetization transfer MRI has been extensively studied to probe extracellular matrix (ECM) and measure the crosslinking of collagen and other polymers (139–141). UTE-MT modeling can measure collagen backbone proton fraction and exchange rates between water and collagen protons (73, 78–83). The exchange rates can be used to assess collagen crosslinking and potentially explain the impaired bone strength in T2D (137, 142).
This review has several limitations. First, the review summarized solid-state 1H UTE techniques. 31P UTE MRI techniques and their applications were only briefly mentioned without systematic discussion. Second, the review only discussed applications in OP. The UTE MRI techniques can also be applied to other metabolic bone diseases.
Conclusion
With a decade of technical development, the advanced UTE-type MRI sequences allow direct imaging of bone with high signal and contrast. Quantitative UTE MRI techniques can assess all the major components of bone, including water, collagen, and mineral. Advanced UTE techniques can map different bone water components (total water, bound water, and pore water) and evaluate bone perfusion. UTE sequences can also assess bone microstructure, including cortical porosity and trabecular structure. UTE MRI can map phosphorus content, assess bone mineral density, and differentiate between mature and newly remodeled bone. In summary, UTE MRI provides a comprehensive package to assess all bone components (mineral, collagen, water) and microstructure (cortical porosity, trabecular microstructure) using a single modality for improved detection of bone deficits, with potential advantages over conventional X-ray based techniques which can only assess bone mineral. Further research is needed to establish the clinical significance of these UTE-type MRI techniques.
Author contributions
SS: Conceptualization, Data curation, Formal analysis, Investigation, Methodology, Software, Validation, Visualization, Writing – original draft, Writing – review & editing. H-DC: Conceptualization, Data curation, Formal analysis, Investigation, Methodology, Software, Validation, Visualization, Writing – original draft, Writing – review & editing. AS: Investigation, Methodology, Validation, Writing – original draft, Writing – review & editing. SJ: Investigation, Methodology, Software, Validation, Visualization, Writing – original draft, Writing – review & editing, Conceptualization, Data curation, Formal analysis. EC: Conceptualization, Data curation, Formal analysis, Investigation, Methodology, Software, Validation, Visualization, Writing – original draft, Writing – review & editing. LS: Validation, Writing – original draft, Writing – review & editing. RS: Validation, Writing – original draft, Writing – review & editing. JP: Validation, Writing – original draft, Writing – review & editing. GW: Validation, Writing – original draft, Writing – review & editing. JD: Conceptualization, Data curation, Formal analysis, Funding acquisition, Investigation, Methodology, Project administration, Resources, Software, Supervision, Validation, Visualization, Writing – original draft, Writing – review & editing.
Funding
The author(s) declare financial support was received for the research, authorship, and/or publication of this article. The authors acknowledge grant support from the National Institutes of Health (NIH) (1R01 AR062581, 1R01 AR068987, R01AR075825, R01AR079484, and K01AR080257), the VA Clinical Science Research & Development Service (I01BX005952), and GE Healthcare. The authors declare that this study received funding from GE Healthcare. The funder was not involved in the study design, collection, analysis, interpretation of data, the writing of this article or the decision to submit it for publication.
Conflict of interest
The authors declare that the research was conducted in the absence of any commercial or financial relationships that could be construed as a potential conflict of interest.
Generative AI statement
The author(s) declare that no Generative AI was used in the creation of this manuscript.
Publisher’s note
All claims expressed in this article are solely those of the authors and do not necessarily represent those of their affiliated organizations, or those of the publisher, the editors and the reviewers. Any product that may be evaluated in this article, or claim that may be made by its manufacturer, is not guaranteed or endorsed by the publisher.
References
1. LeBoff MS, Greenspan SL, Insogna KL, Lewiecki EM, Saag KG, Singer AJ, et al. The clinician's guide to prevention and treatment of osteoporosis. Osteoporos Int. (2022) 33:2049–102. doi: 10.1007/s00198-021-05900-y
2. Williams SA, Daigle SG, Weiss R, Wang Y, Arora T, Curtis JR. Economic burden of osteoporosis-related fractures in the US medicare population. Ann Pharmacother. (2021) 55:821–9. doi: 10.1177/1060028020970518
3. Genant HK, Cooper C, Poor G, Reid I, Ehrlich G, Kanis J, et al. Interim report and recommendations of the World Health Organization task-force for osteoporosis. Osteoporos Int. (1999) 10:295–64. doi: 10.1007/s001980050224
4. American Society for Bone and Mineral Research ASBMR Bone Curriculum (2004). Available online at: http://depts.washington.edu/bonebio/ASBMRed/ASBMRed.html (Accessed August 04, 2024).
5. Wehrli FW, Song HK, Saha PK, Wright AC. Quantitative MRI for the assessment of bone structure and function. NMR BioMed. (2006) 19:731–64. doi: 10.1002/nbm.v19:7
6. Turner CH. Bone strength: current concepts. Ann NY Acad Sci. (2006) 1068:429–46. doi: 10.1196/annals.1346.039
7. Viquet-Carrin S, Garnero P, Delmas PD. The role of collagen in bone strength. Osteoporosis Int. (2006) 17:319–36. doi: 10.1007/s00198-005-2035-9
8. Cowin SC. Bone poroelasticity. J Biomechanics. (1999) 32:217–38. doi: 10.1016/S0021-9290(98)00161-4
9. Ritchie RO, Buehler MJ, Hansma P. Plasticity and toughness in bone. Phys Today. (2009) 62:41–7. doi: 10.1063/1.3156332
10. Seeman E, Delmas PD. Bone quality – the material and structural basis of bone strength and fragility. N Engl J Med. (2006) 354:2250–61. doi: 10.1056/NEJMra053077
11. Schreiber JJ, Anderson PA, Hsu WK. Use of computed tomography for assessing bone mineral density. Neurosurg Focus. (2014) 37:E4. doi: 10.3171/2014.5.FOCUS1483
12. Nishiyama KK, Macdonald HM, Buie HR, Hanley DA, Boyd SK. Postmenopausal women with osteopenia have higher cortical porosity and thinner cortices at the distal radius and tibia than women with normal aBMD. J Bone Miner Res. (2010) 25:882–90. doi: 10.1359/jbmr.091020
13. Burghardt AJ, Kazakia GJ, Ramachandran S, Link TM, Majumdar S. Age and gender related differences in the geometric properties and biomechanical significance of intra-cortical porosity in the distal radius and tibia. J Bone Miner Res. (2010) 25:983–93. doi: 10.1359/jbmr.091104
14. Cooper D, Turinsky A, Sensen C, Hallgrimsson B. Effect of voxel size on 3D micro-CT analysis of cortical bone porosity. Calcif Tissue Int. (2007) 80:211–9. doi: 10.1007/s00223-005-0274-6
15. Du J, Bydder GM. Qualitative and quantitative ultrashort-TE MRI of cortical bone. NMR BioMed. (2013) 26:489–506. doi: 10.1002/nbm.v26.5
16. Du J, Bydder GM. Introduction to MRI of Short- and Ultrashort-T2 Tissues. In: Du J, Bydder GM, editors. MRI of Short- and Ultrashort-T2 Tissues: Making the Invisible Visible. Switzerland: Springer (2024). p. 3–10.
17. Conolly S, Nishimura D, Macovski A, Glover G. Variable-rate selective excitation. J Magn Reson. (1988) 78:440–58. doi: 10.1016/0022-2364(88)90131-X
18. Robson MD, Gatehouse PD, Bydder M, Bydder GM. Magnetic resonance: an introduction to ultrashort TE (UTE) imaging. J Comput Assist Tomogr. (2003) 27:825–46. doi: 10.1097/00004728-200311000-00001
19. Rahmer J, Bornert P, Groen J, Bos C. Three-dimensional radial ultrashort echo-time imaging with T2 adapted sampling. Magn Reson Med. (2006) 55:1075–82. doi: 10.1002/mrm.20868
20. Techawiboonwong A, Song HK, Leonard MB, Wehrli FW. Cortical bone water: in vivo quantification with ultrashort echo-time MR imaging. Radiology. (2008) 248:824–33. doi: 10.1148/radiol.2482071995
21. Du J, Carl M, Bydder M, Takahashi A, Chung CB, Bydder GM. Qualitative and quantitative ultrashort echo time (UTE) imaging of cortical bone. J Magn Reson. (2010) 207:304–11. doi: 10.1016/j.jmr.2010.09.013
22. Horch RA, Nyman JS, Gochberg DF, Dortch RD, Does MD. Characterization of 1H NMR signal in human cortical bone for magnetic resonance imaging. Magn Reson Med. (2010) 64:680–7. doi: 10.1002/mrm.22459
23. Manhard MK, Uppuganti S, Granke M, Gochberg DF, Nyman JS, Does MD. MRI-derived bound and pore water concentrations as predictors of fracture resistance. Bone. (2016) 87:1–10. doi: 10.1016/j.bone.2016.03.007
24. Ma Y, Jang H, Jerban S, Chang EY, Chung CB, Bydder GM, et al. Making the invisible visible-ultrashort echo time magnetic resonance imaging: Technical developments and applications. Appl Phys Rev. (2022) 9:041303. doi: 10.1063/5.0086459
25. Ma Y, Jerban S, Jang H, Chang D, Chang EY, Du J. Quantitative ultrashort echo time (UTE) magnetic resonance imaging of bone: an update. Front Endocrinol (Lausanne). (2020) 11:567417. doi: 10.3389/fendo.2020.567417
26. Jerban S, Ma Y, Chang EY, Chung CB, Bydder GM, Du J. A UTE-Based Biomarker Panel in Osteoporosis. In: Du J, Bydder GM, editors. MRI of Short- and Ultrashort-T2 Tissues: Making the Invisible Visible. Switzerland: Springer (2024). p. 427–39.
27. Carl M, Bydder GM, Du J. UTE imaging with simultaneous water and fat signal suppression using a time-efficient multi-spoke inversion recovery pulse sequence. Magn Reson Med. (2016) 76:577–82. doi: 10.1002/mrm.25823
28. Carl M, Jang H, Ma Y, Fung M, Du J. Chapter 4: Three-Dimensional Ultrashort Echo Time (3D UTE) Imaging. In: Du J, Bydder GM, editors. MRI of Short- and Ultrashort-T2 Tissues: Making the Invisible Visible. Switzerland: Springer Nature (2024). p. 29–52.
29. Weiger M, Pruessmann KP, Hennel F. MRI with zero echo time: hard versus sweep pulse excitation. Magn Reson Med. (2011) 66:379–89. doi: 10.1002/mrm.22799
30. Seifert AC, Li C, Wilhelm MJ, Wehrli SL, Wehrli FW. Towards quantification of myelin by solid-state MRI of the lipid matrix protons. Neuroimage. (2017) 163:358–67. doi: 10.1016/j.neuroimage.2017.09.054
31. Jang H, Carl M, Ma Y, Searleman AC, Jerban S, Chang EY, et al. Inversion recovery zero echo time (IR-ZTE) imaging for direct myelin detection in human brain: a feasibility study. Quant Imaging Med Surg. (2020) 10:895–906. doi: 10.21037/qims.2020.04.13
32. Weiger M, Froidevaus R, Baadsvik EL, Brunner DO, Rosler MB, Pruessmann KP. Advances in MRI of the myelin bilayer. NeuroImage. (2020) 217:116888. doi: 10.1016/j.neuroimage.2020.116888
33. Weiger M, Pruessmann KP. Zero echo time (ZTE) MRI. In: Du J, Bydder GM, editors. MRI of Short- and Ultrashort-T2 Tissues: Making the Invisible Visible. Switzerland: Springer (2024). p. 53–66.
34. Breighner RE, Endo Y, Konin GP, Gulotta LV, Koff MF, Potter HG. Technical developments: zero echo time imaging of the shoulder: enhanced osseous detail by using MR imaging. Radiology. (2018) 286:960–6. doi: 10.1148/radiol.2017170906
35. Breighner RE, Potter HG. CT-like Contrast for Bone Imaging with ZTE-MRI. In: Du J, Bydder GM, editors. MRI of Short- and Ultrashort-T2 Tissues: Making the Invisible Visible. Switzerland: Springer (2024). p. 549–59.
36. Lu A, Gorny KR, Ho M-L. Zero TE MRI for craniofacial bone imaging. AJNR Am J Neuroradiol. (2019) 40:1562–6. doi: 10.3174/ajnr.A6175
37. Grodzki DM, Jakob PM, Heismann B. Ultrashort echo time imaging using pointwise encoding time reduction with radial acquisition (PETRA). Magn Reson Med. (2012) 67:510–8. doi: 10.1002/mrm.23017
38. Li C, Magland JF, Zhao X, Seifert AC, Wehrli FW. Selective in vivo bone imaging with long-T suppressed PETRA MRI. Magn Reson Med. (2017) 77:989–97. doi: 10.1002/mrm.26178
39. Grodzki DM. Pointwise encoding time reduction with radial acquisition (PETRA) MRI. In: Du J, Bydder GM, editors. MRI of Short- and Ultrashort-T2 Tissues: Making the Invisible Visible. Switzerland: Springer (2024). p. 67–76.
40. Hager B, Juras V, Zaric O, Szomolanyi P, Trattnig S, Deligianni X. The variable echo time (vTE) sequence. In: Du J, Bydder GM, editors. MRI of Short- and Ultrashort-T2 Tissues: Making the Invisible Visible. Switzerland: Springer (2024). p. 107–18.
41. Wu Y, Chesler DA, Glimcher ML, Garrido L, Wang J, Jiang HJ, et al. Multinuclear solid state three dimensional MRI of bone and synthetic calcium phosphates. Proc Nat Acad Sci USA. (1999) 96:1574–8. doi: 10.1073/pnas.96.4.1574
42. Idiyatullin D, Corum C, Park JY, Garwood M. Fast and quiet MRI using a swept radiofrequency. J Magn Reson. (2006) 181:342–9. doi: 10.1016/j.jmr.2006.05.014
43. Qian Y, Williams A, Chu CR, Boada FE. High-resolution ultrashort echo time (UTE) imaging on human knee with AWSOS sequence at 3.0 T. J Magn Reson Imaging. (2012) 35:204–10. doi: 10.1002/jmri.22639
44. Jang H, Shin SH, Carl M, Ma Y, Du J. Ramped hybrid encoding. In: Du J, Bydder GM, editors. MRI of Short- and Ultrashort-T2 Tissues: Making the Invisible Visible. Switzerland: Springer (2024). p. 77–90.
45. Wiesinger F, Menini A, Solana AB. Looping star. Magn Reson Med. (2019) 81:57–68. doi: 10.1002/mrm.27440
46. Du J, Bydder M, Takahashi AM, Carl M, Chung CB, Bydder GM. Short T2 contrast with three-dimensional ultrashort echo time imaging. Magn Reson Imaging. (2011) 29:470–82. doi: 10.1016/j.mri.2010.11.003
47. Sussman MS, Pauly JM, Wright GA. Design of practical T2-selective RF excitation (TELEX) pulses. Magn Reson Med. (1998) 40:890–9. doi: 10.1002/mrm.1910400615
48. Larson PE, Gurney PT, Nayak K, Gold GE, Pauly JM, Nishimura DG. Designing long-T2 suppression pulses for ultrashort echo time imaging. Magn Reson Med. (2006) 56:94–103. doi: 10.1002/mrm.20926
49. Li C, Magland JF, Rad HS, Song HW, Wehrli FW. Comparison of optimized soft-tissue suppression schemes for ultra-short echo time (UTE) MRI. Magn Reson Med. (2012) 68:680–9. doi: 10.1002/mrm.23267
50. Du J, Takahashi A, Bydder M, Chung CB, Bydder GM. Ultrashort TE imaging with off-resonance saturation contrast (UTE-OSC). Magn Reson Med. (2009) 62:527–31. doi: 10.1002/mrm.22007
51. Larson PE, Conolly SM, Pauly JM, Nishimura DG. Using adiabatic inversion pulses for long-T2 suppression in ultrashort echo time (UTE) imaging. Magn Reson Med. (2007) 58:952–61. doi: 10.1002/mrm.21341
52. Du J, Takahashi A, Bae WC, Chung CB, Bydder GM. Dual inversion recovery, ultrashort echo time (DIR UTE) imaging: creating high contrast for short-T2 species. Magn Reson Med. (2010) 63:447–55. doi: 10.1002/mrm.22257
53. Bae W, Dwek JR, Znamirowski R, Statum S, Hermida JC, D’Lima DD, et al. Ultrashort echo time MR imaging of osteochondral junction of the knee at 3 T: Identification of anatomic structures contributing to signal intensity. Radiology. (2009) 254:837–45. doi: 10.1148/radiol.09081743
54. Du J, Carl M, Bae WC, Statum S, Chang EY, Bydder GM, et al. Dual inversion recovery ultrashort echo time (DIR-UTE) imaging and quantification of the zone of calcified cartilage (ZCC). Osteoarthritis Cartilage. (2013) 21:77–85. doi: 10.1016/j.joca.2012.09.009
55. Ma YJ, Zhu Y, Lu X, Carl M, Chang EY, Du J. Short T2 imaging using a 3D double adiabatic inversion recovery prepared ultrashort echo time cones (3D DIR-UTE-Cones) sequence. Magn Reson Med. (2018) 79:2555–63. doi: 10.1002/mrm.26908
56. Johnson EM, Vyas U, Ghanouni P, Pauly KB, Pauly JM. Improved cortical bone specificity in UTE MR Imaging. Magn Reson Med. (2017) 77:684–95. doi: 10.1002/mrm.26160
57. Lee H, Zhao X, Song HK, Zhang R, Bartlett SP, Wehrli FW. Rapid dual-RF, dual-echo, 3D ultrashort echo time craniofacial imaging: A feasibility study. Magn Reson Med. (2019) 81:3007–16. doi: 10.1002/mrm.27625
58. Ma Y, Jang H, Wei Z, Cai Z, Xue Y, Chang EY, et al. Myelin imaging in human brain using a short repetition time adiabatic inversion recovery prepared ultrashort echo time (STAIR-UTE) MRI sequence in multiple sclerosis. Radiology. (2020) 297:392–404. doi: 10.1148/radiol.2020200425
59. Ma Y, Jang H, Wei Z, Wu M, Chang EY, Corey-Bloom J, et al. Brain ultrashort T2 component imaging using a short TR adiabatic inversion recovery prepared dual-echo ultrashort TE sequence with complex echo subtraction (STAIR-dUTE-ES). J Magn Reson. (2021) 323:106898. doi: 10.1016/j.jmr.2020.106898
60. Ma Y, Chen Y, Li L, Cai Z, Zhao W, Jerban S, et al. Trabecular bone imaging using a 3D adiabatic inversion recovery prepared ultrashort echo time cones sequence at 3T. Magn Reson Med. (2020) 83:1640–51. doi: 10.1002/mrm.28027
61. Wurnig MC, Calcagni M, Kenkel D, Vich M, Weiger M, Andreisek G, et al. Characterization of trabecular bone density with ultra-short echo-time MRI at 1.5, 3.0, and 7.0 T - comparison with micro-computed tomography. NMR BioMed. (2014) 27:1159–66. doi: 10.1002/nbm.v27.10
62. Biswas R, Bae W, Diaz E, Masuda K, Chung CB, Bydder GM, et al. Ultrashort echo time (UTE) imaging with bi-component analysis: bound and free water evaluation of bovine cortical bone subject to sequential drying. Bone. (2012) 50:749–55. doi: 10.1016/j.bone.2011.11.029
63. Majumdar S. Magnetic resonance imaging of trabecular bone structure. Top Magn Reson Imaging. (2002) 13:323–34. doi: 10.1097/00002142-200210000-00004
64. Chang G, Deniz CM, Honig S, Rajapakse CS, Egol K, Regatte RR, et al. Feasibility of three-dimensional MRI of proximal femur microarchitecture at 3 tesla using 26 receive elements without and with parallel imaging. J Magn Reson Imaging. (2014) 40:229–38. doi: 10.1002/jmri.24345
65. Bydder M, Carl M, Bydder GM, Du J. MRI chemical shift artifact produced by center-out radial sampling of k-space: A potential pitfall in clinical diagnosis. Quant Imaging Med Surg. (2021) 11:3677–83. doi: 10.21037/qims-21-115
66. Jerban S, Moazamian D, Mohammadi HS, Ma Y, Jang H, Namiranian B, et al. More accurate trabecular bone imaging using UTE MRI at the resonance frequency of fat. Bone. (2024) 184:117096. doi: 10.1016/j.bone.2024.117096
67. Rautiainen J, Salo EN, Tiitu V, Finnila MAJ, Aho OM, Saarakkala S, et al. Assessment of human tibial cartilage-bone interface in osteoarthritis using SWIFT. In: Proceedings of ISMRM 21st Annual Meeting. Salt Lake City, Utah, USA: International Society of Magnetic Resonance in Medicine (ISMRM) (2013). P0434.
68. Wei Z, Ma Y, Jang H, Yang W, Du J. To measure T1 of short T2 species using an inversion recovery prepared three-dimensional ultrashort echo time (3D IR-UTE) method: a phantom study. J Magn Reson. (2020) 314:106725. doi: 10.1016/j.jmr.2020.106725
69. Ma YJ, Lu X, Carl M, Zhu Y, Szeverenyi NM, Bydder GM, et al. Accurate T1 mapping of short T2 tissues using a three-dimensional ultrashort echo time cones actual flip angle imaging-variable repetition time (3D UTE-Cones AFI-VTR) method. Magn Reson Med. (2018) 80:598–608. doi: 10.1002/mrm.27066
70. Ma YJ, Zhao W, Wan L, Guo T, Searleman A, Jang H, et al. Whole knee joint T1 values measured in vivo at 3T by combined 3D ultrashort echo time cones actual flip angle and variable flip angle methods. Magn Reson Med. (2019) 81:1634–44. doi: 10.1002/mrm.27510
71. Yarnykh VL. Actual flip-angle imaging in the pulsed steady state: a method for rapid three-dimensional mapping of the transmitted radiofrequency field. Magn Reson Med. (2007) 57:192–200. doi: 10.1002/mrm.21120
72. Nyman JS, Ni Q, Nicolella DP, Wang X. Measurements of mobile and bound water by nuclear magnetic resonance correlate with mechanical properties of bone. Bone. (2008) 42:193–9. doi: 10.1016/j.bone.2007.09.049
73. Jerban S, Ma YJ, Nazaran A, Dorthe EW, Cory E, Carl M, et al. Detecting stress injury (fatigue fracture) in fibular cortical bone using quantitative ultrashort echo time-magnetization transfer (UTE-MT): an ex vivo study. NMR BioMed. (2018) 31:e3994. doi: 10.1002/nbm.v31.11
74. Xue Y, Ma Y, Wu M, Jerban S, Wei Z, Chang EY, et al. Quantitative 3D ultrashort echo time magnetization transfer (3D UTE-MT) imaging for evaluation of knee cartilage degeneration in vivo. J Magn Reson Imaging. (2021) 54:1294–302. doi: 10.1002/jmri.27659
75. Zhang X, Ma Y, Wei Z, Wu M, Ashir A, Jerban S, et al. Macromolecular fraction (MMF) from 3D ultrashort echo time cones magnetization transfer (3D UTE-Cones-MT) imaging predicts meniscal degeneration and knee osteoarthritis. Osteoarthr Cartil. (2021) 29:1173–80. doi: 10.1016/j.joca.2021.04.004
76. Li C, Seifert AC, Rad HS, Bhagat YA, Rajapakse CS, Sun W, et al. Cortical bone water concentration: dependence of MR imaging measures on age and pore volume fraction. Radiology. (2014) 272:796–806. doi: 10.1148/radiol.14132585
77. Chen J, Grawn S, Shao H, D'Lima D, Bydder GM, Du J. Evaluation of bound and pore water in cortical bone using ultrashort echo time (UTE) magnetic resonance imaging. NMR BioMed. (2015) 28:1754–62. doi: 10.1002/nbm.3436
78. Hodgson RJ, Evans R, Wright P, Grainger AJ, O'connor PJ, Helliwell P, et al. Quantitative magnetization transfer ultrashort echo time imaging of the Achilles tendon. Magn Reson Med. (2011) 65:1372–6. doi: 10.1002/mrm.22715
79. Ma Y, Carl M, Chang EY, Du J. Quantitative magnetization transfer ultrashort echo time imaging using a time-efficient 3D multispoke cones sequence. Magn Reson Med. (2018) 79:692–700. doi: 10.1002/mrm.26716
80. Ma Y, Shao H, Chang EY, Du J. UTE magnetization transfer (UTE-MT) imaging and modeling: magic angle independent biomarkers of tissue properties. NMR BioMed. (2016) 29:1546–52. doi: 10.1002/nbm.v29.11
81. Ma Y, Tadros AS, Du J, Chang EY. Quantitative two-dimensional ultrashort echo time magnetization transfer (2D UTE-MT) imaging of cortical bone. Magn Reson Med. (2017) 79:1941–9. doi: 10.1002/mrm.26846
82. Zhu Y, Cheng X, Ma Y, Wong JH, Xie Y, Du J, et al. Rotator cuff tendon assessment using magic-angle insensitive 3D ultrashort echo time cones magnetization transfer (UTE-Cones-MT) imaging and modeling with histological correlation. J Magn Reson Imaging. (2018) 48:160–8. doi: 10.1002/jmri.25914
83. Jerban S, Ma Y, Wan L, Searleman AC, Jang H, Sah RL, et al. Collagen proton fraction from ultrashort echo time magnetization transfer (UTE-MT) MRI modeling correlates significantly with cortical bone porosity measured with micro-computed tomography (µCT). NMR BioMed. (2019) 32:e4045. doi: 10.1002/nbm.4045
84. Manhard MK, Horch RA, Gochberg DF, Nyman JS, Does MD. In vivo quantitative MR imaging of bound and pore water in cortical bone. Radiology. (2015) 277:221–30. doi: 10.1148/radiol.2015140336
85. Chen J, Grogan SP, Shao H, D'Lima D, Bydder GM, Wu Z, et al. Evaluation of bound and pore water in cortical bone using ultrashort-TE MRI. NMR Biomed. (2015) 28:1754–62. doi: 10.1002/nbm.3436
86. Jerban S, Ma Y, Jang H, Namiranian B, Le N, Shirazian H, et al. Water proton density in human cortical bone obtained from ultrashort echo time (UTE) MRI predicts bone microstructural properties. Magn Reson Imaging. (2020) 67:85–9. doi: 10.1016/j.mri.2020.01.004
87. Jerban S, Ma Y, Li L, Jang H, Wan L, Guo T, et al. Volumetric mapping of bound and pore water as well as collagen protons in cortical bone using 3D ultrashort echo time cones MR imaging techniques. Bone. (2019) 127:120–8. doi: 10.1016/j.bone.2019.05.038
88. Jerban S, Ma Y, Wong JH, Nazaran A, Searleman A, Wan L, et al. Ultrashort echo time magnetic resonance imaging (UTE-MRI) of cortical bone correlates well with histomorphometric assessment of bone microstructure. Bone. (2019) 123:8–17. doi: 10.1016/j.bone.2019.03.013
89. Rajapakse CS, Bashoor-Zadeh M, Li C, Sun W, Wright AC, Wehrli FW. Volumetric cortical bone porosity assessment with MR imaging: validation and clinical feasibility. Radiology. (2015) 276:526–35. doi: 10.1148/radiol.15141850
90. Jerban S, Ma Y, Dorthe EW, Kakos L, Le N, Alenezi S, et al. Assessing cortical bone mechanical properties using collagen proton fraction from ultrashort echo time magnetization transfer (UTE-MT) MRI modeling. Bone Rep. (2019) 11:100220. doi: 10.1016/j.bonr.2019.100220
91. Jerban S, Ma Y, Wei Z, Shen M, Ibrahim Z, Jang H, et al. Ultrashort echo time MRI detects significantly lower collagen but higher pore water in the tibial cortex of female patients with osteopenia and osteoporosis. J Bone Miner Res. (2024) 39:707–16. doi: 10.1093/jbmr/zjae053
92. Wang Y, Liu T. Quantitative susceptibility mapping (QSM): Decoding MRI data for a tissue magnetic biomarker. Magn Reson Med. (2015) 73:82–101. doi: 10.1002/mrm.25358
93. Dimov AV, Liu Z, Spincemaille P, Prince MR, Du J, Wang Y. Bone quantitative susceptibility mapping using a chemical species-specific R2* signal model with ultrashort and conventional echo data. Magn Reson Med. (2018) 79:121–8. doi: 10.1002/mrm.26648
94. Jang H, Lu X, Carl M, Searleman AC, Jerban S, Ma Y, et al. True phase quantitative susceptibility mapping using continuous single point imaging: a feasibility study. Magn Reson Med. (2019) 81:1907–14. doi: 10.1002/mrm.27515
95. Lu X, Ma Y, Chang EY, He Q, Searleman A, von Drygalski A, et al. Simultaneous quantitative susceptibility mapping (QSM) and R2* for high iron concentration quantification with 3D ultrashort echo time sequences: An echo dependence study. Magn Reson Med. (2018) 79:2315–22. doi: 10.1002/mrm.27062
96. Lu X, Jang H, Ma Y, Chang EY, Du J. Ultrashort echo time quantitative susceptibility mapping (UTE-QSM) of highly concentrated magnetic nanoparticles: a comparison study about different sampling strategies. Molecules. (2019) 24:1143. doi: 10.3390/molecules24061143
97. Jang H, von Drygalski A, Wong J, Zhou JY, Aguero P, Lu X, et al. Ultrashort echo time quantitative susceptibility mapping (UTE-QSM) for detection of hemosiderin deposition in hemophilic arthropathy: a feasibility study. Magn Reson Med. (2020) 84:3246–55. doi: 10.1002/mrm.28388
98. Jerban S, Lu X, Jang H, Ma Y, Namiranian B, Le N, et al. Significant correlations between human cortical bone mineral density and quantitative susceptibility mapping (QSM) obtained with 3D Cones ultrashort echo time magnetic resonance imaging (UTE-MRI). Magn Reson Imaging. (2019) 62:104–10. doi: 10.1016/j.mri.2019.06.016
99. McCarthy I. The physiology of bone blood flow: a review. J Bone Joint Surg. (2006) 88:4–9. doi: 10.2106/00004623-200611001-00002
100. Colleran PN, Wilkerson MK, Bloomfield SA, Sura LJ, Turner RT, Delp MD. Alternations in skeletal perfusion with simulated microgravity: a possible mechanicsm for bone remodeling. J Appl Physiol. (2000) 89:1046–54. doi: 10.1152/jappl.2000.89.3.1046
101. Otter MW, Qin YX, Rubin CT, McLeod KJ. Does bone perfusion/reperfusion initiate bone remodeling and the stress fracture syndrome? Med Hypotheses. (1999) 53:363–8. doi: 10.1054/mehy.1998.0782
102. Vogt MT, Cauley JA, Kuller LH, Nevitt MC. Bone mineral density and blood flow to the lower extremities: the study of osteoporotic fractures. J Bone Miner Res. (1997) 12:283–9. doi: 10.1359/jbmr.1997.12.2.283
103. Wang YX, Griffith JF, Kwok AWL, Leung JCS, Yeung DKW, Ahuja AT, et al. Reduced bone perfusion in proximal femur of subjects with decreased bone mineral density preferentially affects the femoral neck. Bone. (2009) 45:711–5. doi: 10.1016/j.bone.2009.06.016
104. Robson MD, Gatehouse PD, So PW, Bell JD, Bydder GM. Contrast enhancement of short T2 tissues using ultrashort TE (UTE) pulse sequences. Clin Radiol. (2004) 59:720–6. doi: 10.1016/j.crad.2003.09.025
105. Wan L, Wu M, Sheth V, Shao H, Jang H, Bydder GM, et al. Evaluation of cortical bone perfusion using dynamic contrast enhanced ultrashort echo time (UTE) imaging: a feasibility study. Quant Imaging Med Surg. (2019) 9:1383–93. doi: 10.21037/qims.2019.08.05
106. Cao H, Ackerman JL, Hrovat MI, Graham L, Glimcher MJ, Wu Y. Quantitative bone matrix density measurement by water- and fat-suppressed proton projection MRI (WASPI) with polymer calibration phantoms. Magn Reson Med. (2008) 60:1433–43. doi: 10.1002/mrm.21771
107. Idiyatullin D, Corum C, Moeller S, Prasad HS, Garwood M, Nixdorf DR. Dental magnetic resonance imaging: making the invisible visible. J Endod. (2011) 37:745–52. doi: 10.1016/j.joen.2011.02.022
108. Robson MD, Gatehouse PD, Bydder GM, Neubauer S. Human imaging of phosphorus in cortical and trabecular bone in vivo. Magn Reson Med. (2004) 51:888–92. doi: 10.1002/mrm.20055
109. Seifert AC, Wehrli FW. Solid-state quantitative 1H and 31P MRI of cortical bone in humans. Curr Osteoporos Rep. (2016) 14:77–86. doi: 10.1007/s11914-016-0307-2
110. Nyman JS, Does MD. Bound water and pore water in osteoporosis. In: Du J, Bydder GM, editors. MRI of Short- and Ultrashort-T2 Tissues: Making the Invisible Visible. Switzerland: Springer (2024). p. 409–20.
111. Horch RA, Gochberg DF, Nyman JF, Does MD. Non-invasive predictors of human cortical bone mechanical properties: T(2)-discriminated H NMR compared with high resolution X-ray. PloS One. (2011) 6:e16359. doi: 10.1371/journal.pone.0016359
112. Bae WC, Chen PC, Chung CB, Masuda K, DLima D, Du J. Quantitative ultrashort echo time (UTE) MRI of human cortical bone: correlation with porosity and biomechanical properties. J Bone Miner Res. (2012) 27:848–57. doi: 10.1002/jbmr.1535
113. Granke M, Does MD, Nyman JS. The role of water compartments in the material properties of cortical bone. Calcif Tissue Int. (2015) 97:292–307. doi: 10.1007/s00223-015-9977-5
114. Currey JD, Brear K, Zioupos P. The effects of ageing and changes in mineral content in degrading the toughness of human femora. J Biomech. (1996) 29:257–60. doi: 10.1016/0021-9290(95)00048-8
115. Chang EY, Bae WC, Shao H, Biswas R, Li S, Chen J, et al. Ultrashort echo time magnetization transfer (UTE-MT) imaging of cortical bone. NMR BioMed. (2015) 28:873–80. doi: 10.1002/nbm.v28.7
116. Hong AL, Ispiryan M, Padalkar MV, Jones BC, Batzdorf AS, Shetye SS, et al. MRI-derived bone porosity index correlates to bone composition and mechanical stiffness. Bone Rep. (2019) 11:100213. doi: 10.1016/j.bonr.2019.100213
117. Jones BC, Lee H, Cheng CC, Mukaddam M, Song HK, Snyder PJ, et al. MRI quantification of cortical bone porosity, mineralization, and morphologic structure in postmenopausal osteoporosis. Radiology. (2023) 307:e221810. doi: 10.1148/radiol.221810
118. Jerban S, Ma Y, Wei Z, Jang H, Chang EY, Du J. Quantitative magnetic resonance imaging of cortical and trabecular bone. Semin Musculoskelet Radiol. (2020) 24:386–401. doi: 10.1055/s-0040-1710355
119. Abbasi-Rad S, Saligheh Rad H. Quantification of human cortical bone bound and free water in vivo with ultrashort echo time MR imaging: a model-based approach. Radiology. (2017) 83:862–72. doi: 10.1148/radiol.2016160780
120. Jacobson AM, Zhao X, Sommer S, Sadik F, Warden SJ, Newman C, et al. A comprehensive set of ultrashort echo time magnetic resonance imaging biomarkers to assess cortical bone health: a feasibility study at clinical field strength. Bone. (2024) 181:117031. doi: 10.1016/j.bone.2024.117031
121. Nyman JS, Ketsiri T, Louie EA, Harkins KD, Manhard MK, Gochberg DF, et al. Toward the use of MRI measurements of bound and pore water in fracture risk assessment. Bone. (2023) 176:116863. doi: 10.1016/j.bone.2023.116863
122. Gallant MA, Brown DM, Hammond M, Wallace JM, Du J, Deymier-Black AC, et al. Bone cell-independent benefits of raloxifene on the skeleton: a novel mechanism for improving bone material properties. Bone. (2014) 61:191–200. doi: 10.1016/j.bone.2014.01.009
123. Biffar A, Sourbron S, Dietrich O, Schmidt G, Ingrisch M, Reiser MF, et al. Combined diffusion-weighted and dynamic contrast-enhanced imaging of patients with acute osteoporotic vertebral fractures. Eur J Radiol. (2010) 76:298–303. doi: 10.1016/j.ejrad.2010.05.020
124. Zhu J, Zhang L, Wu X, Xiong Z, Qiu Y, Hua T, et al. Reduction of longitudinal vertebral blood perfusion and its likely causes: a quantitative dynamic contrast-enhanced MR imaging study of a rat osteoporosis model. Radiology. (2017) 282:369–80. doi: 10.1148/radiol.2016152006
125. Reichert ILH, Robson MD, Gatehouse PD, He T, Chappell KE, Holmes J, et al. Magnetic resonance imaging of cortical bone with ultrashort TE pulse sequences. Magn Reson Imaging. (2005) 23:611–8. doi: 10.1016/j.mri.2005.02.017
126. Diaz E, Chung CB, Bae WC, Statum S, Znamirowski R, Bydder GM, et al. Ultrashort echo time spectroscopic imaging (UTESI): an efficient method for quantifying bound and free water. NMR BioMed. (2012) 25:161–8. doi: 10.1002/nbm.v25.1
127. Du J, Diaz E, Carl M, Bae W, Chung C, Bydder GM. Ultrashort echo time imaging with bicomponent analysis. Magn Reson Med. (2012) 67:645–9. doi: 10.1002/mrm.23047
128. Jerban S, Lu X, Dorthe EW, Alenezi S, Ma Y, Kakos L, et al. Correlation of cortical bone microstructural and mechanical properties with water proton fractions obtained from ultrashort echo time (UTE) MRI tricomponent T2* model. NMR BioMed. (2020) 33:e4233. doi: 10.1002/nbm.v33.3
129. Schwartz A, Sellmeyer D, Ensrud K, Cauley JA, Tabor HK, Schreiner PJ, et al. Older women with diabetes have an increased risk of fracture: a prospective study. J Clin Endocrinol Metab. (2001) 86:32–8. doi: 10.1210/jcem.86.1.7139
130. Botella Martínez S, Varo Cenarruzabeitia N, Escalada San Martin J, Calleja Canelas A. The diabetic paradox: Bone mineral density and fracture in type 2 diabetes. Endocrinol Nutr. (2016) 63:495–501. doi: 10.1016/j.endoen.2016.10.010
131. Hofbauer LC, Busse B, Eastell R, Ferrari S, Frost M, Müller R, et al. Bone fragility in diabetes: novel concepts and clinical implications. Lancet Diabetes Endocrinol. (2022) 10:207–20. doi: 10.1016/S2213-8587(21)00347-8
132. Goldin A, Beckman JA, Schmidt AM, Creager MA. Advanced glycation end products: sparking the development of diabetic vascular injury. Circulation. (2006) 114:597–605. doi: 10.1161/CIRCULATIONAHA.106.621854
133. Poundarik AA, Wu PC, Evis Z, Sroga GE, Ural A, Rubin M, et al. A direct role of collagen glycation in bone fracture. J Mech Behav BioMed Mater. (2015) 52:120–30. doi: 10.1016/j.jmbbm.2015.08.012
134. Saito M, Mori S, Mashiba T, Komatsubara S, Marumo K. Collagen maturity, glycation induced-pentosidine, and mineralization are increased following 3-year treatment with incadronate in dogs. Osteoporosis Int. (2008) 19:1343–54. doi: 10.1007/s00198-008-0585-3
135. Ogawa N, Yamaguchi T, Yano S, Yamauchi M, Yamamoto M, Sugimoto T, et al. The combination of high glucose and advanced glycation end-products (AGEs) inhibits the mineralization of osteoblastic MC3T3-E1 cells through glucose-induced increase in the receptor for AGEs. Hormone Metab Res. (2007) 39:871–5. doi: 10.1055/s-2007-991157
136. Valcourt U, Merle B, Gineyts E, Viguet-Carrin S, Delmas PD, Garnero P, et al. Non-enzymatic glycation of bone collagen modifies osteoclastic activity and differentiation. J Biol Chem. (2007) 282:5691–703. doi: 10.1074/jbc.M610536200
137. Saito M, Fujii K, Mori Y, Marumo K. Role of collagen enzymatic and glycation induced cross-links as a determinant of bone quality in spontaneously diabetic WBN/Kob rats. Osteoporos Int. (2006) 17:1514–23. doi: 10.1007/s00198-006-0155-5
138. Campbell GM, Tiwari S, Picke A-K, Hofbauer C, Rauner M, Morlock MM, et al. Effects of insulin therapy on porosity, non-enzymatic glycation and mechanical competence in the bone of rats with type 2 diabetes mellitus. Bone. (2016) 91:186–93. doi: 10.1016/j.bone.2016.08.003
139. Fishbein KW, Gluzband YA, Kaku M, Ambia-Sobhan H, Shapses SA, Yamauchi M, et al. Effects of formalin fixation and collagen cross-linking on T2 and magnetization transfer in bovine nasal cartilage. Magnetic Resonance Med. (2007) 57:1000–11. doi: 10.1002/mrm.21216
140. Ho LC, Sigal IA, Jan N-J, Yang X, van der Merwe Y, Yu Y, et al. Non-invasive MRI assessments of tissue microstructures and macromolecules in the eye upon biomechanical or biochemical modulation. Sci Rep. (2016) 6:32080. doi: 10.1038/srep32080
141. Gochberg DF, Fong PM, Gore JC. Studies of magnetization transfer and relaxation in irradiated polymer gels - interpretation of MRI-based dosimetry. Phys Med Biol. (2001) 46:799. doi: 10.1088/0031-9155/46/3/314
Keywords: UTE, MRI, contrast mechanism, quantitation, osteoporosis
Citation: Shin SH, Chae HD, Suprana A, Jerban S, Chang EY, Shi L, Sah RL, Pettus JH, Woods GN and Du J (2025) UTE MRI technical developments and applications in osteoporosis: a review. Front. Endocrinol. 16:1510010. doi: 10.3389/fendo.2025.1510010
Received: 12 October 2024; Accepted: 15 January 2025;
Published: 06 February 2025.
Edited by:
Nico Sollmann, Ulm University Medical Center, GermanyReviewed by:
Alan C. Seifert, Icahn School of Medicine at Mount Sinai, United StatesJuliana Ebling Brondani, Federal University of Minas Gerais, Brazil
Copyright © 2025 Shin, Chae, Suprana, Jerban, Chang, Shi, Sah, Pettus, Woods and Du. This is an open-access article distributed under the terms of the Creative Commons Attribution License (CC BY). The use, distribution or reproduction in other forums is permitted, provided the original author(s) and the copyright owner(s) are credited and that the original publication in this journal is cited, in accordance with accepted academic practice. No use, distribution or reproduction is permitted which does not comply with these terms.
*Correspondence: Jiang Du, amlhbmdkdUB1Y3NkLmVkdQ==
†These authors have contributed equally to this work