 Kecheng Li1,2†
 Xiaoli Zhou1,2†
 Youren Liu3Dongyu Li3Yinyin Li3Ting Zhang1,2Chunyan Fu1,2Lin Li1,2Yang Hu4*Li Jiang1,2*
- 1Department of Laboratory Medicine, Sichuan Provincial People’s Hospital, School of Medicine, University of Electronic Science and Technology of China, Chengdu, Sichuan, China
- 2Sichuan Provincial Key Laboratory for Human Disease Gene Study, Sichuan Provincial People’s Hospital, University of Electronic Science and Technology of China, Chengdu, Sichuan, China
- 3Department of Health Management, Sichuan Provincial People’s Hospital, University of Electronic Science and Technology of China, Chengdu, China
- 4Department of Gastrointestinal Surgery, Sichuan Provincial People’s Hospital, University of Electronic Science and Technology of China, Chengdu, Sichuan, China
Introduction: Beta-amyloid accumulation in the brain appears to be a key initiating event in Alzheimer’s disease (AD), and factors associated with increased deposition of beta-amyloid are of great interest. Enhanced deposition of amyloid-β peptides is due to an imbalance between their production and elimination. Previous studies show that diminished levels of CSF amyloid beta 42 (Aβ42) is a biomarker in AD; however, the role of serum Aβ42 in AD is contradictory. BMI and obesity have been reported to be related to increased serum Aβ42 levels. Therefore, we aimed to investigate the relation between metabolic syndrome (MetS), its clinical measures (abdominal obesity, high glucose, high triglyceride, low high-density lipoprotein cholesterol level, and hypertension), and serum Aβ42 levels.
Methods: A total of 1261 subjects, aged 18–89 years in Chengdu, China, were enrolled from January 2020 to January 2021 to explore the correlation of serum Aβ42 levels with body mass index (BMI), blood lipids, and blood pressure. Furthermore, as the risk of MetS is closely related to age, 1,212 participants (N = 49 with age ≥ 80 years old were excluded) were analyzed for the correlation of serum Aβ42 level and MetS clinical measures.
Results: The results showed that log-transformed serum Aβ42 level was positively correlated with BMI (R = 0.29; p < 0.001), log-transformed triglyceride (R = 0.14; p < 0.001), and diastolic blood pressure (DBP) (R = 0.12; p < 0.001) and negatively correlated with high-density lipoprotein (HDL-c) (R = −0.18; p < 0.001). After adjusting for age, sex, and other covariates, elevated serum Aβ42 level was correlated with higher values of BMI (βmodel1 = 2.694, βmodel2 = 2.703) and DBP (βmodel1 = 0.541, βmodel2 = 0.546) but a lower level of HDL-c (βmodel2 = −1.741). Furthermore, serum Aβ42 level was positively correlated with MetS and its clinical measures, including BMI and DBP, and negatively correlated with HDL-c level in the Han Chinese population. However, the level of serum Aβ42 did not show a significant correlation with high glucose or high triglyceride.
Discussion: These observations indicate that MetS and its components are associated with higher levels of serum Aβ42 and hence limit the potential of serum Aβ42 as a suitable diagnostic biomarker for AD. As such, we recommend serum Aβ42 serve as a direct risk biomarker for MetS rather than for AD.
1 Introduction
The accumulation of amyloid-β (Aβ) peptides (mainly Aβ42 and Aβ40) in the brain parenchyma and cerebral vasculature is a major hallmark of AD pathogenesis (1, 2). The amyloid hypothesis reveals that amyloid precursor protein (APP) is cleaved into pathological forms of Aβ by β- and γ-secretase enzymes, driving the imbalance between Aβ production and clearance (3). Aβ42 is the most abundant protein in amyloid plaques due to its higher rate of fibrillization and insolubility. Aβ42 in the cerebrospinal fluid (CSF) has been established as a reliable biomarker to support an AD diagnosis. Additionally, studies have shown that changes in CSF Aβ are greater than those in plasma because CSF is in direct contact with the brain and only a small fraction of brain proteins reaches the bloodstream (4, 5). Hence, CSF Aβ42, plasma-based two fractions of β amyloid peptide ratio (Aβ42/40), and phosphorylated tau (p-tau) are considered promising prospective biomarkers for AD diagnosis and progression (6, 7).
The imbalance between the production and clearance of Aβ, which occurs not only in the brain but also in the periphery, is considered an initial factor in AD (8). An increasing number of studies support the hypothesis that systemic abnormalities (circadian rhythm, oxidative stress, metabolic syndrome, etc.) are risk factors for AD development, especially metabolic syndrome (MetS) and its individual components, including abdominal obesity, high glucose, high triglyceride, low high-density lipoprotein cholesterol levels, or hypertension (8–13). MetS is also associated with an increased risk of developing cardiovascular disease, AD, and dementia (3, 10, 14–17). Recently, a study also showed that MetS causes a fast decline in cognitive performance and stimulates Aβ42 production in the brain (18). The prevalence of MetS reached approximately 25% of the global population in 2018 and increased every year (19).
Evidence indicates that central obesity plays a central role in the development of the MetS and appears to precede the appearance of the other MetS components (14). Several previous meta-analyses implied that midlife obesity was a potentially modifiable risk factor for dementia and AD, but this is still uncertain with rather heterogeneous results (20–23). Recent studies revealed APP is highly expressed in adipose tissue and upregulated in obesity (24). The concentration of Aβ in blood was significantly increased in both mouse models and obese individuals (25, 26). In addition, there has been evidence showing plasma Aβ42 level was positively correlated with BMI in small groups of nondemented adults and children (27–30). A prospective study indicated an increase over 5 years of HDL-c was a negative predictor for the decrease of plasma Aβ42 levels (31), while another study showed a positive correlation of plasma Aβ42 levels with HDL (32). Additionally, abnormal blood pressure is tightly associated with dysregulated lipid metabolism (33). An animal study revealed that Aβ-induced hypertension can be an early pathophysiologic consequence of AD processes (34). One cross-sectional study also revealed that many factors influence the association between plasma Aβ42 levels and AD cognitive impairment, and they proposed that plasma Aβ42 may be a peripheral biomarker for AD screening in the Chinese elderly population, but it is necessary to establish standardized detection methods and establish different demarcation criteria for various influencing factors (35).
Therefore, whether and how serum Aβ42 level is directly related to MetS and its components in the Han population on a large scale is still vague. We hypothesize that the concentration of Aβ42 in the periphery is a biomarker of MetS and its components, independent from AD. To test this, we conducted a cross-sectional study in a regular health check-up population to analyze the association of serum Aβ42 level with MetS and its clinical measures, including abdominal obesity, high glucose, high triglyceride, low high-density lipoprotein cholesterol levels, and hypertension.
2 Methods
2.1 Participants
We enrolled a total of 1,261 participants between the ages of 18–89 years from a regular health check-up population in the Sichuan Academy of Medical Sciences and Sichuan Provincial People’s Hospital between January 2020 to January 2021 (Figure 1). Participants were excluded by diagnoses of CAD, renal disease, autoimmune disease, hypersensitivity, gastrointestinal disease, pulmonary disease, cancer, acute illness, or hospitalization within 15 days. This study was approved by the Ethics Committee of the Sichuan Academy of Medical Sciences and Sichuan Provincial People’s Hospital (2020No.281). All subjects provided written informed consent prior to participation.
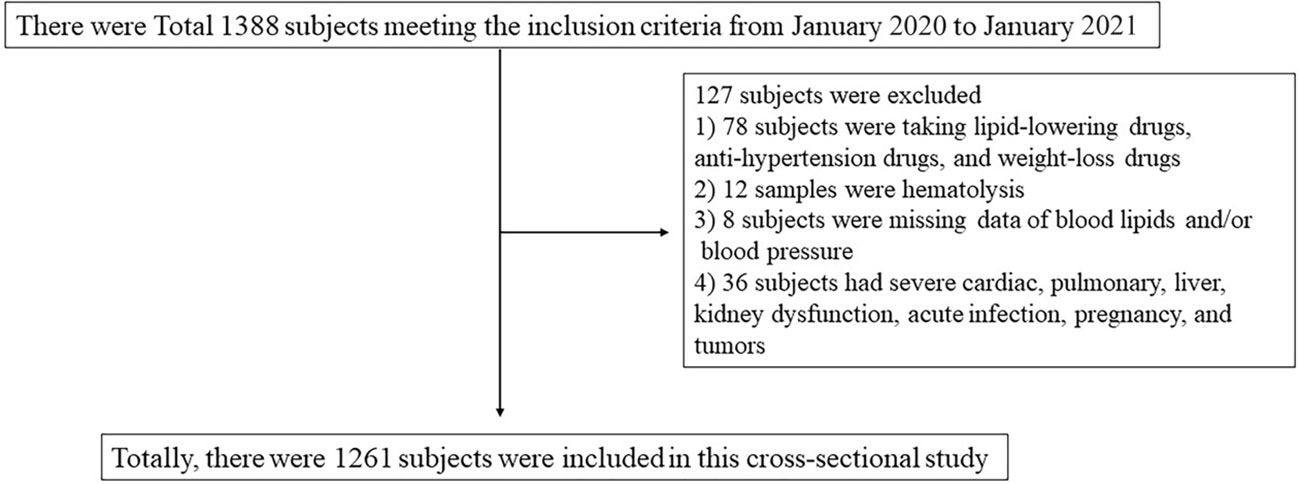
Figure 1 Flow chart of participant screening.
2.2 Diagnostic criteria of obesity, hypertension, and dyslipidemia
According to the health criteria WS/T 428-2013 issued by the National Health Commission of the People’s Republic of China, subjects with BMI ≥ 28, 24 < BMI < 28, and BMI ≤ 24 are defined as obese, overweight, and normal weight, respectively. According to the 2020 International Society of Hypertension global hypertension practice guidelines, a subject with systolic blood pressure (SBP) ≥ 140 mmHg and/or diastolic blood pressure (DBP) ≥ 90 mmHg is defined as hypertensive (36). According to the Chinese guidelines for the prevention and treatment of dyslipidemia, a subject with total cholesterol (TC) ≥ 5.18 mmol/L and/or triglyceride (TG) ≥ 1.70 mmol/L and/or low-density lipoprotein cholesterol (LDL-c) ≥ 3.37 mmol/L and/or HDL-c ≤ 1.04 mmol/L is defined as having dyslipidemia (37).
2.3 Diagnostic criteria of metabolic syndrome
In this study, the modified ATP III criteria were applied in the diagnosis of MetS, which requires the presence of at least three abnormal findings out of five factors (38): (i) Abdominal density as defined by waist circumference ≥ 90 cm and ≥ 80 cm in men and women, respectively according to the Asian World Health Organization criteria.; (ii) TG ≥ 1.7 mmol/L; (iii) HDL-c < 1.03 mmol/L and < 1.29 mmol/L in men and women, respectively; (iv) SBP ≥ 130 mmHg or DBP ≥ 85 mmHg; and (v) glucose (GLU) ≥ 5.6 mmol/L as impaired fasting glucose (IFG).
2.4 General information collection and blood pressure measurement
All participants were required to fill out a questionnaire to collect general information, including weight, height, waist circumference, etc. A mercury sphygmomanometer was applied on the right arm (with a regular adult cuff) of each participant after having rested for 5 min in a seated position to measure blood pressure (SBP and DBP) before blood sample collection.
2.5 Blood collection and biochemical analysis
Fasting blood was collected into serum separator tubes (BD, Franklin Lakes, NJ, USA) with a standard venipuncture technique in the morning. Serum was separated from the blood samples by centrifugation at 1,000×g for 20 min immediately after clotting and stored in an aliquot at −80°C until laboratory analysis of Aβ42 and other relevant biomarkers in this study. Biochemical analysis including serum TC, TG, HDL-c, LDL-c, and GLU was performed using the Abbott ARCHITECT c16000 clinical chemistry system (Abbott Co., Chicago, USA) in the Department of Laboratory Medicine, Sichuan Academy of Medical Sciences, and Sichuan Provincial People’s Hospital.
2.6 Measurement of serum Aβ42
The concentration of serum Aβ42 was measured by a double-antibody sandwich method with a commercial kit (Mlbio Co., Shanghai, China) according to its manufacturer’s instructions. In detail, 50 μL of serum sample or Standard were added in duplicate to the appropriate well of the 96-well microtiter plate that had been precoated with antihuman Aβ1–42 capture antibody, and subsequently, 100 μL of HRP-conjugated detecting antibody was added to each well except the blank well. The microtiter plate was incubated for 60 min at 37°C and then manually wash with wash solution (1×) four times. After that, 50 μL of substrate A and 50 μL of substrate B were added to each well of the microtiter plate and incubated for 15 min in the dark at 37°C. After adding 50 μL of stop solution to each well, the O.D. at OD450 was measured with a microtiter plate reader (Bio-Rad, Californie, USA) within 15 min. The mean O.D. value of two wells was calculated for each standard and sample and subtracted by the mean value of the blank wells. The standard curve was generated by plotting the O.D. of the six standards on the vertical (x)-axis versus the corresponding concentration of Aβ42 (240 pg/mL, 120 pg/mL, 60 pg/mL, 30 pg/mL, 15 pg/mL, or 7.5 pg/mL) on the horizontal (y)-axis. The concentration of Aβ42 in each sample was then determined by plotting its O.D. in the standard curve.
2.7 Statistical analysis
The skewness, kurtosis, and P-P plots were used to test the distribution of each covariate. Age, TC, HDL-c, LDL-c, SBP, DBP, BMI, hip circumference, and waist circumference conformed to a normal distribution, and these covariates were expressed as mean (SD). Serum Aβ42 levels, TG, and GLU did not conform to the normal distribution. Hence, they were expressed as median (interquartile range) and were log-transformed for further analysis. The participants were divided into different groups according to their BMI, blood lipids, and blood pressure. The covariates were compared between different groups by unpaired Student’s t-test, Mann–Whitney U test, and Kruskal–Wallis test. Categorical variables were expressed as numbers (percentage) and were compared by χ2 tests. Pearson correlation was performed to explore the linear trend between log-transformed serum Aβ42 levels and BMI, blood lipids, and blood pressure. In addition, multiple linear regression analysis was performed to further explore their potential relationships, with a variance inflation factor (VIF) higher than 10 considered colinear. All these statistical analyses were performed by SPSS 22.0 (SPSS Inc., Chicago, IL, USA), and a p-value of less than 0.05 was considered statistically significant.
3 Results
3.1 Clinical characteristics of the participants
A total of 1,261 participants were analyzed for correlation between serum Aβ42 levels and BMI, blood lipids, and blood pressure, as shown in Tables 1–4. The anthropometric and metabolic characteristics of the subjects are summarized in each table. As the risk of MetS is closely associated with age, we tested this association in adults across ages (39, 40). We then classified the participants into three age groups, young (18–29 years), middle-aged (30–64 years), and old (65–79 years) adults. Therefore, 1,212 participants were analyzed including 459 individuals with MetS diagnosed by the modified ATP III criteria (Table 5).
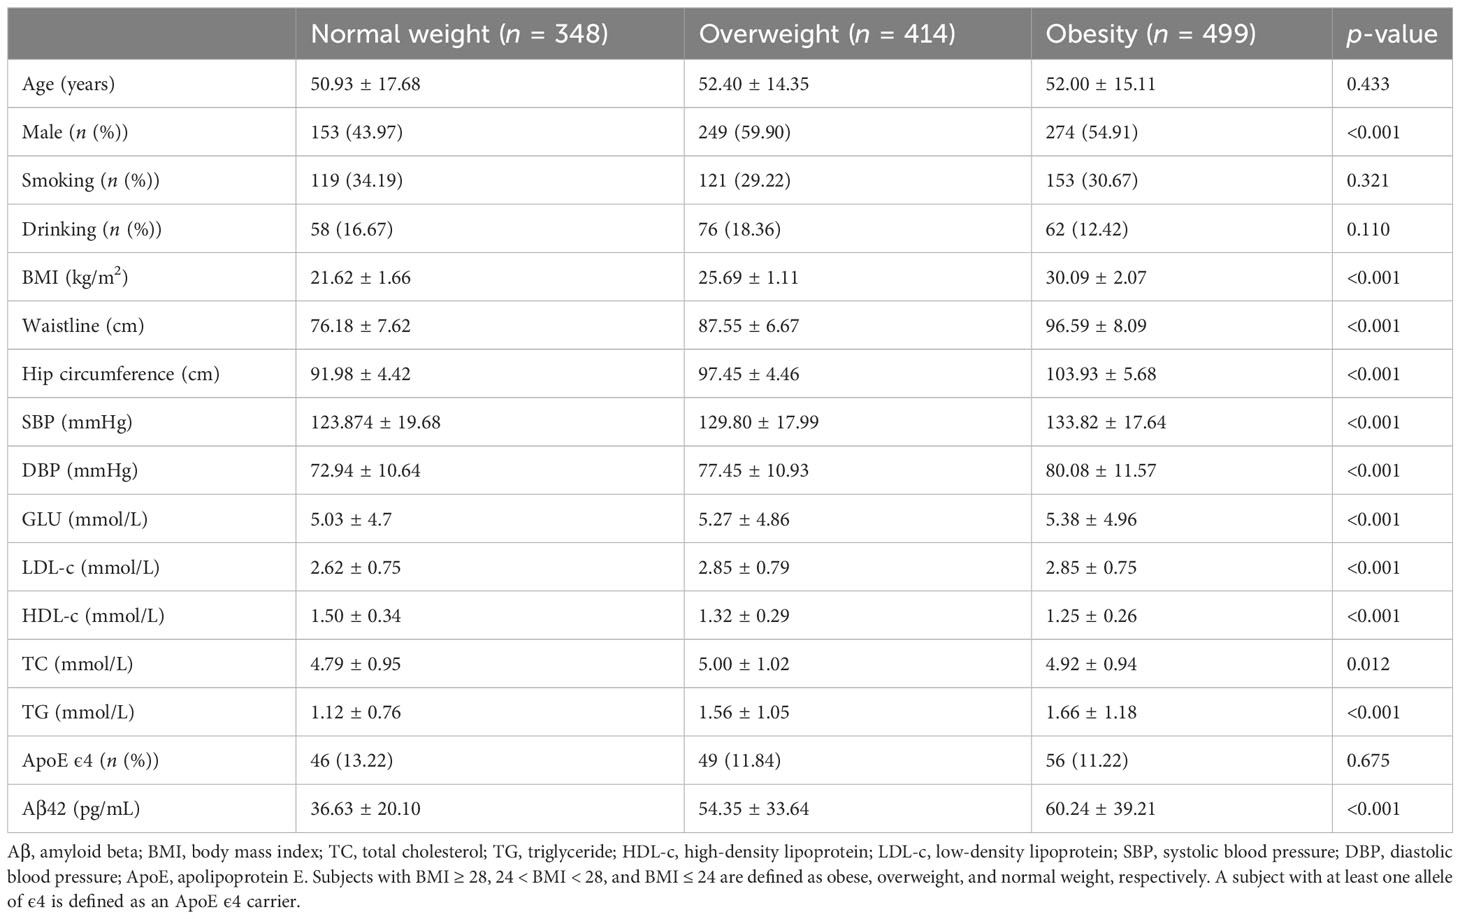
Table 1 Comparison of serum Aβ42 levels among participants divided by BMI.
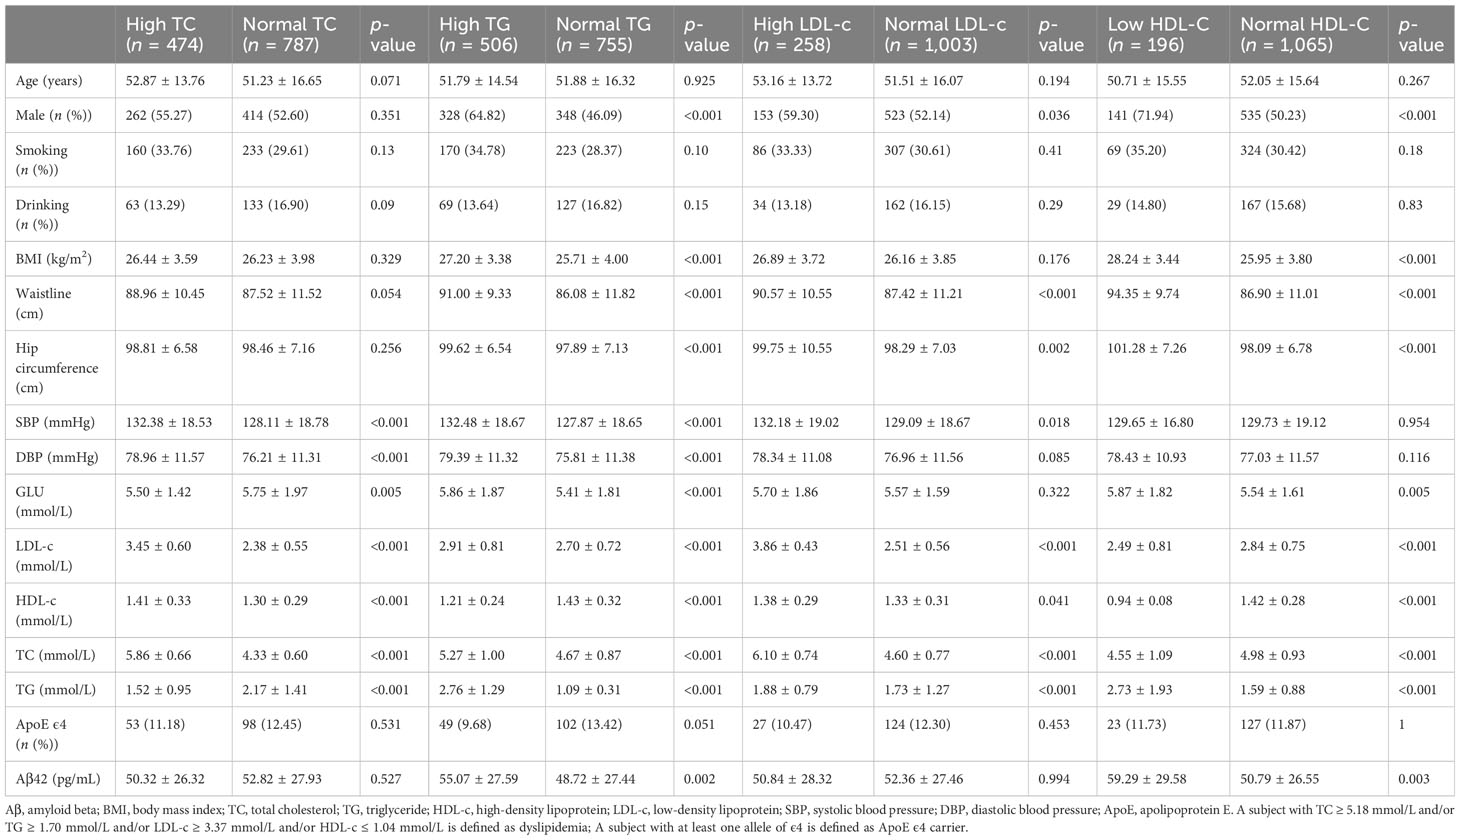
Table 2 Comparison of serum Aβ42 levels among participants divided by TC, TG, LDL-c, and HDL-c.
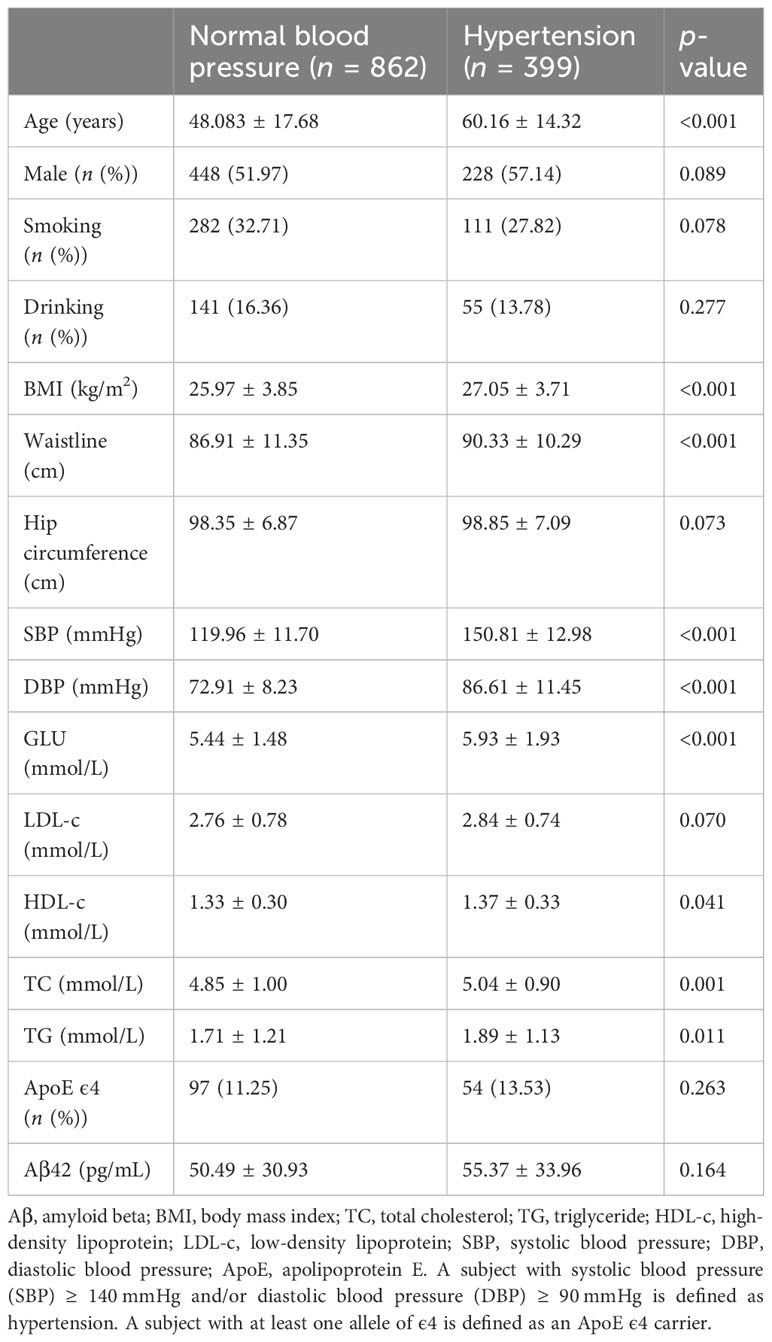
Table 3 Comparison of serum Aβ42 levels among participants divided by blood pressure.
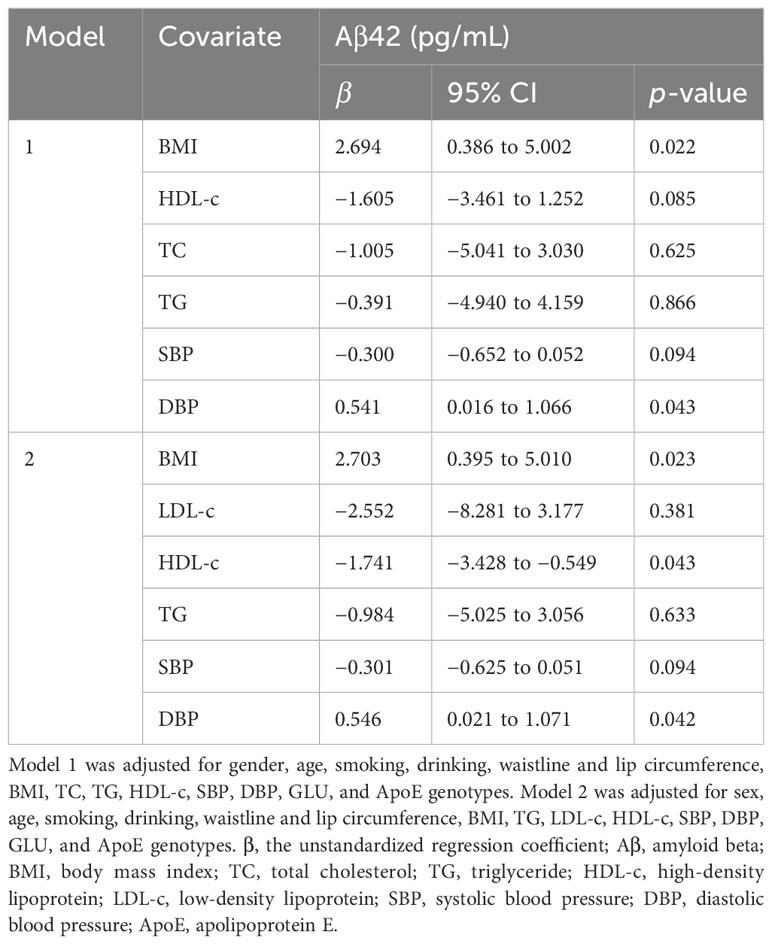
Table 4 Multiple linear regression analyses for the exploration of the potential correlations between serum Aβ42 levels and BMI, blood lipids, and blood pressure.
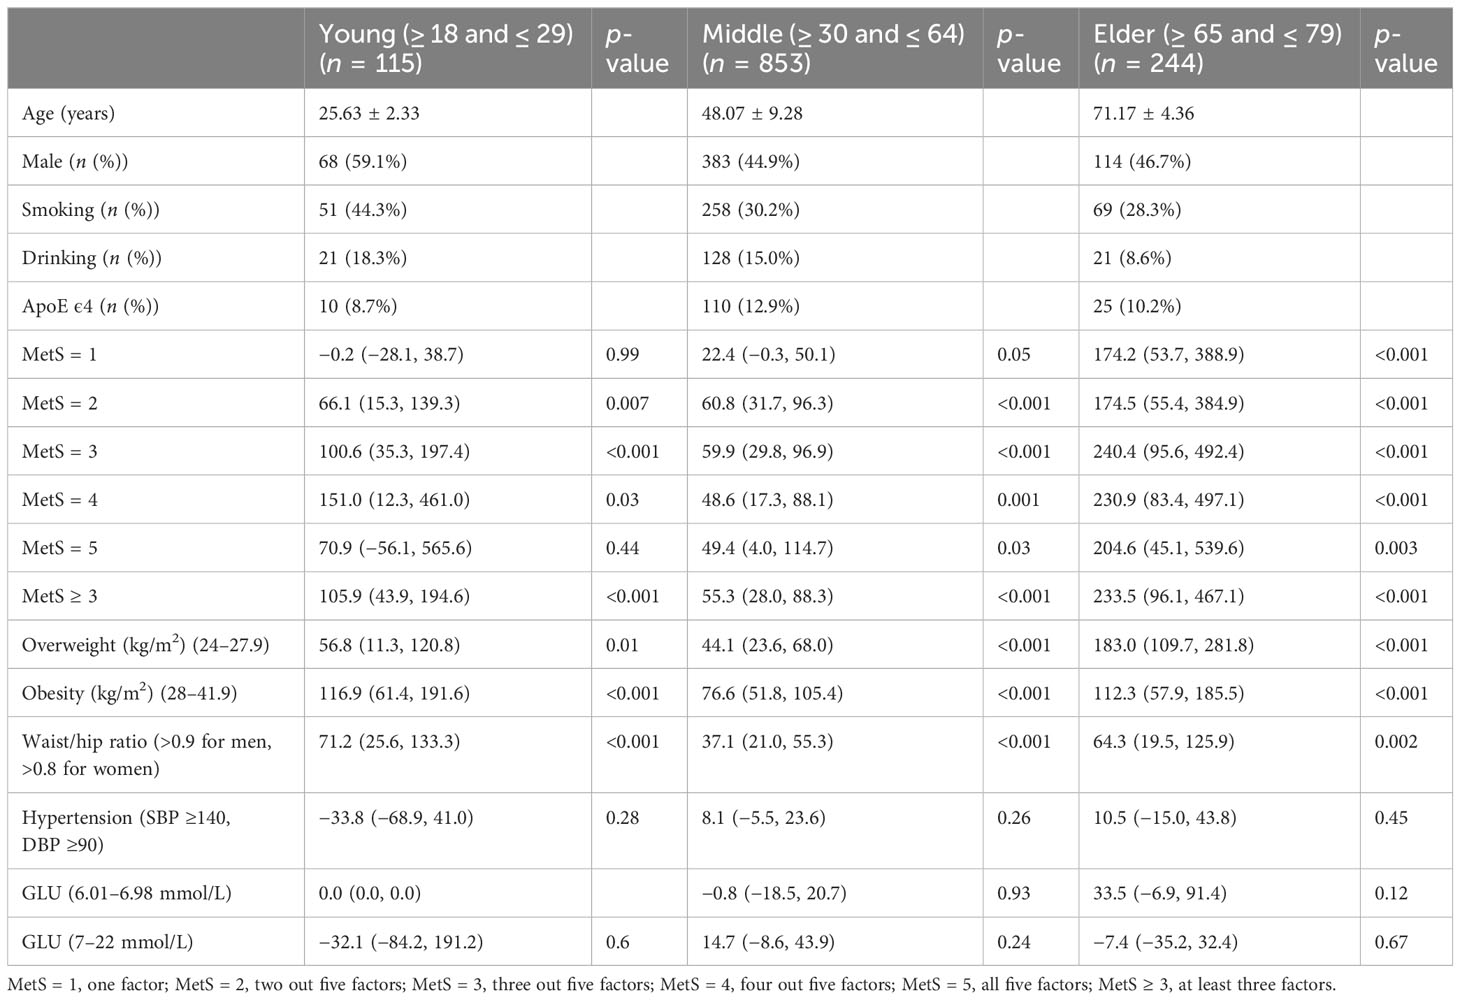
Table 5 Comparison of serum Aβ42 levels among participants associated with MetS, divided by age.
3.2 Increased serum Aβ42 levels are associated with obesity
The participants were divided into three groups according to their BMI, and serum Aβ42 levels were significantly different between the normal weight, overweight, and obesity groups (Table 1). Pearson correlation analysis demonstrated a positive linear correlation between BMI and log-transformed serum Aβ42 levels in participants of all groups (R = 0.29; p < 0.001) (Figure 2A). Subsequently, multiple linear regression analysis was carried out to further elucidate the correlation between serum Aβ42 level and BMI. All covariates were not colinear, except for TC and LDL-c; hence, two models were built to avoid their cross-interference (Table 2). After adjusting for confounding factors, both models showed that serum Aβ42 levels were positively correlated with BMI, with the unstandardized regression coefficient (β) = 2.694, p < 0.05 in model 1 and β = 2.703, p < 0.05 in model 2 (Table 4). These results elucidated a positive linear correlation trend between serum Aβ42 levels and BMI in a Han Chinese population for the first time.
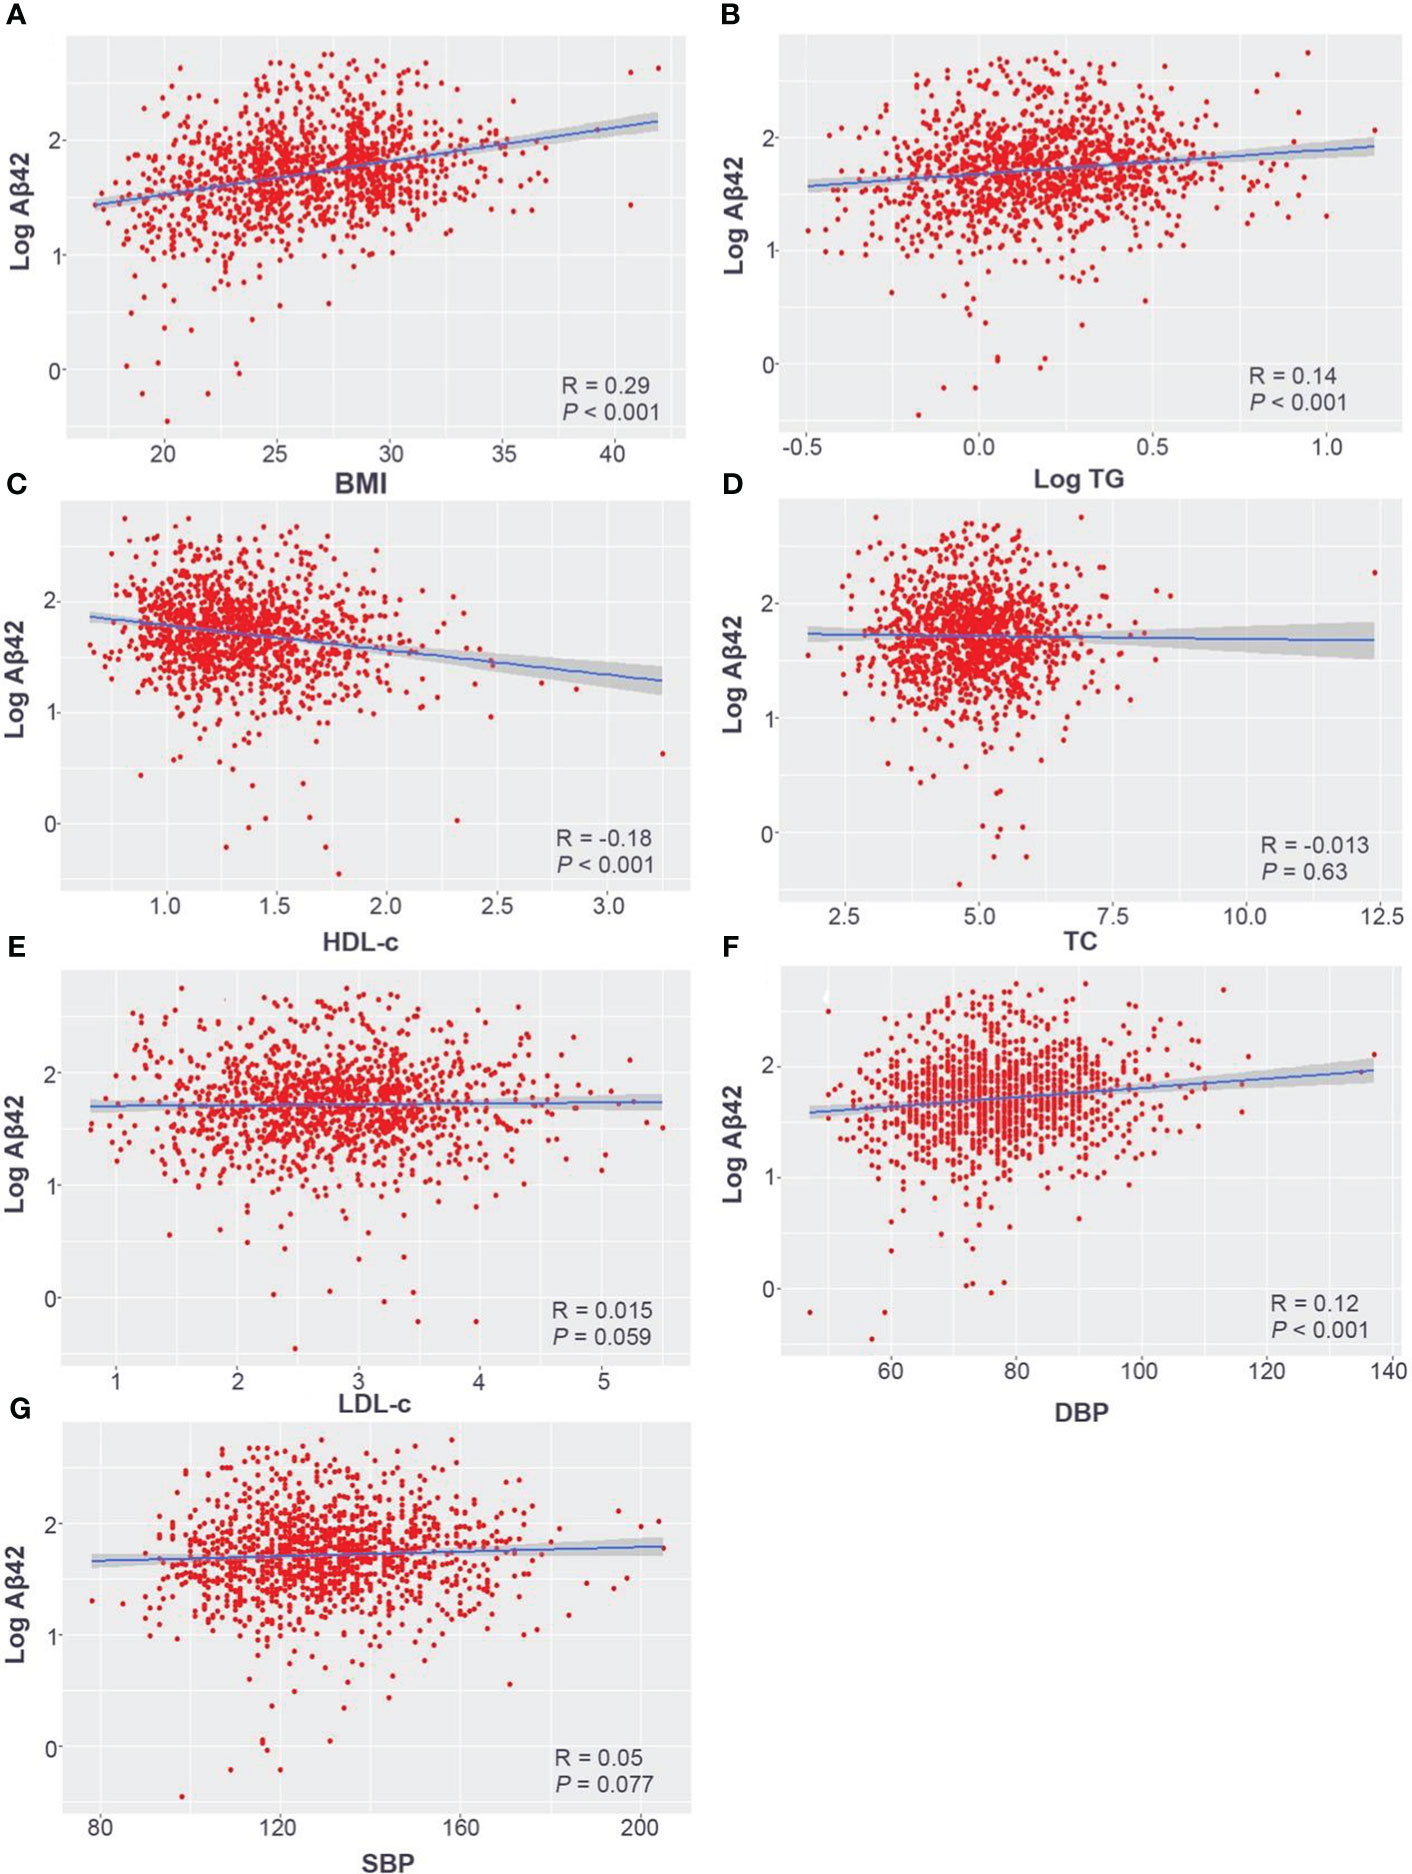
Figure 2 Pearson correlation analysis of log-transformed serum Aβ42 levels with the BMI (A), log-transformed TG (B), HDL-c (C), TC (D), LDL-c (E), DBP (F), and SBP (G) in the Han Chinese population. Aβ42, amyloid beta 42; BMI, body mass index; TC, total cholesterol; TG, triglyceride; HDL-c, high-density lipoprotein; LDL-c, low-density lipoprotein; SBP, systolic blood pressure; DBP, diastolic blood pressure.
3.3 Serum Aβ42 levels are correlated to concentrations of lipid metabolism biomarkers
All subjects were divided into different groups according to TC, TG, LDL-c, and HDL-c levels. There were no significant differences in serum Aβ42 levels between normal TC and high TC groups or between normal LDL-c and high LDL-c groups (Table 2). Meanwhile, serum Aβ42 levels were significantly higher in the low HDL-c group than the normal HDL-c group (p = 0.003) and higher in the high TG group compared to the normal TG group (p = 0.002) (Table 2). In addition, the correlations of TC, LDL-c, HDL-c, and log-transformed TG with log-transformed serum Aβ42 levels in participants of both groups were further analyzed by Pearson correlation analysis. The results showed that serum Aβ42 levels were positively correlated with the TG level (R = 0.14; p < 0.001) (Figure 2B) and negatively correlated with the HDL-c level (R = −0.18; p < 0.001) (Figure 2C). The TC and LDL-c levels showed no linear correlations with serum Aβ42 levels (Figures 2D, E). To further explore the relationship between serum Aβ42 and blood lipids, the two multiple regression models described in the previous section were applied to elucidate the linear correlations between TG and HDL-c levels and serum Aβ42 levels. The results showed that after adjusting for confounding factors, serum Aβ42 levels were negatively and independently correlated with the HDL-c level in participants of both the normal blood lipid group and dyslipidemia group in model 2 (β = −1.741; p < 0.05) (Table 4).
3.4 Association between high serum Aβ42 level and hypertension
Serum Aβ42 levels were compared between the normal blood pressure group and the hypertension group, and no significant difference in serum Aβ42 levels was found between these two groups by Mann–Whitney U test (50.49 pg/mL vs. 55.37 pg/mL, p = 0.164). The Pearson correlation analysis showed that serum Aβ42 levels were positively correlated with DBP in participants of both groups (R = 0.12, p < 0.001, Figure 2F), while not correlated with SBP (Figure 2G). After adjusting for confounding factors, multiple regression analyses further demonstrated the positive correlations between serum Aβ42 levels and DBP in both models (model 1: β = 0.541; p < 0.05; model 2: β = 0.546; p < 0.05) (Table 4).
3.5 Correlation between serum Aβ42 levels and MetS in adults
To determine which out of the five MetS components, including abdominal obesity, high glucose, high triglyceride, low/high-density lipoprotein cholesterol levels, and hypertension predominantly cause Aβ42 elevations in the peripheral blood, we analyzed correlations between serum Aβ42 of participants with individual criteria of the metabolic syndrome at least three abnormal findings out of five factors. According to the above analyses, the level of serum Aβ42 was significantly higher with the presence of abdominal obesity, high TC, low HDL-c, and hypertension, but not impaired fasting glucose (Tables 1–5).
To evaluate the association between Aβ42 and metabolic syndrome, multivariate logistic regression analyses were performed (Table 5). Metabolic syndrome was treated as the outcome measurement. After multivariate adjustment including age, gender, smoking, alcohol, and ApoE carrier, logistic regression analysis showed a significant association between Aβ42 level and metabolic syndrome (OR, 26.8; 95% CI, 14.2–40.7; p < 0.001) (Table 6).
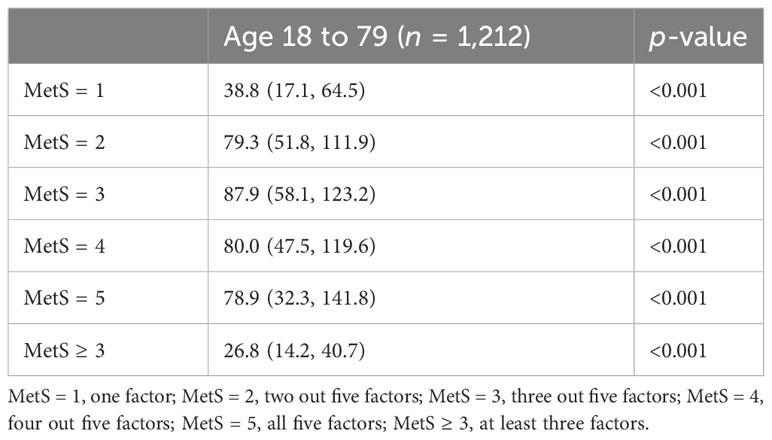
Table 6 Comparison of serum Aβ42 levels among participants associated with MetS.
To determine whether the level of Aβ42 in peripheral blood corresponds to the number of clinical measures fulfilling MetS criteria, we further categorized participants into five groups (MetS1–MetS5). The serum Aβ42 levels significantly increased with the number of MetS criteria fulfilled from one to five (Tables 5, 6), which was also consistent with the previous individual analysis of the five factors. In addition, as expected, we found that a high serum Aβ42 level was related to MetS.
4 Discussion
This clinical observational study demonstrated that Aβ42 levels are positively correlated with BMI and DBP and negatively correlated with levels of HDL-c. Moreover, we uncovered positive associations between serum Aβ42 levels and MetS, along with their individual clinical measures. We found no significant relationships between peripheral Aβ42 levels and TC, TG, or LDL-c. Our study contributes to a body of evidence that attempts to explain the direct role of serum Aβ24 in metabolic conditions by adding unique data from the Han Chinese population, which has been understudied in this field, along with strong statistical analyses of a large sample size.
Previous clinical studies in various populations have demonstrated similar positive correlations between Aβ42 levels and MetS and related risk factors. Higher levels of Aβ42 in the peripheral blood of adults and children were associated with higher BMI (29, 41). Using cross-sectional analysis, Wei et al. (42) reported that plasma Aβ24 levels in 1,436 adults were positively correlated with HDL-c and negatively correlated with TG. Another 5-year prospective study in 440 elderly persons showed that participants with the highest third of TC or LDL-c at baseline showed lower plasma Aβ42 levels at 5 years (31). However, there has also been contradictory evidence regarding the relationship between Aβ42 and metabolic disorders. A study reported a negative and marginal correlation (p = 0.05) between BMI and serum Aβ42 levels in 530 elderly African American, Caribbean Hispanic, and White participants (43). These opposing conclusions could be a result of differences in participant ethnic groups and/or immunodetection methods, including the use of different polyclonal antibodies.
Several mechanisms have been proposed to explain the correlations observed between metabolic abnormalities, serum Aβ42 levels, and AD. Circulating HDL-c has been shown to play an important role in translocating Aβ42 for degradation and/or excretion (44). As such, low levels of HDL-c may reflect worse conditions for solubility and contribute to the imbalance of Aβ42 degradation. Indeed, our study demonstrated a significant and negative correlation between HDL-c and Aβ42 levels. Furthermore, accumulating evidence suggests that elevated midlife blood pressure is associated with an increased risk of cognitive impairment and dementia (45, 46), and thus blood pressure should be considered a potential confound for serum Aβ42 levels (47, 48). Unsurprisingly, our results showed a positive correlation between DBP and Aβ42 levels, consistent with previous literature (49). This can be explained mechanistically, as elevated serum Aβ42 has been shown to reduce endothelial NO synthase, leading to lower NO production, impaired vascular relaxation, and elevated blood pressure (50). Controlled animal studies also support human observational studies. Under a high-fat diet, endogenous melatonin reduction (EMR) mice showed decreased anti-stress ability and had greater body weight and more obvious hepatic steatosis compared with the wild-type group; furthermore, 8-month-old EMR mice had AD-like phenotypes, including Iba-1 activation, Aβ protein deposition, and decreased spatial memory ability (51).
Yet another pathway by which metabolic disturbances can affect Aβ42 levels is through neuroinflammation and blood–brain-barrier (BBB) disruption. Previous studies show that MetS is associated with increased levels of reactive oxygen species, glucose, fibrinogen, and free fatty acids from the vasculature, skeletal muscle, liver, and adipose tissue, prompting insulin resistance (IR), hyperglycemia, inflammation, and dyslipidemia, respectively (52). General inflammation, neuroinflammation from IR, and the increase in inflammatory marker IL-6 can upregulate the expression of APP (53), which is expressed in both central and peripheral tissues and is cleaved by proteases to generate Aβ. Aβ can cross the BBB to form a dynamic equilibrium in the CSF and peripheral blood. LRP1 on the BBB is responsible for transporting Aβ from the CSF to the periphery, while receptors for advanced glycation end products (RAGE) can transport peripheral Aβ into the brain parenchyma (54). The expression levels of LRP1 and RAGE on the BBB are related to the risk of AD. Studies have shown that elevated Aβ can reduce the expression of LRP1 and increase the expression of RAGE levels (55). Thus, in the presence of MetS, serum Aβ42 rises with general inflammation and neuroinflammation, leading to Aβ accumulation in the brain and an unbalanced equilibrium favoring Aβ transport into the CSF by RAGE, resulting in a cycle that aggravates Aβ deposition in the brain.
While serum Aβ42 has been proposed as a biomarker for monitoring the systemic risk of AD in mid-life to predict AD occurrence in late life, published results on the correlation of blood Aβ and CSF Aβ with the presence of AD are inconsistent and even contradictory to date. Factors such as liver function (56–58) and, as we and others have demonstrated, a host of metabolic abnormalities, greatly affect levels of Aβ in the periphery. Aβ in the periphery is not only attributed to efflux of the brain Aβ but is also derived from the proteolytic cleavage of APP expressed in peripheral organs and tissues (8, 59–62). Hence, serum APP and Aβ42 levels may not reflect the levels of APP and Aβ42 in the brain because a large amount of plasma Aβ comes from peripheral sources (4, 63–65). In contrast, we have demonstrated positive correlations between serum Aβ42 levels and MetS, along with each of its associated factors. Furthermore, we found that the serum Aβ42 levels were significantly increased with the number of MetS criteria fulfilled. Thus, we propose the potential role of serum Aβ42 as a direct biomarker for MetS rather than for AD.
Aside from studies on Aβ, prior literature has more generally examined the biological complexity of AD pathophysiology through a systemic lens. For example, studies have shown that the selective disruption of circadian timing within cortical and limbic circuits underlies certain cognitive deficits in AD, and events in AD pathogenesis including amyloid deposition, oxidative stress, and cell death in turn lead to further disruption of the circadian rhythm (66, 67). Circadian rhythm disruption has also been related to a lack of hormonal homeostasis and nonalcoholic fatty liver disease (68, 69) and may be a major contributor to key components of MetS and its comorbidities (70). The circadian system could be a possible link between the metabolic disturbances we observe associated with AD, meriting further study.
It is clear that AD and MetS are complex systemic diseases with countless involved pathways and numerous methods of study. Here, we have presented data that reaffirms the connection between Aβ42 and MetS and supports the role of Aβ42 as a clinical biomarker for MetS. We also acknowledge the following limitations of our work. Firstly, our study population includes only the Han population and precludes conclusions that span multiple ethnic groups, particularly given the contradicting evidence from previous literature. Secondly, our study takes place at a single hospital, which may limit its generalization to other locations. A multicenter study utilizing our published protocols would greatly strengthen the power of the results. Finally, we believe that the addition of CSF Aβ42 measurements, while logistically difficult, would greatly inform our understanding of the mechanistic connection between MetS and AD by correlating brain and serum Aβ42 levels. We plan to collect CSF specimens in a future study for this investigation.
5 Conclusions
To the best of our knowledge, this is the first comprehensive report on the correlations of serum Aβ42 levels with BMI, blood lipids, blood pressure, and MetS in the Han Chinese population in Southwest China. We reveal strong correlations between serum Aβ42 levels and MetS, as well as the individual factors comprising MetS. Furthermore, our study found that BMI and DBP levels were positively associated with serum Aβ42 levels, while HDL-c was negatively associated with serum Aβ42 levels. These results indicate that dysregulated MetS is associated with higher serum Aβ42 levels. Therefore, we recommend serum Aβ42 be used as a direct risk biomarker for MetS and its components rather than for AD. The study was exploratory and aimed to contribute to the body of controversial evidence surrounding Aβ42. The findings encourage further research investigating the detailed mechanisms of how serum Aβ42 levels interact with brain Aβ42 levels in MetS and AD.
Data availability statement
The original contributions presented in the study are included in the article/supplementary material. Further inquiries can be directed to the corresponding authors.
Ethics statement
The studies involving humans were approved by Ethics Committee of Sichuan Academy of Medical Sciences & Sichuan Provincial People’s Hospital (2020No.281). The studies were conducted in accordance with the local legislation and institutional requirements. The participants provided their written informed consent to participate in this study.
Author contributions
KL: Data curation, Formal analysis, Writing – original draft. XZ: Writing – original draft, Writing – review & editing, Formal analysis. YRL: Data curation. DL: Data curation. YYL: Data curation. TZ: Data curation. CF: Data curation. LL: Formal analysis, Writing – original draft. YH: Writing – review & editing. LJ: Conceptualization, Funding acquisition, Project administration, Writing – review & editing.
Funding
The author(s) declare financial support was received for the research, authorship, and/or publication of this article. This work was supported by a Grant from the Natural Science Foundation of China (No. 81670893), the National Natural Science Foundation of China (No. 82372339), a Grant from the Science and Technology Department of Sichuan Province (No. 2021JDZH0031), the Clinical Research and Transformation Fund of Sichuan Academy of Medical Sciences and Sichuan Provincial People’s Hospital (2021LY04 and 2022QN21), the Sichuan Science and Technology Program (2022YFS0638), and the Health Care Committee of Sichuan Province (CGY2021-227).
Acknowledgments
We sincerely thank our patients for participating in and supporting this study.
Conflict of interest
The authors declare that the research was conducted in the absence of any commercial or financial relationships that could be construed as a potential conflict of interest.
Publisher’s note
All claims expressed in this article are solely those of the authors and do not necessarily represent those of their affiliated organizations, or those of the publisher, the editors and the reviewers. Any product that may be evaluated in this article, or claim that may be made by its manufacturer, is not guaranteed or endorsed by the publisher.
Abbreviations
Aβ, amyloid beta; Aβ42, amyloid beta 42; AD, Alzheimer’s disease; BMI, body mass index; MetS, metabolic syndrome; DBP, diastolic blood pressure; SBP, systolic blood pressure; HDL-c, high-density lipoprotein; APP, amyloid precursor protein; TC, total cholesterol; TG, triglyceride; LDL-c, low-density lipoprotein; GLU, glucose.
References
1. Scheltens P, Blennow K, Breteler MM, de Strooper B, Frisoni GB, Salloway S, et al. Alzheimer's disease. Lancet (2016) 388(10043):505–17. doi: 10.1016/S0140-6736(15)01124-1
2. Selkoe DJ, Hardy J. The amyloid hypothesis of Alzheimer's disease at 25 years. EMBO Mol Med (2016) 8(6):595–608. doi: 10.15252/emmm.201606210
3. Campos-Pena V, Toral-Rios D, Becerril-Perez F, Sanchez-Torres C, Delgado-Namorado Y, Torres-Ossorio E, et al. Metabolic syndrome as a risk factor for alzheimer's disease: Is abeta a crucial factor in both pathologies? Antioxid Redox Signal (2017) 26(10):542–60. doi: 10.1089/ars.2016.6768
4. R. CJ, J. AN, K. KT, Tomotaka. T, Michael. S, Henrik. Z, et al. Blood-based high sensitivity measurements of beta-amyloid and phosphorylated tau as biomarkers of Alzheimer's disease: a focused review on recent advances. J Neurol Neurosurg Psychiatry (2021) 9(11):1231–41. doi: 10.1136/jnnp-2021-327370
5. Hawksworth J, Fernandez E, Gevaert K. A new generation of AD biomarkers: 2019 to 2021. Ageing Res Rev (2022) 79:101654. doi: 10.1016/j.arr.2022.101654
6. Li RX, Ma YH, Tan L, Yu JT. Prospective biomarkers of Alzheimer's disease: A systematic review and meta-analysis. Ageing Res Rev (2022) 81:101699. doi: 10.1016/j.arr.2022.101699
7. Mandal PK, Maroon JC, Garg A, Arora NK, Bansal R, Kaushik A, et al. Blood biomarkers in alzheimer's disease. ACS Chem Neurosci (2023) 14(22):3975–8. doi: 10.1021/acschemneuro.3c00641
8. Wang J, Gu BJ, Masters CL, Wang YJ. A systemic view of Alzheimer disease - insights from amyloid-beta metabolism beyond the brain. Nat Rev Neurol (2017) 13(10):612–23. doi: 10.1038/nrneurol.2017.111
9. Eckel RH, Alberti KG, Grundy SM, Zimmet PZ. The metabolic syndrome. Lancet (2010) 375(9710):181–3. doi: 10.1016/S0140-6736(09)61794-3
10. Yang HT, Sheen YJ, Kao CD, Chang CA, Hu YC, Lin JL. Association between the characteristics of metabolic syndrome and Alzheimer's disease. Metab Brain Dis (2013) 28(4):597–604. doi: 10.1007/s11011-013-9406-2
11. Reitz C, Mayeux R. Alzheimer disease: epidemiology, diagnostic criteria, risk factors and biomarkers. Biochem Pharmacol (2014) 88(4):640–51. doi: 10.1016/j.bcp.2013.12.024
12. Silva MVF, Loures CMG, Alves LCV, de Souza LC, Borges KBG, Carvalho MDG. Alzheimer's disease: risk factors and potentially protective measures. J BioMed Sci (2019) 26(1):33. doi: 10.1186/s12929-019-0524-y
13. Yan T, Nian T, Wu B, Xiao F, He B, Bi K, et al. Okra polysaccharides can reverse the metabolic disorder induced by high-fat diet and cognitive function injury in Abeta(1-42) mice. Exp Gerontol (2020) 130:110802. doi: 10.1016/j.exger.2019.110802
14. Cameron AJ, Boyko EJ, Sicree RA, Zimmet PZ, Soderberg S, Alberti KG, et al. Central obesity as a precursor to the metabolic syndrome in the AusDiab study and Mauritius. Obes (Silver Spring) (2008) 16(12):2707–16. doi: 10.1038/oby.2008.412
15. Diaz A, Escobedo C, Trevino S, Chavez R, Lopez-Lopez G, Moran C, et al. Metabolic syndrome exacerbates the recognition memory impairment and oxidative-inflammatory response in rats with an intrahippocampal injection of amyloid beta 1-42. Oxid Med Cell Longev (2018) 2018:1358057. doi: 10.1155/2018/1358057
16. Ali A, Ali A, Ahmad W, Ahmad N, Khan S, Nuruddin SM, et al. Deciphering the role of WNT signaling in metabolic syndrome-linked alzheimer's disease. Mol Neurobiol (2020) 57(1):302–14. doi: 10.1007/s12035-019-01700-y
17. Henn RE, Noureldein MH, Elzinga SE, Kim B, Savelieff MG, Feldman EL. Glial-neuron crosstalk in health and disease: A focus on metabolism, obesity, and cognitive impairment. Neurobiol Dis (2022) 170:105766. doi: 10.1016/j.nbd.2022.105766
18. Cisternas P, Gherardelli C, Gutierrez J, Salazar P, Mendez-Orellana C, Wong GW, et al. Adiponectin and resistin modulate the progression of Alzheimer s disease in a metabolic syndrome model. Front Endocrinol (Lausanne) (2023) 14:1237796. doi: 10.3389/fendo.2023.1237796
19. Saklayen MG. The global epidemic of the metabolic syndrome. Curr Hypertens Rep (2018) 20(2):12. doi: 10.1007/s11906-018-0812-z
20. Fitzpatrick AL, Kuller LH, Lopez OL, Diehr P, O'Meara ES, Longstreth WT Jr., et al. Midlife and late-life obesity and the risk of dementia: cardiovascular health study. Arch Neurol (2009) 66(3):336–42. doi: 10.1001/archneurol.2008.582
21. Profenno LA, Porsteinsson AP, Faraone SV. Meta-analysis of Alzheimer's disease risk with obesity, diabetes, and related disorders. Biol Psychiatry (2010) 67(6):505–12. doi: 10.1016/j.biopsych.2009.02.013
22. Anstey KJ, Cherbuin N, Budge M, Young J. Body mass index in midlife and late-life as a risk factor for dementia: a meta-analysis of prospective studies. Obes Rev (2011) 12(5):e426–437. doi: 10.1111/j.1467-789X.2010.00825.x
23. Norton S, Matthews FE, Barnes DE, Yaffe K, Brayne C. Potential for primary prevention of Alzheimer's disease: an analysis of population-based data. Lancet Neurol (2014) 13(8):788–94. doi: 10.1016/S1474-4422(14)70136-X
24. Lee YH, Tharp WG, Maple RL, Nair S, Permana PA, Pratley RE. Amyloid precursor protein expression is upregulated in adipocytes in obesity. Obes (Silver Spring) (2008) 16(7):1493–500. doi: 10.1038/oby.2008.267
25. Lee YH, Martin JM, Maple RL, Tharp WG, Pratley RE. Plasma amyloid-beta peptide levels correlate with adipocyte amyloid precursor protein gene expression in obese individuals. Neuroendocrinology (2009) 90(4):383–90. doi: 10.1159/000235555
26. Walker JM, Dixit S, Saulsberry AC, May JM, Harrison FE. Reversal of high fat diet-induced obesity improves glucose tolerance, inflammatory response, beta-amyloid accumulation and cognitive decline in the APP/PSEN1 mouse model of Alzheimer's disease. Neurobiol Dis (2017) 100:87–98. doi: 10.1016/j.nbd.2017.01.004
27. Mayeux R, Honig LS, Tang MX, Manly J, Stern Y, Schupf N, et al. Plasma A[beta]40 and A[beta]42 and Alzheimer's disease: relation to age, mortality, and risk. Neurology (2003) 61(9):1185–90. doi: 10.1212/01.wnl.0000091890.32140.8f
28. Balakrishnan K, Verdile G, Mehta PD, Beilby J, Nolan D, Galvão DA, et al. Plasma Abeta42 correlates positively with increased body fat in healthy individuals. J Alzheimers Dis (2005) 8(3):269–82. doi: 10.3233/jad-2005-8305
29. Kelvin. B, Giuseppe. V, D. MP, John. B, David. N, A. GD, et al. Plasma Aβ42 correlates positively with increased body fat in healthy individuals. J Alzheimers Dis (2005) 8(3):269–82. doi: 10.3233/jad-2005-8305
30. Luciano R, Barraco GM, Muraca M, Ottino S, Spreghini MR, Sforza RW, et al. Biomarkers of alzheimer disease, insulin resistance, and obesity in childhood Pediatrics. (2015) 135(6):1074–81. doi: 10.1542/peds.2014-2391
31. Blasko I, Kemmler G, Jungwirth S, Wichart I, Weissgram S, Jellinger K, et al. Prospective study on association between plasma amyloid beta-42 and atherosclerotic risk factors. J Neural Transm (Vienna) (2011) 118(5):663–72. doi: 10.1007/s00702-011-0599-4
32. Abdullah L, Luis C, Paris D, Ait-ghezala G, Mouzon B, Allen E, et al. High serum Abeta and vascular risk factors in first-degree relatives of Alzheimer's disease patients. Mol Med (2009) 15(3-4):95–100. doi: 10.2119/molmed.2008.00118
33. Zou ZY, Yang YD, Wang S, Dong B, Li XH, Ma J. The importance of blood lipids in the association between BMI and blood pressure among Chinese overweight and obese children. Br J Nutr (2016) 116(1):45–51. doi: 10.1017/S0007114516001744
34. Arendash G, Su G, Crawford F, Bjugstad K. Intravascular beta-amyloid infusion increases blood pressure: implications for a vasoactive role of beta amyloid in the pathogenesis of Alzheimer's disease. Neurosci Lett (1999) 268(1):17–20. doi: 10.1016/s0304-3940(99)00239-6
35. Wu Y, Wang Z, Yin J, Yang B, Fan J, Cheng Z. Association plasma abeta42 levels with alzheimer's disease and its influencing factors in chinese elderly population. Neuropsychiatr Dis Treat (2022) 18:1831–41. doi: 10.2147/NDT.S374722
36. Unger T, Borghi C, Charchar F, Khan NA, Poulter NR, Prabhakaran D, et al. 2020 International Society of Hypertension global hypertension practice guidelines. J Hypertens (2020) 38(6):982–1004. doi: 10.1097/HJH.0000000000002453
37. Junren Z. Guidelines for the prevention and treatment of dyslipidemia in Chinese adults. Chin J Cardiol (2007) 35(5):1–30. China, J.C.f.t.F.o.G.f.t.P.a.T.o.A.B.L.D.i.
38. Alberti KG, Eckel RH, Grundy SM, Zimmet PZ, Cleeman JI, Donato KA, et al. Harmonizing the metabolic syndrome: a joint interim statement of the International Diabetes Federation Task Force on Epidemiology and Prevention; National Heart, Lung, and Blood Institute; American Heart Association; World Heart Federation; International Atherosclerosis Society; and International Association for the Study of Obesity. Circulation (2009) 120(16):1640–5. doi: 10.1161/CIRCULATIONAHA.109.192644
39. Frisardi V. Impact of metabolic syndrome on cognitive decline in older age: protective or harmful, where is the pitfall? J Alzheimers Dis (2014) 41(1):163–7. doi: 10.3233/JAD-140389
40. Xu T, Zhu G, Han S. Prevalence of and lifestyle factors associated with metabolic syndrome determined using multi-level models in Chinese adults from a cross-sectional survey. Med (Baltimore) (2020) 99(44):e22883. doi: 10.1097/MD.0000000000022883
41. Luciano R, Barraco GM, Muraca M, Ottino S, Spreghini MR, Sforza RW, et al. Biomarkers of Alzheimer disease, insulin resistance, and obesity in childhood. Pediatrics (2015) 135(6):1074–81. doi: 10.1542/peds.2014-2391
42. Wei S, Shang S, Dang L, Gao F, Gao Y, Gao L, et al. Blood triglyceride and high-density lipoprotein levels are associated with plasma amyloid-beta transport: A population-based cross-sectional study. J Alzheimers Dis (2021) 84(1):303–14. doi: 10.3233/JAD-210405
43. R. M, S. HL, M-X. T, J. M, Y. S, N. S, et al. Plasma Aβ40 and Aβ42 and Alzheimer's disease: relation to age, mortality, and risk. Neurology (2003) 61(9):1185–90. doi: 10.1212/01.wnl0000091890.32140.8f
44. Jerome R, B. BE, Brian. Y, Megan. G, Kevin. K, Arvin. B, et al. Clearance of beta-amyloid is facilitated by apolipoprotein E and circulating high-density lipoproteins in bioengineered human vessels. Elife (2017) 6:e29595. doi: 10.7554/eLife.29595.00110.7554/eLife.29595.002
45. McGrath ER, Beiser AS, DeCarli C, Plourde KL, Vasan RS, Greenberg SM, et al. Blood pressure from mid- to late life and risk of incident dementia. Neurology (2017) 89(24):2447–54. doi: 10.1212/WNL.0000000000004741
46. Ou YN, Tan CC, Shen XN, Xu W, Hou XH, Dong Q, et al. Blood pressure and risks of cognitive impairment and dementia: A systematic review and meta-analysis of 209 prospective studies. Hypertension (2020) 76(1):217–25. doi: 10.1161/HYPERTENSIONAHA.120.14993
47. Ruiz A, Pesini P, Espinosa A, Perez-Grijalba V, Valero S, Sotolongo-Grau O, et al. Blood amyloid beta levels in healthy, mild cognitive impairment and Alzheimer's disease individuals: replication of diastolic blood pressure correlations and analysis of critical covariates. PloS One (2013) 8(11):e81334. doi: 10.1371/journal.pone.0081334
48. Hu N, Gao L, Jiang Y, Wei S, Shang S, Chen C, et al. The relationship between blood lipids and plasma amyloid beta is depend on blood pressure: a population-based cross-sectional study. Lipids Health Dis (2020) 19(1):8. doi: 10.1186/s12944-020-1191-4
49. Langbaum JB, Chen K, Launer LJ, Fleisher AS, Lee W, Liu X, et al. Blood pressure is associated with higher brain amyloid burden and lower glucose metabolism in healthy late middle-age persons. Neurobiol Aging (2012) 33(4):827.e811–829. doi: 10.1016/j.neurobiolaging.2011.06.020
50. Meakin PJ, Coull BM, Tuharska Z, McCaffery C, Akoumianakis I, Antoniades C, et al. Elevated circulating amyloid concentrations in obesity and diabetes promote vascular dysfunction. J Clin Invest (2020) 130(8):4104–17. doi: 10.1172/JCI122237
51. Hang B, Chen T, Cao M, Yuan C, Reiter RJ, Zhao Z, et al. Gut microbiota dysbiosis induced by decreasing endogenous melatonin mediates the pathogenesis of alzheimer's disease and obesity! Front Immunol (2022) 13:900132. doi: 10.3389/fimmu.2022.900132
52. Khan S, Pati S, Singh S, Akhtar M, Khare P, Khan S, et al. Targeting hypercoagulation to alleviate Alzheimer's disease progression in metabolic syndrome. Int J Obes (Lond) (2022) 46(2):245–54. doi: 10.1038/s41366-021-00977-1
53. Ringheim GE, Szczepanik AM, Petko W, Burgher KL, Zhu SZ, Chao CC. Enhancement of beta-amyloid precursor protein transcription and expression by the soluble interleukin-6 receptor/interleukin-6 complex. Brain Res Mol Brain Res (1998) 55(1):35–44. doi: 10.1016/s0169-328x(97)00356-2
54. Cai Z, Qiao PF, Wan CQ, Cai M, Zhou NK, Li Q. Role of blood-brain barrier in alzheimer's disease. J Alzheimers Dis (2018) 63(4):1223–34. doi: 10.3233/JAD-180098
55. Han L, Jiang C. Evolution of blood-brain barrier in brain diseases and related systemic nanoscale brain-targeting drug delivery strategies. Acta Pharm Sin B (2021) 11(8):2306–25. doi: 10.1016/j.apsb.2020.11.023
56. Hone E, Martins I, Fonte J, R. N. Apolipoprotein E influences amyloid-beta clearance from the murine periphery. J Alzheimers Dis (2003) 5(1):1–8. doi: 10.3233/jad-2003-5101
57. Ghiso J, Shayo M, Calero M, Ng D, Tomidokoro Y, Gandy S, et al. Systemic catabolism of alzheimer's abeta40 and abeta42. J Biol Chem (2004) 279(44):45897–908. doi: 10.1074/jbc.M407668200
58. Shie FS, Shiao YJ, Yeh CW, Lin CH, Tzeng TT, Hsu HC, et al. Obesity and hepatic steatosis are associated with elevated serum amyloid beta in metabolically stressed APPswe/PS1dE9 mice. PloS One (2015) 10(8):e0134531. doi: 10.1371/journal.pone.0134531
59. Roher AE, Esh CL, Kokjohn TA, Castano EM, Van Vickle GD, Kalback WM, et al. Amyloid beta peptides in human plasma and tissues and their significance for Alzheimer's disease. Alzheimers Dement (2009) 5(1):18–29. doi: 10.1016/j.jalz.2008.10.004
60. Qosa H, Abuasal BS, Romero IA, Weksler B, Couraud PO, Keller JN, et al. Differences in amyloid-beta clearance across mouse and human blood-brain barrier models: kinetic analysis and mechanistic modeling. Neuropharmacology (2014) 79:668–78. doi: 10.1016/j.neuropharm.2014.01.023
61. Xiang Y, Bu XL, Liu YH, Zhu C, Shen LL, Jiao SS, et al. Physiological amyloid-beta clearance in the periphery and its therapeutic potential for Alzheimer's disease. Acta Neuropathol (2015) 130(4):487–99. doi: 10.1007/s00401-015-1477-1
62. Yuede CM, Lee H, Restivo JL, Davis TA, Hettinger JC, Wallace CE, et al. Rapid in vivo measurement of beta-amyloid reveals biphasic clearance kinetics in an Alzheimer's mouse model. J Exp Med (2016) 213(5):677–85. doi: 10.1084/jem.20151428
63. Kester MI, Verwey NA, van Elk EJ, Scheltens P, Blankenstein MA. Evaluation of plasma Abeta40 and Abeta42 as predictors of conversion to Alzheimer's disease in patients with mild cognitive impairment. Neurobiol Aging (2010) 31(4):539–40. doi: 10.1016/j.neurobiolaging.2008.07.024
64. Janelidze S, Stomrud E, Palmqvist S, Zetterberg H, van Westen D, Jeromin A, et al. Plasma beta-amyloid in Alzheimer's disease and vascular disease. Sci Rep (2016) 6:26801. doi: 10.1038/srep26801
65. Schindler SE, Bollinger JG, Ovod V, Mawuenyega KG, Li Y, Gordon BA, et al. High-precision plasma beta-amyloid 42/40 predicts current and future brain amyloidosis. Neurology (2019) 93(17):e1647–59. doi: 10.1212/WNL.0000000000008081
66. Bassendine MF, Taylor-Robinson SD, Fertleman M, Khan M, Neely D. Is alzheimer's disease a liver disease of the brain? J Alzheimers Dis (2020) 75(1):1–14. doi: 10.3233/JAD-190848
67. Hoyt KR, Obrietan K. Circadian clocks, cognition, and Alzheimer's disease: synaptic mechanisms, signaling effectors, and chronotherapeutics. Mol Neurodegener (2022) 17(1):35. doi: 10.1186/s13024-022-00537-9
68. Gnocchi D, Bruscalupi G. Circadian rhythms and hormonal homeostasis: Pathophysiological implications. Biol (Basel) (2017) 6(1):10. doi: 10.3390/biology6010010
69. Gnocchi D, Custodero C, Sabba C, Mazzocca A. Circadian rhythms: a possible new player in non-alcoholic fatty liver disease pathophysiology. J Mol Med (Berl) (2019) 97(6):741–59. doi: 10.1007/s00109-019-01780-2
Keywords: metabolic syndrome, serum amyloid beta 42 (Aβ42), body mass index (BMI), blood lipids, blood pressure, Alzheimer’s disease (AD)
Citation: Li K, Zhou X, Liu Y, Li D, Li Y, Zhang T, Fu C, Li L, Hu Y and Jiang L (2024) Serum amyloid beta 42 levels correlated with metabolic syndrome and its components. Front. Endocrinol. 15:1278477. doi: 10.3389/fendo.2024.1278477
Received: 16 August 2023; Accepted: 15 January 2024;
Published: 08 February 2024.
Edited by:
Yaoting Ji, Wuhan University, ChinaReviewed by:
Davide Gnocchi, University of Bari Aldo Moro, ItalyMuhammad Ikram, The University of Texas Health Science Center at San Antonio, United States
Copyright © 2024 Li, Zhou, Liu, Li, Li, Zhang, Fu, Li, Hu and Jiang. This is an open-access article distributed under the terms of the Creative Commons Attribution License (CC BY). The use, distribution or reproduction in other forums is permitted, provided the original author(s) and the copyright owner(s) are credited and that the original publication in this journal is cited, in accordance with accepted academic practice. No use, distribution or reproduction is permitted which does not comply with these terms.
*Correspondence: Yang Hu, aHUxMTF5YW5nQDE2My5jb20=; Li Jiang, MjQ3ODYzOTE1MkBxcS5jb20=
†These authors have contributed equally to this work