 Niina Sandholm
 Emma H. Dahlström
 Per-Henrik Groop
- 1Folkhälsan Institute of Genetics, Folkhälsan Research Center, Helsinki, Finland
- 2Department of Nephrology, University of Helsinki and Helsinki University Hospital, Helsinki, Finland
- 3Research Program for Clinical and Molecular Metabolism, Faculty of Medicine, University of Helsinki, Helsinki, Finland
- 4Department of Diabetes, Central Clinical School, Monash University, Melbourne, VIC, Australia
Diabetic kidney disease (DKD) is a severe diabetic complication that affects up to half of the individuals with diabetes. Elevated blood glucose levels are a key underlying cause of DKD, but DKD is a complex multifactorial disease, which takes years to develop. Family studies have shown that inherited factors also contribute to the risk of the disease. During the last decade, genome-wide association studies (GWASs) have emerged as a powerful tool to identify genetic risk factors for DKD. In recent years, the GWASs have acquired larger number of participants, leading to increased statistical power to detect more genetic risk factors. In addition, whole-exome and whole-genome sequencing studies are emerging, aiming to identify rare genetic risk factors for DKD, as well as epigenome-wide association studies, investigating DNA methylation in relation to DKD. This article aims to review the identified genetic and epigenetic risk factors for DKD.
1 Introduction
A total of 537 million people worldwide have diabetes (1), characterized by elevated blood glucose. Despite treatment, which aims to normalize the blood glucose concentrations, diabetes can lead to micro- and macrovascular organ damage through various molecular pathways, including increased reactive oxygen species, which further affect the downstream pathways such as the polyol pathway flux, advanced glycation end-product formation and activation, protein kinase C activation, and the hexosamine pathway flux (2). These microvascular complications include diabetic kidney disease (DKD), sight-threatening proliferative diabetic retinopathy, and diabetic neuropathy. The complications reduce the quality of life, increase mortality, and account for the majority of the health care costs for diabetes (3, 4). Together, 30%–50% of individuals with diabetes develop DKD (5–7). Individuals with type 1 diabetes (T1D) develop diabetes early in life and, thus, have a particularly high lifetime risk of developing complications. In up to 20% of individuals with T1D, DKD leads to kidney failure requiring dialysis or kidney transplantation (8). Because of the improvements in the management and treatment of both diabetes and its complications (9), the 25-year cumulative incidence of DKD has halved in those diagnosed in the 1980s compared to those diagnosed in the 1970s. However, there was no further improvement in the later cohorts, and 36% of individuals with severe DKD still progressed to kidney failure within 15 years (6). DKD also substantially increases the risk of CVD, and as many as 40% of individuals with T1D and DKD develop CVD by the age of 40 (10).
DKD is characterized by urinary albumin excretion and gradually decreasing renal function, measured or estimated as glomerular filtration rate (eGFR). Urinary albumin excretion can be classified as normal or mildly increased, moderately, or severely increased albuminuria; the two latter ones are also called micro- and macroalbuminuria. The classical view has been that albuminuria represents an earlier sign of DKD, followed by reduced eGFR and eventually kidney failure, but a substantial proportion of individuals with DKD may present with reduced kidney function even without albuminuria (11). On the tissue level, DKD is characterized by glomerular and tubular basement membrane thickening, mesangial expansion, glomerulosclerosis, podocyte effacement, and, ultimately, nephron loss (12). It is of note, however, that kidney biopsies are rarely taken for diagnostic purposes. Therefore, any chronic kidney disease (CKD) in an individual with diabetes is a priori considered as DKD, irrespective of the underlying pathophysiology (11). Lack of a biopsy proof is less of a problem in T1D because most of the individuals with T1D and DKD have histologically true diabetic nephropathy.
DKD is a complex multifactorial disease in which both genetic and environmental risk factors contribute to the development and progression of the disease. However, the exact molecular mechanisms leading to DKD remain poorly understood. Apart from albuminuria and eGFR, no other biomarkers are yet in clinical use for monitoring disease progression or identification of individuals at risk, and only a few treatment options exist for the prevention of DKD, especially in individuals with T1D. To address these issues, genetic studies aim to identify the underlying molecular mechanisms leading to DKD. Here, we review the genetic factors that have been identified for DKD, mainly based on genome-wide association studies (GWASs) performed within the latest decade and summarize the main findings from epigenetic studies—being the potential dynamic link between genes and the environment—investigating the DNA methylation changes associated with DKD.
2 Heritability of DKD
Three decades ago, family studies reported clustering of DKD in siblings with T1D, suggesting an inherited component of the disease (13–17). More recently, a genome-wide estimation of the narrow-sense DKD heritability—the proportion of phenotypic variance explained by additive genetic factors—based on unrelated individuals with T1D reported 24%–42% heritability of DKD, depending on the phenotype definition. The heritability estimates were as high as 59% when adjusted for sex, diabetes duration and age at diabetes diagnosis, and with a tendency to higher heritability estimates for the more severe definitions (18). Similar analyses in individuals with T2D suggested only 8%–25% heritability for DKD, potentially reflecting more heterogeneous mechanisms leading to DKD in T2D in addition to a more important contribution of environmental factors (19, 20). Indeed, a sub-analysis of individuals with T2D from the Action to Control Cardiovascular Risk in Diabetes trial suggested that the gene–treatment interaction explains a large part of the phenotypic variance in microalbuminuria. Nevertheless, the heritability estimates for albuminuria and eGFR both in T1D and T2D range between 7% and 75% (19, 21–25).
3 Common genetic variants associated with DKD
3.1 Early genetic studies for DKD
The early genetic studies on DKD utilized various microsatellite markers and single-nucleotide polymorphisms (SNPs) for family-based linkage studies to identify chromosomal regions co-segregating with DKD. One of the strongest linkage peaks with a logarithm of odds (LOD) score of 3.1 was obtained in a candidate gene study of the AGTR1 on chromosome 3q (26), and many genome-wide linkage scans reported a suggestive linkage peak on the extended 3q21-q29 region (27–31). Subsequent fine-mapping efforts of candidate genes on the 3q region, comparing the allele frequencies of tens or hundreds of SNPs in unrelated DKD cases and controls, suggested, e.g., ADIPOQ (32) and NCK1 (33) to be involved in DKD. A linkage analysis in Turkish families with T2D and DKD identified a strong linkage peak on chr18q22.3–23 (LOD score = 6.1) (34), subsequently fine-mapped to a polymorphism in the CNDP1 gene associated with both DKD and serum carnosinase concentrations (35).
In addition to the positional candidates, biological candidate gene studies were performed on the basis of information and hypotheses of the underlying biology. However, the results were mostly inconclusive, with limited statistical evidence due to the small sample number, lenient statistical threshold, and lack of external replication (36). The findings with the strongest statistical evidence include variants on the promoter region of the EPO gene encoding for erythropoietin [rs1617640, p-value = 2.7 × 10⁻¹¹ (37)], as well as in the SLC19A3 gene encoding for a high-affinity thiamine (vitamin B) transporter [rs12694743, p = 2.30 × 10⁻⁸ (38)], both associated with a combined phenotype of kidney failure and diabetic retinopathy.
3.2 Genome-wide association studies on DKD
To overcome the limitations of the candidate gene studies, the first GWASs covering hundreds of thousands of SNPs were pursued nearly two decades ago, identifying genetic risk factors for both T2D (39–41) and T1D (42). The GWASs have since identified thousands of genetic loci affecting common complex diseases, supporting the multifactorial genetic background and the common disease/common variant (CDCV) hypothesis that suggests that common genetic factors significantly contribute to the risk of common diseases and traits (43). Because of the burden of multiple testing of hundreds of thousands, or even millions of genetic variants, only associations reaching the stringent threshold of a p-value < 5 × 10⁻⁸ are considered genome-wide significant. The GWASs on DKD have to date identified 41 loci genome-wide significantly associated with various case-control definitions of DKD, as detailed in Table 1.
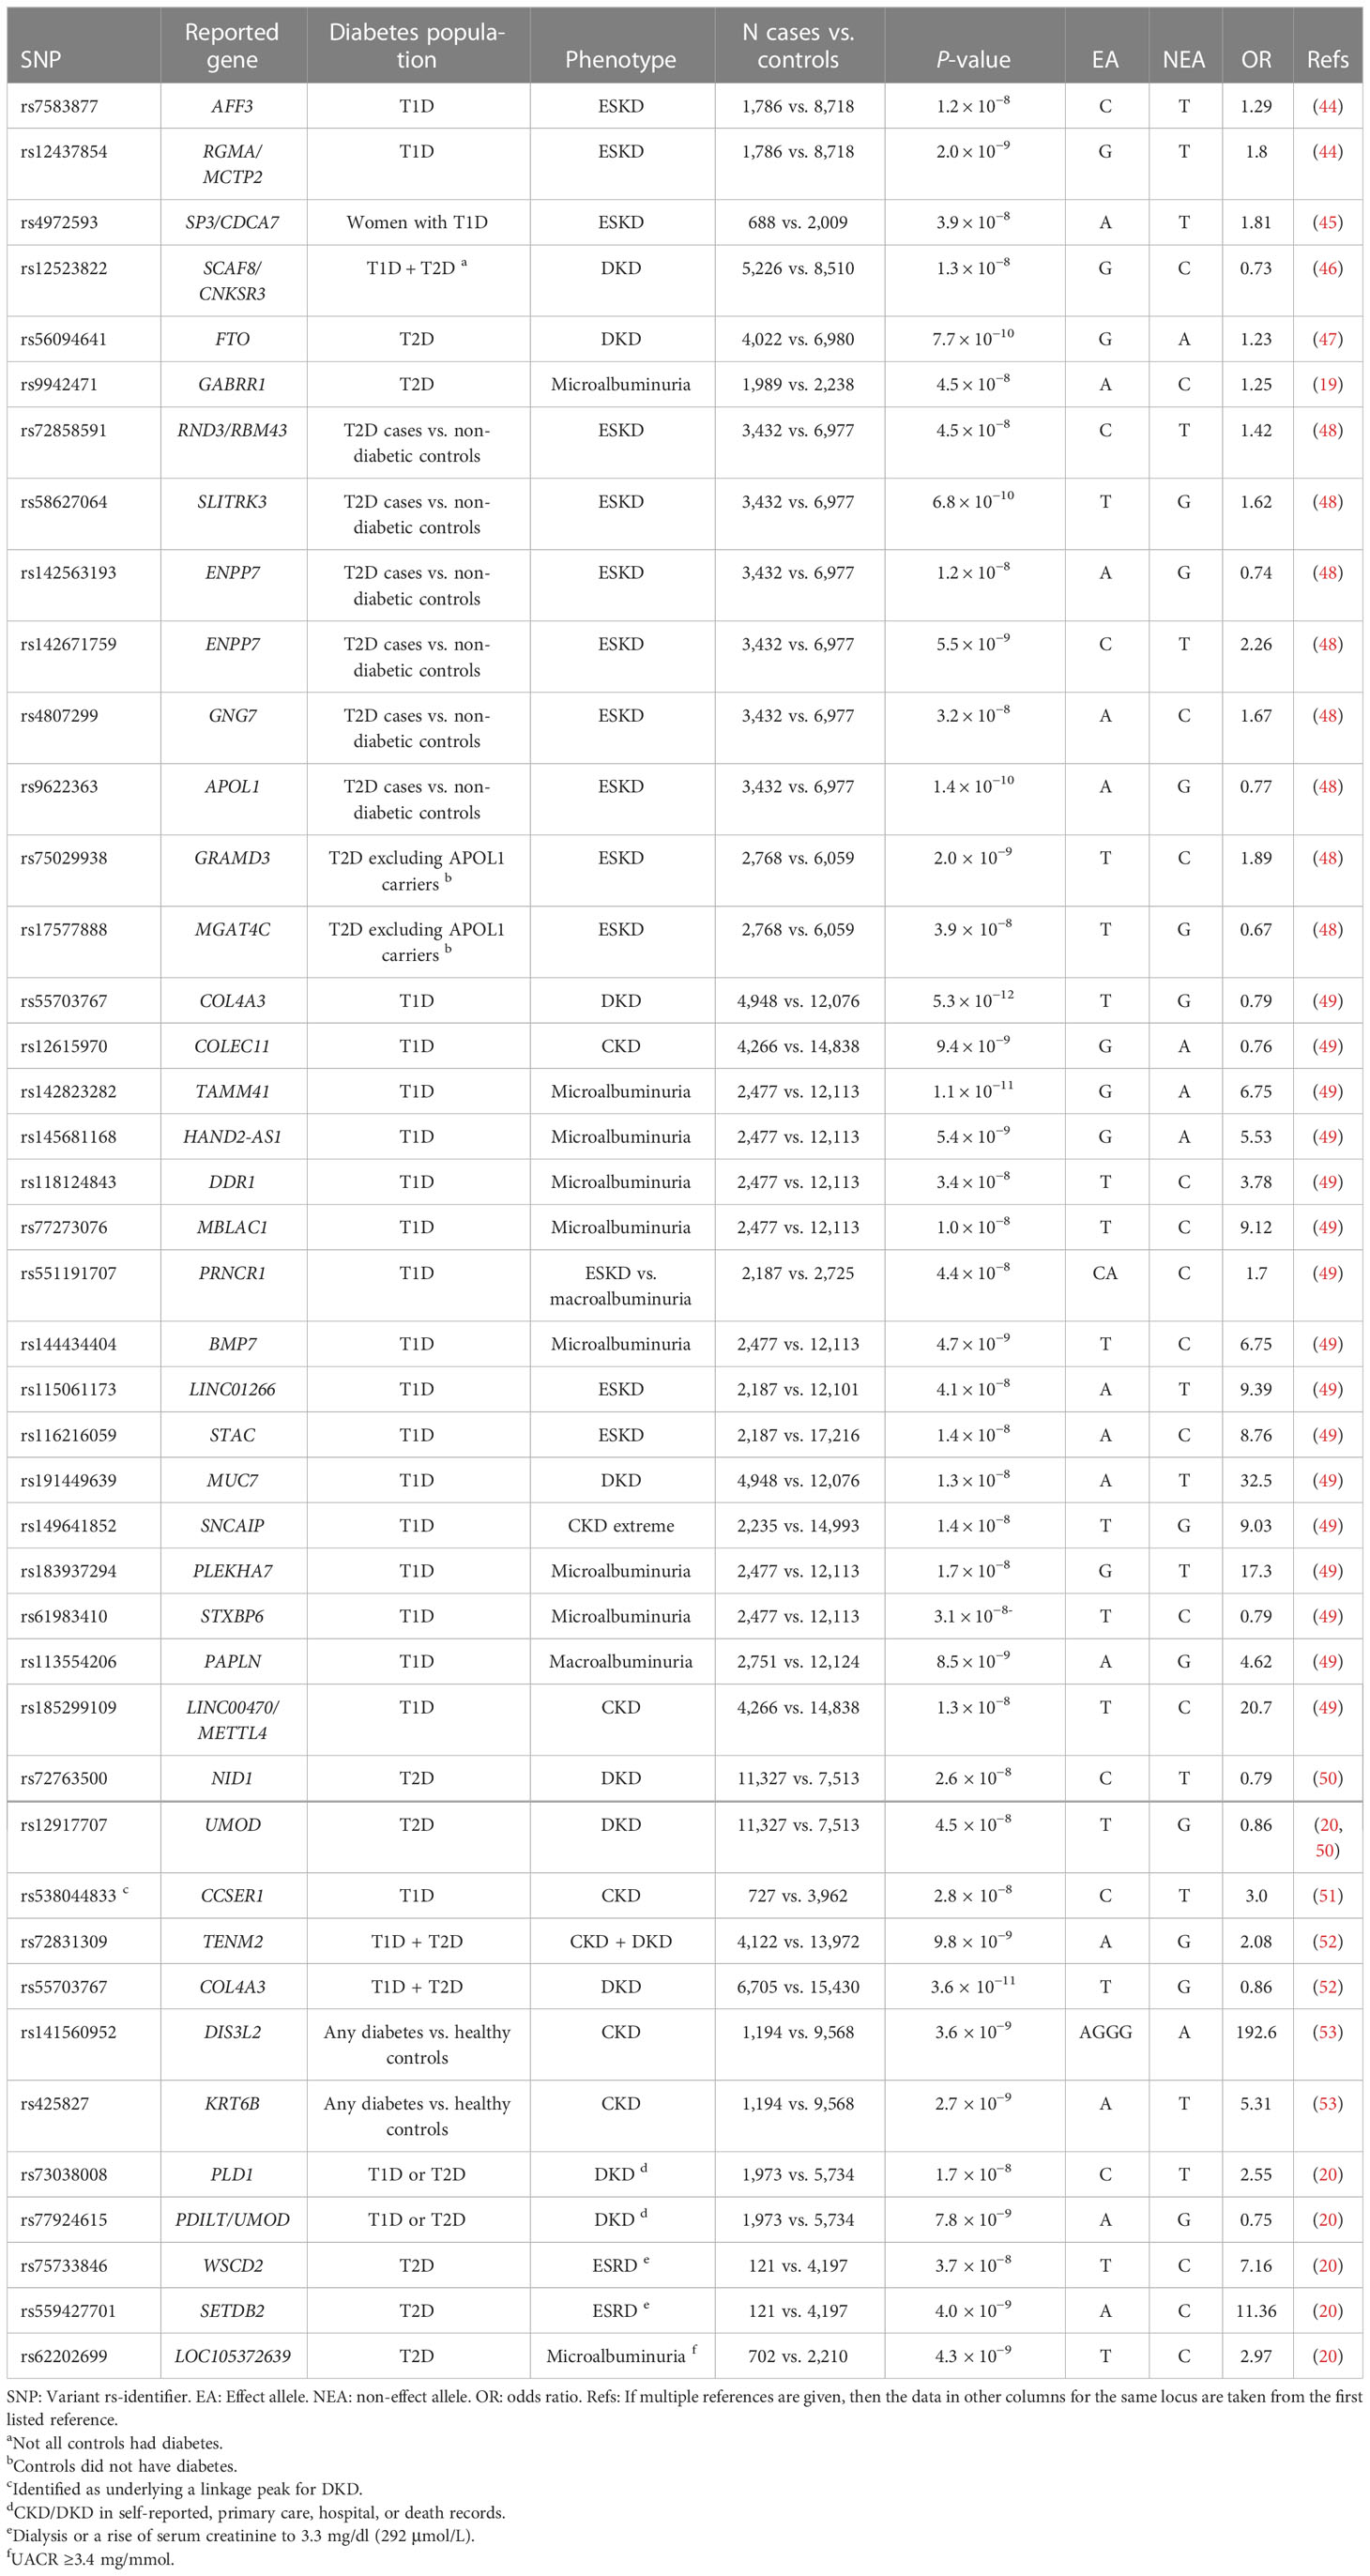
Table 1 Variants genome-wide significantly (p-value < 5 × 10⁻⁸) associated with DKD.
3.2.1 Genome-wide association studies on DKD in type 1 diabetes
One of the first GWASs on DKD included 1,705 individuals with T1D from the Genetics of Kidneys in Diabetes (GoKinD) collection and suggested multiple putative susceptibility loci, including a variant in the FRMD3 gene suggestively associated with DKD (p-value = 5.0 × 10⁻⁷) (54) and replicated by some of the subsequent studies (54, 55). Re-analysis of the data, including imputed variants, suggested additional loci, including SORBS1 (56); variants in the same gene were also supported by a later GWAS including 1,462 additional individuals with T1D, but the association was attenuated in the replication (57).
The first GWAS meta-analysis on DKD combining data across multiple studies was undertaken by the Genetics of Nephropathy, an International Effort consortium. The GWAS meta-analysis discovery stage included 6,691 participants of European ancestry and with T1D from the GoKinD US, the Finnish Diabetic Nephropathy (FinnDiane) Study, and from the All Ireland-Warren 3-Genetics of Kidneys in Diabetes UK and Republic of Ireland (UK-ROI) Collection. The combined meta-analysis with 11,847 participants with T1D resulted in two loci, an intronic variant rs7583877 in AFF3, and an intergenic rs12437854 between in the RGMA and MCTP2 genes associated with kidney failure in T1D with a p-value < 5 × 10⁻⁸. Furthermore, the authors reported a suggestive association for rs7588550 in the ERBB4 gene associated with DKD (p-value = 2.1 × 10⁻⁷). In vitro analyses on a renal epithelial cell line suggested that AFF3 influences the transforming growth factor–β1 (TGF-β1)–induced fibrotic responses (44).
Of note, nearly 90% of the GWAS findings are located on non-coding regions and are enriched for gene regulatory regions, rather than changing the protein amino acid sequence and structure (58, 59). The associated genetic variant does not necessarily affect the gene expression of the underlying or the closest gene, and, thus, a common challenge in GWAS is to identify the target gene of the non-coding regulatory variants. With large expression quantitative trait locus (eQTL) databases that are now available, one can link the genotypes to gene expression levels. On the basis of eQTL data from whole blood in the eQTLGen.org database, the rs7583877 variant in the AFF3 gene is indeed associated with AFF3 gene expression (p-value = 2.9 × 10⁻¹⁹) (60).
In the same consortium, an analysis stratified by gender identified a variant between the SP3 and CDCA7 genes associated with kidney failure in women (rs4972593, p-value = 3.9 × 10⁻⁸) (45). Multiple estrogen-responsive elements were predicted near rs4972593, and the SP3 gene showed higher expression in kidney glomeruli in women (45). Furthermore, the Sp3 transcription factor directly interacts with the estrogen receptor-α (61) and regulates kidney-related genes such as TGFBI, CD2AP, and VEGFA, supporting its role in kidney failure in women with T1D.
The largest GWAS on DKD in T1D to date was performed by the Diabetic Nephropathy Collaborative Research Initiative (DNCRI) consortium, including up to 19,406 individuals with T1D and of European ancestry from 17 cohorts. The analysis comprised 10 different case-control definitions for DKD, based on either albuminuria, eGFR, or both. Altogether, 16 loci reached a p-value < 5 × 10⁻⁸, with the strongest association for a common missense mutation rs55703767 (Asp326Tyr) in the collagen type IV alpha 3 chain (COL4A3) gene, associated with a 21% lower risk of DKD (p-value = 5.3 × 10⁻¹²) (49). The gene encodes a major structural component of the glomerular basement membrane (GBM). In kidney biopsies of the Renin Angiotensin System Study (RASS) study participants with T1D and normal AER, the carriers of the protective variant had thinner GBM (49). The variant effect was dependent on glycemia, as the association at rs55703767 was observed only among individuals with HbA1c ≥ 7.5% in the HbA1c-stratified sub-analysis of 4,321 FinnDiane participants with longitudinal HbA1c measurements. Similarly, in the Diabetes Control and Complications Trial (DCCT), followed by the Epidemiology of Diabetes Interventions and Complications (DCCT-EDIC) study, the rs55703767 effect on DKD was stronger among those recruited in the secondary cohort and randomized to conventional treatment and therefore had higher HbA1c. Thus, the COL4A3 rs55703767 association with DKD seems specific to diabetes and amplified by poor glucose control (49). The lead loci in the DNCRI meta-analysis also included other collagen-related findings: association with microalbuminuria for the rs116772905 variant in the DDR1 gene encoding the epithelial discoidin domain-containing receptor 1, which binds collagens including type IV collagen; and gene aggregate analysis found variants in the COL20A1 gene associated with severe CKD.
3.2.2 Genome-wide association studies on DKD in type 2 diabetes
One of the first GWASs on DKD among individuals with T2D and the first transethnic meta-analysis of DKD included 4,909 individuals with T2D from the Family Investigation of Nephropathy and Diabetes (FIND) consortium in the discovery cohort and, altogether, 13,736 individuals in the final meta-analysis (including 6,229 non-diabetic controls). The analysis identified rs12523822 near the SCAF8 and CNKSR3 genes associated with a 43% lower risk of DKD in American Indians (p-value = 5.7 × 10⁻⁹) and with directionally consistent results across the ethnic groups (46). CNKSR3 is a direct mineralocorticoid receptor target gene highly expressed in the renal cortical collecting ducts. The gene is involved in the transepithelial sodium transport and is upregulated in response to physiologic aldosterone concentrations (62). Clinically, renin-angiotensin-aldosterone system blockade is the main therapy for individuals with DKD and many other kidney diseases (63, 64). It is of note that the Finerenone in Reducing Kidney Failure and Disease Progression in Diabetic Kidney Disease (FIDELIO-DKD) trial with the non-steroidal mineralocorticoid-receptor-antagonist finerenone on top of standard of care showed cardio- and renoprotection in albuminuric individuals with T2D (65).
As end-stage kidney disease (ESKD) is disproportionately affecting African Americans (AAs), a subsequent FIND study GWAS focused on AAs and was extended to 3,432 T2D-ESKD cases and 6,977 non-diabetic non-nephropathy controls (N = 10,409), followed by a discrimination analysis in 2,756 T2D non-nephropathy controls to exclude T2D-associated variants. Six independent variants located in or near RND3/RBM43, SLITRK3, ENPP7, GNG7, EFNB2, and APOL1 were associated with T2D-ESKD (p-value < 5 × 10⁻⁸), whereby variants in EFNB2, GNG7, and APOL1 were also associated with all-cause ESKD (48). EFNB2 encodes Ephrin-B2 and is expressed in the developing nephron and contributes to the glomerular microvascular assembly (66). The APOL1 missense mutations rs73885319 (Ser342Gly), rs60910145 (Ile384Met), and rs71785313 (Asn388 and Tyr389 deletion), also known as the APOL1 G1 and G2 haplotypes, are only found in individuals with African ancestry and are a major contributor to non-diabetic ESKD in AAs (48, 67, 68). To enrich for T2D-associated ESKD, an analysis excluding the APOL1 ESKD-risk allele carriers identified additional variants in the GRAMD3 (rs75029938, p-value = 2.0 × 10⁻⁹) and MGAT4C (rs17577888, p-value = 3.9 × 10⁻⁸) genes (48).
A GWAS in 7,614 Japanese individuals with T2D found the rs56094641 in the FTO gene to be associated with DKD (p-value = 7.6 × 10⁻¹⁰) (47). FTO is one of the strongest genetic loci for obesity and adiposity (69), and rs56094641 is in linkage disequilibrium (LD) with the obesity signal such that the DKD risk-associated allele is also associated with obesity. Indeed, other Mendelian randomization studies utilizing genetic information suggest that obesity is a causal risk factor for DKD (52, 70). However, the association between rs56094641 and DKD was not affected by adjustment for body mass index (BMI), suggesting that the locus affects DKD through another mechanism than an increase in BMI (47). Indeed, the FTO locus has been highlighted as a pleiotropic one, associated with multiple biomarkers and traits such as sweet vs. salty taste preference through modifying the regulatory properties of enhancers targeting the IRX3 and IRX5 gene expression in various tissues (71, 72).
The SUrrogate markers for Micro- and Macrovascular hard endpoints for Innovative diabetes Tools (SUMMIT) Consortium GWAS meta-analysis of DKD in T2D included 5,717 individuals of European ancestry and with T2D at the discovery stage. After joint analysis with additional European individuals, rs9942471 upstream GABRR1, encoding the rho1 subunit of the GABA type a receptor, was associated with microalbuminuria (p-value = 4.5 × 10⁻⁸), although the association did not replicate in Asian individuals or in individuals with T1D (19). The variant is in LD with the lead eQTL association signal for GABRR1 expression in multiple tissues (19). Extended to individuals with T1D and other ethnicities, the joint meta-analysis involved up to 40,340 subjects with diabetes. However, meta-analysis with individuals with T1D (18) revealed no loci for dichotomous DKD phenotypes. Nevertheless, variants in the UMOD and PRKAG2 loci, previously associated with eGFR and CKD in the general population (73, 74), were associated with eGFR also in individuals with diabetes (Table 2) (19).
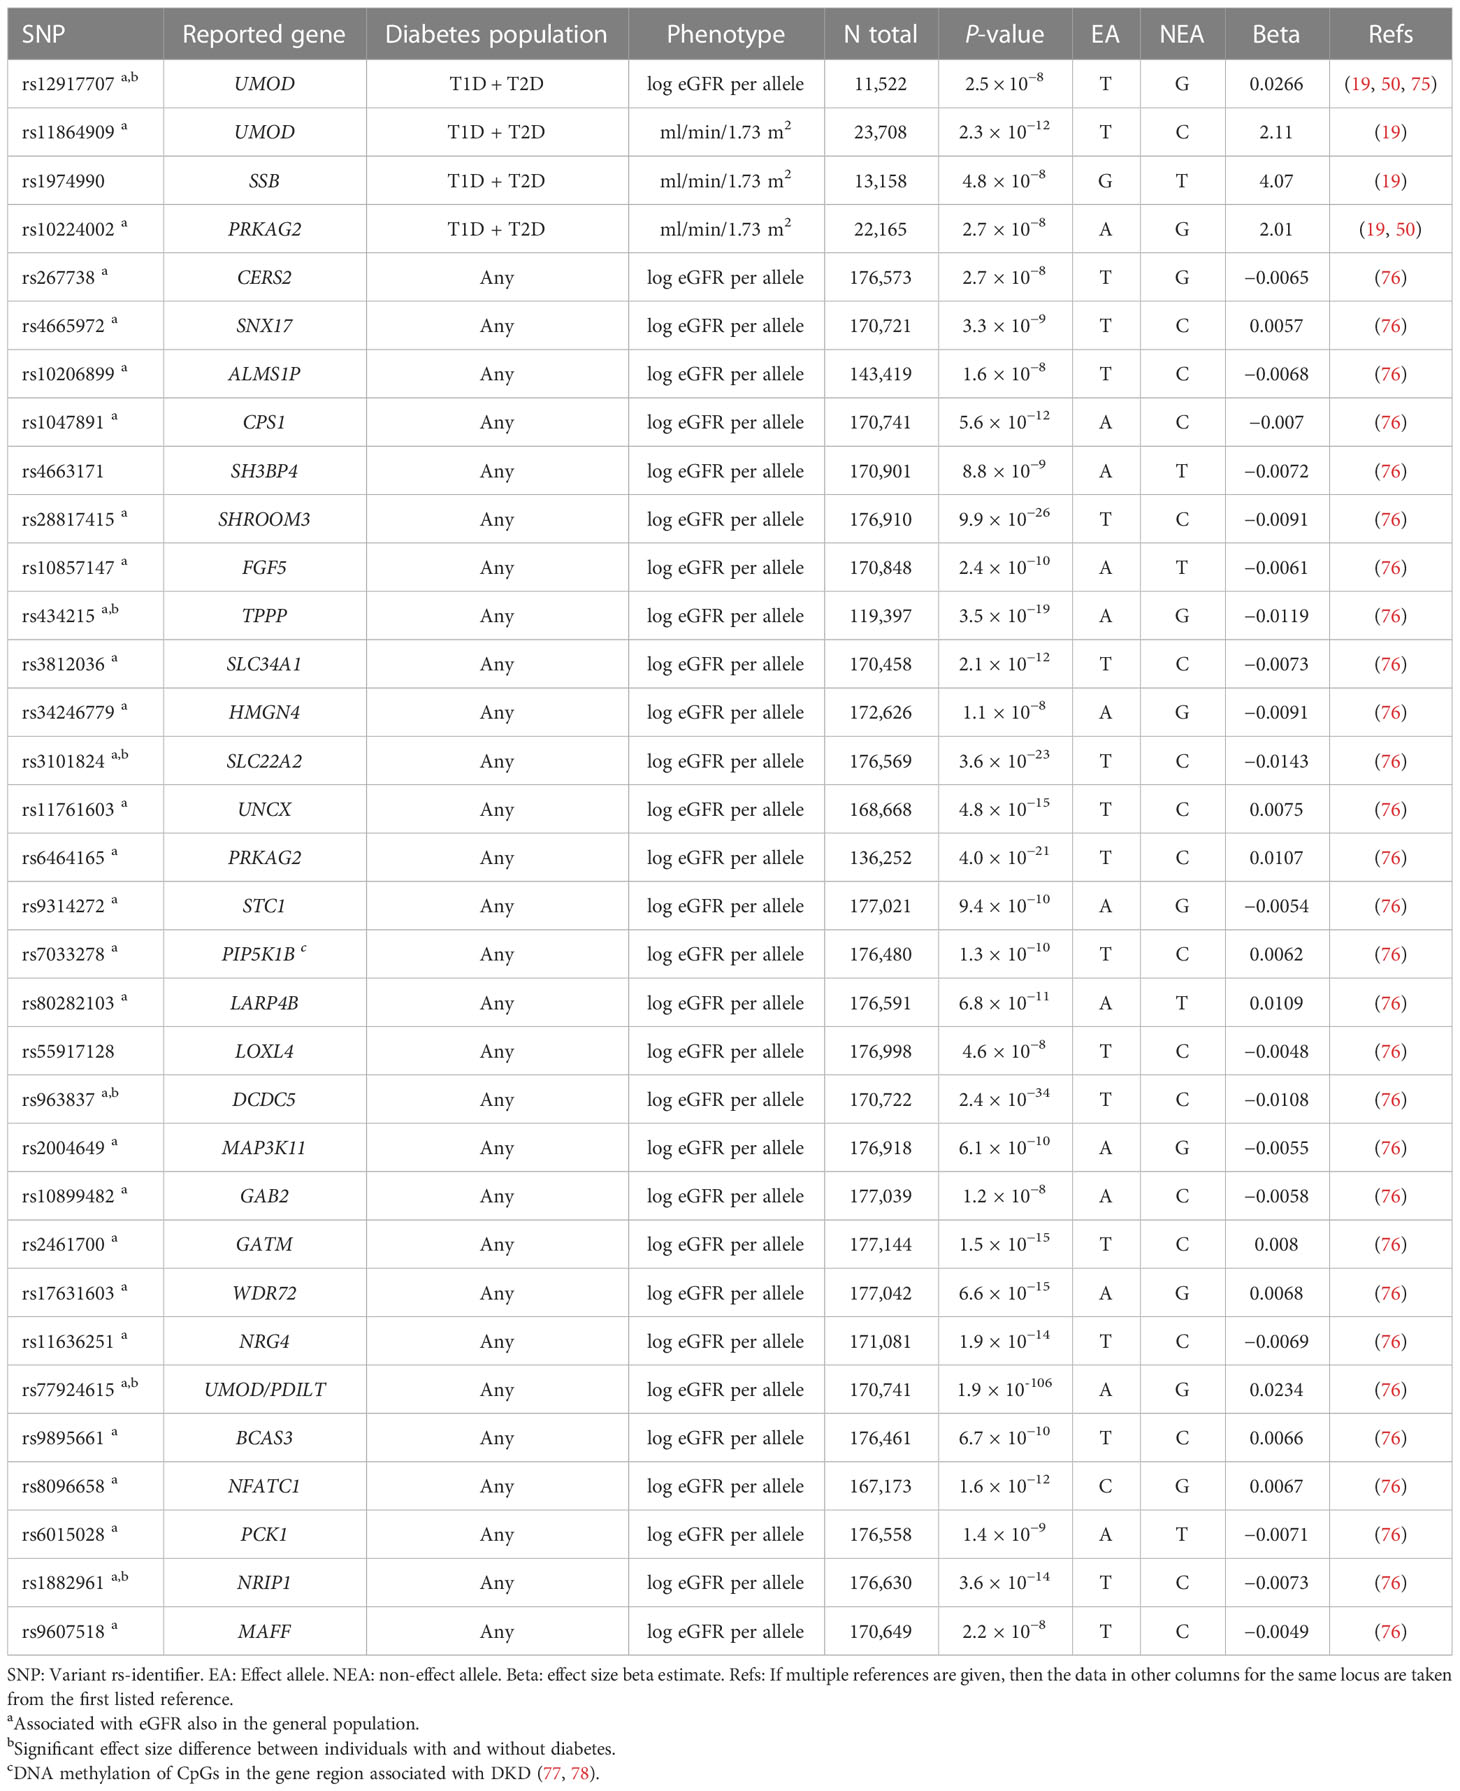
Table 2 Variants associated with eGFR in diabetes.
3.2.3 Genome-wide association studies on DKD in combined diabetes populations
Meta-analysis of the DNCRI [T1D (49)] and SUMMIT consortia [both T1D (18) and T2D (19)], excluding the overlap between the consortia, and harmonized for the 10 phenotype definitions of DKD for available cohorts, included nearly 27,000 individuals with diabetes (52). The meta-analysis identified a novel intronic variant, rs72831309 in the TENM2 gene, to be associated with a lower risk of the combined CKD-DKD phenotype (p-value = 9.8 × 10⁻⁹). TENM2 gene expression in kidney tubules correlated positively with eGFR (p-value = 1.6 × 10⁻⁸) and negatively with tubulointerstitial fibrosis (p-value = 2.0 × 10⁻⁹). In addition, the gene-level analysis identified 10 genes significantly associated with DKD (COL20A1, DCLK1, EIF4E, PTPRN–RESP18, GPR158, INIP–SNX30, LSM14A, and MFF; p-value <2.7 × 10⁻⁶). Transcriptome-wide association study integrating GWAS with human glomerular and tubular gene expression data demonstrated a higher tubular AKIRIN2 gene expression associated with DKD (p-value = 1.1 × 10⁻⁶). Expression of multiple lead genes correlated with renal phenotypes, e.g., tubular DCLK1 expression correlated with fibrosis (p-value = 7.4 × 10⁻¹⁶) and SNX30 expression with eGFR (p-value = 5.8 × 10⁻¹⁴), and negatively with fibrosis (p-value < 2.0 × 10⁻¹⁶) (52).
In addition to the disease-specific cohorts, large population-based biobanks allow analyses of an increasing number of samples and phenotypes. A GWAS on DKD in the UK Biobank included 13,123 unrelated individuals with diabetes and of European origin. Of note, the heritability estimate for DKD, defined based on ICD-10 codes (E11.2, T2D with kidney complications, or any CKD code assigned after diabetes) or a measurement of albuminuria or eGFR, was only 0.027 with a standard deviation (SD) of 0.03; heritability estimate for eGFR in T2D was higher, 0.1 with an SD of 0.01. GWAS on DKD and eGFR identified variants in the UMOD and PRKAG2 loci (50). Meta-analysis with the SUMMIT T2D study further identified a novel variant, rs72763500, associated with the combined DKD definition. The variant is associated with alternative gene splicing of the NID1 gene (50), encoding for nidogen-1, a sulfated glycoprotein involved in the development of GBM, where it binds to laminin and type IV collagen (79). Another study in the UK Biobank, although focused on heritability estimates for diabetic micro- and macrovascular complications, additionally found a variant rs73038008 near PLD1 associated with DKD (self-reported or medical records); as well as variants in WSCD2 and SETDB2 associated with ESKD and in LOC105372639 associated with microalbuminuria (20).
3.2.4 Genome-wide association studies on albuminuria and eGFR in diabetes
In addition to the dichotomous case-control definitions of DKD, GWASs have also explored albuminuria and eGFR as continuous traits in individuals with diabetes (Figure 1). Only few studies have identified variants with genome-wide significance for albuminuria (Table 3) or eGFR (Table 2), and most of these loci were identified in diabetes-specific sub-analyses of larger general population studies.
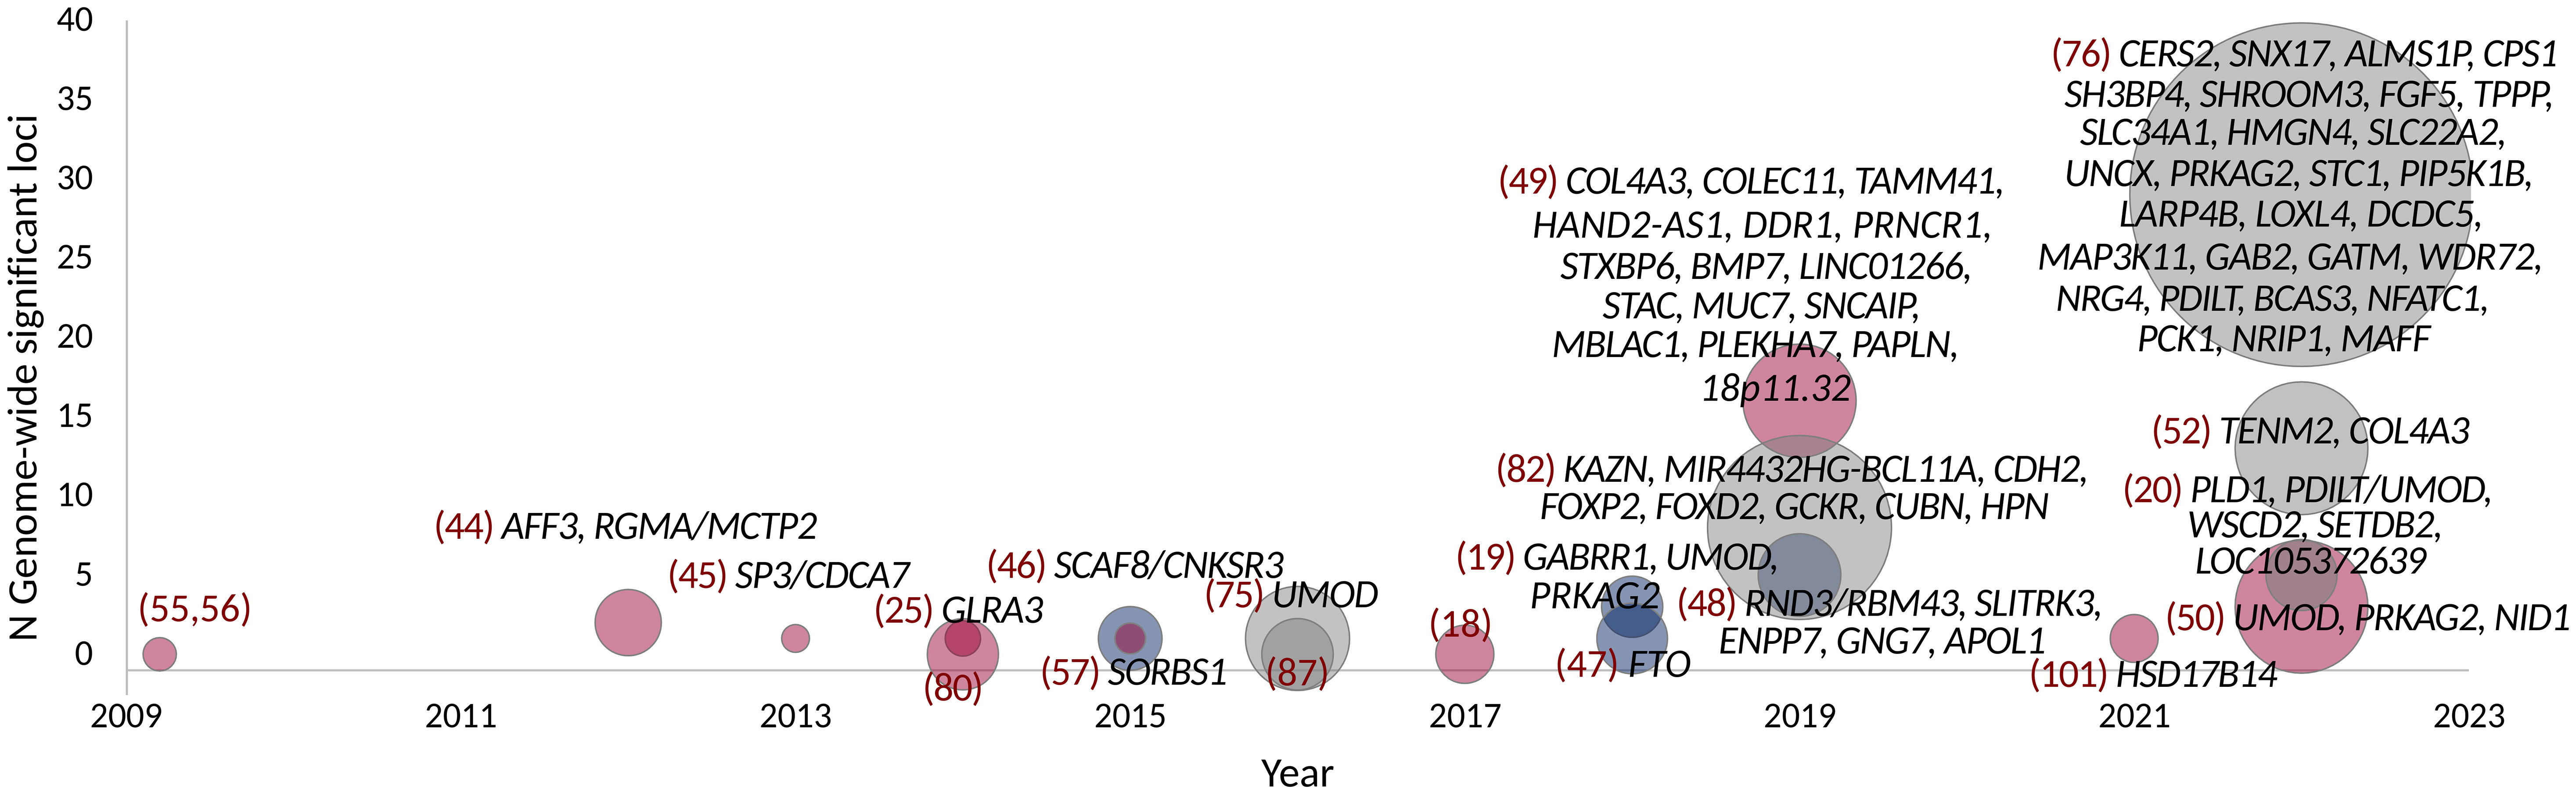
Figure 1 GWAS on DKD, albuminuria, and eGFR in diabetes. Point size indicates the number of samples. Studies with individuals with T1D are colored red, T2D with blue, and combined T1D + T2D, any type of diabetes or unspecified type of diabetes with gray. Gene names indicate loci reaching genome-wide significance (p-value < 5 × 10⁻⁸).
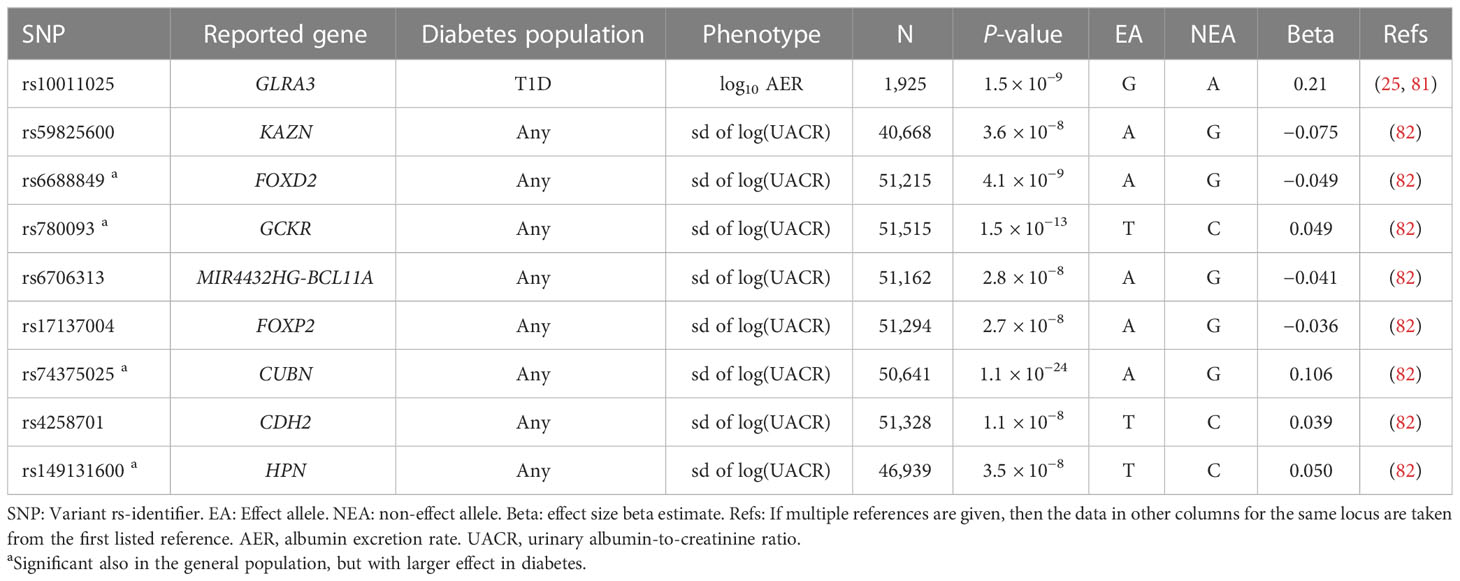
Table 3 Variants associated with albuminuria in diabetes.
A GWAS including 1,925 Finnish individuals with T1D identified rs10011025 in the GLRA3 associated with albuminuria (p-value = 1.5 × 10⁻⁹) (25). The association did not replicate in 3,771 other European individuals with T1D (p-value = 0.04, opposite direction) (25); however, the association was subsequently replicated in 1,259 additional Finnish individuals with T1D (81). The association was pronounced in individuals with HbA1c > 7%. The GLRA3 gene encodes the α3 subunit of glycine receptors. In pancreatic α-cells, glycine receptors stimulate glucagon release in response to glycine, thus counterbalancing the effects of insulin (83). Interestingly, the association with albuminuria was only evident among individuals with a 24-h urine collection. Because exercise can acutely increase albuminuria due to excess hemodynamic pressure (84), the authors hypothesized that the variant might affect renal sensitivity to hemodynamic pressure (81). Of note, in the eQTLGen database, the rs10011025 variant is associated with the expression of the HPGD gene, encoding for the 15-hydroxyprostaglandin dehydrogenase that catalyzes the prostaglandin catabolic pathway; prostaglandins are locally acting vasodilators and regulate renal hemodynamics in the kidneys (85).
Another GWAS on albuminuria included 54,450 individuals from the general population, confirming the previously identified CUBN locus (86) for albuminuria. In the sub-analysis of 5,825 individuals with diabetes, variants in the HS6ST1 (rs13427836, p-value = 6.3 × 10⁻⁷) and RAB38/CTSC loci (rs649529, p-value = 5.8 × 10⁻⁷) were suggestively associated with albuminuria in subjects with, but not without diabetes (87). RAB38 expression was found higher in the tubules of individuals with DKD compared to healthy controls, and Rab38 knockout resulted in higher urinary albumin concentrations in diabetic rat models (87). A larger study including 564,257 individuals, of which 51,541 individuals with diabetes, identified eight loci associated with albuminuria in diabetes; all had larger effect among individuals with diabetes, and four (KAZN, MIR4432HG-BCL11A, FOXP2, and CDH2) were only found in the secondary analysis limited to diabetes (82).
Finally, a GWAS including 178,691 individuals with diabetes from the CKD Genetics (CKDGen) consortium and large biobank studies identified 29 genome-wide significant loci for eGFR, including 27 novel loci for eGFR in diabetes; among these, variants near SH3BP4 and LOXL4 were not associated with eGFR in the 1,296,113 individuals without diabetes (76).
3.3 Overlap between genetic factors for DKD and general population kidney traits
In the general population, nearly 900 genetic loci have been identified for eGFR in meta-analyses, including over 1.5 million individuals (88). Diabetes is one of the key risk factors for CKD, and 31% of the CKD-associated disability-adjusted life years can be attributed to diabetes (89). Other main risk factors for CKD include hypertension, obesity, and high age, all commonly seen among individuals with T2D in particular. In individuals with T1D, the majority of DKD is due to diabetic nephropathy. On the contrary, the renal lesions in kidney biopsies of DKD in T2D are heterogeneous, and a substantial proportion of the biopsies do not show the typical characteristics of diabetic nephropathy (90). However, kidney biopsies are rarely taken, and DKD is defined as any CKD in an individual with diabetes (91). Therefore, the question arises, how much of the genetic background of DKD is shared with the CKD and eGFR in the general population?
The DKD loci identified in individuals with T1D in the DNCRI consortium did not replicate in the general population GWAS for eGFR (49); conversely, the loci associated with eGFR in the general population (92) were not associated with DKD in T1D apart from the UMOD locus (49). On the contrary, some of the first findings for DKD in T2D included the UMOD and PRKAG2 loci known from the general population (19), as well as the APOL1 variant responsible for the majority of kidney failures in AAs (48). The CKDGen GWAS on eGFR including 133,413 individuals, of which 16,477 with diabetes, found that the effect size of the eGFR loci identified in the full population were highly correlated between individuals with and without diabetes (correlation coefficient of 0.80) (75). A more recent study on eGFR from the CKDGen consortium, including nearly 1.5 million participants of which 178,691 with T2D, systematically sought for differences in effect size between individuals with and without diabetes. They identified seven eGFR loci with significant difference in individuals with and without diabetes, as well as four loci with suggestive difference; in all but one, the effect was more pronounced or exclusively seen among individuals with diabetes (76). Similarly, in a GWAS for eGFR decline studied as a longitudinal trait in the general population, the effect sizes of the nine identified variants were on average two-fold higher in individuals with diabetes (93). Finally, the effect of the rs10795433 variant in the CUBN locus—the major locus for albuminuria—was larger among individuals with diabetes compared to those without diabetes (87). In addition, a rare CUBN variant rs141640975 had three times stronger effect in individuals with T2D compared with those without (94). Furthermore, rs141640975 was associated with higher eGFR but only in the non-diabetes population, suggesting pleiotropic effects on both kidney function measures (95).
In the DNCRI-SUMMIT GWAS meta-analysis for DKD, the similarity of DKD with kidney traits in the general population (of note, including individuals with diabetes) was assessed on a genome-wide scale instead of single-variant level, using the LD score regression approach. The albuminuria-based DKD definition, including microalbuminuria, was genetically correlated with microalbuminuria in the general population, both in the pooled analysis, and separately for individuals with T1D or T2D; of note, the correlation was over two-fold stronger in individuals with T2D. In addition, the eGFR-based CKD definition was also correlated with eGFR and CKD in individuals with T2D, but not in T1D despite more than three times more individuals with T1D (52). The analysis suggests that DKD in T2D has a larger proportion of shared genetic background with the general population, e.g., due to other co-existing risk factors such as aging, overweight, hypertension, and other glomerular diseases, while less overlap is observed between the general population kidney traits and DKD in T1D representing a purer form of diabetic nephropathy. The LD score regression with cardiometabolic and other traits further suggested that a proportion of the genetic background of DKD is shared with genetic risk factors, e.g., for aging (mother’s age at death), obesity, and smoking (52). However, the confidence intervals remain large, and further studies are needed to estimate the proportion of risk attributable to each risk factor.
Some interesting discrepancies also exist between DKD and the general population: For example, the missense variant rs55703767 in COL4A3 is one of the strongest findings for DKD in T1D, but the effect is modified by glycemia, and the variant does not seem to affect kidney traits in the general population. On the contrary, variants in the flanking COL4A4 (collagen type IV alpha 4 chain) gene were associated with albuminuria in the general population (rs57858280, p-value = 9 × 10⁻¹¹) (82); according to the GTEx portal, the variant may affect the COL4A4 splicing (https://gtexportal.org/ ). Rare mutations in both COL4A3 and COL4A4 cause Alport syndrome, a monogenic disease of basement membranes that frequently leads to ESKD, as well as thin basement membrane nephropathy and focal segmental glomerulosclerosis (96).
3.4 Overlap between genetic factors for DKD and diabetes
Some studies have suggested a correlation between the genetic risk factors predisposing to insulin resistance or T2D and DKD (18, 19, 52). Of note, these studies found no correlation between genetic risk factors predisposing to T1D and DKD. T2D was modestly causally associated with DKD in a Mendelian randomization study of individuals with either T1D or T2D (p-value = 0.02), but only obesity related traits remained significantly associated with DKD when using methods accounting for pleiotropic effects (52). However, among the lead variants for DKD, albuminuria, or eGFR in diabetes, only the albuminuria-associated FTO locus [rs56094641 (47)] has been associated with T2D. In addition, the albuminuria-associated rs780093 (82) in the highly polygenic GCKR locus, as well as the eGFR-associated rs4665972 (in SNX17, but in LD with variants mapped to GCKR), rs11864909 (UMOD), rs10206899 (ALMS1P), rs10899482 (GAB2), and rs9607518 (MAFF), are in LD with variants associated with T2D (https://ldlink.nci.nih.gov/?tab=ldtrait ; search for any “diabetes” in GWAS Catalog for variants in LD (R2 ≥ 0.8 in European population), 21 March 2023), providing some evidence of genetic overlap between T2D and eGFR in diabetes.
4 From common to rare genetic variants for DKD
While common variants have a large effect on complex traits at the population level (43), the low frequency and rare variants can have a high impact on the individual level (97). In particular, protein-altering variants (PAVs), i.e., exon variants that change the protein amino acid sequence, can directly impact protein function. For example, 71% of severe LDLR mutation carriers had hypercholesterolemia in the UK Biobank WES data (98). To identify chromosomal regions harboring rare variants for DKD, a linkage study based on GWAS data of 6,019 FinnDiane study participants included 177 small pedigrees such as sib-ships, parent-offspring pairs, and more distant relations, with, altogether, 452 individuals, all with T1D. Eight chromosomal regions reached a significant LOD score > 3.3 (51). Many of these regions harbor genes in which mutations cause rare syndromes with kidney complications, such as ARHGAP24 associated with focal segmental glomerulosclerosis (99) and FRAS1 associated with the familial Fraser syndrome (100). Overlap with loci causing rare kidney syndromes supports the role of rare variants in the development of DKD. Interestingly, one suggestive linkage peak was observed in the NID1 locus, recently associated with DKD in T2D (50). While a rare rs538044833 variant in the CCSER1 locus was externally replicated (p-value = 2.8 × 10⁻⁸), the resolution remains low even in the GWAS-based linkage studies, hindering further fine-mapping and interpretation of the results.
In addition, on the basis of GWAS data, enriched for rare PAVs with the ExomeChip array, a gene aggregate meta-analysis including 4,196 individuals with T1D found PAVs in the hydroxysteroid 17-β dehydrogenase 14 (HSD17B14) gene exome-wide significantly (p-value < 5 × 10⁻⁷) associated with the disease progression from DKD to kidney failure. The gene and protein expression were attenuated in human diabetic proximal tubules and in mouse kidney injury models (101).
The GWAS genotyping chips cover only a portion of the PAVs, and genotype imputation quality largely depends on the variant minor allele count in the reference sample and can be limited for rare variants (102, 103). A whole-exome sequencing (WES) on DKD, including 997 individuals with T1D, did not find any variants or genes reaching robust exome-wide significance (18) but found suggestive evidence of association, e.g., for PAVs in the THADA gene, previously associated with T2D (104). A WES of 593 DKD cases and 2,066 healthy controls of European and African ancestry, with subsequent discriminatory analyses and replication in up to 11,487 multi-ancestry participants from the Trans-Omics for Precision Medicine study, identified an in-frame insertion rs141560952 in the DIS3L2 gene (p-value = 3.6 × 10⁻⁹), and a KRT6B splice-site variant rs425827 associated with DKD (p-value = 2.7 × 10⁻⁹). Both variants were associated with DKD also when compared with diabetes controls without DKD, but with lower statistical significance (p-value = 1.4 × 10⁻⁴ and 2.8 × 10⁻⁴). Furthermore, gene aggregate analyses identified ERAP2 (p-value = 4.03 × 10⁻⁸) and NPEPPS (p-value = 1.51 × 10⁻⁷); both are expressed in the kidney and implicated in the renin-angiotensin-aldosterone system–modulated immune response (53). However, the discriminatory analyses suggest that the ERAP2 and NPEPPS may be primarily associated with diabetes per se, subsequently leading to DKD (53).
While WES mainly covers the protein-coding sequence, a whole-genome sequencing (WGS) study of 76 Finnish sibling pairs with T1D but discordant for DKD found significant enrichment of variants in DKD in gene promoter and enhancer regions, as well as for specific transcription factor binding sites (105), but larger studies are required to pinpoint the most relevant regulatory regions. Gene aggregate analysis of PAVs suggested protein kinase C isoforms (PRKCE and PRKCI) and protein tyrosine kinase 2 (PTK2) involved in DKD (105); of note, a recent GWAS on albuminuria in the general population highlighted variants in the PRKCI and demonstrated that a podocyte-specific deletion of aPKClambda/iota in mice results in severe proteinuria (82). A recent multi-ethnic WGS in 23,732 individuals identified three novel rare intronic variants for eGFR in the general population (106), and larger WGS for DKD are needed to identify the rare variants contributing to DKD.
5 Epigenetic factors for DKD
Studies focusing on epigenetic modifications have emerged in an increasing number during the last years. Epigenetic modifications can be described as chemical modifications of the DNA (or RNA) that can induce changes in gene expression without changing the underlying sequence. In contrast to an individual’s genetic variation, which is constant across tissues and throughout lifetime, epigenetic modifications are dynamic and modifiable. Thus, epigenetic changes may vary between tissues, cell types, and developmental stages and can even be affected by environmental factors. Furthermore, in disease states, the methylation patterns can change either as a cause or a consequence of the disease (107). In this way, epigenetic factors provide a link between the genome and the environment and can potentially reflect an individual’s risk of developing a disease more accurately at a given time. Although epigenetic changes are dynamic, there is evidence that epigenetic modifications, such as DNA methylation, persist in blood years after acute illness or metabolic changes in the body (108, 109). Consequently, epigenetic factors have been suggested as an underlying mechanism for metabolic memory (110, 111). Metabolic memory in diabetes refers to the sustained harmful effect of hyperglycaemia on diabetic complications, initially observed in the DCCT-EDIC study, even after improved glycaemic control (112, 113). In line with this observation, subsequent work in DCCT-EDIC has identified several epigenetic changes associated with metabolic memory (110, 111). A combination of DNA methylation levels at several HbA1c-associated sites explained as much as 71 to 97% of the association between HbA1c and diabetic complications in the DCCT (114), further reinforcing the connection between epigenetic changes and metabolic memory.
DNA methylation is the most frequently studied epigenetic modification and occurs at cytosine bases of cytosine–phosphate–guanine dinucleotide sites (CpGs) in the DNA sequence. In addition to DNA methylation, additional epigenetic modifications exist, such as histone modifications (acetylation and methylation), and their role in DKD has also been explored. For example, dysregulation of histone H3 lysine 27 trimethylation (H3K27me3) in TGF-β1–induced gene expression has been associated with DKD (115). Histone modifications associated with DKD are reviewed, e.g., in (116), and are out of the scope of this review, where we focus on DNA methylation changes.
5.1 Various study settings for DNA methylation
Although whole-genome bisulfite sequencing for the analysis of the methylome has been done for DKD, sample sizes have been small (117). Studies assessing DNA methylation patterns across the genome, known as epigenome-wide association studies (EWASs) or methylome-wide association studies (MWASs), have primarily relied on Illumina’s BeadChip platforms, which have evolved from the Illumina 27K array with only ~27,000 sites to the Illumina 450K with ~450,000 and the EPIC array containing methylation levels at ~850,000 sites. However, this number of CpGs only accounts for a small amount of all the CpGs in the genome, totalling up to ~30 million (118). The EWASs have applied various significance thresholds, but a p-value below 9 × 10⁻⁸ has been suggested as a threshold for robust significance, adequately controlling for the false positive rate for the EPIC array (94). The genome-wide significance threshold recommended for Illumina’s 450K BeadChip is p-value < 2.4 × 10⁻⁷ or p-value < 3.6 × 10⁻⁸ (119), although the false discovery rate (FDR) has been widely used (Table 4). Contrary to the GWAS, which initially yielded few significant loci with increasing number of findings with larger studies, in EWAS, the use of varying thresholds, combined with unaddressed inflated test statistics especially in the early EWAS (131), has led to a quite varying number of identified methylation loci in the studies performed so far.
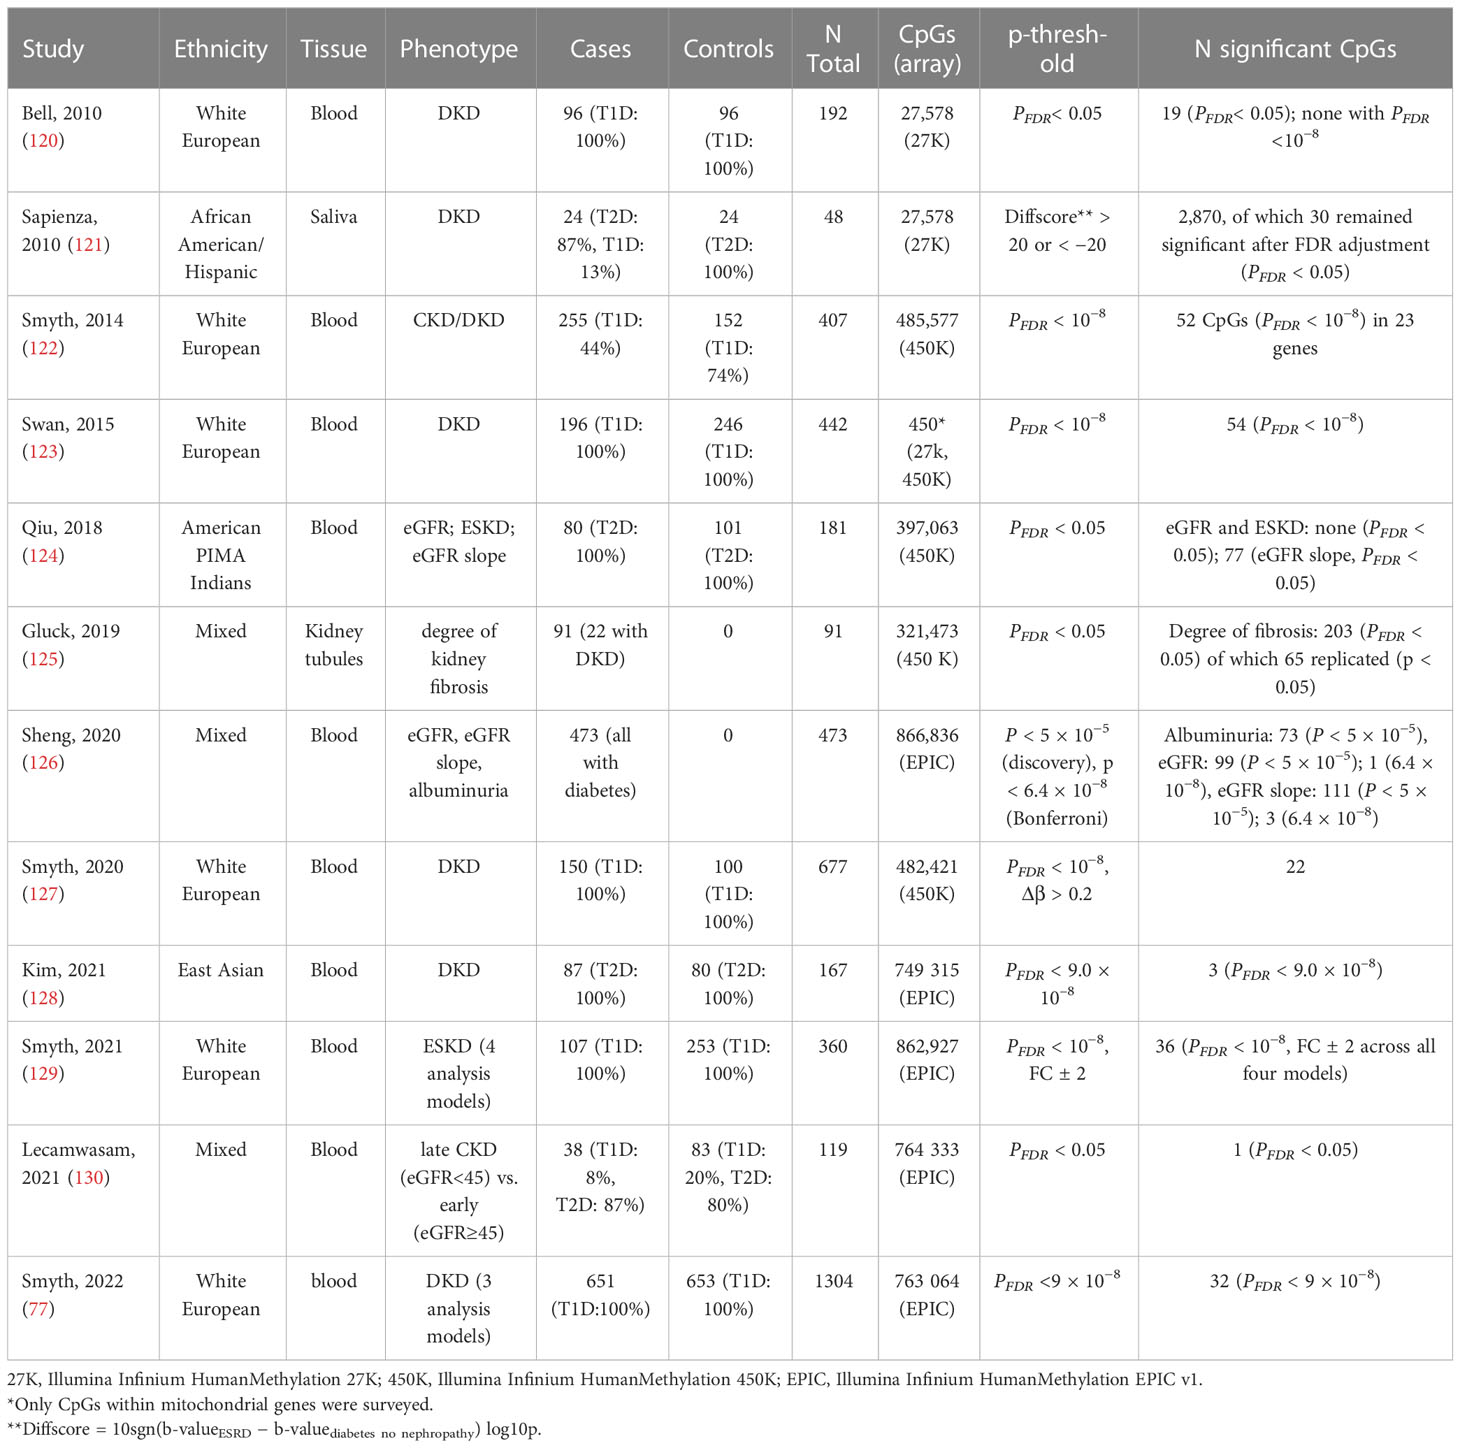
Table 4 EWASs on kidney disease and related traits in individuals with diabetes.
Most EWASs performed on DKD have examined DNA methylation in blood. Still, other tissues have been used, such as kidney samples micro-dissected into kidney tubules (125) and even saliva (121). The epigenetic changes observed in the kidney tissue likely reflect the local changes more accurately. Indeed, EWAS on fibrosis in kidney tissue samples identified 65 differentially methylated CpGs that were enriched on kidney regulatory regions (125). Another promising target tissue for studying kidney disease would be the urine, which can be collected non-invasively and easily from larger datasets. Urine, however, contains few nucleated cells and extracting a sufficient amount of DNA from urine has turned out to be a challenge (132).
5.2 Over 150 CpGs associated with DKD and related traits
To date, methylation levels at over 150 CpG sites across the genome have been associated with DKD, eGFR, or albuminuria (p-value < 9 × 10⁻⁸), in studies including both T1D and T2D (Figure 2; Table 4; Supplementary Table 1), with the majority assessing DNA methylation in blood. The first DKD-EWAS identified DNA methylation levels at 19 CpGs associated with DKD in T1D (FDR < 0.05) using Illumina’s 27K array (120), highlighting one CpG located upstream of the UNC13B gene. An intronic SNP (rs2281999) in the same UNC13B gene was identified for DKD in T1D in a prior genetic association study including genetic variants in 127 candidate genes (133). More recent methylation arrays, with higher coverage have enabled identification of additional CpGs. Using the 450K array, Smyth et al. identified 53 CpGs within 23 genes with differential methylation in participants with CKD, of which approximately half had T1D. Of the 23 genes, six were in genes that are biological candidates for kidney disease: CUX1, ELMO1, FKBP5, INHBA-AS1, PTPRN2, and PRKAG2 (122). Of these, genetic variants within the PRKAG2, encoding a protein kinase involved in cellular energy metabolism, have also been associated with eGFR in GWAS on kidney disease, both in individuals with and without diabetes (19, 73, 74). Following this study, several EWAS have been performed (Table 4), focusing mainly on DKD (77, 123, 127) and ESKD (129) in T1D but also on DKD in T2D (128) or eGFR in individuals with diabetes of unspecified/mixed type (124, 126, 130), yielding a plethora of sites that are differentially methylated, shown in Figure 2 (CpGs with p-value < 9 × 10⁻⁸). The most recent and largest study, including 1,304 individuals with T1D, identified 32 sites with altered methylation in DKD (77), of which 23 were specific to the EPIC array. Methylation levels at seven CpGs were epigenome-wide significantly and differentially methylated after accounting for differences in multiple clinical risk factors (HbA1c, HDL cholesterol, triglycerides, BMI, smoking, and duration of diabetes), in addition to age, sex, and six cell-type proportions. These seven included two intergenic CpGs on chromosome 19 and four CpGs located within genes PTBP3, NME7, SLC1A5, and SLC27A3 and one CpG within a long non-coding RNA (LINC01800).
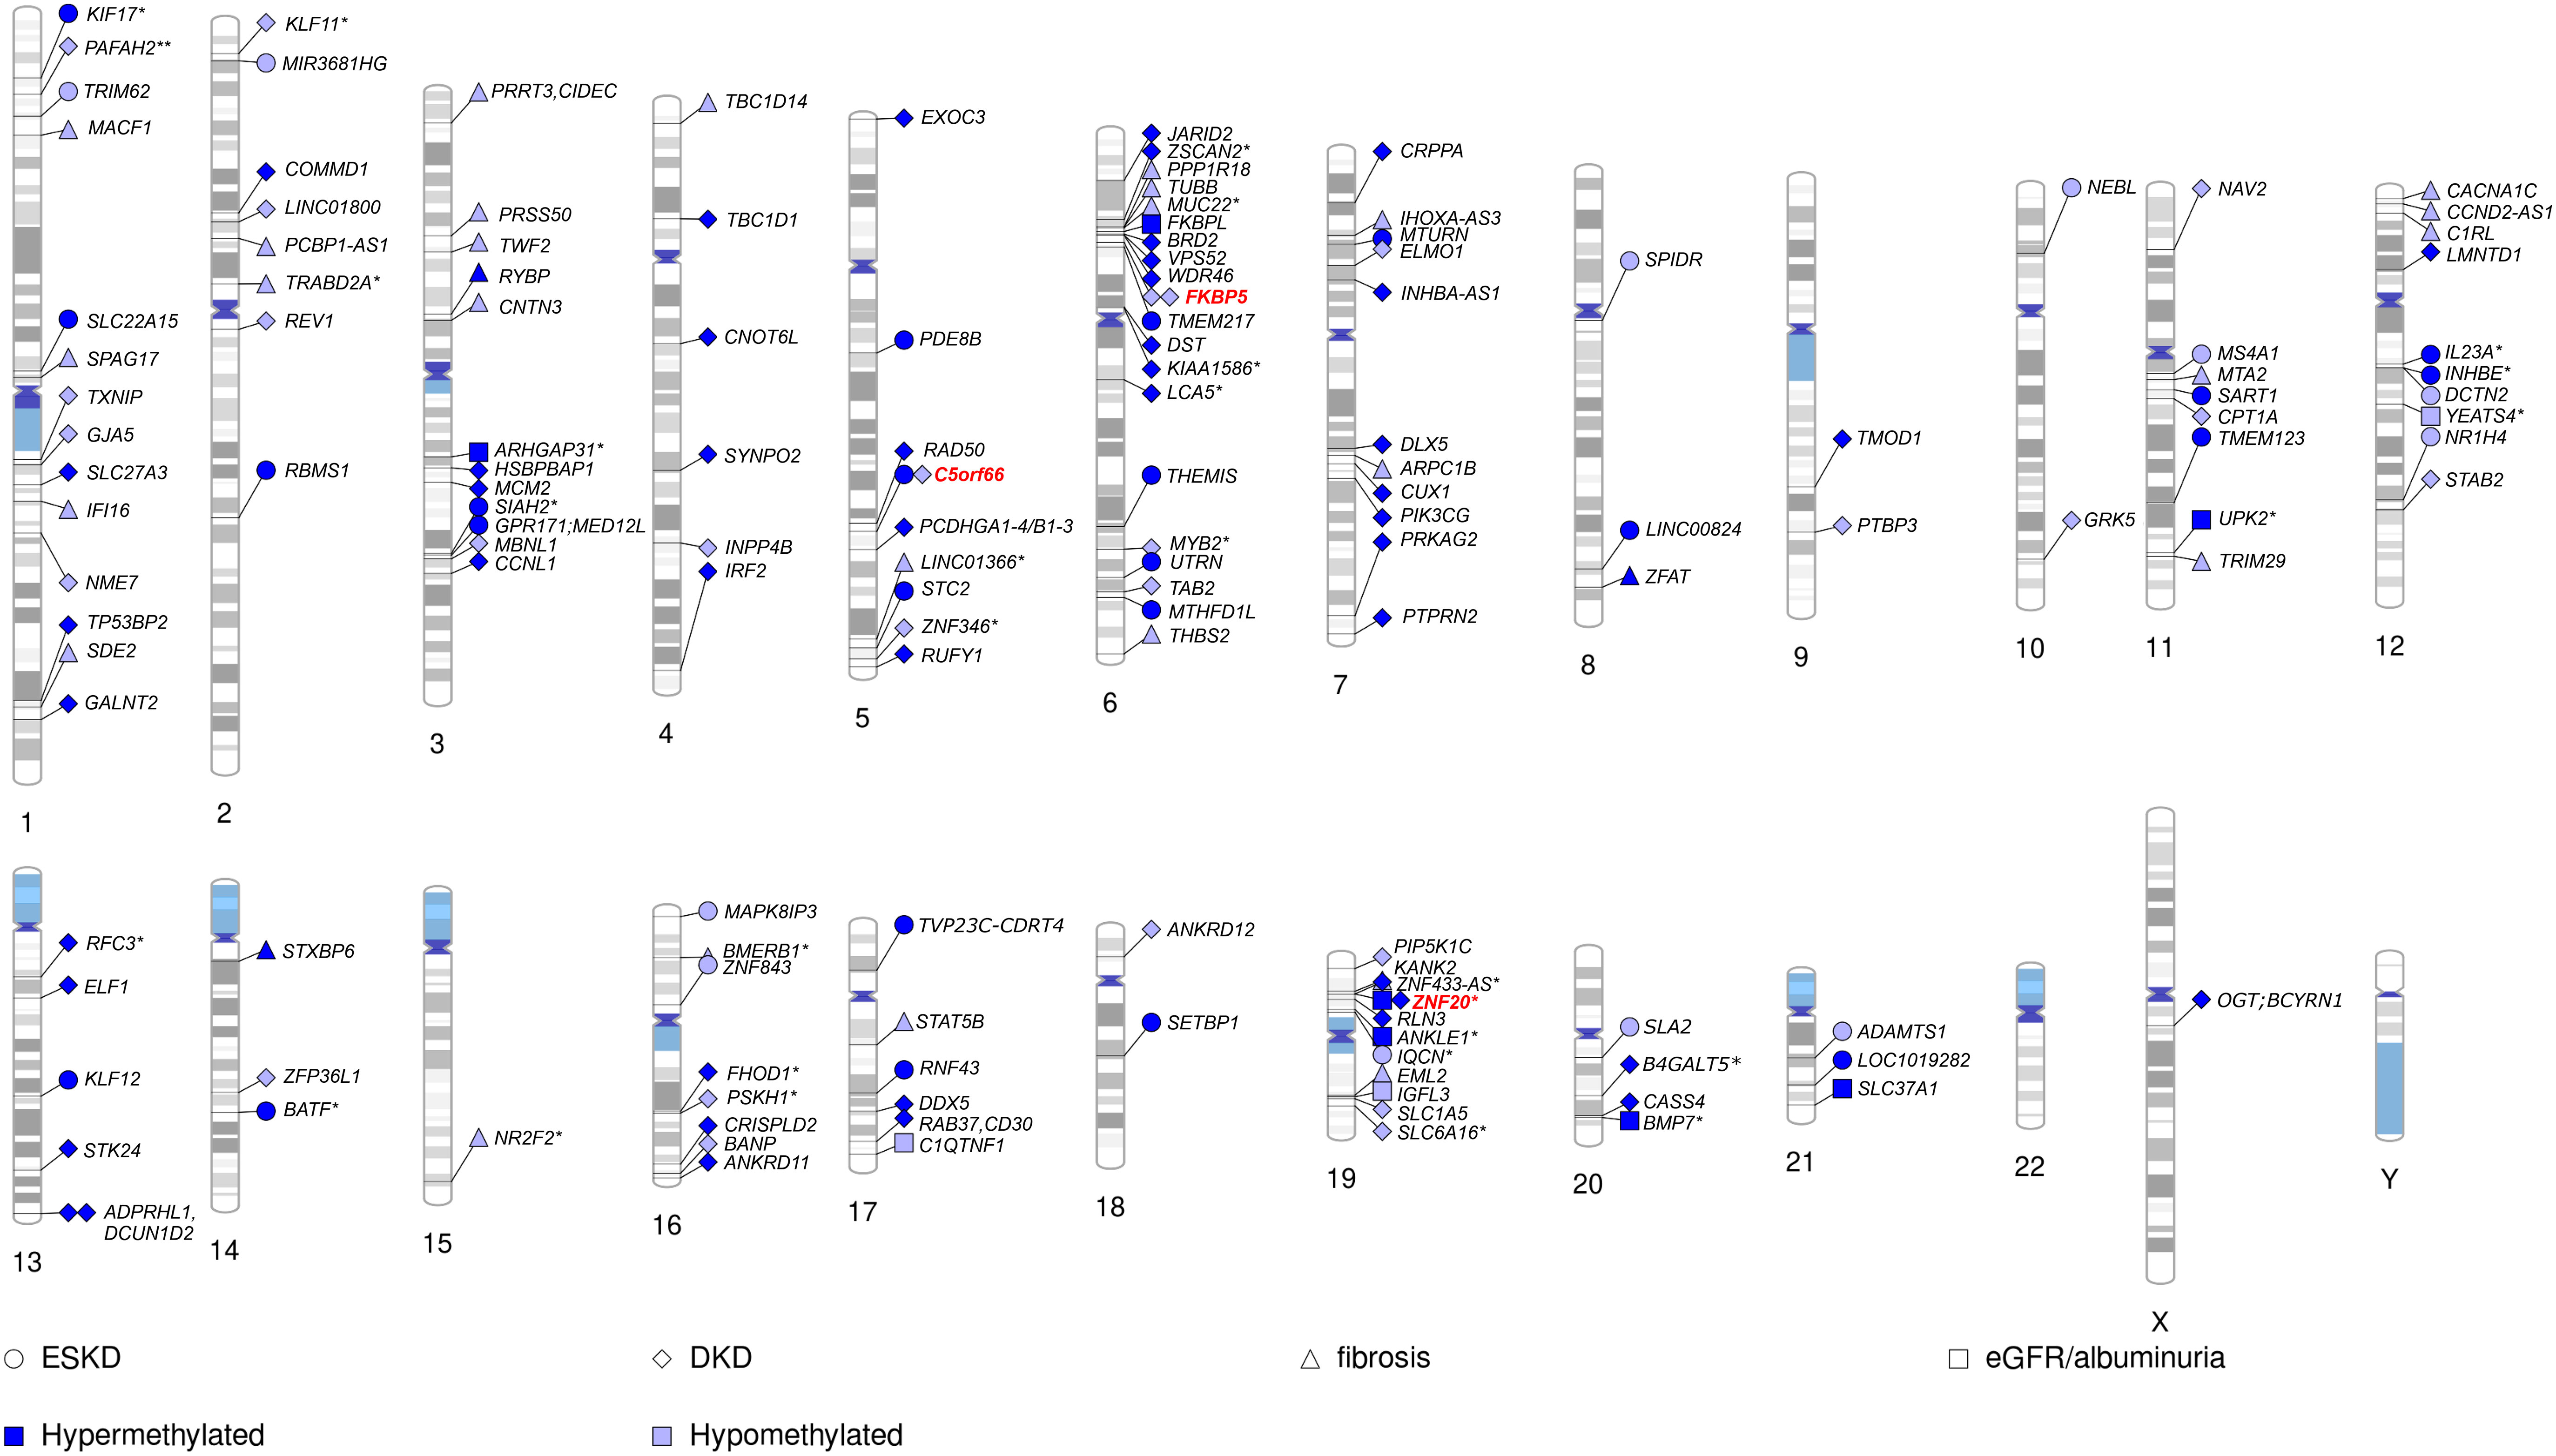
Figure 2 Chromosomal ideogram including CpGs methylation associated with kidney disease (DKD and ESKD), fibrosis, eGFR, or albuminuria in diabetes. For intergenic CpGs (*), the nearest gene is given. Hypermethylated CpGs (in kidney disease vs. controls) are denoted by a dark blue colour and hypomethylated by a light blue colour. CpGs appearing among top loci in multiple studies on kidney disease in diabetes denoted by a red color.
Methylation levels at only a few CpGs have been associated with DKD in multiple studies (Figure 2). This can partly be explained by the higher coverage of Illumina’s EPIC array, with many CpGs on that array not present on previous arrays and, therefore, not testable. Consequently, one-third of the differentially methylated CpGs identified for DKD or eGFR in studies using the EPIC array (77, 126, 129) were novel and not available on previous arrays (Supplementary Table 1). However, methylation loci that have been repeatedly associated with DKD, include CpG within genes C5orf66, FKBP5 (77, 122), and PIP5K1C (77, 129). In addition, higher methylation at the intergenic CpG cg17944885, located on chromosome 19 within a zinc finger gene cluster, has been repeatedly associated not only with DKD and eGFR in diabetes (77, 126, 130) but also with CKD and eGFR in the general population (78, 134, 135), as well as eGFR in other more specific cohorts, such as men with human immunodeficiency virus (HIV) (136). Moreover, CpGs within the IRF2 (cg05165263) and SLC27A3 (cg21961721) gene, both with higher methylation levels in DKD in T1D (77), have also been associated with eGFR (p-value = 5 × 10⁻⁵ and 8 × 10⁻⁵) in the general population (135), although not among the reported top loci.
Although most of the DNA methylation association studies performed on DKD have covered the whole genome, targeted approaches have been undertaken as well. Swan et al. evaluated DNA methylation levels associated with DKD for CpGs located within genes influencing mitochondrial function in 442 individuals with long term T1D (123). Although methylation levels at several CpG sites reached the threshold for epigenome-wide significance (p-value < 9 × 10⁻⁸), none of the differentially methylated CpG sites has emerged in subsequent EWASs.
A few CpGs identified as differentially methylated in DKD to date (Figure 2) also appear in EWAS on traits that are considered risk factors for DKD. Lower methylation of cg19693031 located in the 3′-untranslated region of the TXNIP gene has been recurrently observed in the context of diabetes and glycemia, such as persistently higher HbA1c both in T2D and T1D (109, 126, 137). TXNIP encodes for the thioredoxin-interacting protein, which by binding to thioredoxin induces oxidative stress and apoptosis. Although it is mainly considered a glycemia-related methylation locus, it not only shows repeated associations with albuminuria and DKD (77, 109), explaining alone up to 45% of the HbA1c association with DKD (114), but also associates with DKD and triglycerides independently of HbA1c (109). Intriguingly, methylation levels at cg19693031 are also under genetic influence by SNPs located within the SLC2A1 gene encoding for the glucose transporter 1 (GLUT1) (109). A recent EWAS on DKD performed a systematic trait enrichment analysis and found significant overlap with EWAS findings for traits and diseases such as aging, smoking, systolic and diastolic blood pressure, eGFR, and HbA1c (77). Our lookup of the significant CpGs identified for DKD, eGFR, fibrosis, and albuminuria to date (Figure 2; 160 CpGs as listed in Supplementary Table 1) in the EWAS catalogue (associations with p-value < 9 × 10⁻⁸; http://www.ewascatalog.org , accessed 31 January, 2023) found an overlap with DKD risk factors including dyslipidemia (CpGs within SLC1A5, TXNIP, and CPT1A), HbA1c (TXNIP), blood pressure (CpGs within SLC1A5, TXNIP, CPT1A, and PTBP3) and obesity (CpGs within SLC1A5, TXNIP, CPT1A, and FKBP5; Supplementary Table 2). For example, in the CPT1A gene, methylation at cg17058475 was associated with DKD in T1D (77) and has been robustly associated with the triglycerides (118) in the general population. CPT1A encodes a key enzyme in the fatty acid metabolism, namely, the hepatic isoform of carnitine palmitoyl transferase 1 (138), controlling the fatty acid flux in the liver. In addition, the genetic variants in the gene were also associated with triglycerides and HDL cholesterol in a recent GWAS (139).
5.3 DNA methylation for prediction of DKD
Several studies have provided evidence suggesting that changes in DNA methylation patterns could be used to predict DKD or its progression. Using 91 kidney tissue samples, Gluck et al. found that information from 471 differentially methylated CpGs in the kidneys helped them to predict kidney disease progression (125). However, the utility of kidney tissue–specific DNA methylation patterns as potential biomarkers remain limited, as individuals with DKD do not routinely undergo kidney biopsy. As an alternative, a study with methylation data from 831 individuals constructed methylation risk scores for 607 phenotypes based on electronic health records and suggested that blood methylation was particularly good in identifying individuals with pre-existing kidney failure and related traits (140). An EWAS in 181 American Indians with diabetes identified methylation levels at 77 CpG sites associated with eGFR decline over a 6-year period (124). Methylation at two CpGs (cg25799291 and cg22253401 in FSTL5) improved prediction of eGFR decline even when baseline eGFR and Albumin-to-creatinine ratio (ACR) were included in the model (124). In addition, in T1D, methylation levels at baseline can be used to predict progression of DKD. In total, 20 of the 32 differentially methylated CpGs in DKD in T1D predicted future progression to kidney failure in 397 individuals with DKD, 13 even after accounting for eight clinical risk factors (77). Furthermore, methylation at the two intergenic CpGs located within the zinc finger gene cluster on chromosome 19 predicted kidney failure, independent of baseline eGFR.
5.4 Epigenetic changes—the cause or the consequence?
Because of the dynamic nature of epigenetic changes, the methylation changes observed at CpGs in DKD can be either a cause or a consequence of the disease. To separate the causal methylation changes from the consequential, EWASs have also attempted Mendelian randomization, which uses genetic information to infer causality (77, 126, 128). Although these analyses have been partly hampered by the lack of genetic variants influencing CpG methylation, some causal associations have been observed. For example, Mendelian randomization suggested that higher methylation levels at cg23527387 located within the REV1 gene reduces the risk of DKD in T1D (77). On the other hand, no evidence for causality was found for cg19693031 (TXNIP) or cg17944885 (between ZNF788P and ZNF625-ZNF20), suggesting that methylation changes observed at these sites are consequential to kidney disease or its other manifestations, e.g., hyperglycemia. Kim et al. used Mendelian randomization in the opposite direction, i.e., to assess the causal effect of metabolic phenotypes on CpG methylation changes identified in their EWAS on T2D (n = 8) and DKD (n = 3). These analyses revealed that fasting glucose resulted in 2% hypomethylation of cg00574958 located in the CPT1A gene, whereas HbA1c or BMI did not causally affect the cg00574958 methylation. Genetically determined eGFR, however, was associated with 7% hypomethylation of cg19693031 within TXNIP (p-value = 0.045), as well as hypomethylation of all the CpGs identified for DKD in T2D, including three CpGs within genes: COMMD1, TMOD1, and FHOD1.
6 Discussion
During the last 5 years, both GWAS and EWAS have identified an expanding number of genetic loci for DKD. Nearly 80 genetic loci have reached genome-wide statistical significance for DKD, albuminuria, or eGFR in diabetes to date. Much of this increase is not only due to larger meta-analyses of existing diabetes cohorts but also due to CKD studies in the general population including a substantial number of individuals with diabetes, as well as general population biobank studies. Even larger meta-analyses combining multiple biobank studies are likely to result in more genetic loci contributing to DKD. One of the major challenges of such studies will be how to best ascertain cases with DKD, either based on ICD codes that do not capture DKD well, self-reported DKD, or single measurements of albuminuria or eGFR, both of which vary over time. General population biobanks may also be affected by selection bias including healthier than average individuals (141), leading to a limited number of individuals with severe DKD or ESKD or with long-lasting diabetes: As DKD takes decades to develop (6), ideal study controls would only include individuals with diabetes without DKD despite a long diabetes duration.
The number of identified genetic loci now also allows comparison of the findings and the genetic overlap between general population CKD and DKD in T1D and T2D. The general population loci for eGFR seem to affect eGFR also in individuals with diabetes, especially those with T2D (76). For some variants, the effect size is markedly higher in the individuals with diabetes than in those without (e.g., UMOD, rs77924615, betaDM = −0.019, betanoDM = −0.011, Pdiff = 1.3 × 10⁻²⁷; TPPP, rs4663171, betaDM = −0.011, betanoDM = −0.004; Pdiff = 2.5 × 10⁻⁹), potentially reflecting the elevated risk and accumulated risk factors for kidney complications among individuals with diabetes. On the other hand, genetic risk factors for DKD in T1D seem to differ from the general population (52). These support the notions from the clinical and epidemiological studies suggesting that individuals with T2D can have either DKD, non-DKD, or both, whereby individuals with T1D mainly develop diabetic nephropathy with a different pathophysiology from the general CKD (11, 90). Therefore, future genetic studies on DKD will need to balance between maximizing the number of samples (any diabetes, or even the general population with focus on diabetes) but with a more heterogeneous phenotype, and a cleaner DKD phenotype in T1D with diabetic nephropathy as a more likely underlying cause, but with a more limited number of samples.
GWASs on DKD have been performed in various populations beyond the European ancestry (46–48), and some of the identified variants are population-specific, e.g., the APOL1 variants associated with all-cause and diabetic ESKD in AAs (48, 67, 68). For many complex diseases, such as T2D, extension to further populations, as well as larger multi-ancestry GWAS meta-analyses have yielded novel genetic susceptibility loci by increasing the total sample size and capturing additional variants with ancestry-correlated heterogeneity in the allelic effect sizes (104, 142). Multi-ancestry GWASs also provide improved fine-mapping resolution of the detected association signals, i.e., can provide a smaller number of variants in the credible set including the underlying causal variant among the many associated ones (142). Therefore, such multi-ancestry studies are likely to reveal novel loci with improved fine-mapping for DKD as well. On the contrary, homogenous study populations may be particularly important in sequencing studies aiming to identify rare genetic risk factors for DKD.
Although there are known differences in the methylation pattern of a number of CpGs between different ethnicities (143), there is a lack of ethnic diversity in EWAS, which are based mainly on individuals of European ancestry (144, 145). A recent multi-ancestry EWAS on kidney function (135) revealed several population-specific methylation patterns for eGFR in the general population with little overlap between African and European populations. These discrepancies, however, could be due to both genetic and environmental differences between the different ethnic groups. The expansion of EWAS datasets in DKD to include multi-ancestry populations is still lacking.
The GWASs have also enabled creation of polygenic risk scores (PRSs) that may be used for risk stratification and identification of affected traits and phenotypes. In general population, PRS on eGFR was associated with incident CKD and kidney failure in the Atherosclerosis Risk in Communities study with 8.6% of the individuals having diabetes (146). In diabetes, smaller studies have shown that genetic risk scores for DKD improved the prediction of DKD in Han Chinese with T2D (147). In the ADjuVANt Chemotherapy in the Elderly (ADVANCE) trial with individuals with T2D, a multi-phenotype PRS, based on variants from the general population GWAS, predicted micro- and macrovascular complications and suggested that the PRS can identify high-risk individuals, who would benefit from intensified diabetes treatment (148); similarly, a general population PRS for coronary artery disease (CAD) was associated with CAD also among individuals with T1D (149). However, no large-scale PRS for DKD have yet been published, and larger GWASs on DKD are needed to create diabetes-specific PRS for DKD and to assess their utility compared to general population PRS.
To date, several CpG sites with altered methylation levels in DKD have been identified across the genome. Understanding the underlying mechanism behind these changes would be critical, i.e., are the observed changes driven by kidney disease or some other manifestation that emerges as the disease progress, and whether the changes are causal for the development or progression of DKD. In addition, methylation levels are also influenced by the genetics. Insights to the complex network behind the findings might therefore require integrating DNA methylation results with results from multiple other sources such as GWAS as well as transcriptomic and proteomic data. Some efforts in that direction have already been made. Indeed, a recent study demonstrated that DNA methylation explains a larger fraction of kidney disease heritability than gene expression by integrating GWAS data with methylomic and transcriptomic data obtained from 446 kidney tissue samples (88).
DNA methylation markers have proven useful for the prediction of DKD progression. Current studies, however, have focused on the later stages of kidney disease, when AER is severely increased or when kidney failure has occurred. EWASs at earlier stages of DKD, when AER is only moderately increased, could potentially identify additional CpGs and perhaps even more importantly, enable the prediction of early changes using DNA methylation. Although DNA methylation scores have not yet been as extensively implemented in risk prediction as the PRSs, methylation scores show a great promise as they incorporate information from both the genes and the environment. In a recent study, methylation scores improved the prediction of a range of clinical diagnoses and traits, including kidney disease, outperforming the predictive ability of polygenetic risk scores (140). However, the dynamic nature of methylation as well as its tissue-specificity introduces limitations regarding causality, time span of effect, and target tissue. By incorporating genetic information, causality can be addressed, and future studies may also be facilitated by emerging single-cell sequencing technologies that enable more targeted analyses, such as exploring the causal effects of DNA methylation at the single-cell level in the kidneys.
Author contributions
NS and ED revised the literature and wrote the manuscript. P-HG critically revised the manuscript for the scientific content. All authors agree to be accountable for the content of the work. All authors contributed to the article and approved the submitted version.
Funding
This work was supported by grants from Folkhälsan Research Foundation, Wilhelm and Else Stockmann Foundation, “Liv och Hälsa” Society, Sigrid Jusélius Foundation, Helsinki University Central Hospital Research Funds (TYH2023403), and Academy of Finland (316664).
Conflict of interest
P-HG has received investigator-initiated research grants from Eli Lilly and Roche; is an advisory board member for AbbVie, Astellas, AstraZeneca, Bayer, Boehringer Ingelheim, Cebix, Eli Lilly, Janssen, Medscape, Merck Sharp & Dohme, Mundipharma, Nestlé, Novartis, Novo Nordisk, and Sanofi; and has received lecture fees from AstraZeneca, Boehringer Ingelheim, Eli Lilly, Elo Water, Genzyme, Merck Sharp & Dohme, Medscape, Novartis, Novo Nordisk, PeerVoice, Sanofi, and Sciarc.
The remaining authors declare that the research was conducted in the absence of any commercial or financial relationships that could be construed as a potential conflict of interest.
Publisher’s note
All claims expressed in this article are solely those of the authors and do not necessarily represent those of their affiliated organizations, or those of the publisher, the editors and the reviewers. Any product that may be evaluated in this article, or claim that may be made by its manufacturer, is not guaranteed or endorsed by the publisher.
Supplementary material
The Supplementary Material for this article can be found online at: https://www.frontiersin.org/articles/10.3389/fendo.2023.1163001/full#supplementary-material
References
1. International Diabetes Federation. IDF diabetes atlas (2021). Available at: https://diabetesatlas.org/ (Accessed August 26, 2022).
2. Brownlee M. Biochemistry and molecular cell biology of diabetic complications. Nature (2001) 414:813–20. doi: 10.1038/414813a
3. American Diabetes Association. Economic costs of diabetes in the U.S. in 2007. Diabetes Care (2008) 31:596–615. doi: 10.2337/dc08-9017
4. Lithovius R, Harjutsalo V, Forsblom C, Groop PH, FinnDiane Study Group. Cumulative cost of prescription medication in outpatients with type 1 diabetes in Finland. Diabetologia (2011) 54:496–503. doi: 10.1007/s00125-010-1999-y
5. Costacou T, Orchard TJ. Cumulative kidney complication risk by 50 years of type 1 diabetes: the effects of sex, age, and calendar year at onset. Diabetes Care (2017) 41:426–33. doi: 10.2337/dc17-1118
6. Jansson Sigfrids F, Groop P-H, Harjutsalo V. Incidence rate patterns, cumulative incidence, and time trends for moderate and severe albuminuria in individuals diagnosed with type 1 diabetes aged 0-14 years: a population-based retrospective cohort study. Lancet Diabetes Endocrinol (2022) 10:489–98. doi: 10.1016/S2213-8587(22)00099-7
7. Thomas MC, Weekes AJ, Broadley OJ, Cooper ME, Mathew TH. The burden of chronic kidney disease in Australian patients with type 2 diabetes (the NEFRON study). Med J Aust (2006) 185:140–4. doi: 10.5694/j.1326-5377.2006.tb00499.x
8. Harjutsalo V, Maric C, Forsblom C, Thorn L, Waden J, Groop PH, et al. Sex-related differences in the long-term risk of microvascular complications by age at onset of type 1 diabetes. Diabetologia (2011) 54:1992–9. doi: 10.1007/s00125-011-2144-2
9. Schernthaner G, Schernthaner GH. Diabetic nephropathy: new approaches for improving glycemic control and reducing risk. JNephrol (2013) 26:975–85. doi: 10.5301/jn.5000281
10. Tuomilehto J, Borch-Johnsen K, Molarius A, Forsen T, Rastenyte D, Sarti C, et al. Incidence of cardiovascular disease in type 1 (insulin-dependent) diabetic subjects with and without diabetic nephropathy in Finland. Diabetologia (1998) 41:784–90. doi: 10.1007/s001250050988
11. Anders H-J, Huber TB, Isermann B, Schiffer M. CKD in diabetes: diabetic kidney disease versus nondiabetic kidney disease. Nat Rev Nephrol (2018) 14:361–77. doi: 10.1038/s41581-018-0001-y
12. Najafian B, Mauer M. Morphologic features of declining renal function in type 1 diabetes. Semin Nephrol (2012) 32:415–22. doi: 10.1016/j.semnephrol.2012.07.003
13. Quinn M, Angelico MC, Warram JH, Krolewski AS. Familial factors determine the development of diabetic nephropathy in patients with IDDM. Diabetologia (1996) 39:940–5. doi: 10.1007/BF00403913
14. Seaquist ER, Goetz FC, Rich S, Barbosa J. Familial clustering of diabetic kidney disease. NEnglJMed (1989) 320:1161–5. doi: 10.1056/NEJM198905043201801
15. Earle K, Walker J, Hill C, Viberti G. Familial clustering of cardiovascular disease in patients with insulin-dependent diabetes and nephropathy. NEnglJMed (1992) 326:673–7. doi: 10.1056/NEJM199203053261005
16. Harjutsalo V, Katoh S, Sarti C, Tajima N, Tuomilehto J. Population-based assessment of familial clustering of diabetic nephropathy in type 1 diabetes. Diabetes (2004) 53:2449–54. doi: 10.2337/diabetes.53.9.2449
17. Borch-Johnsen K, Norgaard K, Hommel E, Mathiesen ER, Jensen JS, Deckert T, et al. Is diabetic nephropathy an inherited complication. Kidney Int (1992) 41:719–22. doi: 10.1038/ki.1992.112
18. Sandholm N, Van Zuydam N, Ahlqvist E, Juliusdottir T, Deshmukh HA, Rayner NW, et al. The genetic landscape of renal complications in type 1 diabetes. J Am Soc Nephrol (2017) 28:557–74. doi: 10.1681/ASN.2016020231
19. van Zuydam NR, Ahlqvist E, Sandholm N, Deshmukh H, Rayner NW, Abdalla M, et al. A genome-wide association study of diabetic kidney disease in subjects with type 2 diabetes. Diabetes (2018) 67:1414–27. doi: 10.2337/db17-0914
20. Kim J, Jensen A, Ko S, Raghavan S, Phillips LS, Hung A, et al. Systematic heritability and heritability enrichment analysis for diabetes complications in UK biobank and ACCORD studies. Diabetes (2022) 71:1137–48. doi: 10.2337/db21-0839
21. Fogarty DG, Rich SS, Hanna L, Warram JH, Krolewski AS. Urinary albumin excretion in families with type 2 diabetes is heritable and genetically correlated to blood pressure. Kidney Int (2000) 57:250–7. doi: 10.1046/j.1523-1755.2000.00833.x
22. Forsblom CM, Kanninen T, Lehtovirta M, Saloranta C, Groop LC. Heritability of albumin excretion rate in families of patients with type II diabetes. Diabetologia (1999) 42:1359–66. doi: 10.1007/s001250051450
23. Krolewski AS, Poznik GD, Placha G, Canani L, Dunn J, Walker W, et al. A genome-wide linkage scan for genes controlling variation in urinary albumin excretion in type II diabetes. Kidney Int (2006) 69:129–36. doi: 10.1038/sj.ki.5000023
24. Langefeld CD, Beck SR, Bowden DW, Rich SS, Wagenknecht LE, Freedman BI. Heritability of GFR and albuminuria in caucasians with type 2 diabetes mellitus. Am J Kidney Dis (2004) 43:796–800. doi: 10.1053/j.ajkd.2003.12.043
25. Sandholm N, Forsblom C, Makinen VP, McKnight AJ, Osterholm AM, He B, et al. Genome-wide association study of urinary albumin excretion rate in patients with type 1 diabetes. Diabetologia (2014) 57:1143–53. doi: 10.1007/s00125-014-3202-3
26. Moczulski DK, Rogus JJ, Antonellis A, Warram JH, Krolewski AS. Major susceptibility locus for nephropathy in type 1 diabetes on chromosome 3q: results of novel discordant sib-pair analysis. Diabetes (1998) 47:1164. doi: 10.2337/diabetes.47.7.1164
27. Osterholm AM, He B, Pitkaniemi J, Albinsson L, Berg T, Sarti C, et al. Genome-wide scan for type 1 diabetic nephropathy in the Finnish population reveals suggestive linkage to a single locus on chromosome 3q. Kidney Int (2007) 71:140–5. doi: 10.1038/sj.ki.5001933
28. Rogus JJ, Poznik GD, Pezzolesi MG, Smiles AM, Dunn J, Walker W, et al. High-density single nucleotide polymorphism genome-wide linkage scan for susceptibility genes for diabetic nephropathy in type 1 diabetes. Diabetes (2008) 57:2519–26. doi: 10.2337/db07-1086
29. Wessman M, Forsblom C, Kaunisto MA, Soderlund J, Ilonen J, Sallinen R, et al. Novel susceptibility locus at 22q11 for diabetic nephropathy in type 1 diabetes. PloS One (2011) 6:e24053. doi: 10.1371/journal.pone.0024053
30. Imperatore G, Hanson RL, Pettitt DJ, Kobes S, Bennett PH, Knowler WC. Sib-Pair linkage analysis for susceptibility genes for microvascular complications among pima indians with type 2 diabetes. Pima Diabetes Genes Group Diabetes (1998) 47:821–30. doi: 10.2337/diabetes.47.5.821
31. Bowden DW, Colicigno CJ, Langefeld CD, Sale MM, Williams A, Anderson PJ, et al. A genome scan for diabetic nephropathy in African americans. Kidney Int (2004) 66:1517–26. doi: 10.1111/j.1523-1755.2004.00915.x
32. Vionnet N, Tregouet D, Kazeem G, Gut I, Groop PH, Tarnow L, et al. Analysis of 14 candidate genes for diabetic nephropathy on chromosome 3q in European populations: strongest evidence for association with a variant in the promoter region of the adiponectin gene. Diabetes (2006) 55:3166–74. doi: 10.2337/db06-0271
33. He B, Österholm AM, Hoverfält A, Forsblom C, Hjörleifsdóttir EE, Nilsson AS, et al. Association of genetic variants at 3q22 with nephropathy in patients with type 1 diabetes mellitus. Am J Hum Genet (2009) 84:5–13. doi: 10.1016/j.ajhg.2008.11.012
34. Vardarli I, Baier LJ, Hanson RL, Akkoyun I, Fischer C, Rohmeiss P, et al. Gene for susceptibility to diabetic nephropathy in type 2 diabetes maps to 18q22.3-23. Kidney Int (2002) 62:2176–83. doi: 10.1046/j.1523-1755.2002.00663.x
35. Janssen B, Hohenadel D, Brinkkoetter P, Peters V, Rind N, Fischer C, et al. Carnosine as a protective factor in diabetic nephropathy: association with a leucine repeat of the carnosinase gene CNDP1. Diabetes (2005) 54:2320–7. doi: 10.2337/diabetes.54.8.2320
36. Mooyaart A, Valk EJJ, van Es L, Bruijn J, de Heer E, Freedman B, et al. Genetic associations in diabetic nephropathy: a meta-analysis. Diabetologia (2011) 54:544–53. doi: 10.1007/s00125-010-1996-1
37. Tong Z, Yang Z, Patel S, Chen H, Gibbs D, Yang X, et al. Promoter polymorphism of the erythropoietin gene in severe diabetic eye and kidney complications. ProcNatlAcadSciUSA (2008) 105:6998–7003. doi: 10.1073/pnas.0800454105
38. Porta M, Toppila I, Sandholm N, Hosseini SM, Forsblom C, Hietala K, et al. Variation in SLC19A3 and protection from microvascular damage in type 1 diabetes. Diabetes (2016) 65:1022–30. doi: 10.2337/db15-1247
39. Sladek R, Rocheleau G, Rung J, Dina C, Shen L, Serre D, et al. A genome-wide association study identifies novel risk loci for type 2 diabetes. Nature (2007) 445:881–5. doi: 10.1038/nature05616
40. Diabetes Genetics Initiative of Broad Institute of Harvard, MIT, Lund University, Novartis Institutes of BioMedical Research, Saxena R, Voight BF, Lyssenko V, et al. Genome-wide association analysis identifies loci for type 2 diabetes and triglyceride levels. Science (2007) 316:1331–6. doi: 10.1126/science.1142358
41. Scott LJ, Mohlke KL, Bonnycastle LL, Willer CJ, Li Y, Duren WL, et al. A genome-wide association study of type 2 diabetes in finns detects multiple susceptibility variants. Science (2007) 316:1341–5. doi: 10.1126/science.1142382
42. Todd JA, Walker NM, Cooper JD, Smyth DJ, Downes K, Plagnol V, et al. Robust associations of four new chromosome regions from genome-wide analyses of type 1 diabetes. NatGenet (2007) 39:857–64. doi: 10.1038/ng2068
43. Reich DE, Lander ES. On the allelic spectrum of human disease. Trends Genet (2001) 17:502–10. doi: 10.1016/s0168-9525(01)02410-6
44. Sandholm N, Salem RM, McKnight AJ, Brennan EP, Forsblom C, Isakova T, et al. New susceptibility loci associated with kidney disease in type 1 diabetes. PloS Genet (2012) 8:e1002921. doi: 10.1371/journal.pgen.1002921
45. Sandholm N, McKnight AJ, Salem RM, Brennan EP, Forsblom C, Harjutsalo V, et al. Chromosome 2q31.1 associates with ESRD in women with type 1 diabetes. JAmSocNephrol (2013) 24:1537–43. doi: 10.1681/ASN.2012111122
46. Iyengar SK, Sedor JR, Freedman BI, Kao WH, Kretzler M, Keller BJ, et al. Genome-wide association and trans-ethnic meta-analysis for advanced diabetic kidney disease: family investigation of nephropathy and diabetes (FIND). PloS Genet (2015) 11:e1005352. doi: 10.1371/journal.pgen.1005352
47. Taira M, Imamura M, Takahashi A, Kamatani Y, Yamauchi T, Araki SI, et al. A variant within the FTO confers susceptibility to diabetic nephropathy in Japanese patients with type 2 diabetes. PloS One (2018) 13:e0208654. doi: 10.1371/journal.pone.0208654
48. Guan M, Keaton JM, Dimitrov L, Hicks PJ, Xu J, Palmer ND, et al. Genome-wide association study identifies novel loci for type 2 diabetes-attributed end-stage kidney disease in African americans. Hum Genomics (2019) 13:21. doi: 10.1186/s40246-019-0205-7
49. Salem RM, Todd JN, Sandholm N, Cole JB, Chen W-M, Andrews D, et al. Genome-wide association study of diabetic kidney disease highlights biology involved in glomerular basement membrane collagen. J Am Soc Nephrol (2019) 30:2000–16. doi: 10.1681/ASN.2019030218
50. Khattab A, Torkamani A. Nidogen-1 could play a role in diabetic kidney disease development in type 2 diabetes: a genome-wide association meta-analysis. Hum Genomics (2022) 16:47. doi: 10.1186/s40246-022-00422-y
51. Haukka J, Sandholm N, Valo E, Forsblom C, Harjutsalo V, Cole JB, et al. Novel linkage peaks discovered for diabetic nephropathy in individuals with type 1 diabetes. Diabetes (2021) 70:986–95. doi: 10.2337/db20-0158
52. Sandholm N, Cole JB, Nair V, Sheng X, Liu H, Ahlqvist E, et al. Genome-wide meta-analysis and omics integration identifies novel genes associated with diabetic kidney disease. Diabetologia (2022) 65:1495–509. doi: 10.1007/s00125-022-05735-0
53. Pan Y, Sun X, Mi X, Huang Z, Hsu Y, Hixson JE, et al. Whole-exome sequencing study identifies four novel gene loci associated with diabetic kidney disease. Hum Mol Genet (2022), 32:1048–60 ddac290. doi: 10.1093/hmg/ddac290
54. Freedman BI, Langefeld CD, Lu L, Divers J, Comeau ME, Kopp JB, et al. Differential effects of MYH9 and APOL1 risk variants on FRMD3 association with diabetic ESRD in African americans. PloS Genet (2011) 7:e1002150. doi: 10.1371/journal.pgen.1002150
55. Pezzolesi MG, Jeong J, Smiles AM, Skupien J, Mychaleckyj JC, Rich SS, et al. Family-based association analysis confirms the role of the chromosome 9q21.32 locus in the susceptibility of diabetic nephropathy. PloS One (2013) 8:e60301. doi: 10.1371/journal.pone.0060301
56. Pezzolesi MG, Skupien J, Mychaleckyj JC, Warram JH, Krolewski AS. Insights to the genetics of diabetic nephropathy through a genome-wide association study of the GoKinD collection. SeminNephrol (2010) 30:126–40. doi: 10.1016/j.semnephrol.2010.01.004
57. Germain M, Pezzolesi MG, Sandholm N, McKnight AJ, Susztak K, Lajer M, et al. SORBS1 gene, a new candidate for diabetic nephropathy: results from a multi-stage genome-wide association study in patients with type 1 diabetes. Diabetologia (2015) 58:543–8. doi: 10.1007/s00125-014-3459-6
58. Hindorff LA, Sethupathy P, Junkins HA, Ramos EM, Mehta JP, Collins FS, et al. Potential etiologic and functional implications of genome-wide association loci for human diseases and traits. Proc Natl Acad Sci U.S.A. (2009) 106:9362–7. doi: 10.1073/pnas.0903103106
59. Project Consortium ENCODE, Bernstein BE, Birney E, Dunham I, Green ED, Gunter C, et al. An integrated encyclopedia of DNA elements in the human genome. Nature (2012) 489:57–74. doi: 10.1038/nature11247
60. Võsa U, Claringbould A, Westra H-J, Bonder MJ, Deelen P, Zeng B, et al. Large-Scale cis- and trans-eQTL analyses identify thousands of genetic loci and polygenic scores that regulate blood gene expression. Nat Genet (2021) 53:1300–10. doi: 10.1038/s41588-021-00913-z
61. Stoner M, Wang F, Wormke M, Nguyen T, Samudio I, Vyhlidal C, et al. Inhibition of vascular endothelial growth factor expression in HEC1A endometrial cancer cells through interactions of estrogen receptor alpha and Sp3 proteins. JBiolChem (2000) 275:22769–79. doi: 10.1074/jbc.M002188200
62. Ziera T, Irlbacher H, Fromm A, Latouche C, Krug SM, Fromm M, et al. Cnksr3 is a direct mineralocorticoid receptor target gene and plays a key role in the regulation of the epithelial sodium channel. FASEB J (2009) 23:3936–46. doi: 10.1096/fj.09-134759
63. Lewis EJ, Hunsicker LG, Bain RP, Rohde RD. The effect of angiotensin-converting-enzyme inhibition on diabetic nephropathy. Collab Study Group NEnglJMed (1993) 329:1456–62. doi: 10.1056/NEJM199311113292004
64. Brenner BM, Cooper ME, de Zeeuw D, Keane WF, Mitch WE, Parving HH, et al. Effects of losartan on renal and cardiovascular outcomes in patients with type 2 diabetes and nephropathy. NEnglJMed (2001) 345:861–9. doi: 10.1056/NEJMoa011161
65. Bakris GL, Agarwal R, Anker SD, Pitt B, Ruilope LM, Rossing P, et al. Effect of finerenone on chronic kidney disease outcomes in type 2 diabetes. N Engl J Med (2020) 383:2219–29. doi: 10.1056/NEJMoa2025845
66. Takahashi T, Takahashi K, Gerety S, Wang H, Anderson DJ, Daniel TO. Temporally compartmentalized expression of ephrin-B2 during renal glomerular development. J Am Soc Nephrol (2001) 12:2673–82. doi: 10.1681/ASN.V12122673
67. Tzur S, Rosset S, Shemer R, Yudkovsky G, Selig S, Tarekegn A, et al. Missense mutations in the APOL1 gene are highly associated with end stage kidney disease risk previously attributed to the MYH9 gene. Hum Genet (2010) 128:345–50. doi: 10.1007/s00439-010-0861-0
68. Genovese G, Friedman DJ, Ross MD, Lecordier L, Uzureau P, Freedman BI, et al. Association of trypanolytic ApoL1 variants with kidney disease in African americans. Science (2010) 329:841–5. doi: 10.1126/science.1193032
69. Loos RJF, Yeo GSH. The bigger picture of FTO: the first GWAS-identified obesity gene. Nat Rev Endocrinol (2014) 10:51–61. doi: 10.1038/nrendo.2013.227
70. Todd JN, Dahlstrom EH, Salem RM, Sandholm N, Forsblom C, Group FS, et al. Genetic evidence for a causal role of obesity in diabetic kidney disease. Diabetes (2015) 64:4238–46. doi: 10.2337/db15-0254
71. Sobreira DR, Joslin AC, Zhang Q, Williamson I, Hansen GT, Farris KM, et al. Extensive pleiotropism and allelic heterogeneity mediate metabolic effects of IRX3 and IRX5. Science (2021) 372:1085–91. doi: 10.1126/science.abf1008
72. Sakaue S, Kanai M, Tanigawa Y, Karjalainen J, Kurki M, Koshiba S, et al. A cross-population atlas of genetic associations for 220 human phenotypes. Nat Genet (2021) 53:1415–24. doi: 10.1038/s41588-021-00931-x
73. Köttgen A, Glazer NL, Dehghan A, Hwang SJ, Katz R, Li M, et al. Multiple loci associated with indices of renal function and chronic kidney disease. NatGenet (2009) 41:712–7. doi: 10.1038/ng.377
74. Böger CA, Gorski M, Li M, Hoffmann MM, Huang C, Yang Q, et al. Association of eGFR-related loci identified by GWAS with incident CKD and ESRD. PloS Genet (2011) 7:e1002292. doi: 10.1371/journal.pgen.1002292
75. Pattaro C, Teumer A, Gorski M, Chu AY, Li M, Mijatovic V, et al. Genetic associations at 53 loci highlight cell types and biological pathways relevant for kidney function. NatCommun (2016) 7:10023. doi: 10.1038/ncomms10023
76. Winkler TW, Rasheed H, Teumer A, Gorski M, Rowan BX, Stanzick KJ, et al. Differential and shared genetic effects on kidney function between diabetic and non-diabetic individuals. Commun Biol (2022) 5:580. doi: 10.1038/s42003-022-03448-z
77. Smyth LJ, Dahlström EH, Syreeni A, Kerr K, Kilner J, Doyle R, et al. Epigenome-wide meta-analysis identifies DNA methylation biomarkers associated with diabetic kidney disease. Nat Commun (2022) 13:7891. doi: 10.1038/s41467-022-34963-6
78. Schlosser P, Tin A, Matias-Garcia PR, Thio CHL, Joehanes R, Liu H, et al. Meta-analyses identify DNA methylation associated with kidney function and damage. Nat Commun (2021) 12:7174. doi: 10.1038/s41467-021-27234-3
79. Dziadek M. Role of laminin-nidogen complexes in basement membrane formation during embryonic development. Experientia (1995) 51:901–13. doi: 10.1007/BF01921740
80. Sambo F, Malovini A, Sandholm N, Stavarachi M, Forsblom C, Makinen VP, et al. Novel genetic susceptibility loci for diabetic end-stage renal disease identified through robust naive bayes classification. Diabetologia (2014) 57:1611–22. doi: 10.1007/s00125-014-3256-2
81. Sandholm N, Haukka JK, Toppila I, Valo E, Harjutsalo V, Forsblom C, et al. Confirmation of GLRA3 as a susceptibility locus for albuminuria in Finnish patients with type 1 diabetes. Sci Rep (2018) 8:12408. doi: 10.1038/s41598-018-29211-1
82. Teumer A, Li Y, Ghasemi S, Prins BP, Wuttke M, Hermle T, et al. Genome-wide association meta-analyses and fine-mapping elucidate pathways influencing albuminuria. Nat Commun (2019) 10:4130. doi: 10.1038/s41467-019-11576-0
83. Li C, Liu C, Nissim I, Chen J, Chen P, Doliba N, et al. Regulation of glucagon secretion in normal and diabetic human islets by gamma-hydroxybutyrate and glycine. JBiolChem (2013) 288:3938–51. doi: 10.1074/jbc.M112.385682
84. Climie RE, Srikanth V, Keith LJ, Davies JE, Sharman JE. Exercise excess pressure and exercise-induced albuminuria in patients with type 2 diabetes mellitus. AmJPhysiolHeart CircPhysiol (2015) 308:H1136–42. doi: 10.1152/ajpheart.00739.2014
85. Kim G-H. Renal effects of prostaglandins and cyclooxygenase-2 inhibitors. Electrolyte Blood Press (2008) 6:35–41. doi: 10.5049/EBP.2008.6.1.35
86. Böger CA, Chen MH, Tin A, Olden M, Kottgen A, de Boer IH, et al. CUBN is a gene locus for albuminuria. JAmSocNephrol (2011) 22:555–70. doi: 10.1681/ASN.2010060598
87. Teumer A, Tin A, Sorice R, Gorski M, Yeo NC, Chu AY, et al. Genome-wide association studies identify genetic loci associated with albuminuria in diabetes. Diabetes (2016) 65:803–17. doi: 10.2337/db15-1313
88. Liu H, Doke T, Guo D, Sheng X, Ma Z, Park J, et al. Epigenomic and transcriptomic analyses define core cell types, genes and targetable mechanisms for kidney disease. Nat Genet (2022) 54:950–62. doi: 10.1038/s41588-022-01097-w
89. Chronic Kidney Disease Collaboration GBD. Global, regional, and national burden of chronic kidney disease, 1990-2017: a systematic analysis for the global burden of disease study 2017. Lancet (2020) 395:709–33. doi: 10.1016/S0140-6736(20)30045-3
90. Di Vincenzo A, Bettini S, Russo L, Mazzocut S, Mauer M, Fioretto P. Renal structure in type 2 diabetes: facts and misconceptions. J Nephrol (2020) 33:901–7. doi: 10.1007/s40620-020-00797-y
91. de Boer IH, Khunti K, Sadusky T, Tuttle KR, Neumiller JJ, Rhee CM, et al. Diabetes management in chronic kidney disease: a consensus report by the American diabetes association (ADA) and kidney disease: improving global outcomes (KDIGO). Diabetes Care (2022) 45:3075–90. doi: 10.2337/dci22-0027
92. Gorski M, van der Most PJ, Teumer A, Chu AY, Li M, Mijatovic V, et al. Genomes-based meta-analysis identifies 10 novel loci for kidney function. Sci Rep (2017) 7:45040. doi: 10.1038/srep45040
93. Gorski M, Rasheed H, Teumer A, Thomas LF, Graham SE, Sveinbjornsson G, et al. Genetic loci and prioritization of genes for kidney function decline derived from a meta-analysis of 62 longitudinal genome-wide association studies. Kidney Int (2022) 102:624–39. doi: 10.1016/j.kint.2022.05.021
94. Ahluwalia TS, Schulz CA, Waage J, Skaaby T, Sandholm N, van Zuydam N, et al. A novel rare CUBN variant and three additional genes identified in europeans with and without diabetes: results from an exome-wide association study of albuminuria. Diabetologia (2019) 62:292–305. doi: 10.1007/s00125-018-4783-z
95. Uglebjerg N, Ahmadizar F, Aly DM, Cañadas-Garre M, Hill C, Naber A, et al. Four missense genetic variants in CUBN are associated with higher levels of eGFR in non-diabetes but not in diabetes mellitus or its subtypes: a genetic association study in europeans. Front Endocrinol (Lausanne) (2023) 14:1081741. doi: 10.3389/fendo.2023.1081741
96. Voskarides K, Damianou L, Neocleous V, Zouvani I, Christodoulidou S, Hadjiconstantinou V, et al. COL4A3/COL4A4 mutations producing focal segmental glomerulosclerosis and renal failure in thin basement membrane nephropathy. J Am Soc Nephrol (2007) 18:3004–16. doi: 10.1681/ASN.2007040444
97. Jukarainen S, Kiiskinen T, Kuitunen S, Havulinna AS, Karjalainen J, Cordioli M, et al. Genetic risk factors have a substantial impact on healthy life years. Nat Med (2022) 28:1893–901. doi: 10.1038/s41591-022-01957-2
98. Jurgens SJ, Choi SH, Morrill VN, Chaffin M, Pirruccello JP, Halford JL, et al. Analysis of rare genetic variation underlying cardiometabolic diseases and traits among 200,000 individuals in the UK biobank. Nat Genet (2022) 54:240–50. doi: 10.1038/s41588-021-01011-w
99. Akilesh S, Suleiman H, Yu H, Stander MC, Lavin P, Gbadegesin R, et al. Arhgap24 inactivates Rac1 in mouse podocytes, and a mutant form is associated with familial focal segmental glomerulosclerosis. J Clin Invest (2011) 121:4127–37. doi: 10.1172/JCI46458
100. Pitera JE, Scambler PJ, Woolf AS. Fras1, a basement membrane-associated protein mutated in Fraser syndrome, mediates both the initiation of the mammalian kidney and the integrity of renal glomeruli. Hum Mol Genet (2008) 17:3953–64. doi: 10.1093/hmg/ddn297
101. Mychaleckyj J, Valo E, Ichimura T, Ahluwalia T, Dina C, Miller R, et al. Association of coding variants in hydroxysteroid 17-beta dehydrogenase 14 (HSD17B14) with reduced progression to end stage kidney disease in type 1 diabetes. J Am Soc Nephrol (2021), 32:2634–51 ASN.2020101457. doi: 10.1681/ASN.2020101457
102. Si Y, Vanderwerff B, Zöllner S. Why are rare variants hard to impute? Coalescent models reveal theoretical limits in existing algorithms. Genetics (2021) 217:iyab011. doi: 10.1093/genetics/iyab011
103. Flannick J, Mercader JM, Fuchsberger C, Udler MS, Mahajan A, Wessel J, et al. Exome sequencing of 20,791 cases of type 2 diabetes and 24,440 controls. Nature (2019) 570:71–6. doi: 10.1038/s41586-019-1231-2
104. Vujkovic M, Keaton JM, Lynch JA, Miller DR, Zhou J, Tcheandjieu C, et al. Discovery of 318 new risk loci for type 2 diabetes and related vascular outcomes among 1.4 million participants in a multi-ancestry meta-analysis. Nat Genet (2020) 52:680–91. doi: 10.1038/s41588-020-0637-y
105. Guo J, Rackham OJL, Sandholm N, He B, Osterholm AM, Valo E, et al. Whole-genome sequencing of Finnish type 1 diabetic siblings discordant for kidney disease reveals DNA variants associated with diabetic nephropathy. JAmSocNephrol (2020) 31:309–23. doi: 10.1681/ASN.2019030289
106. Lin BM, Grinde KE, Brody JA, Breeze CE, Raffield LM, Mychaleckyj JC, et al. Whole genome sequence analyses of eGFR in 23,732 people representing multiple ancestries in the NHLBI trans-omics for precision medicine (TOPMed) consortium. eBioMedicine (2021) 63:103157. doi: 10.1016/j.ebiom.2020.103157
107. Ding H, Zhang L, Yang Q, Zhang X, Li X. Epigenetics in kidney diseases. Adv Clin Chem (2021) 104:233–97. doi: 10.1016/bs.acc.2020.09.005
108. Balnis J, Madrid A, Hogan KJ, Drake LA, Adhikari A, Vancavage R, et al. Persistent blood DNA methylation changes one year after SARS-CoV-2 infection. Clin Epigenet (2022) 14:94. doi: 10.1186/s13148-022-01313-8
109. Miller RG, Mychaleckyj JC, Onengut-Gumuscu S, Orchard TJ, Costacou T. TXNIP DNA methylation is associated with glycemic control over 28 years in type 1 diabetes: findings from the Pittsburgh epidemiology of diabetes complications (EDC) study. BMJ Open Diabetes Res Care (2023) 11:e003068. doi: 10.1136/bmjdrc-2022-003068
110. Miao F, Chen Z, Genuth S, Paterson A, Zhang L, Wu X, et al. Evaluating the role of epigenetic histone modifications in the metabolic memory of type 1 diabetes. Diabetes (2014) 63:1748–62. doi: 10.2337/db13-1251
111. Chen Z, Miao F, Paterson AD, Lachin JM, Zhang L, Schones DE, et al. Epigenomic profiling reveals an association between persistence of DNA methylation and metabolic memory in the DCCT/EDIC type 1 diabetes cohort. Proc Natl Acad Sci U.S.A. (2016) 113:E3002–3011. doi: 10.1073/pnas.1603712113
112. Writing Team for the DCCT/EDIC Research Group. Sustained effect of intensive treatment of type 1 diabetes mellitus on development and progression of diabetic nephropathy: the epidemiology of diabetes interventions and complications (EDIC) study. JAMA (2003) 290:2159–67. doi: 10.1001/jama.290.16.2159
113. DCCT/EDIC Research Group, de Boer IH, Sun W, Cleary PA, Lachin JM, Molitch ME, et al. Intensive diabetes therapy and glomerular filtration rate in type 1 diabetes. NEnglJMed (2011) 365:2366–76. doi: 10.1056/NEJMoa1111732
114. Chen Z, Miao F, Braffett BH, Lachin JM, Zhang L, Wu X, et al. DNA Methylation mediates development of HbA1c-associated complications in type 1 diabetes. Nat Metab (2020) 2:744–62. doi: 10.1038/s42255-020-0231-8
115. Jia Y, Reddy MA, Das S, Oh HJ, Abdollahi M, Yuan H, et al. Dysregulation of histone H3 lysine 27 trimethylation in transforming growth factor-β1-induced gene expression in mesangial cells and diabetic kidney. J Biol Chem (2019) 294:12695–707. doi: 10.1074/jbc.RA119.007575
116. Keating ST, van Diepen JA, Riksen NP, El-Osta A. Epigenetics in diabetic nephropathy, immunity and metabolism. Diabetologia (2018) 61:6–20. doi: 10.1007/s00125-017-4490-1
117. Park J, Guan Y, Sheng X, Gluck C, Seasock MJ, Hakimi AA, et al. Functional methylome analysis of human diabetic kidney disease. JCI Insight (2019) 4:e128886. doi: 10.1172/jci.insight.128886
118. Bibikova M, Barnes B, Tsan C, Ho V, Klotzle B, Le JM, et al. High density DNA methylation array with single CpG site resolution. Genomics (2011) 98:288–95. doi: 10.1016/j.ygeno.2011.07.007
119. Saffari A, Silver MJ, Zavattari P, Moi L, Columbano A, Meaburn EL, et al. Estimation of a significance threshold for epigenome-wide association studies. Genet Epidemiol (2018) 42:20–33. doi: 10.1002/gepi.22086
120. Bell CG, Teschendorff AE, Rakyan VK, Maxwell AP, Beck S, Savage DA. Genome-wide DNA methylation analysis for diabetic nephropathy in type 1 diabetes mellitus. BMC Med Genomics (2010) 3:33. doi: 10.1186/1755-8794-3-33
121. Sapienza C, Lee J, Powell J, Erinle O, Yafai F, Reichert J, et al. DNA Methylation profiling identifies epigenetic differences between diabetes patients with ESRD and diabetes patients without nephropathy. Epigenetics (2011) 6:20–8. doi: 10.4161/epi.6.1.13362
122. Smyth LJ, McKay GJ, Maxwell AP, McKnight AJ. DNA Hypermethylation and DNA hypomethylation is present at different loci in chronic kidney disease. Epigenetics (2014) 9:366–76. doi: 10.4161/epi.27161
123. Swan EJ, Maxwell AP, McKnight AJ. Distinct methylation patterns in genes that affect mitochondrial function are associated with kidney disease in blood-derived DNA from individuals with type 1 diabetes. DiabetMed (2015) 32:1110–5. doi: 10.1111/dme.12775
124. Qiu C, Hanson RL, Fufaa G, Kobes S, Gluck C, Huang J, et al. Cytosine methylation predicts renal function decline in American indians. Kidney Int (2018) 93:1417–31. doi: 10.1016/j.kint.2018.01.036
125. Gluck C, Qiu C, Han SY, Palmer M, Park J, Ko Y-A, et al. Kidney cytosine methylation changes improve renal function decline estimation in patients with diabetic kidney disease. Nat Commun (2019) 10:2461. doi: 10.1038/s41467-019-10378-8
126. Sheng X, Qiu C, Liu H, Gluck C, Hsu JY, He J, et al. Systematic integrated analysis of genetic and epigenetic variation in diabetic kidney disease. PNAS (2020) 117:29013–24. doi: 10.1073/pnas.2005905117
127. Smyth LJ, Patterson CC, Swan EJ, Maxwell AP, McKnight AJ. DNA Methylation associated with diabetic kidney disease in blood-derived DNA. Front Cell Dev Biol (2020) 8:561907. doi: 10.3389/fcell.2020.561907
128. Kim H, Bae JH, Park KS, Sung J, Kwak SH. DNA Methylation changes associated with type 2 diabetes and diabetic kidney disease in an East Asian population. J Clin Endocrinol Metab (2021) 106:e3837–51. doi: 10.1210/clinem/dgab488
129. Smyth LJ, Kilner J, Nair V, Liu H, Brennan E, Kerr K, et al. Assessment of differentially methylated loci in individuals with end-stage kidney disease attributed to diabetic kidney disease: an exploratory study. Clin Epigenet (2021) 13:99. doi: 10.1186/s13148-021-01081-x
130. Lecamwasam A, Novakovic B, Meyer B, Ekinci EI, Dwyer KM, Saffery R. DNA Methylation profiling identifies epigenetic differences between early versus late stages of diabetic chronic kidney disease. Nephrol Dial Transplant (2021) 36:2027–38. doi: 10.1093/ndt/gfaa226
131. Guintivano J, Shabalin AA, Chan RF, Rubinow DR, Sullivan PF, Meltzer-Brody S, et al. Test-statistic inflation in methylome-wide association studies. Epigenetics (2020) 15:1163–6. doi: 10.1080/15592294.2020.1758382
132. Lecamwasam A, Sexton-Oates A, Carmody J, Ekinci EI, Dwyer KM, Saffery R. DNA Methylation profiling of genomic DNA isolated from urine in diabetic chronic kidney disease: a pilot study. PloS One (2018) 13:e0190280. doi: 10.1371/journal.pone.0190280
133. Tregouet DA, Groop PH, McGinn S, Forsblom C, Hadjadj S, Marre M, et al. G/T substitution in intron 1 of the UNC13B gene is associated with increased risk of nephropathy in patients with type 1 diabetes. Diabetes (2008) 57:2843–50. doi: 10.2337/db08-0073
134. Chu AY, Tin A, Schlosser P, Ko Y-A, Qiu C, Yao C, et al. Epigenome-wide association studies identify DNA methylation associated with kidney function. Nat Commun (2017) 8:1286. doi: 10.1038/s41467-017-01297-7
135. Breeze CE, Batorsky A, Lee MK, Szeto MD, Xu X, McCartney DL, et al. Epigenome-wide association study of kidney function identifies trans-ethnic and ethnic-specific loci. Genome Med (2021) 13:74. doi: 10.1186/s13073-021-00877-z
136. Chen J, Huang Y, Hui Q, Mathur R, Gwinn M, So-Armah K, et al. Epigenetic associations with estimated glomerular filtration rate among men with human immunodeficiency virus infection. Clin Infect Dis (2020) 70:667–73. doi: 10.1093/cid/ciz240
137. Soriano-Tárraga C, Jiménez-Conde J, Giralt-Steinhauer E, Mola-Caminal M, Vivanco-Hidalgo RM, Ois A, et al. Epigenome-wide association study identifies TXNIP gene associated with type 2 diabetes mellitus and sustained hyperglycemia. Hum Mol Genet (2016) 25:609–19. doi: 10.1093/hmg/ddv493
138. Aslibekyan S, Claas SA. Methylation in CPT1A, lipoproteins, and epigenetics. In: Patel V, Preedy V, editors. Handbook of nutrition, diet, and epigenetics. (Cham, Switzerland: Springer International Publishing (2017). p. 1–17. doi: 10.1007/978-3-319-31143-2_108-1
139. Graham SE, Clarke SL, Wu K-HH, Kanoni S, Zajac GJM, Ramdas S, et al. The power of genetic diversity in genome-wide association studies of lipids. Nature (2021) 600:675–9. doi: 10.1038/s41586-021-04064-3
140. Thompson M, Hill BL, Rakocz N, Chiang JN, Geschwind D, Sankararaman S, et al. Methylation risk scores are associated with a collection of phenotypes within electronic health record systems. NPJ Genom Med (2022) 7:50. doi: 10.1038/s41525-022-00320-1
141. Fry A, Littlejohns TJ, Sudlow C, Doherty N, Adamska L, Sprosen T, et al. Comparison of sociodemographic and health-related characteristics of UK biobank participants with those of the general population. Am J Epidemiol (2017) 186:1026–34. doi: 10.1093/aje/kwx246
142. Mahajan A, Spracklen CN, Zhang W, Ng MCY, Petty LE, Kitajima H, et al. Multi-ancestry genetic study of type 2 diabetes highlights the power of diverse populations for discovery and translation. Nat Genet (2022) 54:560–72. doi: 10.1038/s41588-022-01058-3
143. Fraser HB, Lam LL, Neumann SM, Kobor MS. Population-specificity of human DNA methylation. Genome Biol (2012) 13:R8. doi: 10.1186/gb-2012-13-2-r8
144. Breeze CE, Wong JYY, Beck S, Berndt SI, Franceschini N. Diversity in EWAS: current state, challenges, and solutions. Genome Med (2022) 14:71. doi: 10.1186/s13073-022-01065-3
145. Breeze CE, Beck S, Berndt SI, Franceschini N. The missing diversity in human epigenomic studies. Nat Genet (2022) 54:737–9. doi: 10.1038/s41588-022-01081-4
146. Yu Z, Jin J, Tin A, Köttgen A, Yu B, Chen J, et al. Polygenic risk scores for kidney function and their associations with circulating proteome, and incident kidney diseases. J Am Soc Nephrol (2021) 32:3161–73. doi: 10.1681/ASN.2020111599
147. Liao L-N, Li T-C, Li C-I, Liu C-S, Lin W-Y, Lin C-H, et al. Genetic risk score for risk prediction of diabetic nephropathy in han Chinese type 2 diabetes patients. Sci Rep (2019) 9:19897. doi: 10.1038/s41598-019-56400-3
148. Tremblay J, Haloui M, Attaoua R, Tahir R, Hishmih C, Harvey F, et al. Polygenic risk scores predict diabetes complications and their response to intensive blood pressure and glucose control. Diabetologia (2021) 64:2012–25. doi: 10.1007/s00125-021-05491-7
Keywords: diabetic kidney disease, kidney failure, GWAS, genome sequencing, exome sequencing, epigenetics, epigenome-wide association study, EWAS
Citation: Sandholm N, Dahlström EH and Groop P-H (2023) Genetic and epigenetic background of diabetic kidney disease. Front. Endocrinol. 14:1163001. doi: 10.3389/fendo.2023.1163001
Received: 10 February 2023; Accepted: 10 May 2023;
Published: 30 May 2023.
Edited by:
Tarunveer Singh Ahluwalia, Steno Diabetes Center Copenhagen (SDCC), DenmarkReviewed by:
Inês Cebola, Imperial College London, United KingdomValeriya Lyssenko, University of Bergen, Norway
Copyright © 2023 Sandholm, Dahlström and Groop. This is an open-access article distributed under the terms of the Creative Commons Attribution License (CC BY). The use, distribution or reproduction in other forums is permitted, provided the original author(s) and the copyright owner(s) are credited and that the original publication in this journal is cited, in accordance with accepted academic practice. No use, distribution or reproduction is permitted which does not comply with these terms.
*Correspondence: Niina Sandholm, niina.sandholm@helsinki.fi; Per-Henrik Groop, per-henrik.groop@helsinki.fi