
94% of researchers rate our articles as excellent or good
Learn more about the work of our research integrity team to safeguard the quality of each article we publish.
Find out more
ORIGINAL RESEARCH article
Front. Endocrinol. , 02 June 2022
Sec. Clinical Diabetes
Volume 13 - 2022 | https://doi.org/10.3389/fendo.2022.839195
 Xiaomeng Jia1,2†
 Anping Wang1†Longyan Yang2Yu Cheng1Yajing Wang1Jianming Ba1
 Jingtao Dou1
 Yiming Mu1
 Dong Zhao2*
 Zhaohui Lyu1*
Background: Overweight and obesity are well-known risk factors for type 2 diabetes mellitus (T2DM). The effect of the maximum body mass index (BMImax), which indicates the highest body weight before the diagnosis of T2DM, is not fully understood. This study aimed to explore the predictive value of BMImax in the progression of diabetes.
Methods: This prospective study recruited 2018 subjects with normal glucose tolerance in Beijing, China. The subjects were followed up for eight years, and the association between BMImax and glucose outcomes was evaluated.
Results: Ninety-seven of the 2,018 participants developed diabetes by the end of the study. Compared to individuals with normal glucose tolerance, those who developed diabetes were characterized by higher levels of fasting plasma glucose (FPG), 2 h postload glucose (PBG), glycosylated hemoglobin (HbA1c), systolic blood pressure (SBP), and low-density lipoprotein cholesterol (LDL-c), a higher prevalence of a familial history of diabetes and a lower level of high‐density lipoprotein cholesterol (HDL-c). Multivariate regression analysis of sex-stratified groups suggested that FPG, HbA1c, SBP and familial history of diabetes were independent risk factors for diabetes, but that BMImax was a unique indicator for female patients.
Conclusions: BMImax might be an independent predictor of T2DM in females, but it does not seem to be associated with the risk of diabetes in males. BMImax could be regarded as an indicator in the prevention and management of diabetes.
The prevalence of diabetes mellitus in the Chinese population is rapidly increasing, causing China to be the country with the largest population of individuals with diabetes in the world. Type 2 diabetes mellitus (T2DM) is the most common type of diabetes, and its prevalence was reported to be 0.67% in 1980, 11.6% in 2020 and 10.9% according to latest research (1). Approximately 46% of adults in China are obese or overweight, and the prevalence of T2DM in overweight and obese populations is 12.8% and 18.5%, respectively (2). Obesity and T2DM have common triggers in China, such as rapid urbanization and lifestyle changes (3, 4). Obesity can lead to impaired glucose tolerance and insulin resistance (5, 6). Recently, it has been reported that the influence of body weight on T2DM is more obvious among Asian people (7). A nationwide prospective study suggested that insulin resistance was significantly correlated with T2DM, more so than with β-cell dysfunction, in Chinese adults, and that this association pattern was more prominent among those with obesity (8). Body mass index (BMI) is the preferred factor for evaluating adiposity. A strong positive association between BMI and an elevated risk of T2DM has been widely reported by previous studies (9–12). However, the research mostly focused on current BMI or BMI at baseline. Life-time maximum body mass index (BMImax) is an indicator of BMI history and has been reported to be a screening tool for predicting the function of β-cells at the time of diagnosis and reflecting the period when obesity more obviously affected blood glucose (13). Although the associations between BMImax and hypertension (14), fatty liver (15), chronic kidney disease (16) and cardiovascular disease (17) has been reported, less is known about the effect of BMImax on the onset of T2DM.
We hypothesized that BMImax, as an index independent of any intervention, such as medication and lifestyle management, might have a marked association with T2DM on the progression of diabetes. To further understand the effect of obesity on T2DM, we conducted an epidemiological study in a Chinese population that was followed up for 8 years.
The study, which was designed to assess the related factors of diabetes enrolled 6,497 participants who were over 40 years old in the community of Shou Gang, Beijing, in 2011, and conducted comprehensive interviews in 2018 after 8 years from baseline. At baseline, 75-g oral glucose tolerance test (OGTT) results for 3885 of the 6497 participants showed normal glucose tolerance. Of the 3885 subjects, 8 patients who had been diagnosed with diabetes before the BMImax period, 716 patients with missing visits, 623 patients who could not accurately recall their historical weight and 520 patients with missing values for blood glucose or other clinical information were excluded, and 2,018 participants were ultimately recruited. The research was approved by the Clinical Research Ethics Committee of the People’s Liberation Army General Hospital, Beijing, China. All participants were fully informed of the study protocol and signed informed consent forms.
The data were obtained by standardized questionnaire surveys, anthropometric measurements and laboratory examinations, and all the investigators were formally trained. Investigators conducted face-to-face interviews with participants using detailed questionnaires to obtain information on sociodemographic characteristics, lifestyle, medical history, and current dietary regimen. Participants who smoked at least 1 cigarette a day or 7 per week over 6 months were defined as regular smokers. Alcohol drinking was claasified as current drinking (at least once per week for six months or longer), former drinking now abstaining and never drinking.
All subjects underwent standard anthropometric measurements, including body height (BH), body weight (BW), waist circumference (WC), hip circumference (HC), and blood pressure, by the same trained investigators. The subjects were required to remove their shoes and to wear light clothes. BH and BW were recorded to the nearest 0.1 cm and 0.1 kg, respectively. BMI was calculated by the formula: BW/BH2 (kg/m2). The BMImax was calculated based on the highest weight the participants could recall. Blood pressure was measured 3 times at 5-minute intervals after the participants had rested in a seated position for 15 minutes. Average values of systolic blood pressure (SBP), diastolic blood pressure (DBP) and heart rate (HR) were obtained.
Blood samples were collected in the morning, after the participants had fasted for more than 8 h overnight. A 75-g OGTT was performed for participants who had not been previously diagnosed with diabetes. Blood samples were sent to central laboratories for testing. Fasting plasma glucose (FPG) and 2 h postload glucose (PBG) were measured by a hexokinase assay, and glycosylated hemoglobin (HbA1c) was assessed by ion-exchange high-pressure liquid phase assay. High-density lipoprotein cholesterol (HDL-c), low-density lipoprotein cholesterol (LDL-c), total cholesterol (TC), serum triglyceride (TG), creatinine (Cr) and other biochemical indicators were measured by a Roche biochemical analyzer (Cobas 8000 Modular Analyzer Series, Roche Diagnostics, Basel, Switzerland).
According to the Guidelines for Prevention and Control of Overweight and Obesity in Chinese Adults, participants were stratified into BMI groups as follows: underweight (BMI<18.5 kg/m2), normal weight (18.5≤BMI ≤ 24.0 kg/m2), overweight (24.0≤BMI<28.0 kg/m2) and obese (BMI≥28 kg/m2). Diabetes was diagnosed based on the criteria recommended by the World Health Organization (WHO): FPG≥7.0 mmol/l, 2 h PBG≥11.1 mmol/l, or self-reported history of diabetes diagnosed by physicians or undergoing hypoglycemic therapy with antidiabetic medications.
All analyses were performed by SAS version 9.2 (SAS Institute, Inc., Cary, NC, USA) and R version 3.02. Categorical variables are described by the frequency and prevalence, and the chi-square test or Fisher’s exact probability method was used for comparisons between groups. Continuous variables with a normal distribution were described as the mean ± standard deviation (SD), and differences between groups were analyzed by ANOVA. Normally distributed continuous variables are described as the median (25th percentile-75th percentile), and differences between groups were analyzed by the Wilcoxon rank-sum test. Unconditional multiple logistic regression analysis and bilateral tests were used to investigate factors related to diabetes. The nomogram function in R software was used to visualize the prediction model, and the receiver operating characteristic (ROC) curve was used to evaluate the efficiency of the prediction model. P < 0.05 was considered indicative of statistically significance.
A total of 2,018 subjects were enrolled in the study, consisting of 1,386 females and 632 males, and the female-to-male ratio was 2.2:1. The mean age of the participants was 54.18 ± 6.98 years. At the end of the 8-year follow-up period, 97 of 2,018 subjects had developed diabetes, and 1,921 still maintained normal glucose tolerance. Based on the results of the 75-g OGTT, all subjects were divided into normal glucose and diabetes groups. The clinical characteristics were comparatively analyzed. Compared with the subjects with normal glucose tolerance, those who developed diabetes had a higher BMImax (27.02 ± 4.03 kg/m2 vs 25.66 ± 3.38 kg/m2, P<0.001), and the prevalence of obesity defined by BMImax was also higher (37.11% vs. 21.13%, P=0.002). Those diabetic patients presented with higher baseline BMI (26.05 ± 3.73 kg/m2 vs. 25.25 ± 3.26 kg/m2, P=0.020), waist-to-hip ratio (0.89 ± 0.06 vs. 0.88 ± 0.06, P=0.019), fasting plasma glucose (5.52 mmol/l ±0.33 mmol/l vs. 5.28 ± 0.38, P<0.001), 2 h postload glucose (6.44 ± 0.99 mmol/l vs. 6.06 ± 1.02 mmol/l, P<0.001), HbA1c (6.02 ± 0.42% vs. 5.75 ± 0.40%, P<0.001), SBP (134.47 ± 15.42 mmHg vs. 128.36 ± 18.68 mmHg, P<0.001), LDL-c (3.40 ± 0.80 mmol/l vs. 3.19 ± 0.81 mmol/l, P=0.012), and familial history of diabetes (43.30% vs. 24.26%, P<0.001) and lower HDL-c (1.38 ± 0.33 mmol/l vs. 1.50 ± 0.38 mmol/l, P=0.003) (Table 1).
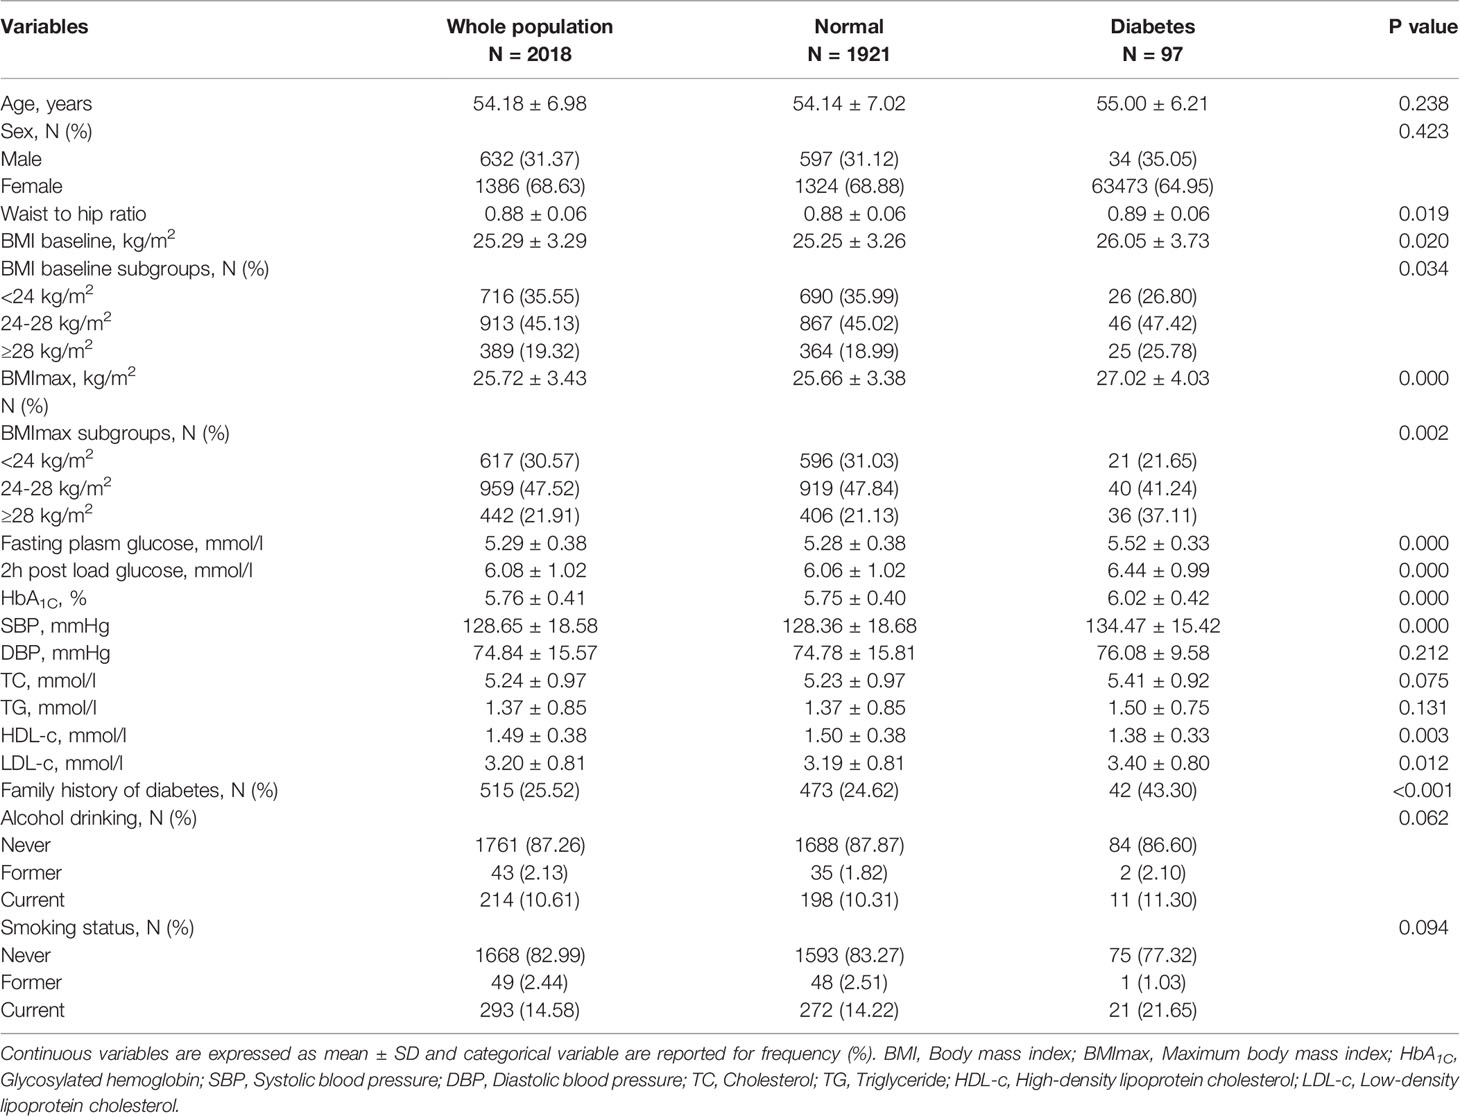
Table 1 Clinical characteristics in subgroups stratified by glucose outcomes at baseline.
The results of the logistic regression analysis suggested that obesity defined by BMImax was associated with a higher risk of diabetes [2.52 (1.45-4.37), P=0.001]. In addition, fasting plasma glucose, 2 h postload glucose, HbA1c, SBP, LDL-c, and familial history of diabetes were also associated with an increased risk of diabetes. HDL-c was negatively associated with diabetes. In the multivariate regression model, we adjusted for confounding factors including age, sex, waist-to-hip ratio, baseline BMI, BMImax, SBP, fasting plasma glucose, 2 h postload glucose, HbA1c, HDL-c, LDL-c, and familial history of diabetes. The results showed that obesity defined by BMImax was still a risk factor for diabetes [3.26 (1.42-7.52), P=0.001]. In addition, fasting plasma glucose [3.69 (1.93-7.07), P<0.001], 2 h postload glucose [1.37 (1.08-1.75), P=0.010], HbA1c [2.66 (1.67-4.23), P<0.001], SBP [1.03 (1.01-1.05), P=0.002], HDL-c [0.48 (0.24-0.97), P=0.042] and familial history of diabetes [1.94 (1.25-3.01), P=0.003] were all factors related to diabetes.
For the sex-specific analysis, among males, the risk of diabetes increased with the level of fasting plasma glucose [9.89 (3.32-29.5), P<0.001], 2 h postload glucose [1.63 (1.14-2.33), P<0.001], HbA1c [6.08 (2.81-13.14), P<0.001] and familial history of diabetes [2.93 (1.45-5.92), P=0.003]. The trends were the same in the adjusted regression model. We did not find an association between BMImax and diabetes among male patients.
Among females, diabetes was positively related to obesity defined by BMImax [2.78 (1.45-5.45), P=0.002], fasting plasma glucose [5.08 (2.48-10.4), P<0.001], HbA1c [2.78 (1.67-4.65), P<0.001], SBP [1.01 (1.00-1.02), P=0.022] and familial history of diabetes [2.12 (1.27-3.54), P=0.004] and negatively related to HDL-c [0.28 (0.13-0.62), P=0.002]. In the adjusted model, obesity defined by BMImax increased the risk of diabetes 3.34 times compared with normal weight [3.97 (1.38-11.44), P=0.011]. Plasma glucose and familial history were common risk factors for diabetes in both males and females. The effect of BMImax on progression to diabetes was more pronounced in females.
We constructed a nomogram for diabetes according to the variables in Table 2, and the probability of diabetes in subjects was evaluated by summing the scores for each variable (Figure 1). The risk of diabetes predicted by this nomogram ranged from 0.01 to 0.7. HbA1c was related to the highest risk of diabetes, followed by fasting plasma glucose, SBP, BMImax, and familial history. A sex-specific predictive model is shown in Figures 2, 3.
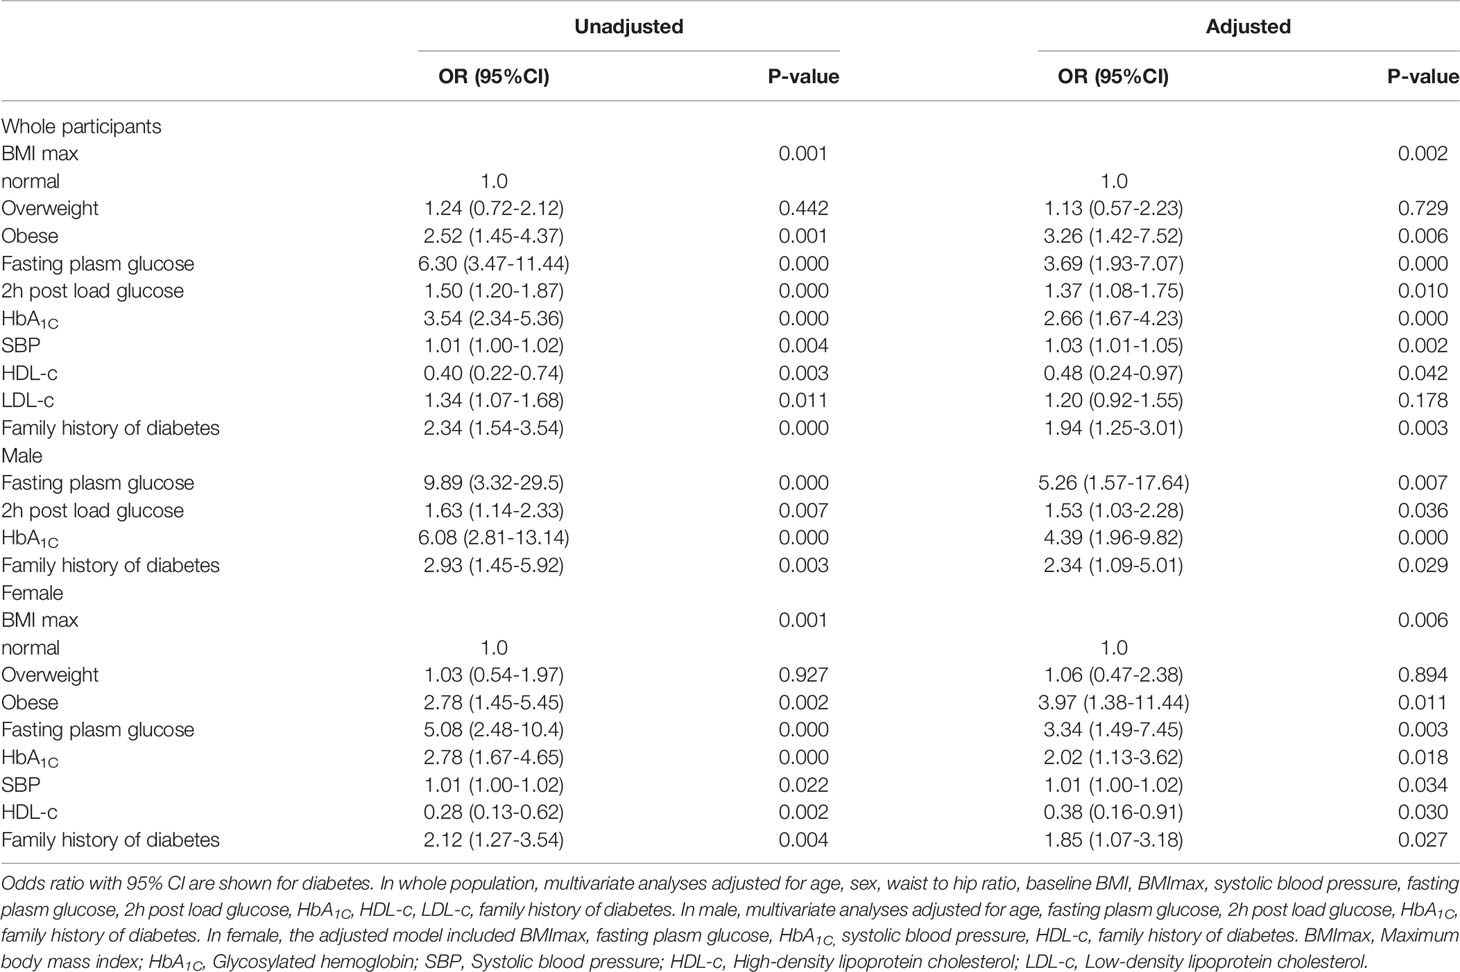
Table 2 Crude and multivariable-adjusted relative risk of related factors for diabetes.
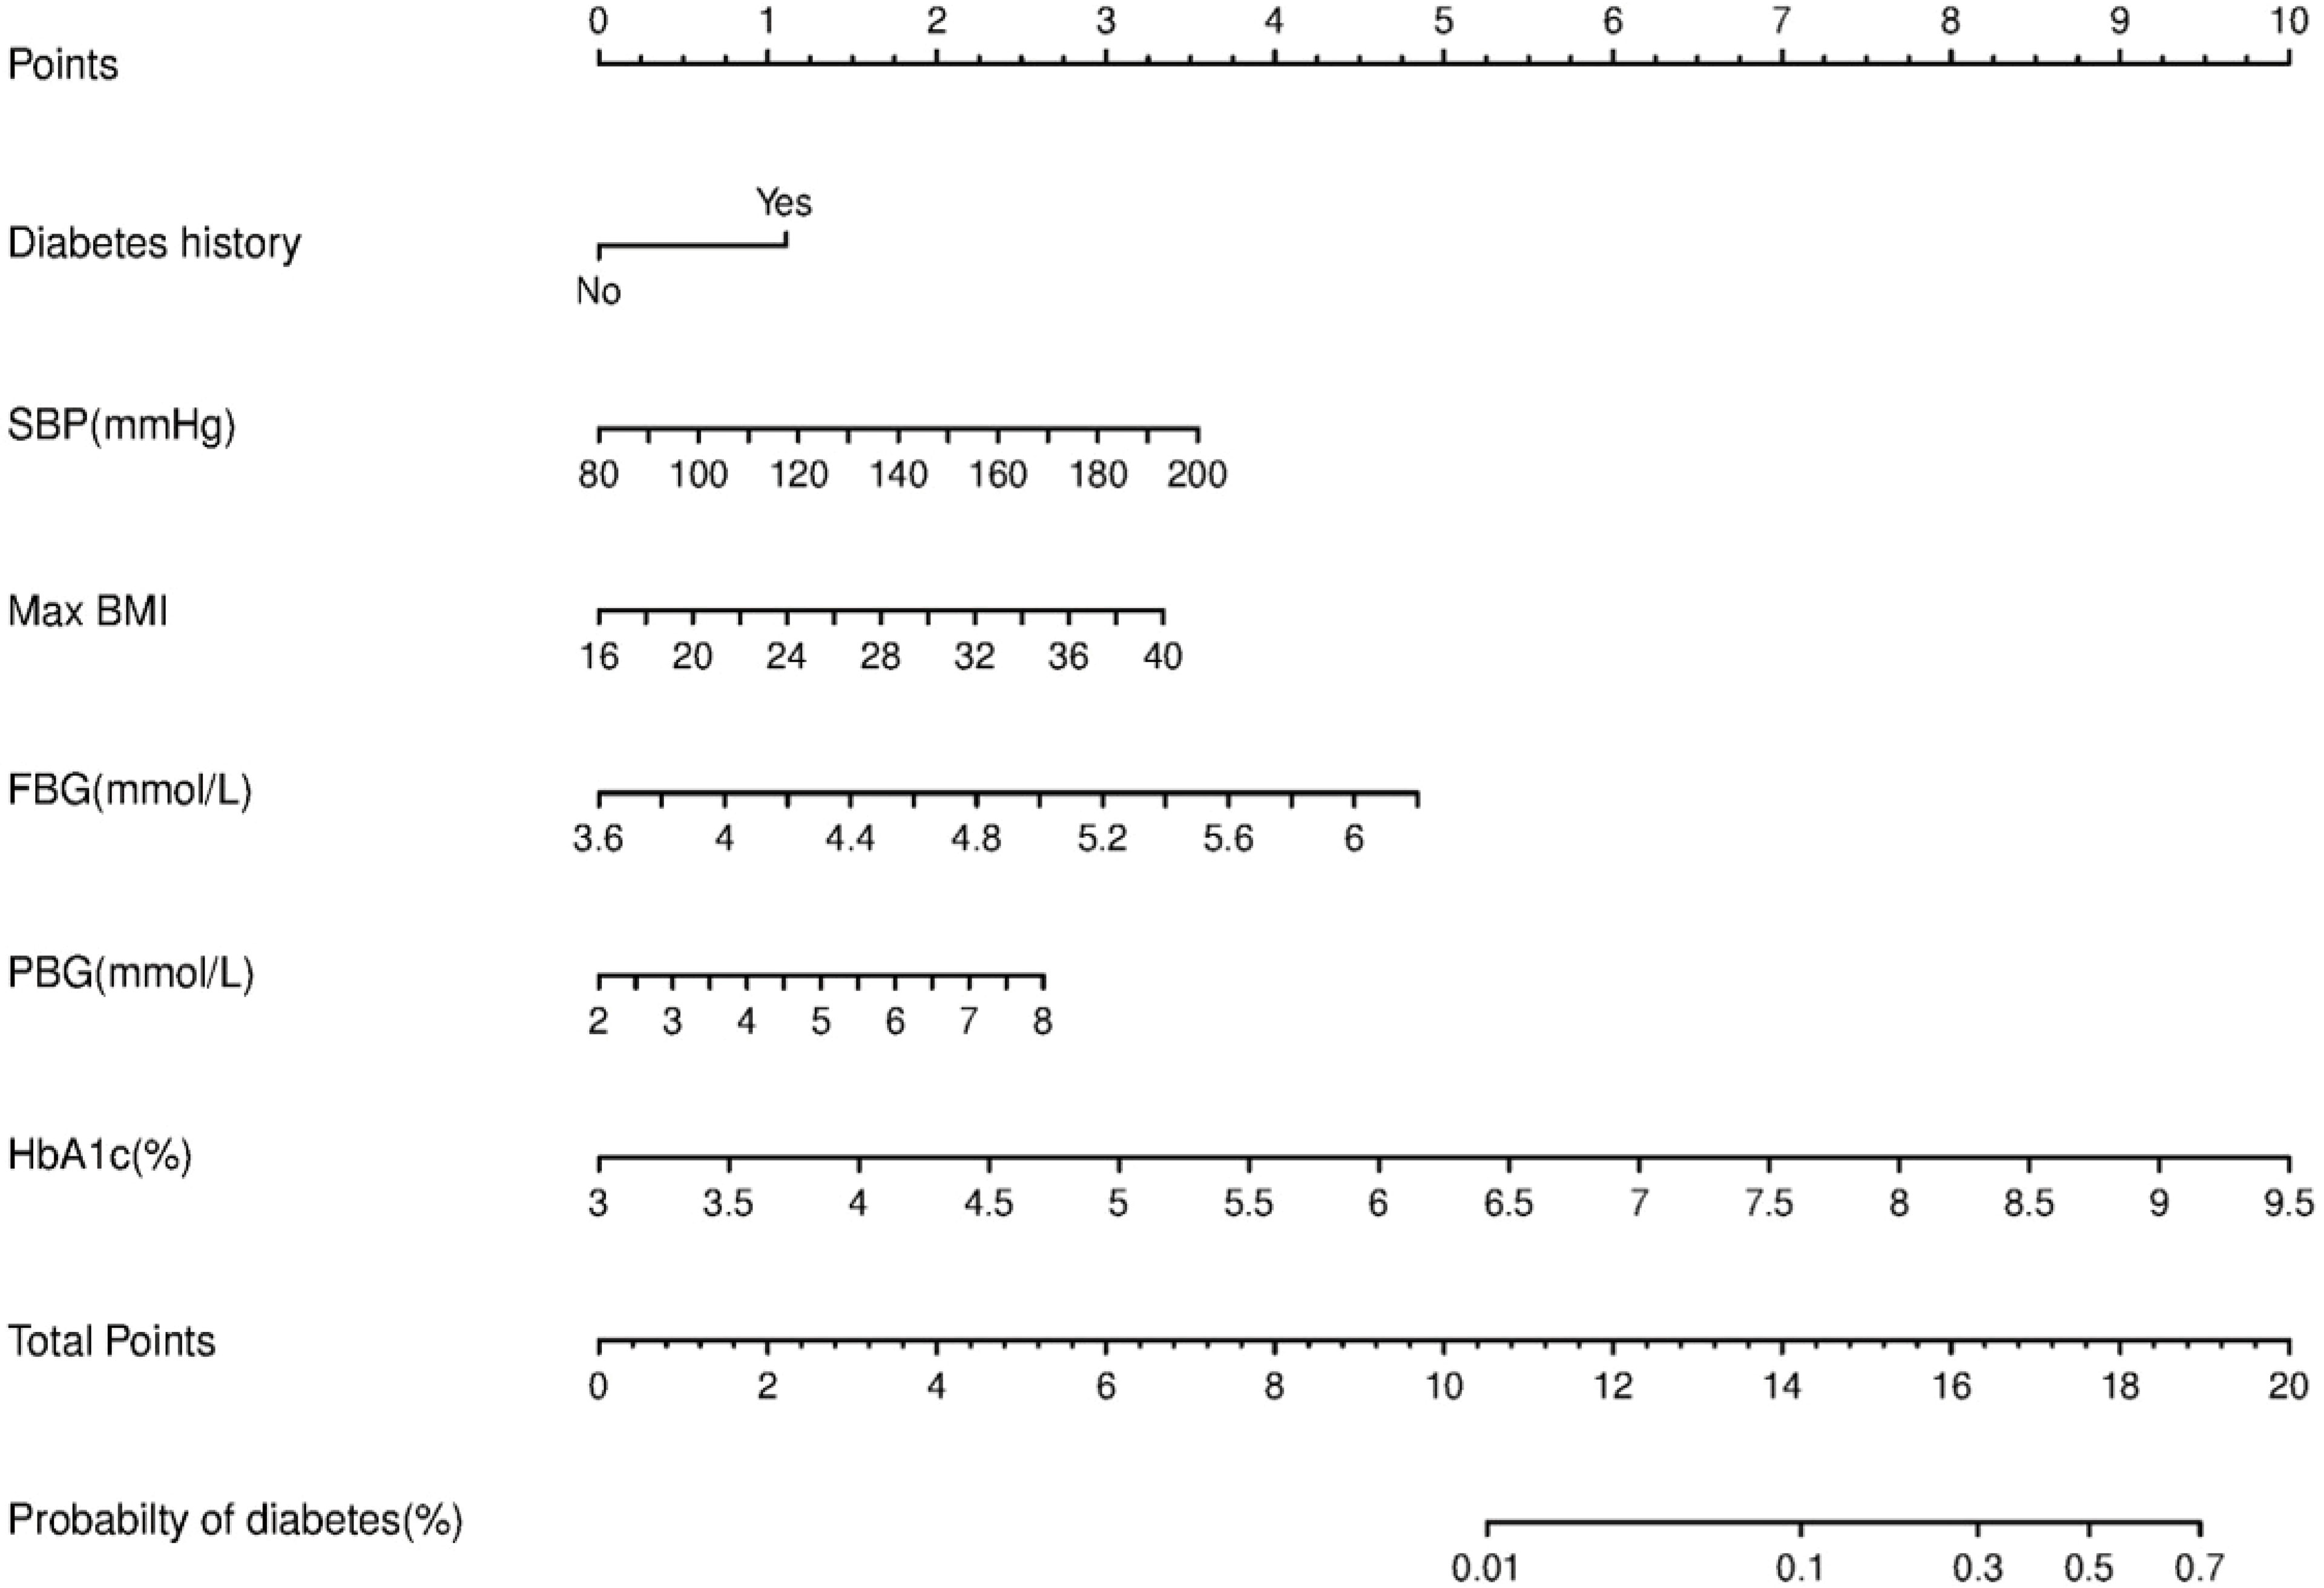
Figure 1 Nomogram predictive model for diabetes.
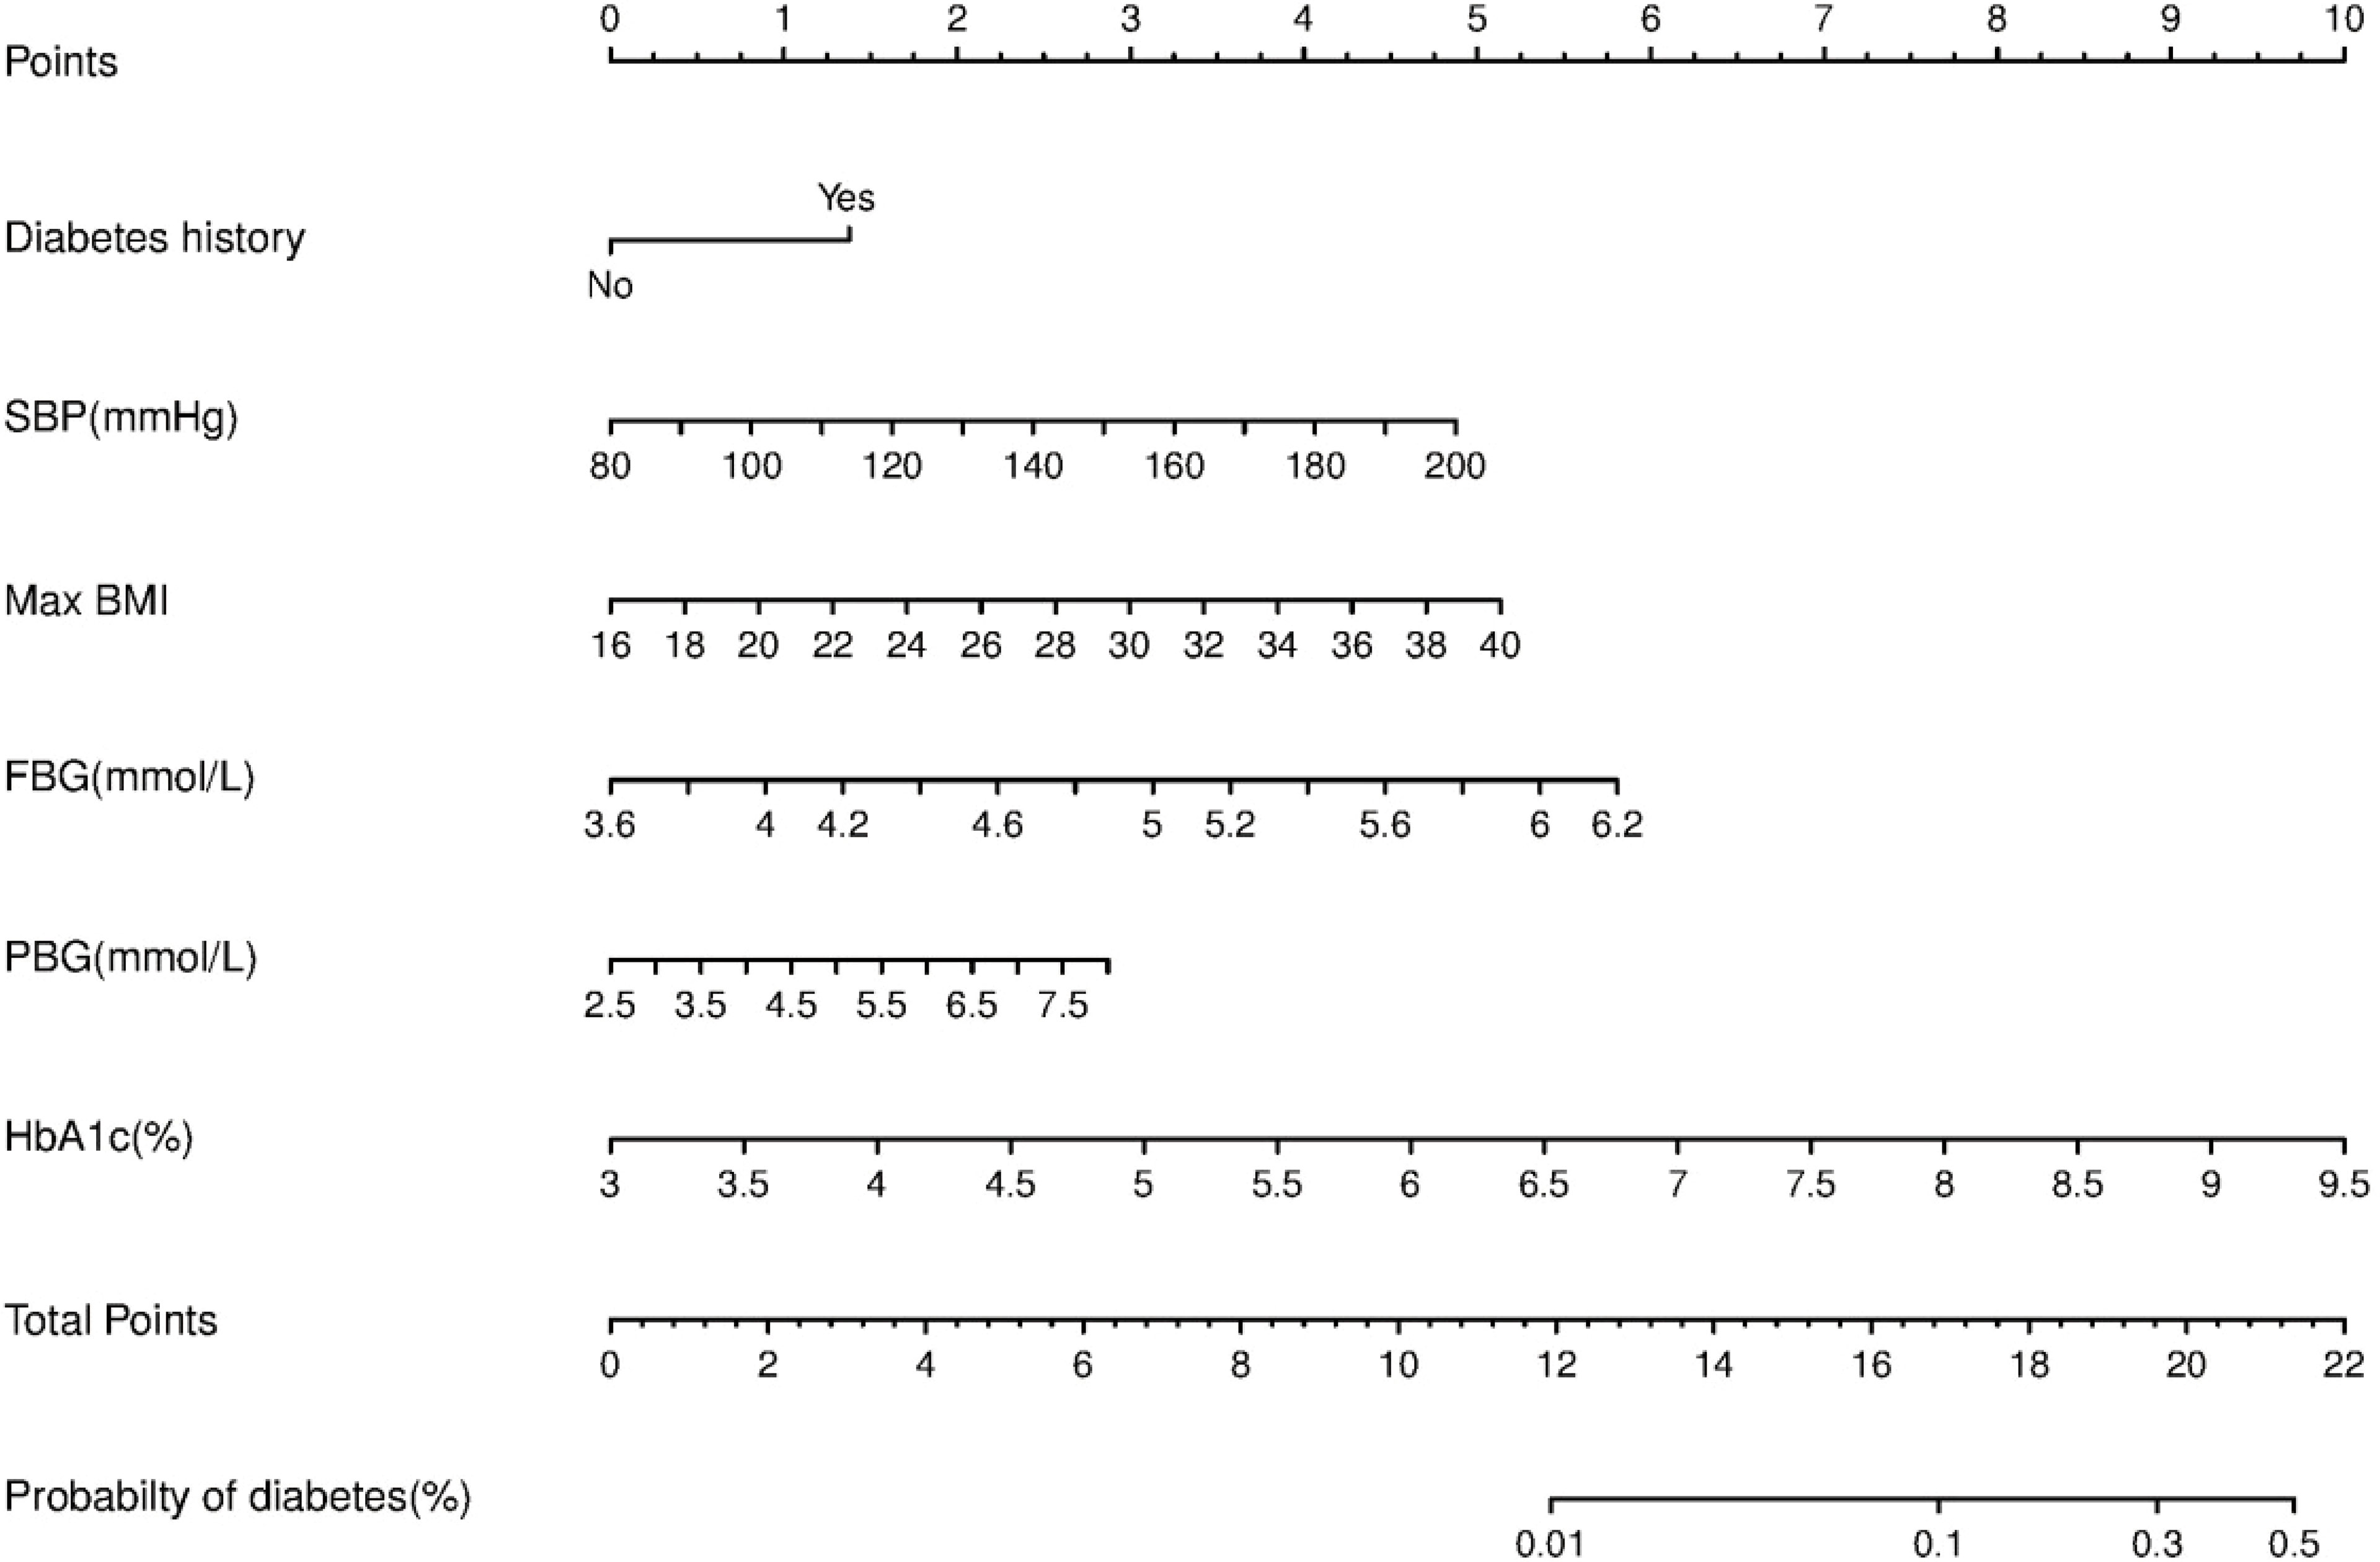
Figure 2 Nomogram predictive model for diabetes in females.
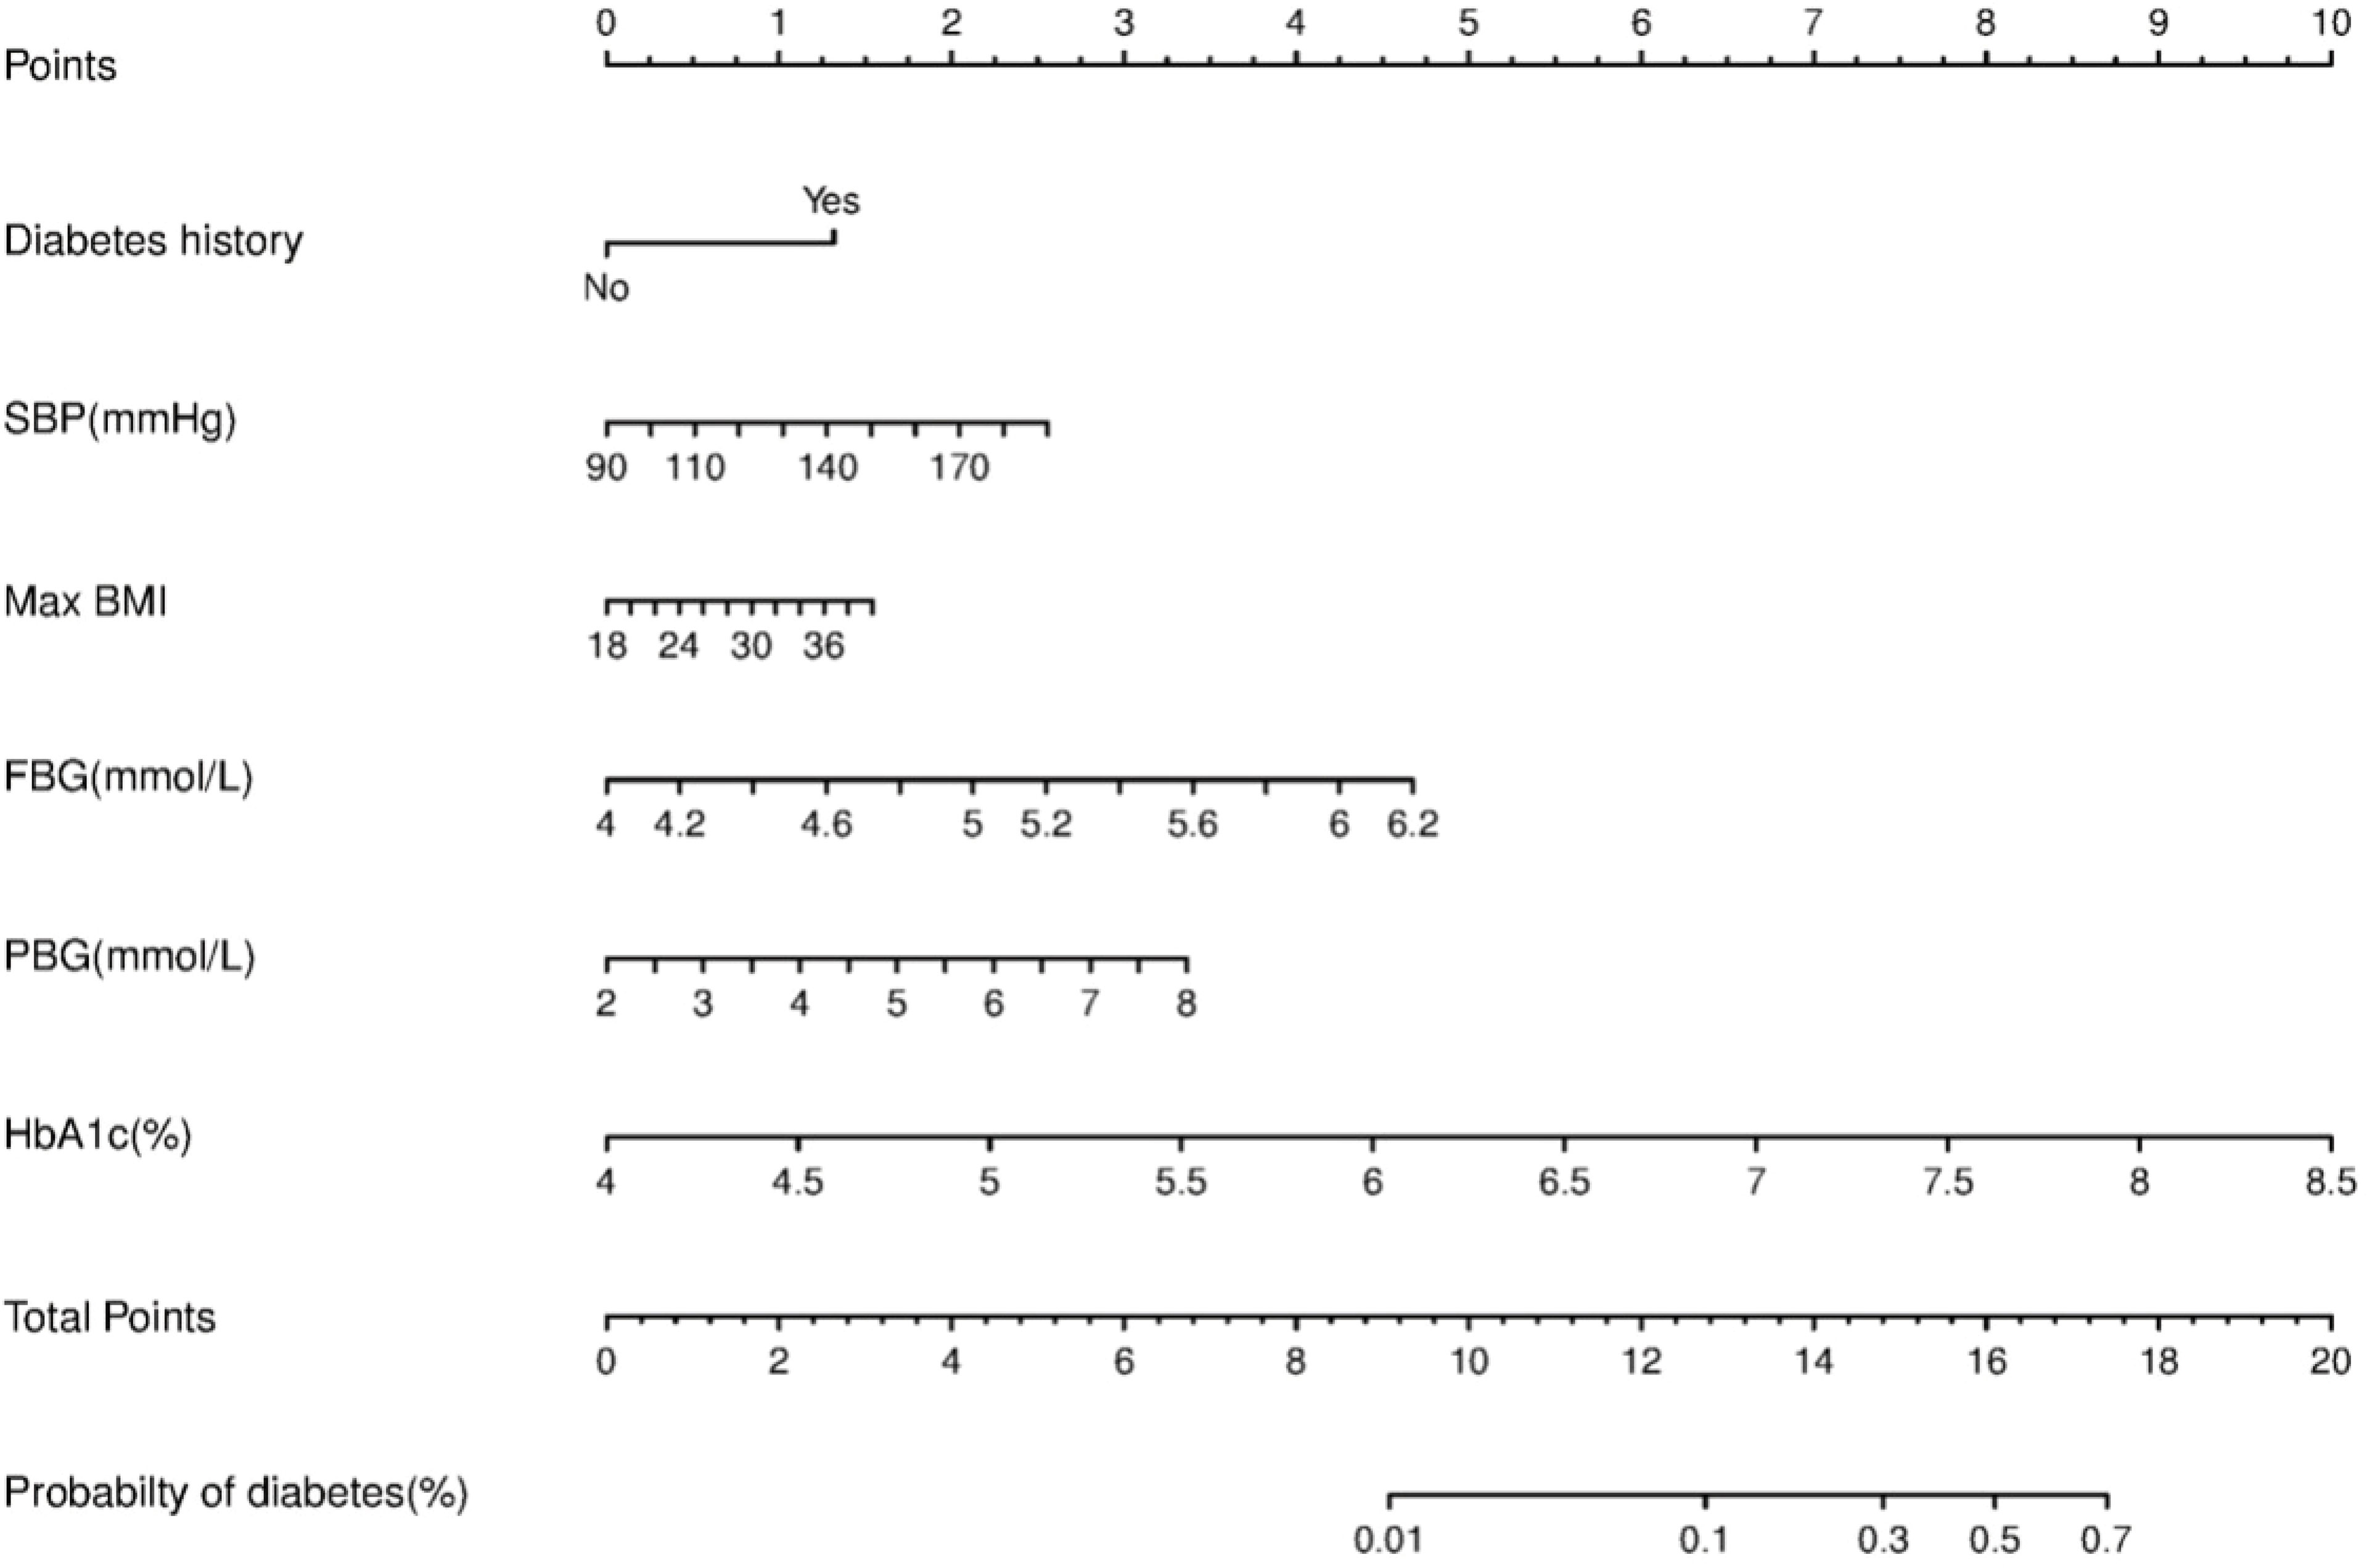
Figure 3 Nomogram predictive model for diabetes in males.
ROC curves and decision curve analysis (DCA) were used to verify the accuracy of the scoring system. The area under the curve (AUC) was 0.778 (95% CI: 0.733–0.823, P<0.001) in all individuals, 0.813 (95% CI: 0.738-0.889, P<0.001) in males and 0.759 (95% CI: 0.701-0.817, P<0.001) in females. DCA was used to evaluate the discriminative ability of the nomogram. The vertical axis is the net benefit (NB), and the horizontal coordinate axis X is the threshold probability. The solid black line was complete nonintervention (None) with an NB of zero. The gray dotted line indicates complete intervention (All). The results of DCA indicated that the predictive model achieved a greater NB than the None or All models (data not shown).
Our study of Chinese individuals demonstrated that obesity defined by BMImax was positively related to the risk of progression to diabetes, especially for females. BMImax, could be regarded as an independent predictor in the screening and prevention of diabetes in high-risk populations. To our knowledge, this is the first study to explore the association between the historical BMImax and the risk of diabetes in a Chinese population.
The relationship between obesity and diabetes has been reported in several previous studies. Most of the research focused on body weight or body weight change at a certain time point during the research period. Few studies have evaluated the effect of highest lifetime BMI on the progression of diabetes. In 2014, Yoshizawa examined current BMI and BMI history as screening indicators for diabetes. In that study, individuals in the highest tertile of BMImax (≥26.09 kg/m2 in men and ≥24.27 kg/m2 in women) had a significantly higher risk for diabetes than those in the lowest tertile (18). Recently, a study from Japan investigated the clinical significance of BMImax before the onset of type 2 diabetes for predicting pancreatic beta cell function. They found that BMImax was an independent factor indicating beta cell function and could predict insulin secretion capacity at diagnosis. However, it did not affect the rate of decrease in islet secretion function after a diagnosis of diabetes (13). Several fundamental studies have also explored the close link between obesity and T2DM. In 2014, Mallafre reported that signaling of glucose-dependent insulinotropic peptide (GIP) and its receptor (GIPR) played key roles in the pathogenesis of obesity and its associated insulin resistance. GIP has important metabolic actions other than its physiological glucose-dependent incretin effect. Particularly in human adipose tissue, GIP might act as an insulin sensitizer and an anti-inflammatory factor. Insulin-resistant states related to obesity might be associated with diminished GIP sensitivity, and GIPR expression in human adipose tissue might determine systemic insulin sensitivity (19). Recently, a study provided compelling evidence showing that an inverse correlation between increasing body mass index and decreasing insulin receptor expression in visceral adipose tissue. Visceral adipose tissue-specific downregulation of the insulin receptor was found to be an early event in obesity-related adipose cell dysfunction, which increases systemic insulin resistance in obese humans (20). As insulin resistance and beta cell dysfunction were found to be the main pathogenic mechanisms of T2DM, both of these effects caused by the highest lifetime BMI might influence the progression of diabetes.
Our study suggested that the association between BMImax and diabetes is sex-specific, in accordance with previous research. A study published in PLOS Genetics revealed sex differences in the effect of obesity traits on the risk of type 2 diabetes—a higher BMI led to a higher risk of type 2 diabetes in women than in men. In addition, Logue reported that the mean BMI closest to the date of diagnosis of type 2 diabetes was 31.83 kg/m2 in men and 33.69 kg/m2 in women, so the inverse relationship between BMI and type 2 diabetes was significantly steeper in women than in men (21). A study published in Diabetologia noted the effect of historical weight on glucose metabolism in women. This study was designed to explore the association of the duration of obesity and cumulative exposure with disease. The results indicated that age at onset of obesity was negatively associated with type 2 diabetes in a cohort of women aged 18-23 years at baseline, and the duration of obesity was positively related to type 2 diabetes (22). In contrast, according to the report of Yutaka, the effect of BMI on diabetes in men and women might be related to genetic susceptibility. The authors analyzed the correlations of single-nucleotide polymorphisms (SNPs) of the FTO gene, current BMI, BMImax and type 2 diabetes, and found that SNPs within FTO influence the development of type 2 diabetes by acting on BMImax. However, the result was not obvious in women (23). The researchers attributed the sex-specific effect to the differences in fat distribution and/or physical activity between men and women, which might influence the effects of FTO variants on obesity/adiposity. However, that study was a cross-sectional study with a small sample. The differences in the metabolic effects of obesity between different sexes might be related to estrogen. The ventromedial hypothalamus plays chief roles in regulating energy and glucose homeostasis and is sexually dimorphic. Research has reported the sex-specific role of GLUR5 in regulating the firing rate, intrinsic excitability, and excitatory and inhibitory transmission in ventromedial hypothalamic (VMH) SF1 neurons in female mice, facilitating glycemic control and lipid metabolism. Furthermore, the study also found that intact mGluR5 function in SF1 neurons is required for estrogen to achieve its positive effects on VMH neuronal activity and glucose homeostasis (22).
In addition to BMImax, our results suggested that fasting plasma glucose, 2 h postload glucose and HbA1c could predict the risk of diabetes. However, the correlation among fasting plasma glucose, HbA1c and diabetes was much stronger than that among 2 h postload glucose. In line with our results, two cohort studies proposed the predictive value of fasting glucose and HbA1c. Yoriko suggested that an HbA1c of 5.7%-6.4% could be regarded as an indicator of diabetes, with a value similar to that of fasting glucose. The two tests used together could efficiently target people who are most likely to develop diabetes (24). Heianza’s research reported that the combination of an HbA1c of 5.7%-6.4% and a fasting glucose of 5.6-6.9 mmol/l had the best performance in reducing the likelihood of missing future cases of diabetes. An HbA1c of 6.0%-6.4% and a fasting glucose of 6.1-6.9 mmol/l could be used to screen for diabetes among prediabetic individuals (24). As glucose tolerance tests are not generally conducted during routine medical examinations, fasting glucose combined with HbA1c, which could reflect chronic hyperglycemia and better evaluate the potential risk of impaired glucose regulation.
Nomograms provided a statistical predictive model that includes simple scores of different clinical indicators in a visual and quantitative way and have been widely used in the evaluation of the risk and possibility of specific diseases or clinical events. Considering that factors associated with diabetes vary by sex, we made separate predictive models for males and females. The variables included in the nomograms were accessible in clinic and could provide a reference for clinicians to assess the risk of diabetes for different patients, facilitating individualized clinical management. In our study, HbA1c, followed by fasting glucose, was the most effective predictor among both men and women. BMImax and postload glucose ranked next in effectiveness. Consistent with a recently published study in a Chinese population, HbA1c could improve the performance of nomograms for predicting the 5-year incidence of type 2 diabetes (25). Although we innovatively incorporated BMImax into the predictive model, the efficacy of the nomogram assessed by the ROC curve was moderate, which might be related to the following factors. The effect of obesity on the prevalence of diabetes might be exerted in several ways, for example, fluctuations in weight, highest weight in adulthood, or even the duration. The predictive model developed in this study explored only the effect of historical highest BMI on the risk of developing diabetes. If we could have included more obesity-related factors, such as those mentioned above, a more comprehensive analysis of the effect of body weight on glucose metabolism might have been possible. In addition, the 92 patients who developed diabetes in this study did not include patients with reduced glucose tolerance and impaired fasting glucose regulation, thus failing to mention the effect of maximum body weight on prediabetes.
Our study focused on the correlation between BMImax and diabetes. Several limitations should be considered in this study. First, the definitive types of diabetes were not clear due to unavailable clinical evidence, including diabetes-associated autoantibodies. We hypothesized that our conclusions could be extended to individuals with type 2 diabetes. Second, lifetime BMImax before the onset of diabetes was self-reported and inevitably had a certain recall bias. Further studies should be conducted to confirm these findings with actual measurements of body weight and height. To preliminarily investigate whether recall bias might affect the findings of our study, we divided the subjects into two groups according to the time of BMImax. One group of subjects reached maximum weight at baseline. Subjects in the second group reached their maximum weight before the onset of the study, and thus BMImax was obtained by self-report. We found a correlation between BMImax and diabetes in both groups.
In conclusion, obesity defined by lifetime BMImax has an obvious association with the risk of diabetes in Chinese individuals over 40 years old, especially women. Given the ongoing increases in the prevalence of diabetes and obesity, a better understanding of the effect of obesity is certainly needed to improve the prevention and management of diabetes and diabetes-related complications.
The original contributions presented in the study are included in the article/supplementary material. Further inquiries can be directed to the corresponding authors.
The studies involving human participants were reviewed and approved by Clinical Research Ethics Committee of the people’s Liberation Army General Hospital. The patients/participants provided their written informed consent to participate in this study.
XJ, AW and ZL designed the study. XJ, AW, LY, YC, YW collected and analysed the data. JB, JD, YM and DZ contributed samples for this study and provided intellectual input. XJ drafted and wrote the manuscript. AW, DZ and ZL performed critical revisions to the manuscript. All authors contributed to the article and approved the submitted version.
This work was supported by a grant from the National Key Research and Development Program of China (2018YFC1314100).
The authors declare that the research was conducted in the absence of any commercial or financial relationships that could be construed as a potential conflict of interest.
All claims expressed in this article are solely those of the authors and do not necessarily represent those of their affiliated organizations, or those of the publisher, the editors and the reviewers. Any product that may be evaluated in this article, or claim that may be made by its manufacturer, is not guaranteed or endorsed by the publisher.
1. Wang L, Gao P, Zhang M, Huang Z, Zhang D, Deng Q, et al. Prevalence and Ethnic Pattern of Diabetes and Prediabetes in China in 2013. J Am Med Assoc (2017) 317(24):2515–23. doi: 10.1001/jama.2017.7596
2. Yang W, Lu J, Weng J, Jia W, Ji L, Xiao J, et al. Prevalence of Diabetes Among Men and Women in China. N Engl J Med (2010) 362(12):1090–101. doi: 10.1056/nejmoa0908292
3. Wang H, Du S, Zhai F, Popkin BM. Trends in the Distribution of Body Mass Index Among Chinese Adults, Aged 20-45 Years (1989-2000). Int J Obes (2007) 31(2):272–8. doi: 10.1038/sj.ijo.0803416
4. Ning F, Zhang D, Xue B, Zhang L, Zhang J, Zhu Z, et al. Synergistic Effects of Depression and Obesity on Type 2 Diabetes Incidence in Chinese Adults. J Diabetes (2020) 12(2):142–50. doi: 10.1111/1753-0407.12968
5. Power C, Thomas C. Changes in BMI, Duration of Overweight and Obesity, and Glucose Metabolism: 45 Years of Follow-Up of a Birth Cohort. Diabetes Care (2011) 34(9):1986–91. doi: 10.2337/dc10-1482
6. Bray GA. Medical Consequences of Obesity. J Clin Endocrinol Metab (2004) 89(6):2583–9. doi: 10.1210/jc.2004-0535
7. Wong RJ, Chou C, Sinha SR, Kamal A, Ahmed A. Ethnic Disparities in the Association of Body Mass Index With the Risk of Hypertension and Diabetes. J Community Health (2014) 39(3):437–45. doi: 10.1007/s10900-013-9792-8
8. Wang T, Lu J, Shi L, Chen G, Xu M, Xu Y, et al. Association of Insulin Resistance and β-Cell Dysfunction With Incident Diabetes Among Adults in China: A Nationwide, Population-Based, Prospective Cohort Study. Lancet Diabetes Endocrinol (2020) 8(2):115–24. doi: 10.1016/S2213-8587(19)30425-5
9. Brancati FL, Wang NY, Mead LA, Liang KY, Klag MJ. Body Weight Patterns From 20 to 49 Years of Age and Subsequent Risk for Diabetes Mellitus: The Johns Hopkins Precursors Study. Arch Intern Med (1999) 159(9):957–63. doi: 10.1001/archinte.159.9.957
10. Wei W, Liu S-Y, Zeng F-F, Yao S-P, Zhang H-T, Wan G, et al. Type 2 Diabetes and Impaired Glucose Tolerance in North-China-Based Rural Community Adults. Public Health (2010) 124(10):593–601. doi: 10.1016/j.puhe.2010.05.014
11. Dale CE, Fatemifar G, Palmer TM, White J, Prieto-Merino D, Zabaneh D, et al. Causal Associations of Adiposity and Body Fat Distribution With Coronary Heart Disease, Stroke Subtypes, and Type 2 Diabetes Mellitus: A Mendelian Randomization Analysis. Circulation (2017) 135(24):2373–88. doi: 10.1161/CIRCULATIONAHA.116.026560
12. Emdin CA, Khera AV, Natarajan P, Klarin D, Zekavat SM, Hsiao AJ, et al. Genetic Association of Waist-To-Hip Ratio With Cardiometabolic Traits, Type 2 Diabetes, and Coronary Heart Disease. JAMA (2017) 317(6):626–34. doi: 10.1001/jama.2016.21042
13. Ozawa H, Fukui K, Komukai S, Hosokawa Y, Fujita Y, Kimura T, et al. Clinical Significance of the Maximum Body Mass Index Before Onset of Type 2 Diabetes for Predicting Beta-Cell Function. J Endocr Soc (2020) 4(4):1–13. doi: 10.1210/jendso/bvz023
14. Heianza Y, Kodama S, Arase Y, Hsieh S, Yoshizawa S, Tsuji H, et al. Role of Body Mass Index History in Predicting Risk of the Development of Hypertension in Japanese Individuals: Toranomon Hospital Health Management Center Study 18 (TOPICS 18). Hypertension (2014) 64(2):247–52. doi: 10.1161/HYPERTENSIONAHA.113.02918
15. Hashimoto Y, Hamaguchi M, Fukuda T, Nakamura N, Ohbora A, Kojima T, et al. BMI History and Risk of Incident Fatty Liver: A Population-Based Large-Scale Cohort Study. Eur J Gastroenterol Hepatol (2016) 28(10):1188–93. doi: 10.1097/MEG.0000000000000682
16. Wakasugi M, Narita I, Iseki K, Moriyama T, Yamagata K, Tsuruya K, et al. Weight Gain After 20 Years of Age Is Associated With Prevalence of Chronic Kidney Disease. Clin Exp Nephrol (2012) 16(2):259–68. doi: 10.1007/s10157-011-0565-3
17. Chei CL, Iso H, Yamagishi K, Inoue M, Tsugane S. Body Mass Index and Weight Change Since 20 Years of Age and Risk of Coronary Heart Disease Among Japanese: The Japan Public Health Center-Based Study. Int J Obes (Lond) (2008) 32(1):144–51. doi: 10.1038/sj.ijo.0803686
18. Yoshizawa S, Heianza Y, Arase Y, Saito K, Hsieh S, Tsuji H, et al. Comparison of Different Aspects of BMI History to Identify Undiagnosed Diabetes in Japanese Men and Women: Toranomon Hospital Health Management Center Study 12 (TOPICS 12). Diabetes Med (2014) 31(11):1378–86. doi: 10.1111/dme.12471
19. Ceperuelo-Mallafré V, Duran X, Pachón G, Roche K, Garrido-Sánchez L, Vilarrasa N, et al. Disruption of GIP/GIPR Axis in Human Adipose Tissue Is Linked to Obesity and Insulin Resistance. J Clin Endocrinol Metab (2014) 99(5):908–19. doi: 10.1210/jc.2013-3350
20. Arcidiacono B, Chiefari E, Foryst-Ludwig A, Currò G, Navarra G, Brunetti F, et al. Obesity-Related Hypoxia via miR-128 Decreases Insulin-Receptor Expression in Human and Mouse Adipose Tissue Promoting Systemic Insulin Resistance. E Bio Medicine (2020) 59:102912. doi: 10.1016/j.ebiom.2020.102912
21. Logue J, Walker JJ, Colhoun H, Leese GP, Lindsay RS, McKnight JA, et al. Europe PMC Funders Group. Do Men Develop Type 2 Diabetes at Lower Body Mass Indices Than Women? Diabetologia (2011) 54(12):3003–6. doi: 10.1007/s00125-011-2313-3
22. Fagan MP, Ameroso D, Meng A, Rock A, Maguire J, Rios M. Essential and Sex-Specific Effects of Mglur5 in Ventromedial Hypothalamus Regulating Estrogen Signaling and Glucose Balance. Proc Natl Acad Sci U S A (2020) 117(32):19566–77. doi: 10.1073/pnas.2011228117
23. Kamura Y, Iwata M, Maeda S, Shinmura S, Koshimizu Y, Konoki H, et al. FTO Gene Polymorphism is Associated With Type 2 Diabetes Through Its Effect on Increasing the Maximum BMI in Japanese Men. PloS One (2016) 11(11):1–13. doi: 10.1371/journal.pone.0165523
24. Heianza Y, Hara S, Arase Y, Saito K, Fujiwara K, Tsuji H, et al. HbA1c 5·7-6·4 and Impaired Fasting Plasma Glucose for Diagnosis of Prediabetes and Risk of Progression to Diabetes in Japan (TOPICS 3): A Longitudinal Cohort Study. Lancet (2011) 378(9786):147–55. doi: 10.1016/S0140-6736(11)60472-8
Keywords: maximum body mass index, obesity, mellitus, type 2 diabetes mellitus, predictive model, Beijing
Citation: Jia X, Wang A, Yang L, Cheng Y, Wang Y, Ba J, Dou J, Mu Y, Zhao D and Lyu Z (2022) Clinical Significance of Lifetime Maximum Body Mass Index in Predicting the Development of T2DM: A Prospective Study in Beijing. Front. Endocrinol. 13:839195. doi: 10.3389/fendo.2022.839195
Received: 19 December 2021; Accepted: 12 April 2022;
Published: 02 June 2022.
Edited by:
Jeff M. P. Holly, University of Bristol, United KingdomReviewed by:
Eusebio Chiefari, University Magna Graecia of Catanzaro, ItalyCopyright © 2022 Jia, Wang, Yang, Cheng, Wang, Ba, Dou, Mu, Zhao and Lyu. This is an open-access article distributed under the terms of the Creative Commons Attribution License (CC BY). The use, distribution or reproduction in other forums is permitted, provided the original author(s) and the copyright owner(s) are credited and that the original publication in this journal is cited, in accordance with accepted academic practice. No use, distribution or reproduction is permitted which does not comply with these terms.
*Correspondence: Dong Zhao, emhhb2RvbmdAY2NtdS5lZHUuY24=; Zhaohui Lyu, bWV0YWJvbGlzbTMwMUAxMjYuY29t
†These authors have contributed equally to this work
Disclaimer: All claims expressed in this article are solely those of the authors and do not necessarily represent those of their affiliated organizations, or those of the publisher, the editors and the reviewers. Any product that may be evaluated in this article or claim that may be made by its manufacturer is not guaranteed or endorsed by the publisher.
Research integrity at Frontiers
Learn more about the work of our research integrity team to safeguard the quality of each article we publish.