 Talha Mahboob Alam
 George Adrian Stoica
 Kshitij Sharma
 Özlem Özgöbek
94% of researchers rate our articles as excellent or good
Learn more about the work of our research integrity team to safeguard the quality of each article we publish.
Find out more
REVIEW article
Front. Educ., 25 February 2025
Sec. Digital Learning Innovations
Volume 10 - 2025 | https://doi.org/10.3389/feduc.2025.1533588
This article is part of the Research TopicEmerging Technologies and Digital Innovations: Recent Research and Practices in Technology-enhanced Learning EnvironmentsView all 11 articles
Introduction: Digital technologies are widely integrated with teaching and learning, and examining these technological interventions in the classrooms has become an active research area. Existing reviews are often constrained, relying on qualitative methods like meta-analysis, scoping review, or systematic review, which tend to cover a limited number of studies. We conducted a bibliometric analysis of 1,128 articles published between 2014 and 2023 from the Web of Science database to provide a comprehensive overview of this field.
Methods: This study used Biblioshiny and VOSviewer tools to perform performance analysis and scientific mapping. In this study, performance analysis was performed, including descriptive statistics, publication trends, and identification of key actors. Furthermore, scientific mapping has also been done to visualize the prevalent structural aspects and hot research topics to observe the evolving dynamics over the past 10 years.
Results: The findings indicate a significant rise in publications over the past decade, with an annual growth of 21.5 per cent. We identified prolific authors, institutions, journals, countries, articles, and keywords that encapsulate the domain of digital technologies in the classrooms. The prospective challenges were also identified, including a need for a more technology-driven culture, limited teacher assistance, user interface design issues, proper training, and a technological divide.
Discussion: The findings could encourage the use of digital technologies in the classrooms and offer insights for policymakers to (re)allocate resources. Furthermore, this work is valuable for informing scholars and practitioners about the current state of research, helping them to identify and focus on trending topics when deciding which areas to explore.
According to the United Nations Educational, Scientific and Cultural Organization (UNESCO), education’s primary objective is to focus on holistic development, sustainability, and inclusive education and prepare upcoming generations for the digital era (UNESCO, 2021). Digital technologies encompass computers, internet-based applications, and devices like video cameras, smartphones, and personal digital assistants (Ertmer, 1999). It significantly enhanced various aspects of education, i.e., reshaped traditional teaching methods (Okoye et al., 2023), increased accessibility (Moon and Hofferth, 2018), and enhanced the learning experience for students worldwide (Cohen et al., 2022). To address the requirements of diverse learners and maintain their competitiveness in the global education market, many academic institutions and universities use cutting-edge technology-based teaching strategies inside and outside the classroom (Haleem et al., 2022; Torres-Ruiz and Moreno-Ibarra, 2019). The utilization of digital technologies and their interactive features have gained scholarly attention for their potential to enhance pedagogical and learning functions (Bourbour, 2023). These digital technologies facilitated remote communication between teachers and students in diverse classroom settings, extending beyond traditional learning (Kumi-Yeboah et al., 2020). Conversely, conventional classroom teaching methods need more immediacy, rapid assessment, and high engagement (Ertmer, 2005), but digital technologies have addressed these shortcomings effectively (Okoye et al., 2023). Despite several advantages of digital technologies in education, various challenges such as the digital divide (Moon and Hofferth, 2018), distraction (Forsler and Guyard, 2023), overdependence during lectures (Torres-Ruiz and Moreno-Ibarra, 2019), decreased social interaction, excessive screen time, reduced attention span (Forsler and Guyard, 2023), teacher training (Okoye et al., 2023), and content quality (Torres-Ruiz and Moreno-Ibarra, 2019) exists. The adoption of digital technologies in classroom settings has significantly increased over the last two decades (Harju et al., 2019). Several governments, i.e., the United Kingdom (UK), the United States of America (USA), and China, have considerably financed digital technologies within classrooms to improve learning outcomes (Luo et al., 2021; Banks and Williams, 2022). A survey conducted in 368 European higher education institutions comprising 48 countries pointed out that technology-enhanced learning has significantly impacted student engagement, enhanced teaching effectiveness, and increased flexibility in course delivery as significant benefits (Zhu, 2019). Each year in the UK, schools spend £470 million, and colleges spend £140 million to support the integration of digital tools in classrooms. The Flexible Learning Fund, with £11 million, was also established for innovative approaches to adult education through blended or online learning (Britain, 2019). Similarly, China’s “Education Modernization 2035” policy established significant investments in digital education, such as establishing a modern education governance system by deepening comprehensive educational reform, fully utilizing digital technologies and mechanisms, expanding internet access in rural schools, and promoting digital textbooks and online learning platforms (Zhu, 2019). This increased governmental attraction and capital spending in digital technologies, paired with education, have led to rapid advancements, shown by a growing research community and a rise in scholarly publications (Major et al., 2018). Despite these advancements, the challenges in traditional educational practices persist.
It is crucial to understand how digital technologies shape the educational landscape and how they address or exacerbate existing issues. A significant demand exists for synthesizing the current research within digital technologies in the classroom (Major et al., 2018), offering a concise overview of existing literature. Existing comprehensive reviews in the field are often constrained, relying on qualitative methods like meta-analysis (Forsler and Guyard, 2023), scoping review (Major et al., 2018), or systematic review (Bathla et al., 2023; Aytekin et al., 2022), which tend to cover a limited number of studies and concentrate on specific research outcomes and themes. However, these methods prioritized analyzing individual research evidence and thematic patterns over delivering a quantitative evaluation of the entire research landscape (Haleem et al., 2022). An effective way for quantitative assessment of the overall research landscape is to use bibliometric analysis to track academic trends (Tsay and Yang, 2005). Due to the large number of publications in this interdisciplinary domain, it is crucial to analyze trends, evaluate research impact, and guide policy decisions. According to Zupic and Čater (2015), bibliometrics helps to examine how disciplines have changed over time based on their conceptual, social, and intellectual structures. Bibliometrics makes research retrospectives easier and may also be used to explore research hotspots and discipline-specific development trends objectively and scientifically (Tsay and Yang, 2005; Van Eck and Waltman, 2014). On the one hand, it makes it possible to evaluate the progress that has been made, identifies the most reliable and well-liked sources of scientific publications, honors prominent actors in the field, including authors and institutions, establishes the intellectual framework for evaluating recent developments (Aria and Cuccurullo, 2017), recognizes new areas of research interest, and forecasts the success of future studies (Ellegaard and Wallin, 2015). However, it also assists researchers in identifying suitable research institutions of collaboration, and possible co-authors (Zupic and Čater, 2015; Aria and Cuccurullo, 2017).
Currently, many studies employ bibliometric analysis focused on specific avenues rather than broader topics, i.e., 25 years of research in the Journal of Special Education Technology (Sinha et al., 2023), or three decades of research in Interactive Learning Environments Journal (Mostafa, 2023) etc. Some critical areas of focus for bibliometric studies were global research on emerging digital technology (Herlina et al., 2025), digital technology for sustainable development goals (Bathla et al., 2023), the intersection of Islam and digital technology (Wahid, 2024), and unified theory of acceptance and use of technology for mobile learning adoption (Aytekin et al., 2022). However, few bibliometric studies have specifically highlighted research in education. These studies generally focus on bibliometric analysis in specific areas, such as topic evolution in education research (Huang et al., 2020), smart education (Li and Wong, 2022), physical education (Gazali and Saad, 2023), technology for classroom dialogue (Hao et al., 2020), e-learning (Djeki et al., 2022), and construction education (Aliu and Aigbavboa, 2023). Our research aims to fill this gap by conducting a bibliometric analysis to provide a comprehensive overview of the scattered literature on digital technologies in education while offering insights for future research.
To accomplish the goal of this study, a bibliometric analysis is performed to encounter the following research questions:
RQ1: What are the global trends, distribution of the major actors, and research landscape in the interdisciplinary research area of digital technologies and classrooms in the last 10 years?
RQ2: What are the prevalent structural aspects and hot research topics in digital technologies in classrooms over the last 10 years?
The rest of this study is organized as follows. Section 2 outlines the materials and methods, emphasizing article selection through a search query, tools for data analysis, and methodology used to perform the bibliometric analysis. Section 3 presents the findings of the analysis. Section 4 highlights key contributions and suggests future research directions in the field. Lastly, section 5 concludes the study with possible future work.
This study utilized bibliometric analysis to measure the influence of scientific publications and the extent of knowledge dissemination using statistical methods (Van Eck and Waltman, 2014; Zupic and Čater, 2015). We have collected a relatively large number of articles to extract the related information for data analysis. Subsequently, a quantitative study was conducted using performance analysis and scientific mapping. The research design of our study is presented in Figure 1.
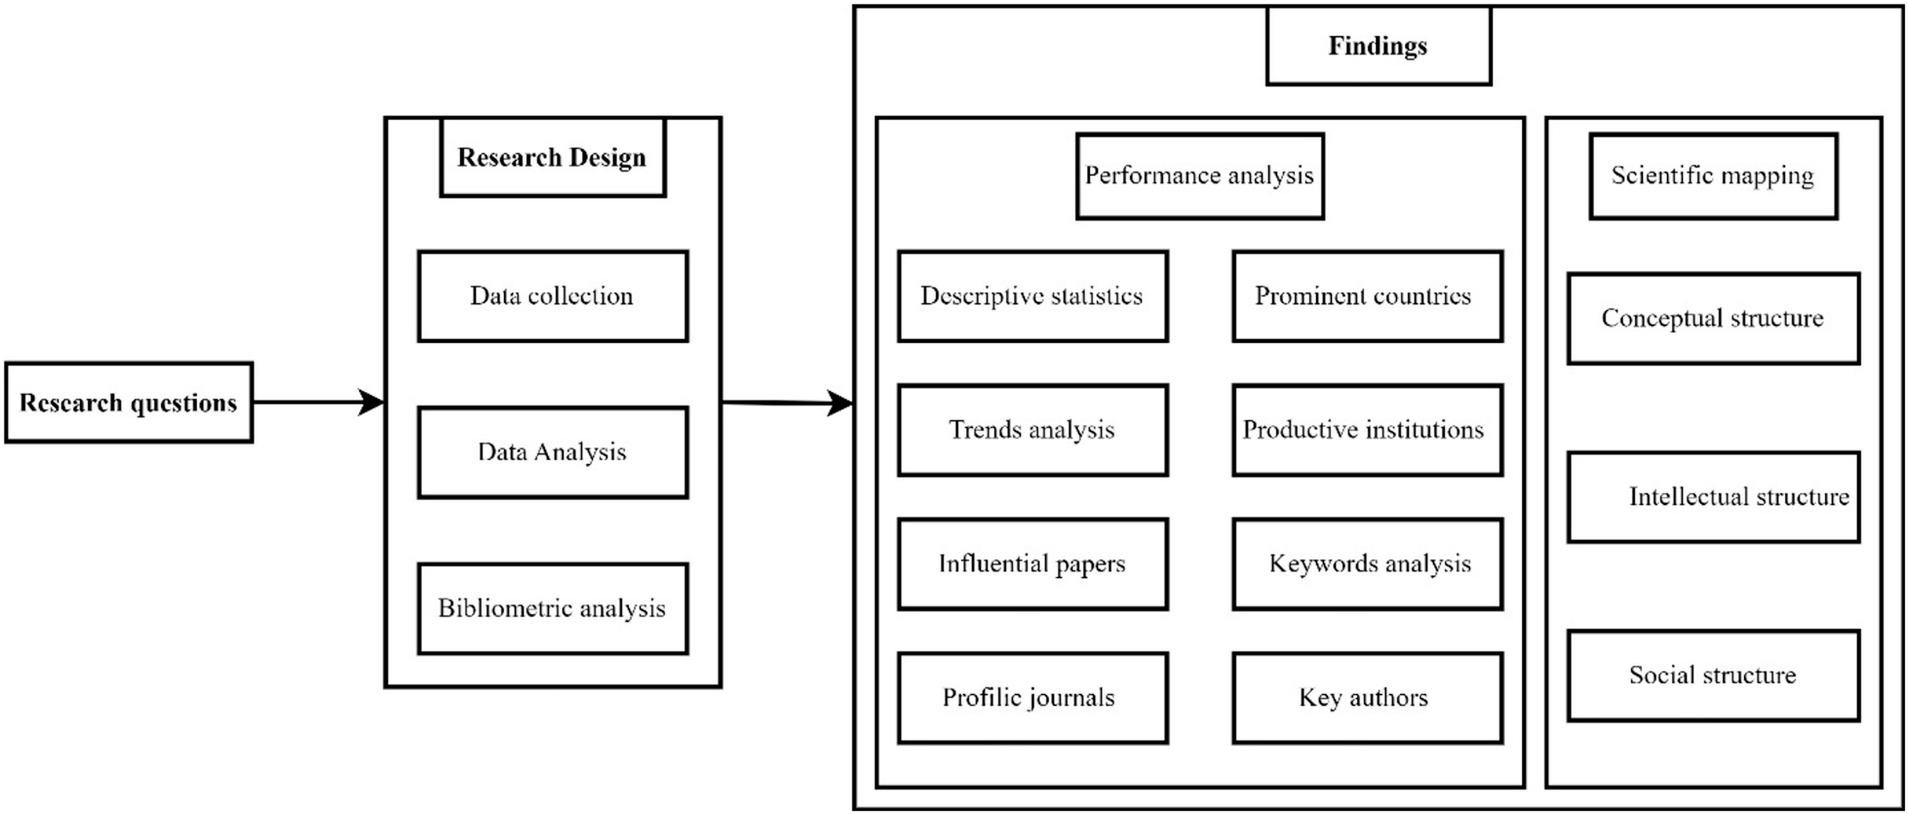
Figure 1. The research design of our study.
The primary step in conducting a bibliometric analysis involves gathering raw data to obtain essential article metadata, such as authors, affiliations, abstracts, keywords, references, citation counts (CC), etc. (Noyons et al., 1999). The two vital bibliometric databases, Web of Science (WoS) and Scopus have vast academic literature collections. Google Scholar has also been popular but unsuitable for bibliometric analysis due to inconsistent data, lack of controlled indexing, inflated citation counts, limited advanced metrics, and difficulty exporting structured data (Roldan-Valadez et al., 2019). WoS contains over 15,000 journals and 90 million documents, and Scopus indexes more than 20,000 sources, totalling about 69 million records. This research selected WoS Core Collection for its superior quality standards compared to Scopus. This choice aims to minimize the occurrence of false positive results in author and keyword disambiguation, a process further facilitated by using keywords plus (Merigó et al., 2015). Keywords plus are automatically generated from WoS based on terms recurring in an article’s reference list, eliminating comparison issues (e.g., single or plural forms or acronyms). Consequently, WoS is considered the most suitable database and has emerged as a primary choice for scholars conducting bibliometric analysis (Tsay and Yang, 2005). It is challenging to find search queries in the data retrieval process. While digital technologies are widely used, opinions regarding their nomenclature and conceptualization are still divided. Terms like “digital tools” also appear in the literature (Hao et al., 2020). Publications about digital technologies in the classrooms from 2014 to 2023 were found using a search query that included keywords. The choice of timespan was not arbitrary because previous researchers explored bibliometric analysis for education concerning digital technologies done in different timespans, for example, E-learning (2015–2020) (Djeki et al., 2022), technology-mediated classroom dialogue (1997–2016) (Hao et al., 2020), and the evolution of topics in education research (2000–2017) (Huang et al., 2020). Furthermore, we focused on the last decade due to rapid technological advancements (Harju et al., 2019), significant shifts in educational paradigms (Mostafa, 2023), and the faster adoption of digital technologies during the COVID-19 pandemic (Alabdulaziz, 2021), making it important to identify current trends. The following advanced query was used to retrieve raw bibliographic data related to the digital technologies in the classroom research area from WoS, the most significant bibliometric database (Merigó et al., 2015).
TS = ((“digital technolog*” OR “digital tool*”) AND (“education*” OR “classroom” OR “learn*”)).
“TS” (Topics) refers to a publication’s title, abstract, or keywords. The last date of the article retrieval search was December 31, 2023. The articles were included based on (1) in English; (2) published between 2014 and 2023; (3) included in a WOS category titled “Education & Educational research”; and (4) articles indexed in the Social Sciences Citation Index (SSCI) and Science Citation Index-Expanded (SCIE). The restriction to only English language publications provides access to internationally recognized research, and the selected timeframe ensures that studies address contemporary educational challenges under current educational trends (Aytekin et al., 2022; Sinha et al., 2023).
Ten thousand seventy publications with complete bibliographic data and citations published between 2014 and 2023 were extracted. The downloaded raw data was put into Excel for additional processing to extract essential components from each publication, such as the title, authors, affiliation, abstract, journal, year published, etc. Preprocessing and data filtering were done to ensure the analysis was reliable and efficient. A total of 1,123 papers were chosen based on the criteria to be examined in the final data collection, as shown in Figure 2. This has fulfilled the requirements for analyzing bibliometrics, because Rogers et al. (2020) stated that to analyze bibliometrics a minimum of 200 documents is needed. Meanwhile, Donthu et al. (2021) stated that at least 300 documents were needed. Previous research used a few (Aliu and Aigbavboa, 2023; Mostafa, 2023; Sinha et al., 2023; Aytekin et al., 2022; Bathla et al., 2023) to thousands of papers (Djeki et al., 2022; Hao et al., 2020; Li and Wong, 2022; Huang et al., 2020; Wahid, 2024; Herlina et al., 2025) for bibliometric analysis. Ellegaard and Wallin (2015) stated that a high volume of papers gives breadth, and a limited volume of papers enables more targeted insights. Still, the volume of papers for bibliometric analysis depends on whether the domain is developing or developed.
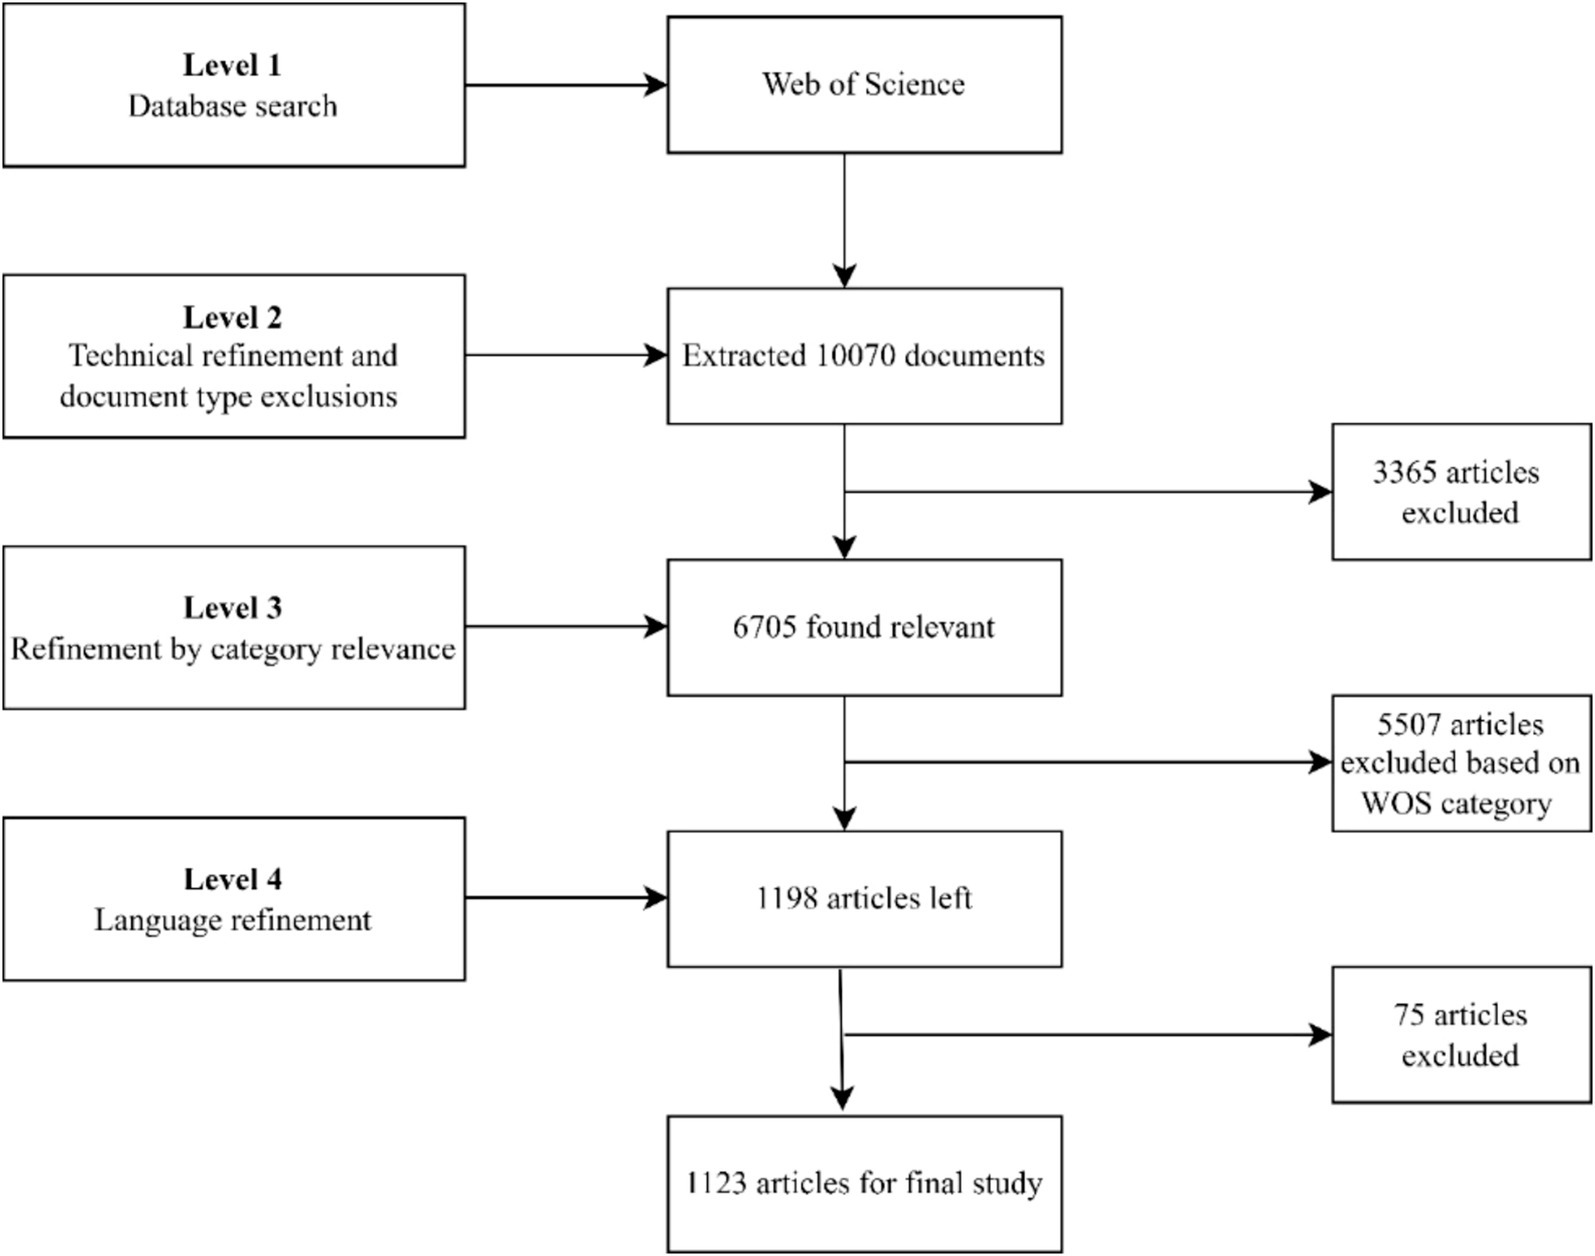
Figure 2. A visual representation of a systematic process for selecting relevant articles based on predetermined criteria.
Bibliometric analysis was performed employing Biblioshiny (RStudio), VOSviewer software, and Microsoft Excel to explore various characteristics. Microsoft Excel was employed to filter and visualize publication trends through graphs. Biblioshiny, a Java software, integrates the capabilities of the bibliometrix package with the user-friendly interface of web applications within the Shiny package environment (Aria and Cuccurullo, 2017). After applying inclusion and exclusion criteria, we exported the results in two file formats: Microsoft Excel and Bibtex. Biblioshiny was utilized to perform descriptive analyses, i.e., annual scientific productivity, and identify top contributing authors, institutions, journals, countries, articles, and keywords. Furthermore, the co-occurrence network, thematic map, author’s collaboration network, and cross-country collaboration network were created through Biblioshiny. VOSviewer was used to create an author-based co-citation network, article-based co-citation network, and source-based co-citation network.
The final data analysis involved bibliometric techniques, particularly performance analysis and scientific mapping (Noyons et al., 1999). It aids in exploring bibliographic characteristics and the visualization of research landscapes to identify trends and patterns within literature.
Performance analysis in bibliometric analysis involves descriptive statistics, publications projection, and evaluating the impact, productivity, and influence of journals, institutions, countries, authors, and keywords within a specific field (Li and Wong, 2022). It can employ a variety of indicators, primarily focused on analyzing the overall trend of the topic and the publication or CC of articles within the dataset, categorized by authors, journals, countries, and affiliations (Huang et al., 2020). However, other indicators are commonly utilized when assessing the scientific impact of researchers or journals. One of the most popular, known for its straightforward interpretation, is the h-index introduced by Hirsch (2005). It represents the minimum number of papers garnered at least citations, offering a holistic evaluation of productivity and impact within academia. Nevertheless, while it provides objectivity, the h-index is particularly advantageous for comparing authors across diverse research domains or varying career stages (Kelly and Jennions, 2006). However, the g-index is considered more robust than the h-index as it accounts for the citation performance of all articles, giving more weight to highly cited papers has also been reported. The m-index has also been reported as an alternative unit of analysis to overcome the problems associated with comparing researchers at different stages of their careers. The m-index is the h-index divided by the years between a scientist’s first and last publication (Hirsch, 2007). This study only compares scientists in the field of digital technologies in classroom environments.
Scientific mapping aims to uncover latent relationships and phenomena within the structure of science through visual representations that would otherwise be difficult to detect. It typically employs symbols of varying sizes and colors to represent concepts and their significance (Aria and Cuccurullo, 2017). It permits scholars to identify conceptual, social, and intellectual structures to recognize their progressing dynamics over time (Aria and Cuccurullo, 2017; Noyons et al., 1999). Furthermore, it is an efficient method to define research topics from literature and provide a comprehensive overview of the current state of research, but mainly identifying research gaps to guide future research directions (Aria and Cuccurullo, 2017).
This section presents a bibliometric analysis utilizing diverse performance metrics to address the first research question of this study.
RQ1: What are the global trends, distribution of the major actors, and research landscape in the interdisciplinary research area of digital technologies and classrooms in the last 10 years?
Table 1 illustrates the descriptive characteristics of digital technologies in the classroom of 1,123 articles published from 2014 to 2023. The data of the selected timespan demonstrates a notable annual growth rate of 21.5%, with an average article age of 4.04 years and an average of 14.3 citations per article. Furthermore, the articles within the dataset contain a rich array of content, with 1,202 automatically generated keywords (keywords Plus) and 3,104 keywords provided by the authors. Among the 2,680 contributing authors, 237 authors have singular contributions. Collaboration among authors is evident, with an average of 2.81 co-authors per article and approximately 21.19% of articles demonstrate international co-authorships.
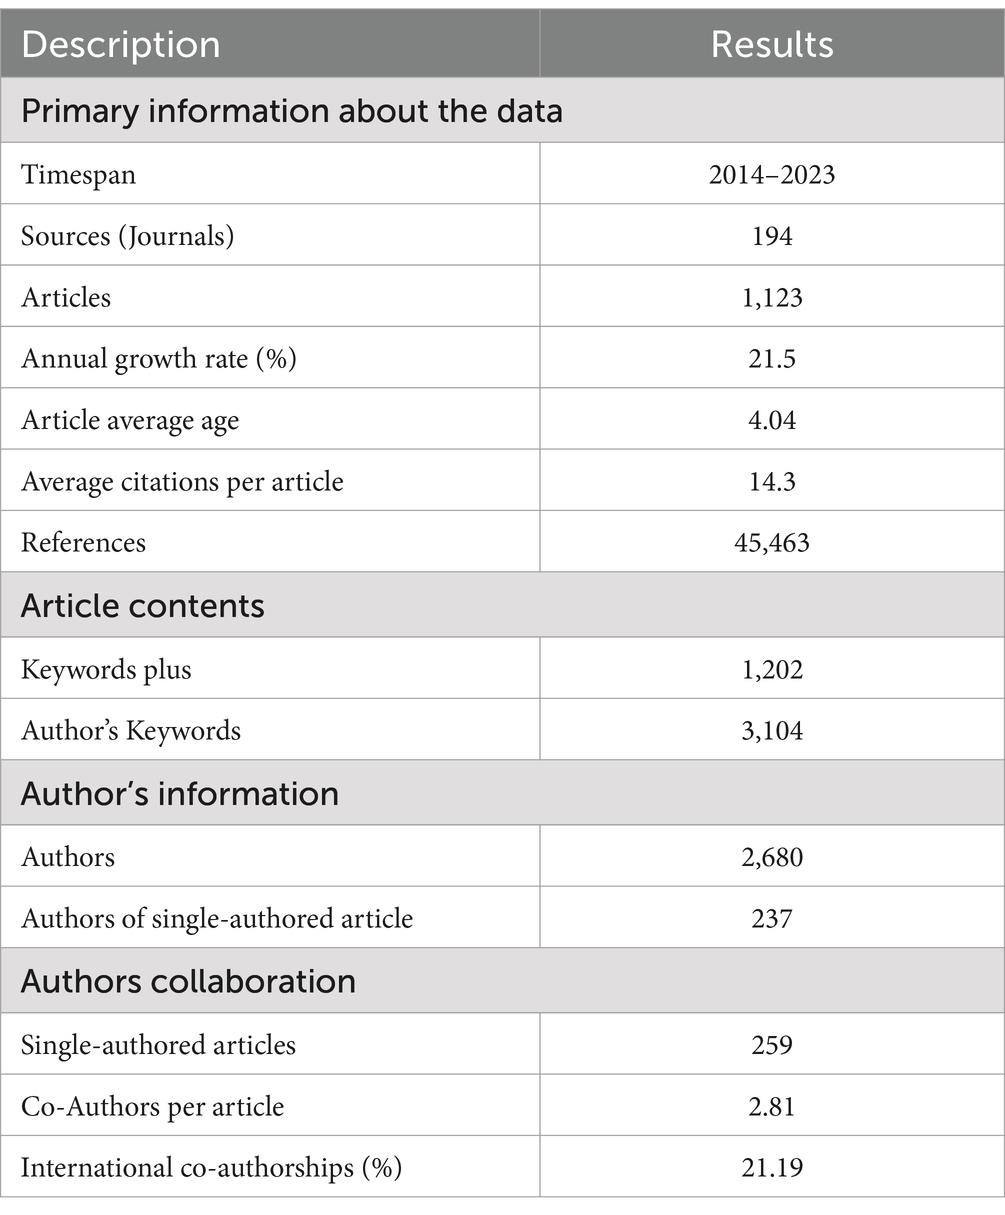
Table 1. Descriptive characteristics of digital technologies in the classroom literature.
The number of articles published across diverse scientific domains has grown remarkably in recent years. This surge aligns with notable shifts observed in the behavior of scholars engaged in scientific research (Roldan-Valadez et al., 2019; Kelly and Jennions, 2006). Figure 3 displays the number of articles by year based on data from 1,123 articles. Data analysis showed 41 publications in 2014 (3.65%) and 49 in 2015 (4.36%). The trend continued with 66 publications in 2016 (5.88%), 62 in 2017 (5.52%), 95 in 2018 (8.46%), 106 in 2019 (9.44%), 142 in 2020 (12.65%), 151 in 2021 (13.45%), 172 in 2022 (15.32%), and 237 in 2023 (21.12%). Of these, 72.2% of the articles were published within the last 5 years, compared to 27.8% from 2013 to 2017. The fitting curve with an R2 value of 0.9715 indicates that the cumulative number of published articles on digital technologies in classrooms has experienced significant growth. The trend indicates that digital technologies in classroom research have matured post-2019.
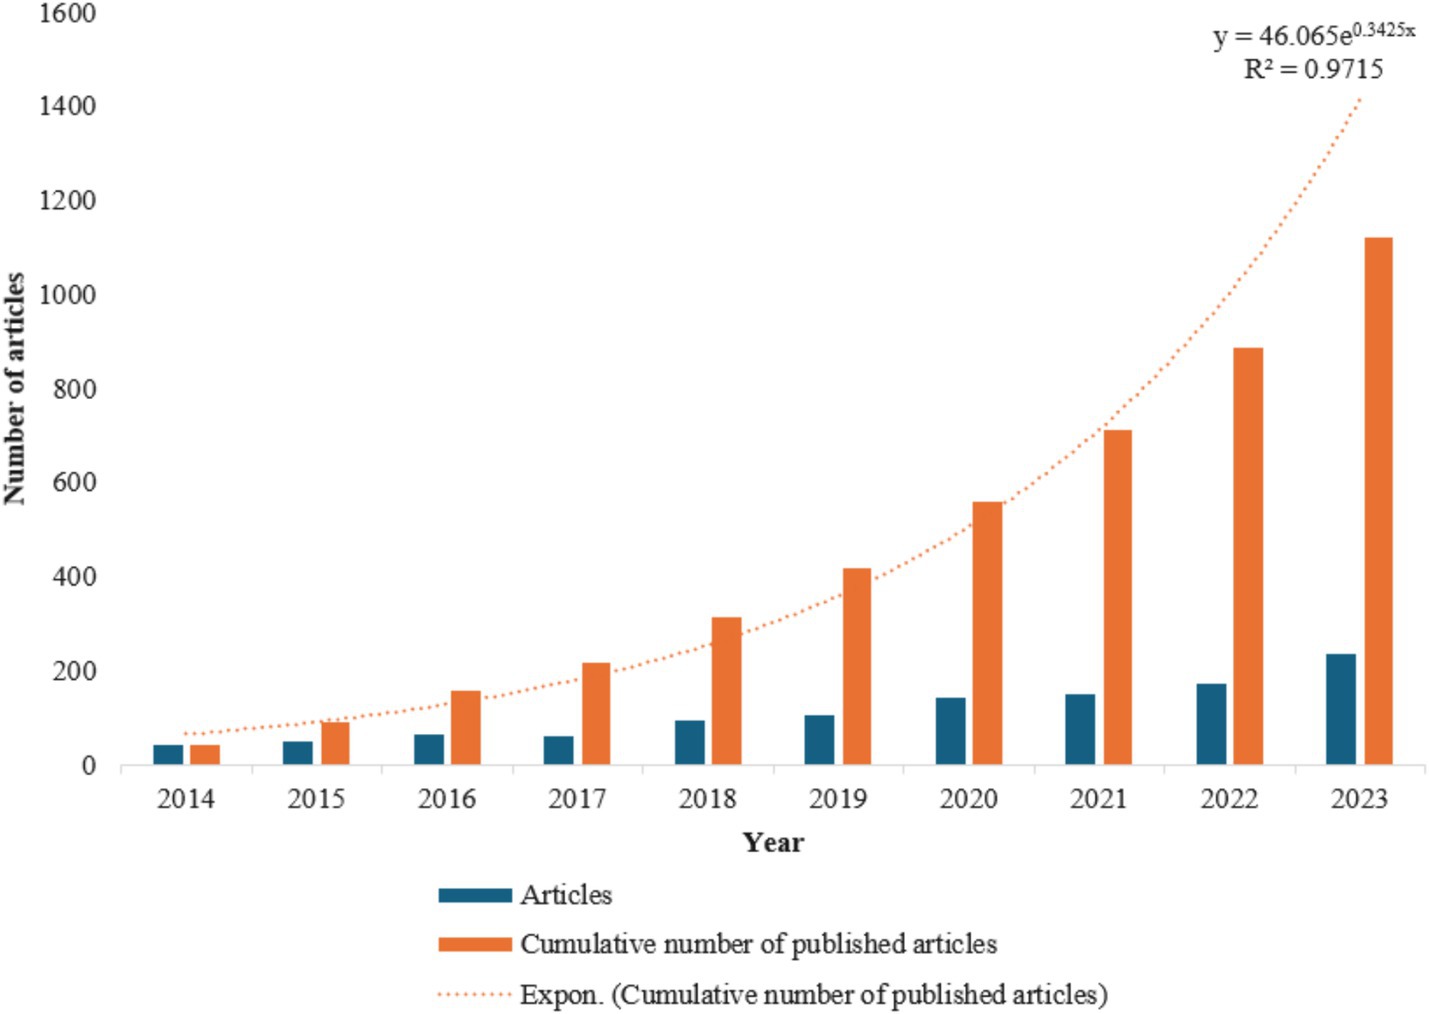
Figure 3. Trend analysis of digital technologies in the classroom in the last decade.
Journal profile analysis entails examining the characteristics of academic journals based on various criteria (Roldan-Valadez et al., 2019). We employed source impact analysis alongside Bradford law to identify primary journals contributing to disseminating digital technologies in classroom-related literature within the education domain. Table 2 outlines the ranking of articles based on publication count (PC), citation count (CC), cumulative frequency (CF), h, m, g-index, journal’s zone (Bradford’s law), and publication year (PY). Furthermore, the significance of a journal has also been determined by impact factor (IF), SJR (SCImago Journal Rank), Citescore, SNIP (Source Normalized Impact per Paper), and overall h-index (Roldan-Valadez et al., 2019). According to Bradford’s law, journals are categorized into zones based on productivity. Zone 1 comprises core sources with the most publications, while zones 2 and 3 contain progressively fewer publications (Tsay and Yang, 2005). The findings reveal that among 194 journals analyzed, nine journals fall within core zone 1, while 39 and 147 journals were classified under zones 2 and 3, respectively. Figure 4 illustrates the yearly proportions of relevant papers for the 20 most prolific journals, enabling readers to analyze the trends within each top-ranked journal over the past decade. The top 20 journals emerge as key avenues for disseminating digital technologies in classroom literature. The top five journals are “Education and Information Technologies,” “British Journal of Educational Technology,” “Computers & education,” “Learning Media and Technology,” and “Technology Pedagogy and Education.” Of all the articles, the top 20 journals contain 47.55%, with “Education and Information Technologies” making up 8.99%. Out of 194 sources, only 23 journals published at least 10 papers between 2014 and 2023. The “British Journal of Educational Technology” and “Technology Pedagogy and Education” are ranked second and fifth, respectively, based on PC. Yet, the primary journal’s PC of “Education and Information Technologies” articles surpasses that of the second-ranked journal, the “British Journal of Educational Technology,” nearly double. The m-index of “Education and Information Technologies” is also higher among all journals. Considering all parameters, “Education and Information Technologies” came in first, indicating their excellent caliber of papers within the discipline.
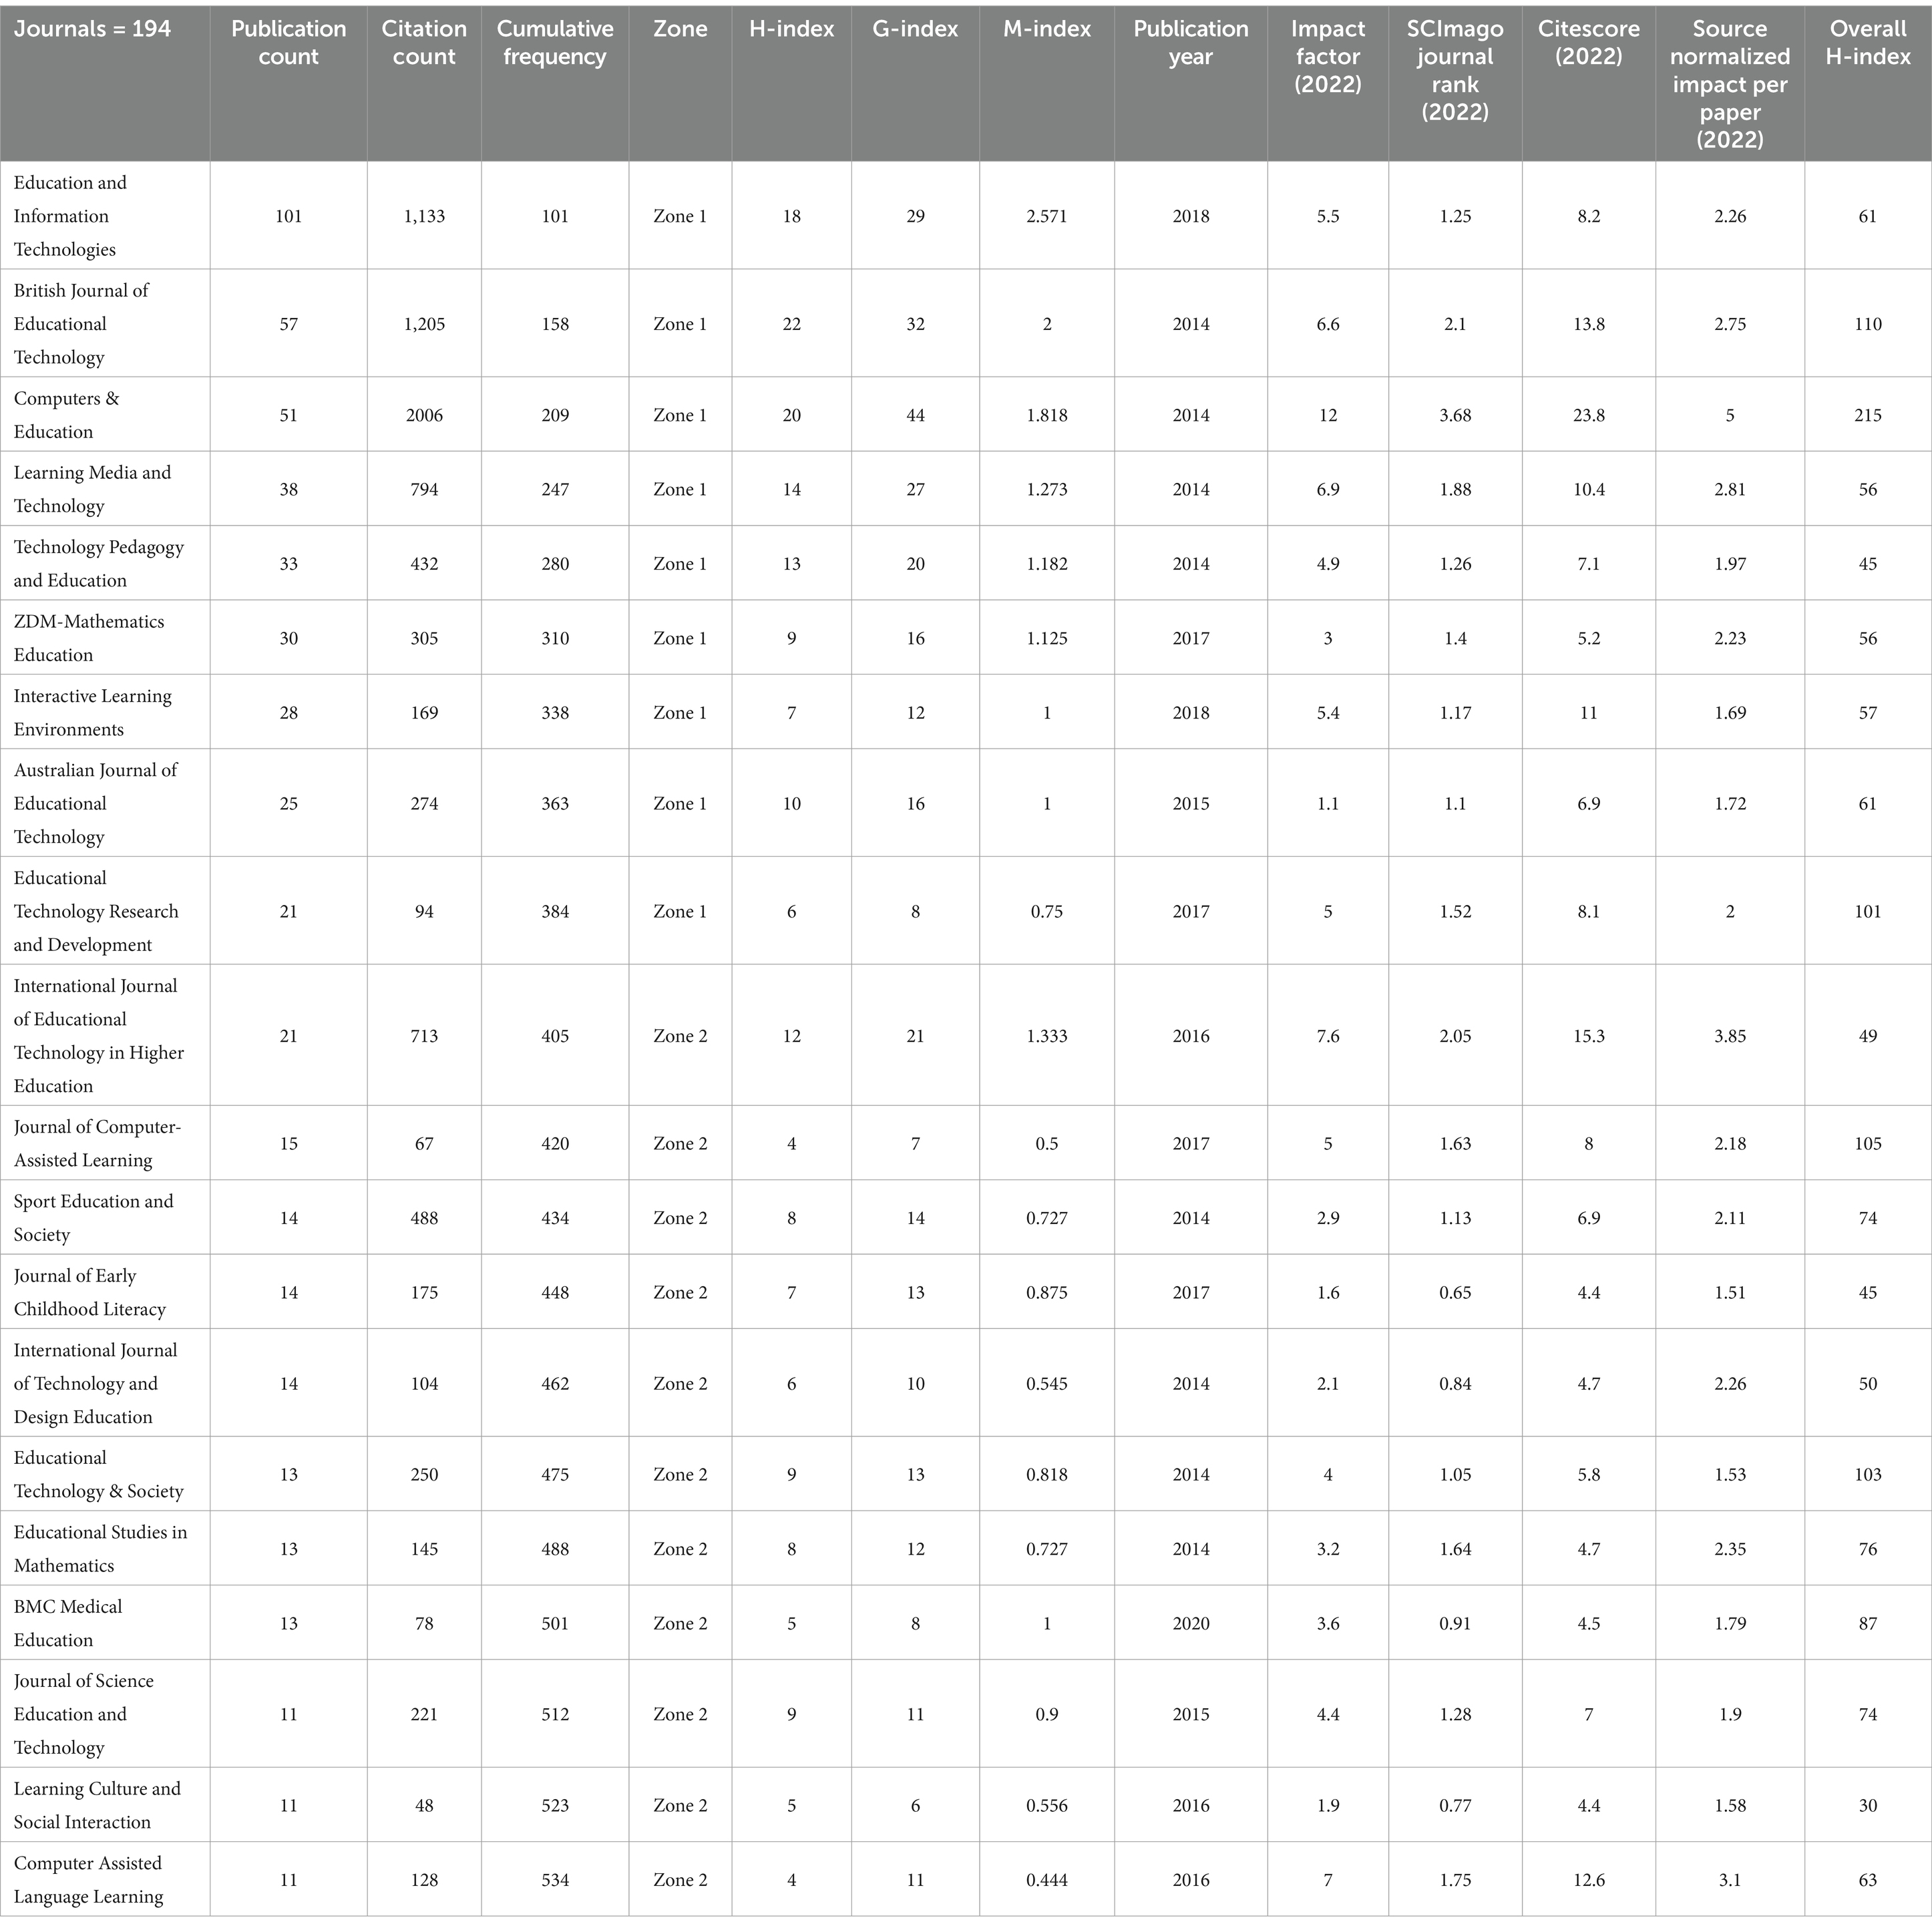
Table 2. Top 20 influential and prestigious journals concerning the frequency of their publications.
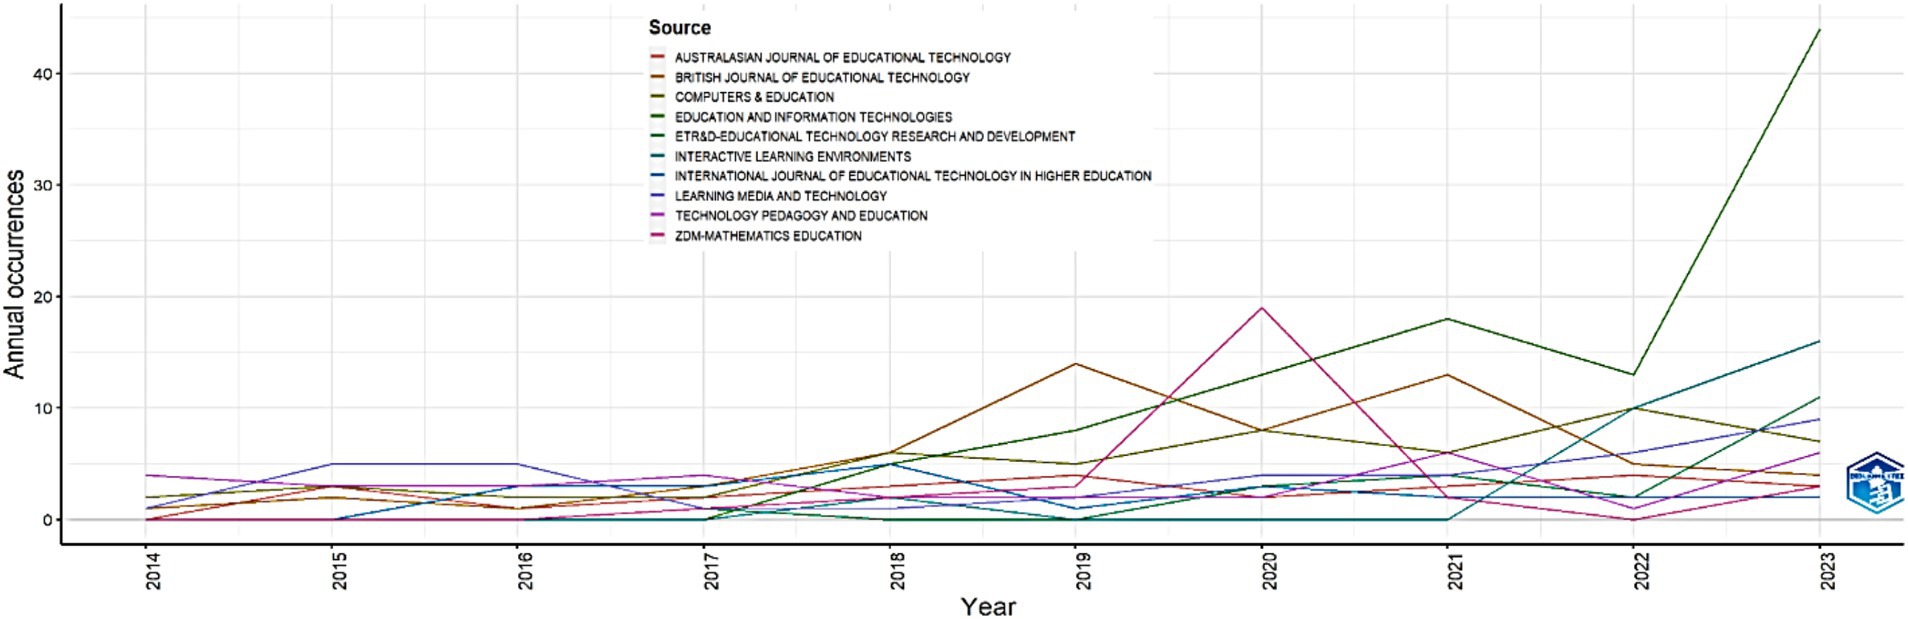
Figure 4. The growth of journals over time in the last 10 year.
Identifying the most influential countries is important as it provides insights into the global research landscape (Ellegaard and Wallin, 2015). It was discovered that authors from 72 countries had used digital technologies in classroom research. Table 3 displays the 20 most prominent nations based on PC, CC, average citations per article (ACA), gross domestic product (GDP) ranking, single-country publications (SCPs), multi-country publications (MCPs), and MCP ratio. Zaman et al. (2018) pointed out a positive correlation between a country’s research growth and GDP ranking, indicating that higher GDP rankings are associated with greater research productivity. Furthermore, when considering multi-authored publications, it becomes apparent that countries with the highest publication output may exhibit a lower propensity for international collaboration. The MCP ratio indicates each country’s propensity for international collaboration (Ellegaard and Wallin, 2015). Based on Table 3, the United States is the most frequently mentioned nation, trailed by Australia, the UK, China, and Sweden. It was found with the analysis of the dataset that the publications related to digital technologies in classrooms in 72 countries, mainly the USA (14.87%), Australia (14.33%), UK (10.50%), China (6.76%), Sweden (6.41%), Spain (5.34%), etc.
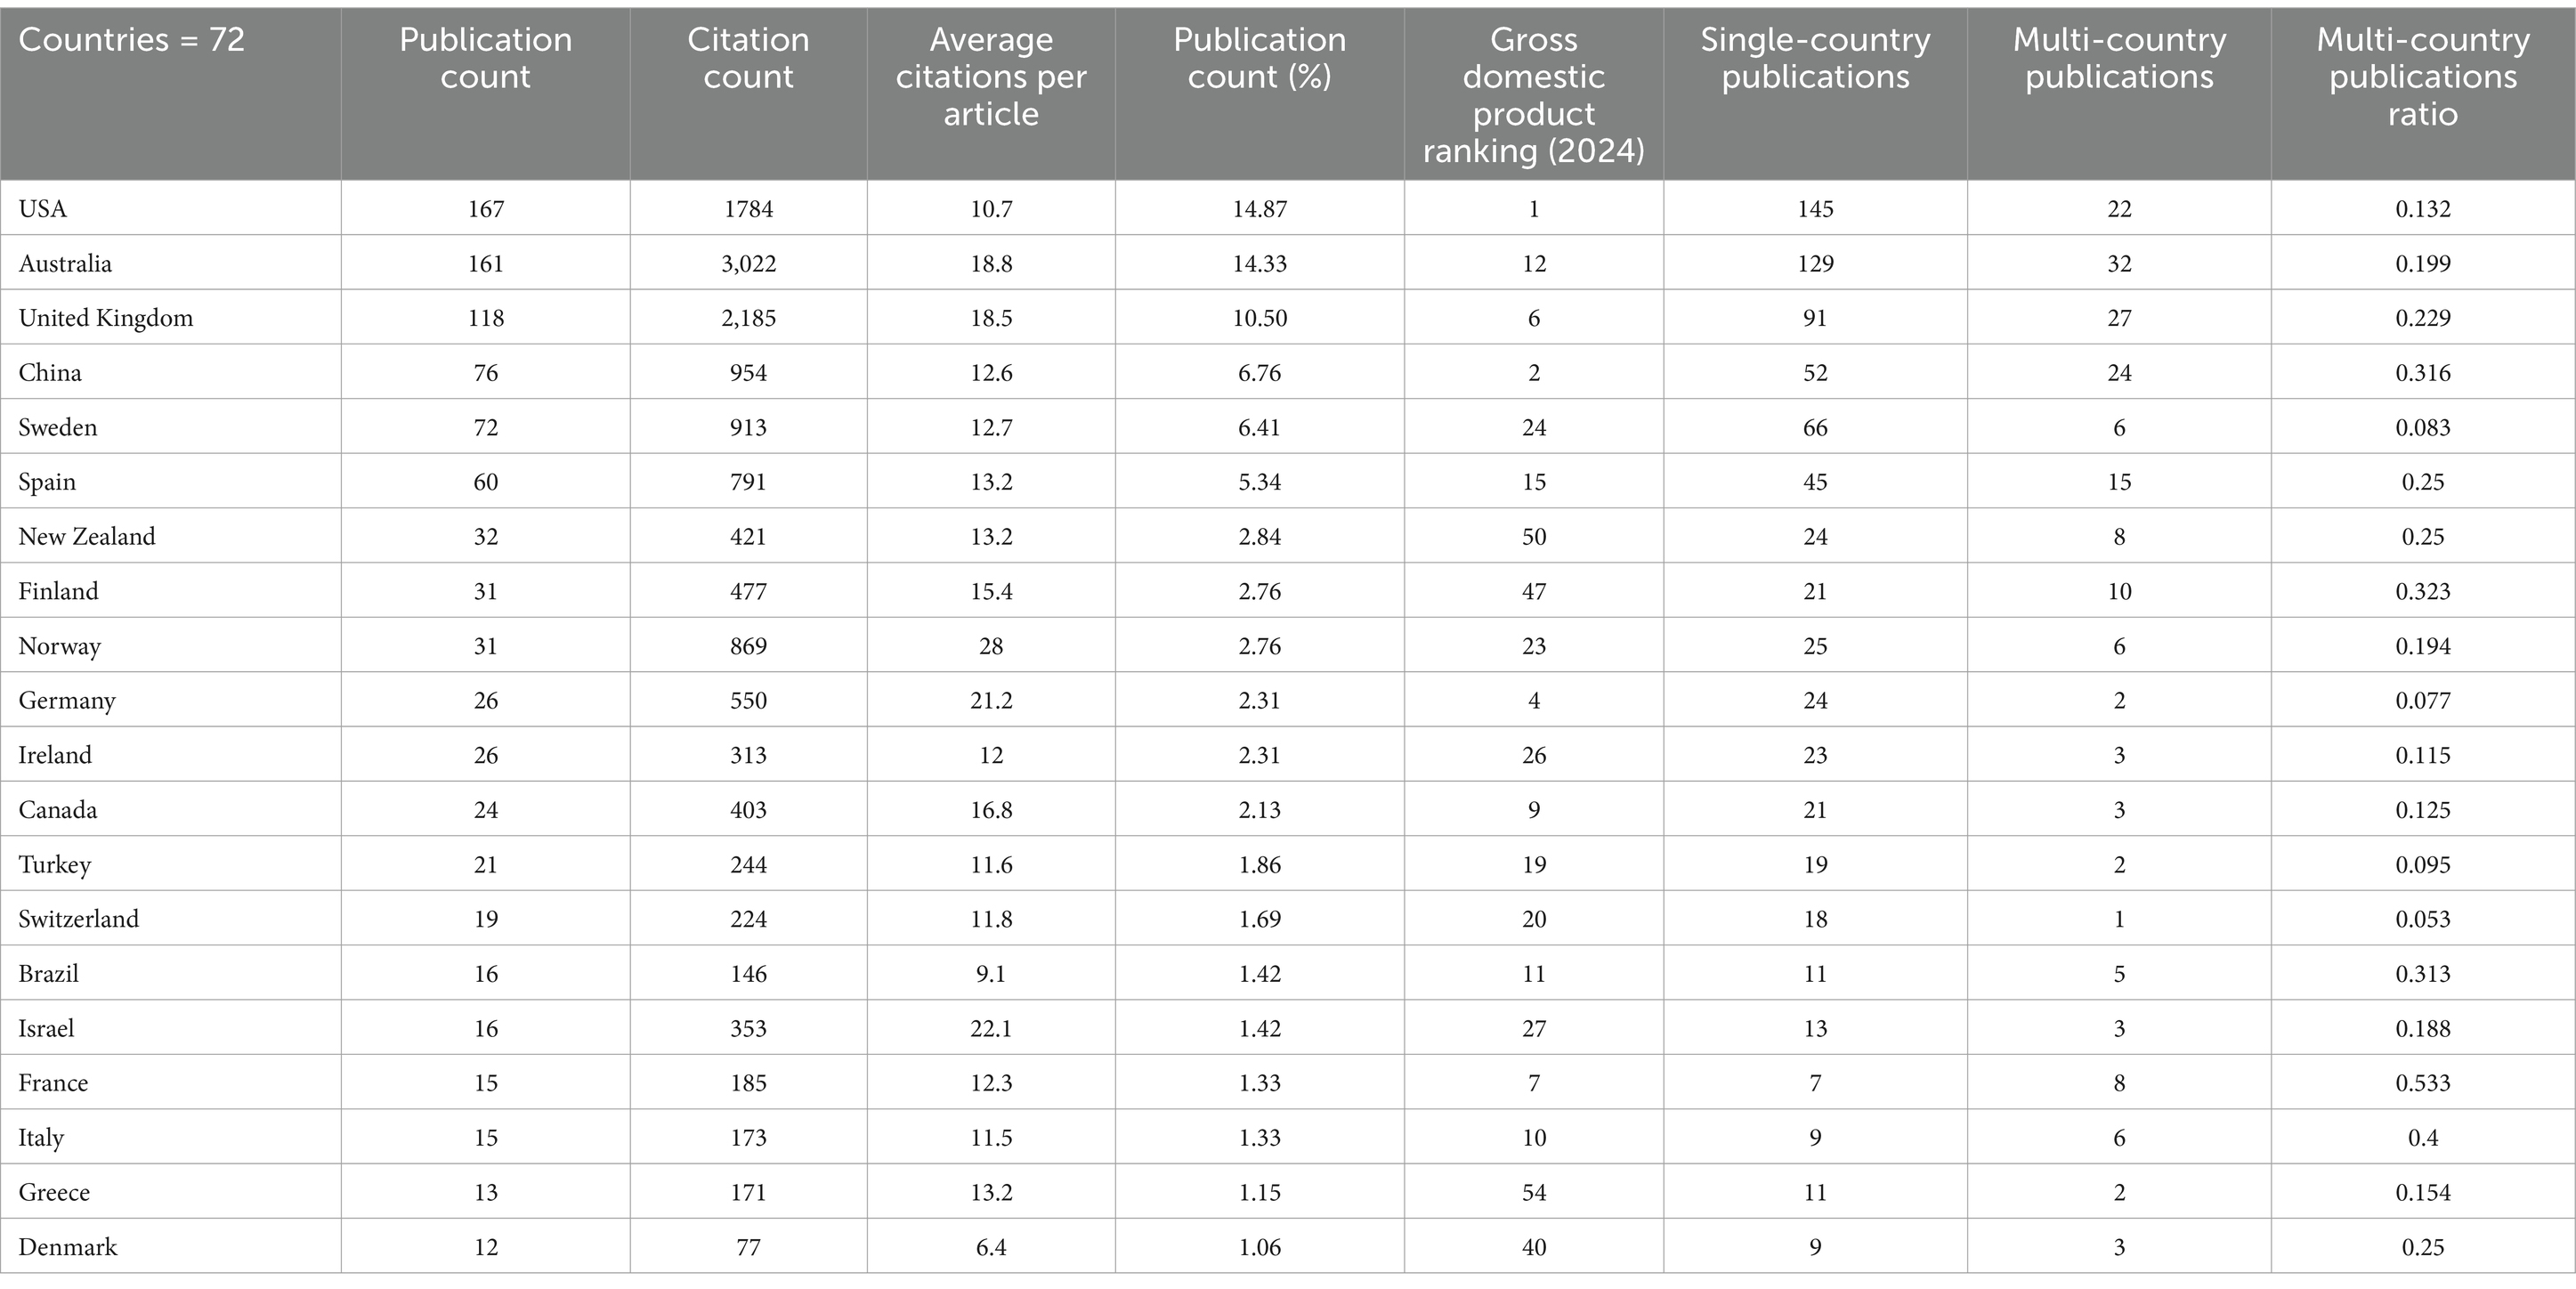
Table 3. Top-ranking countries based on total publication count.
The analysis of productive institutions in the bibliometric analysis is crucial for identifying research hubs (Hao et al., 2020). It is vital to consider a university’s research competence, academic reputation, and place in the international and local educational world based on Quacquarelli Symonds (QS) ranking, Academic Ranking of World Universities (ARWU) or Shanghai ranking, and National rankings (Moskovkin et al., 2022). The top 20 universities are listed in Table 4 based on PC. The top five universities are “Monash University” (48), “University of Oslo” (21), “Deakin University” (18), “University of Gothenburg” (15), and “Griffith University” (15). Of the top 20, 9 originate from Australia, indicating Australia’s central position in the research field. Several renowned universities (Top 50 QS universities), the “University of Cambridge,” “University College London,” “the University of Sydney,” “the University of Edinburgh,” “The University of Hong Kong,” “The University of Melbourne,” and “Monash University,” also published many articles in a similar domain. Similarly, the leading/top universities of Norway, Finland, the UK, New Zealand, Australia, and Hong Kong are active and influential in their research on digital technologies in classrooms at the national level. These 20 institutes hold 26.17% of the total publications.
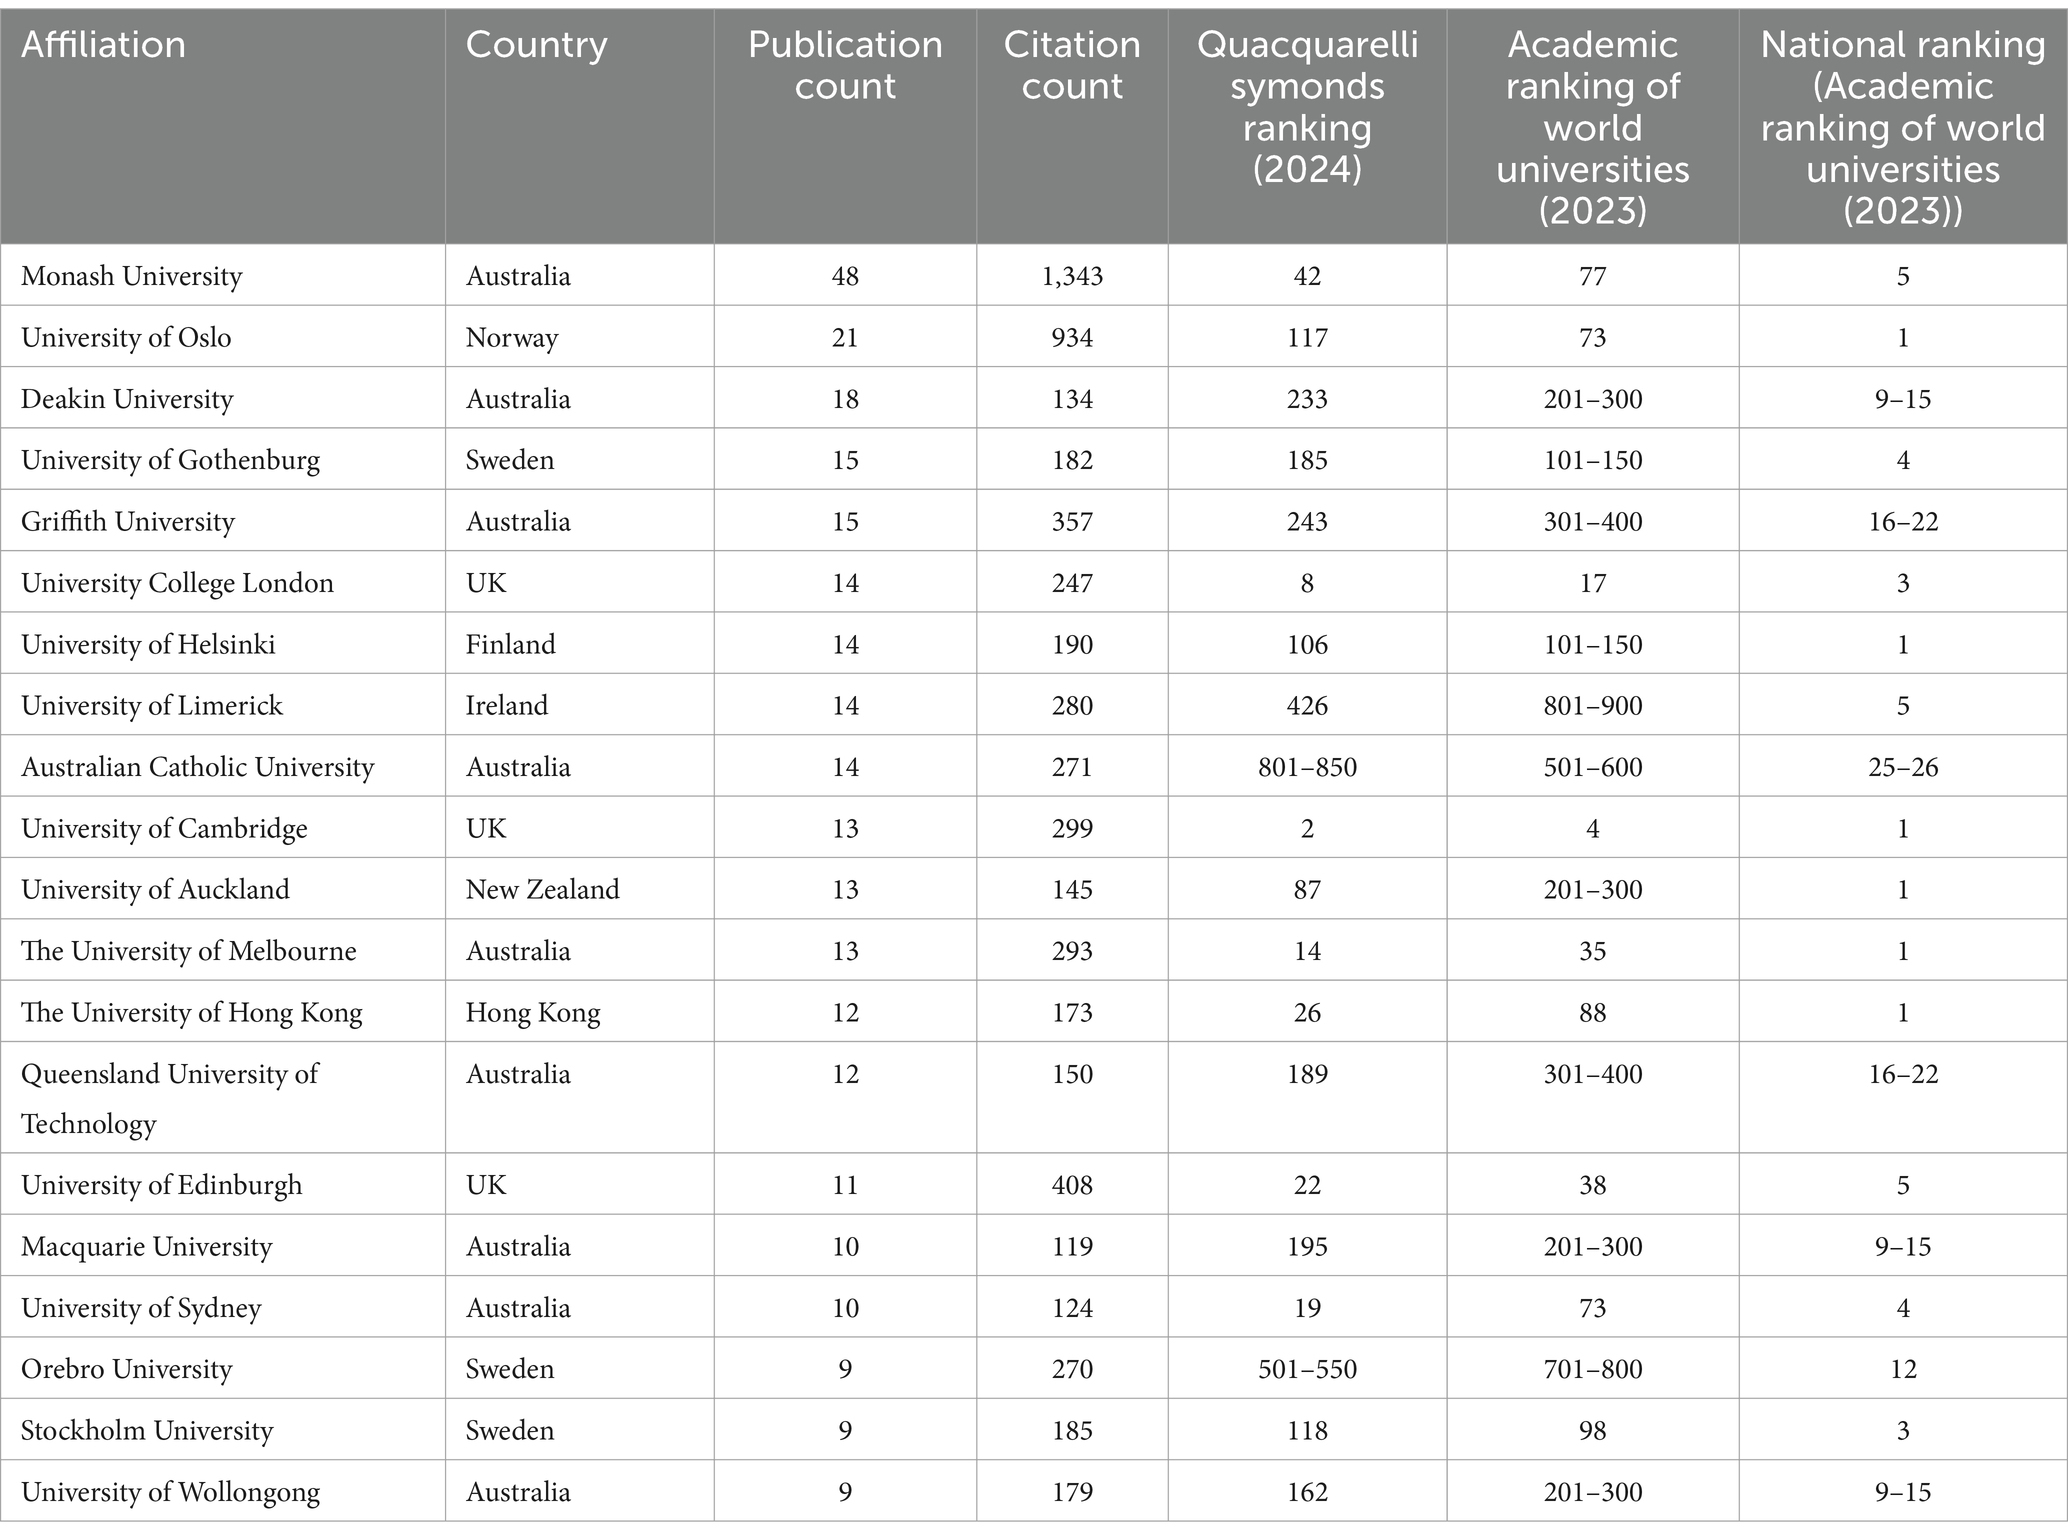
Table 4. Top institutions sorted by total publication count.
Table 5 lists the influential researchers in digital technologies in classrooms, which includes the author’s name, affiliation, country, PC, CC, h, g, m-index, and PY. With 15 articles produced between 2014 and 2023, Neil Selwyn was ranked highest by the analysis, followed by Dominik Petko with nine publications. Michael Henderson and Paul Drijvers were placed fourth and fifth in the analysis; while having the same number of articles, they received different citations. Australia is home to three of the top five active researchers. Among the top 20 researchers, seven researchers belong to Australia, and five authors belong to the UK.
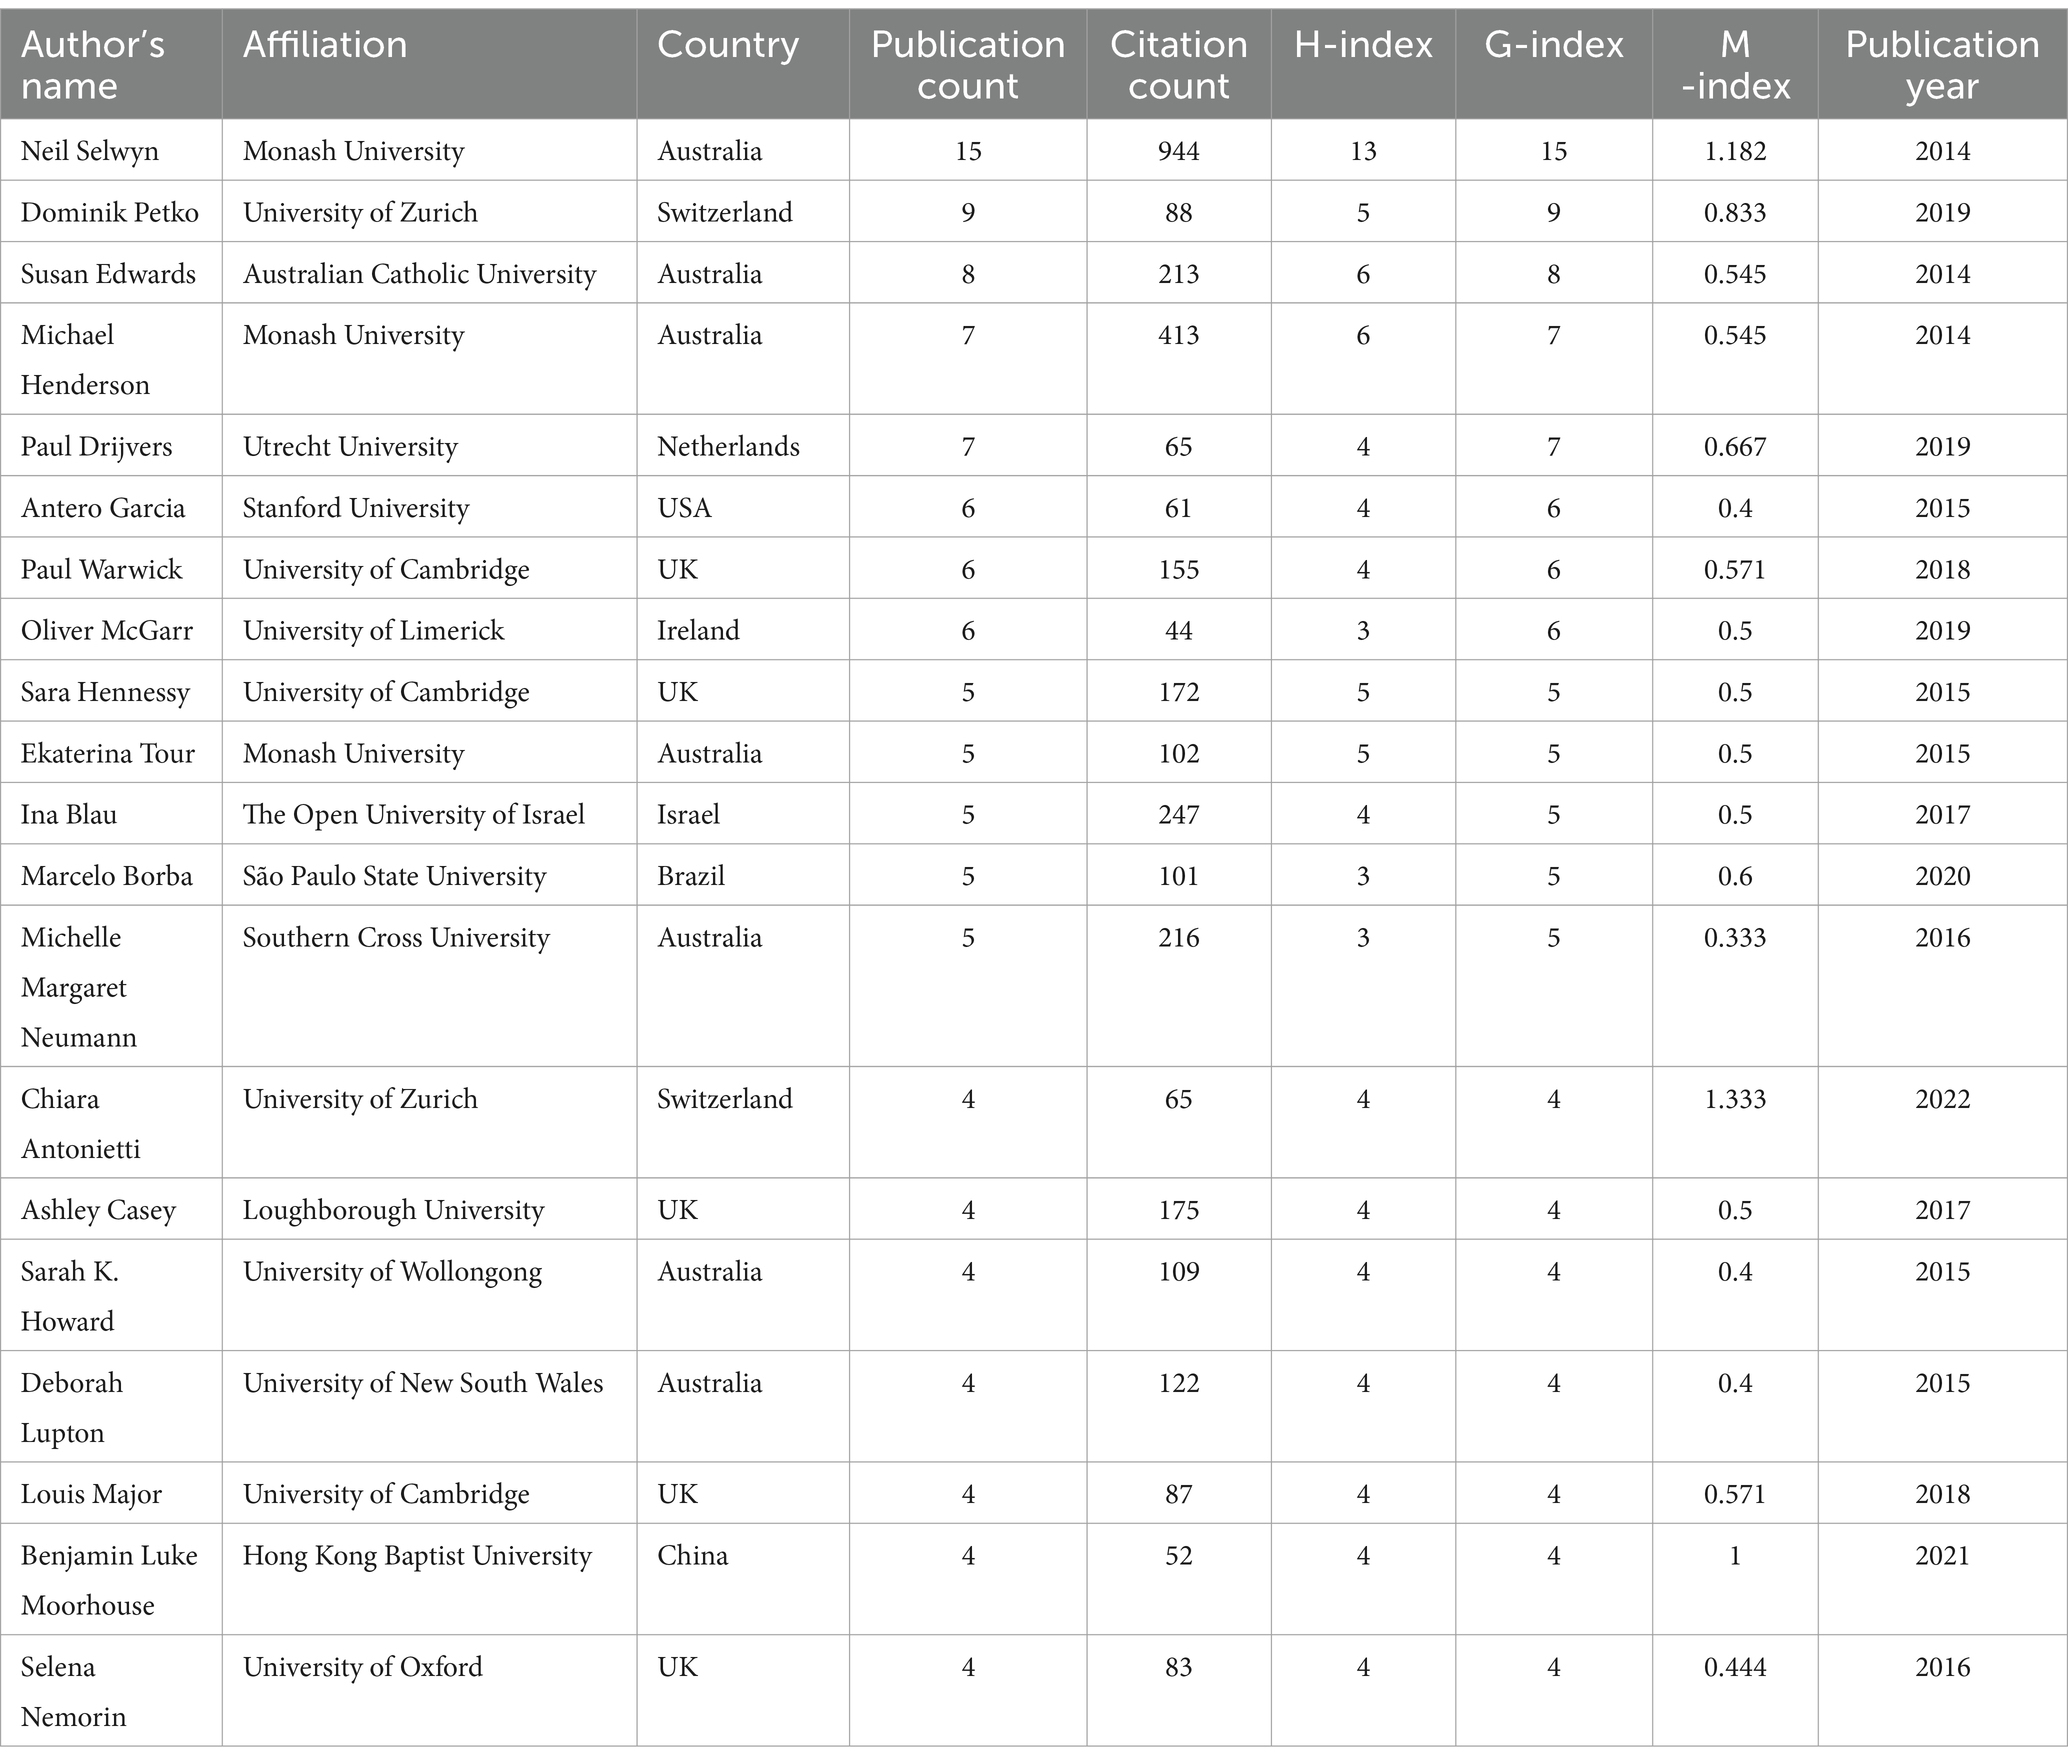
Table 5. Authors with the highest number of publications.
Among 1,123 articles, 16 papers received citations exceeding 100 times, suggesting significant impact and influence within their respective fields. Additionally, the top 20 most influential publications, presumably based on CC, are listed in Table 6. Table 6 contains information on journals, publishers, IF, CC, and citation count per year (CCY) related to the publication. The analysis shows that the research on digital technologies in classrooms focuses much more on the students and teachers, their experience and acceptance, the impact of digital technologies on learning, and how to improve education. The article by Ronny Scherer et al. entitled “The Technology Acceptance Model (TAM): A Meta-analytic Structural Equation Modeling Approach to Explaining Teachers’ Adoption of Digital Technology in Education” published in the journal “Computers & Education” in 2019 is the most cited (580 times in WoS and 1,548 times in Google Scholar). The paper titled “What Works and Why? Student Perceptions of ‘Useful’ Digital Technology in University Teaching and Learning,” authored by Michael Henderson et al., holds the second position in terms of citations. Published in 2015 in the journal “Studies in Higher Education,” it has been cited 272 times in WoS and 1,093 times in Google Scholar. Following closely is the paper authored by Melissa Bond et al., titled “Digital Transformation in German Higher Education: Student and Teacher Perceptions and Usage of Digital Media.” Published in 2018 in the “International Journal of Educational Technology in Higher Education,” it ranks third in citation count, with 178 citations in WoS and 464 citations in Google Scholar. The examination further indicated that the papers cited the most were the earliest, with the most influential papers published from 2014 to 2019. Notably, several highly cited papers encompass literature reviews, systematic literature reviews, or meta-analyses, highlighting the significance of social and experimental research within digital technologies in educational settings, thus emphasizing the critical role of review studies in this domain.
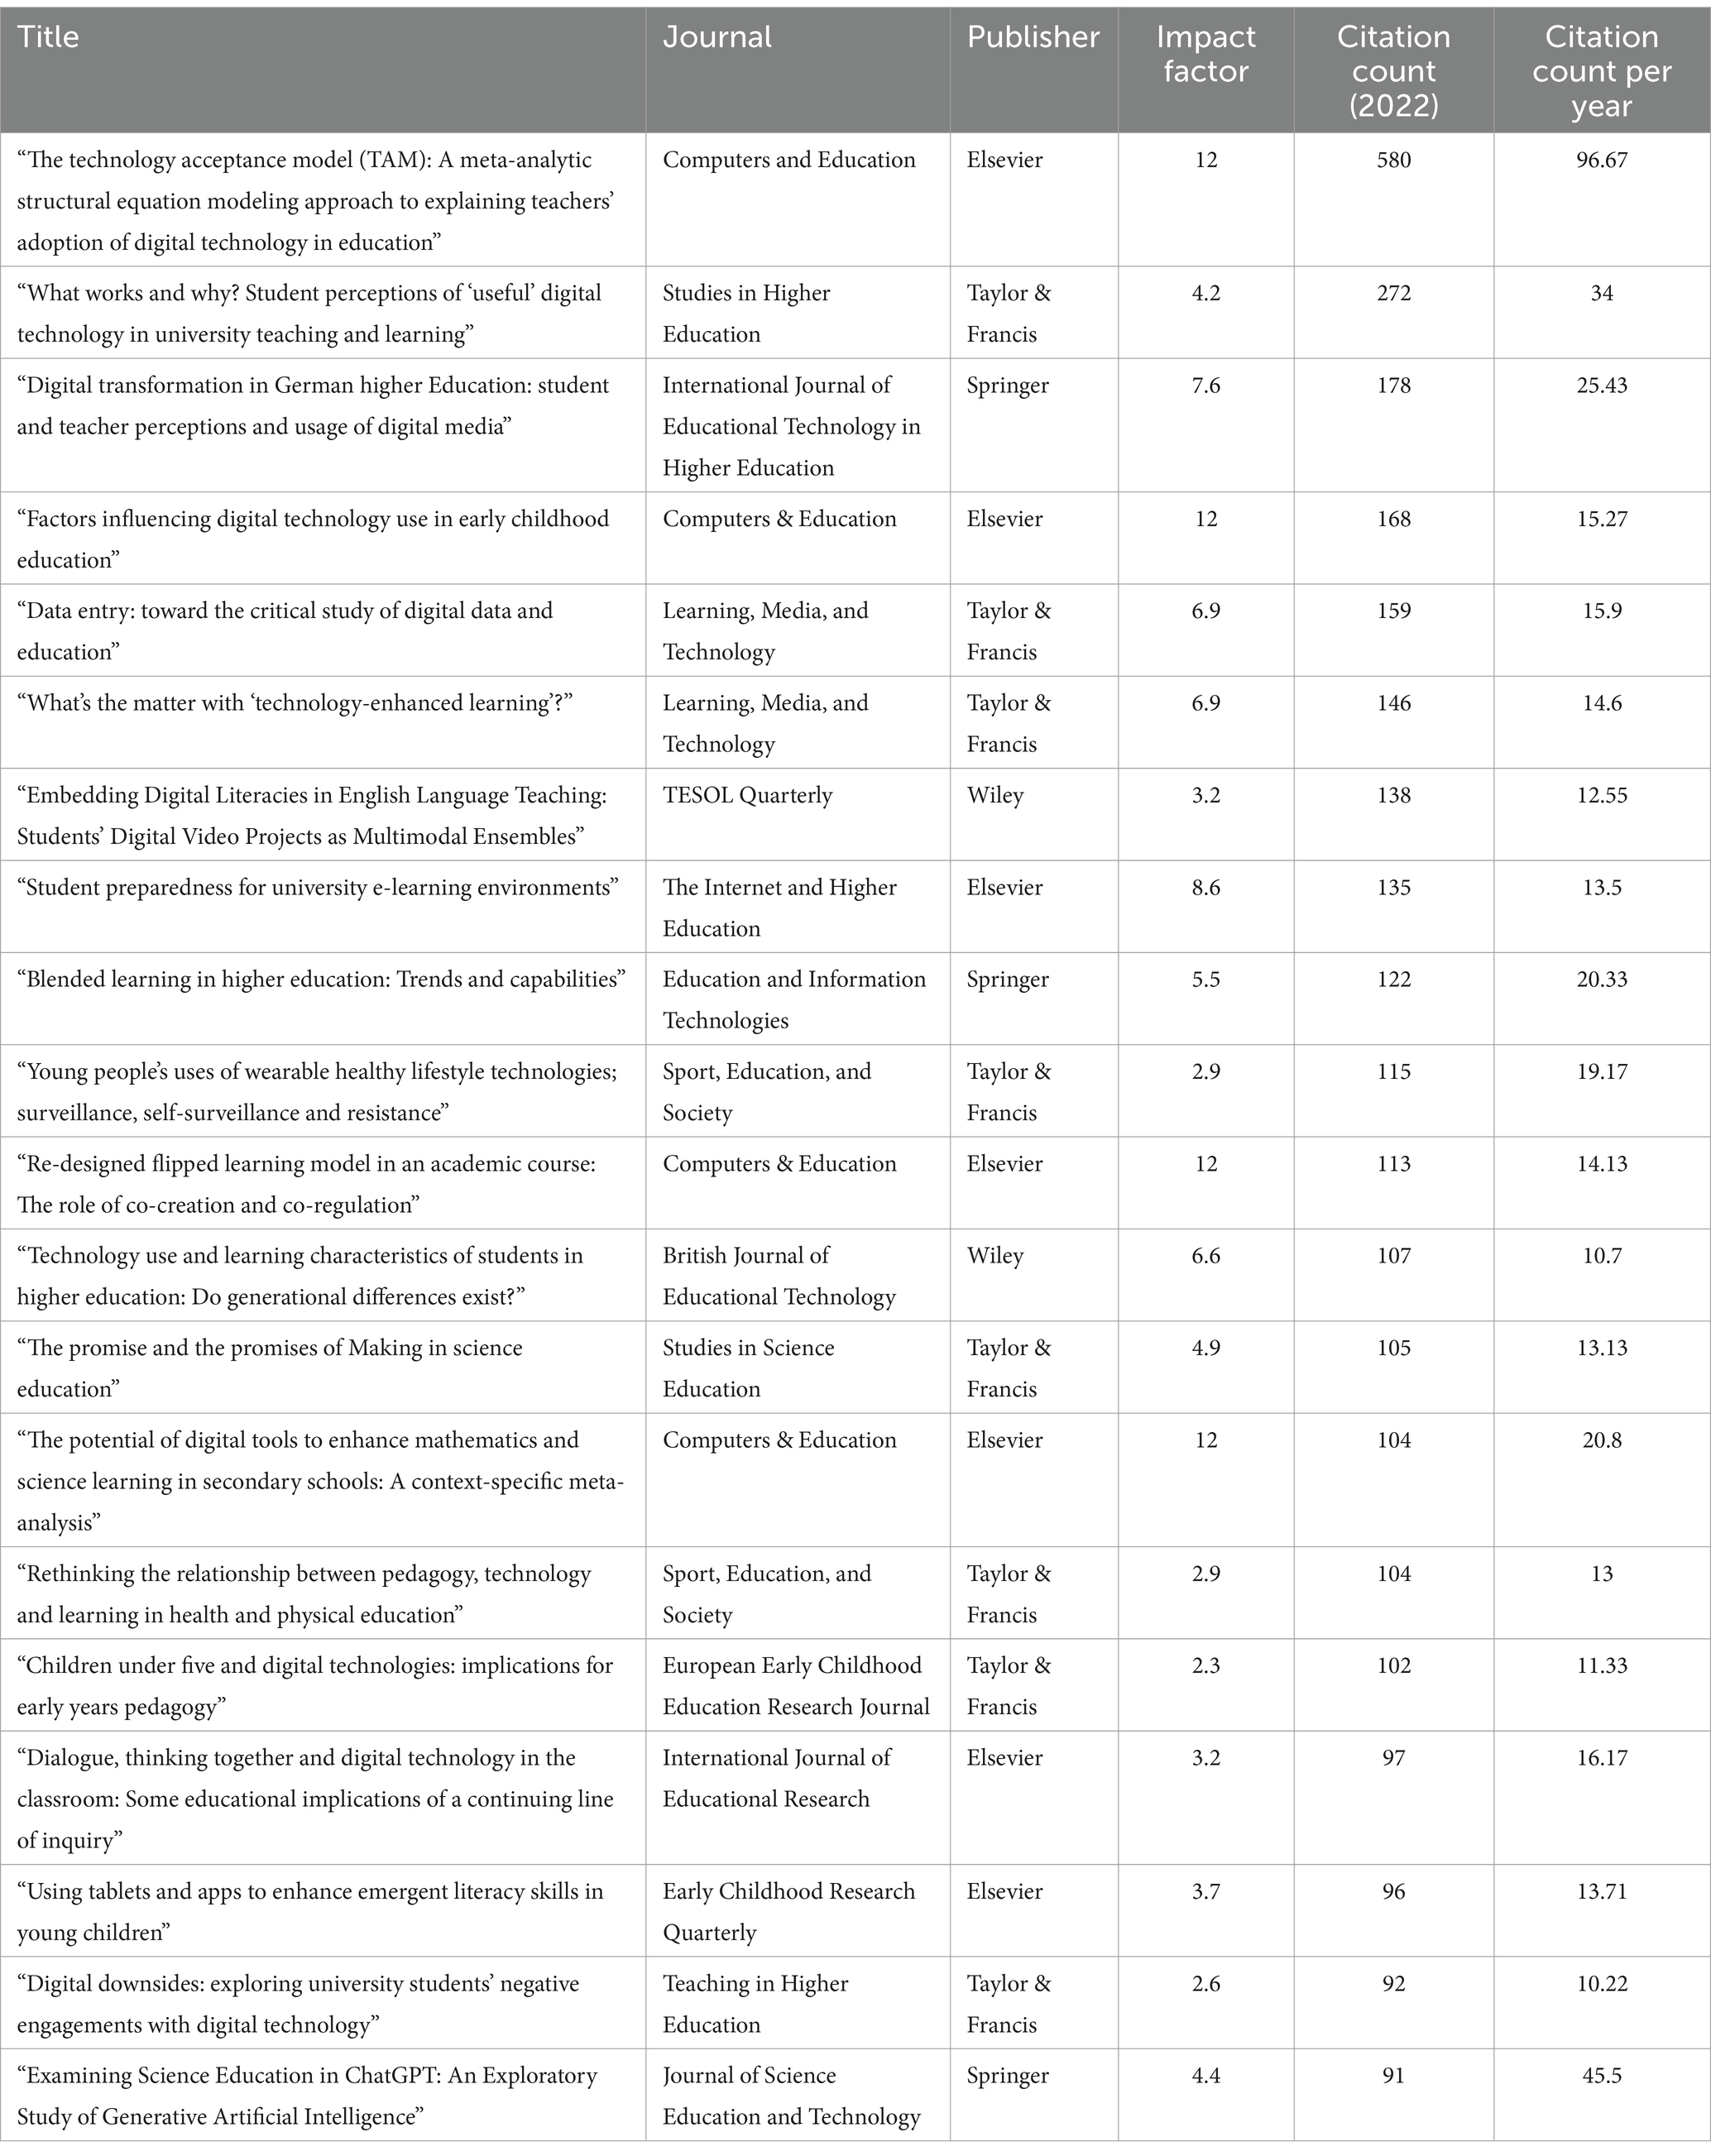
Table 6. Most cited papers for digital technologies in classrooms.
Keywords are pivotal in bibliometric analysis as identifiers for research topics, themes, and trends. Additionally, keyword analysis facilitates the exploration of research trajectories and mapping intellectual landscapes. Table 7 Presents the most commonly occurring words as keywords plus author’s, abstract, and title keywords. Notably, “digital technologies” emerge as the most frequently utilized term by authors, with a count of 103. Interestingly, the utilization of author keywords is relatively minimal across the literature. Furthermore, only a few researchers employ author keywords. “Digital” is the most prevalent word in the abstract and title sections, with a frequency of 500 and 3,045, respectively. However, it has been observed that terms employed in the abstract and title tend to be more generic, with lesser potential to delineate specific themes or research streams.
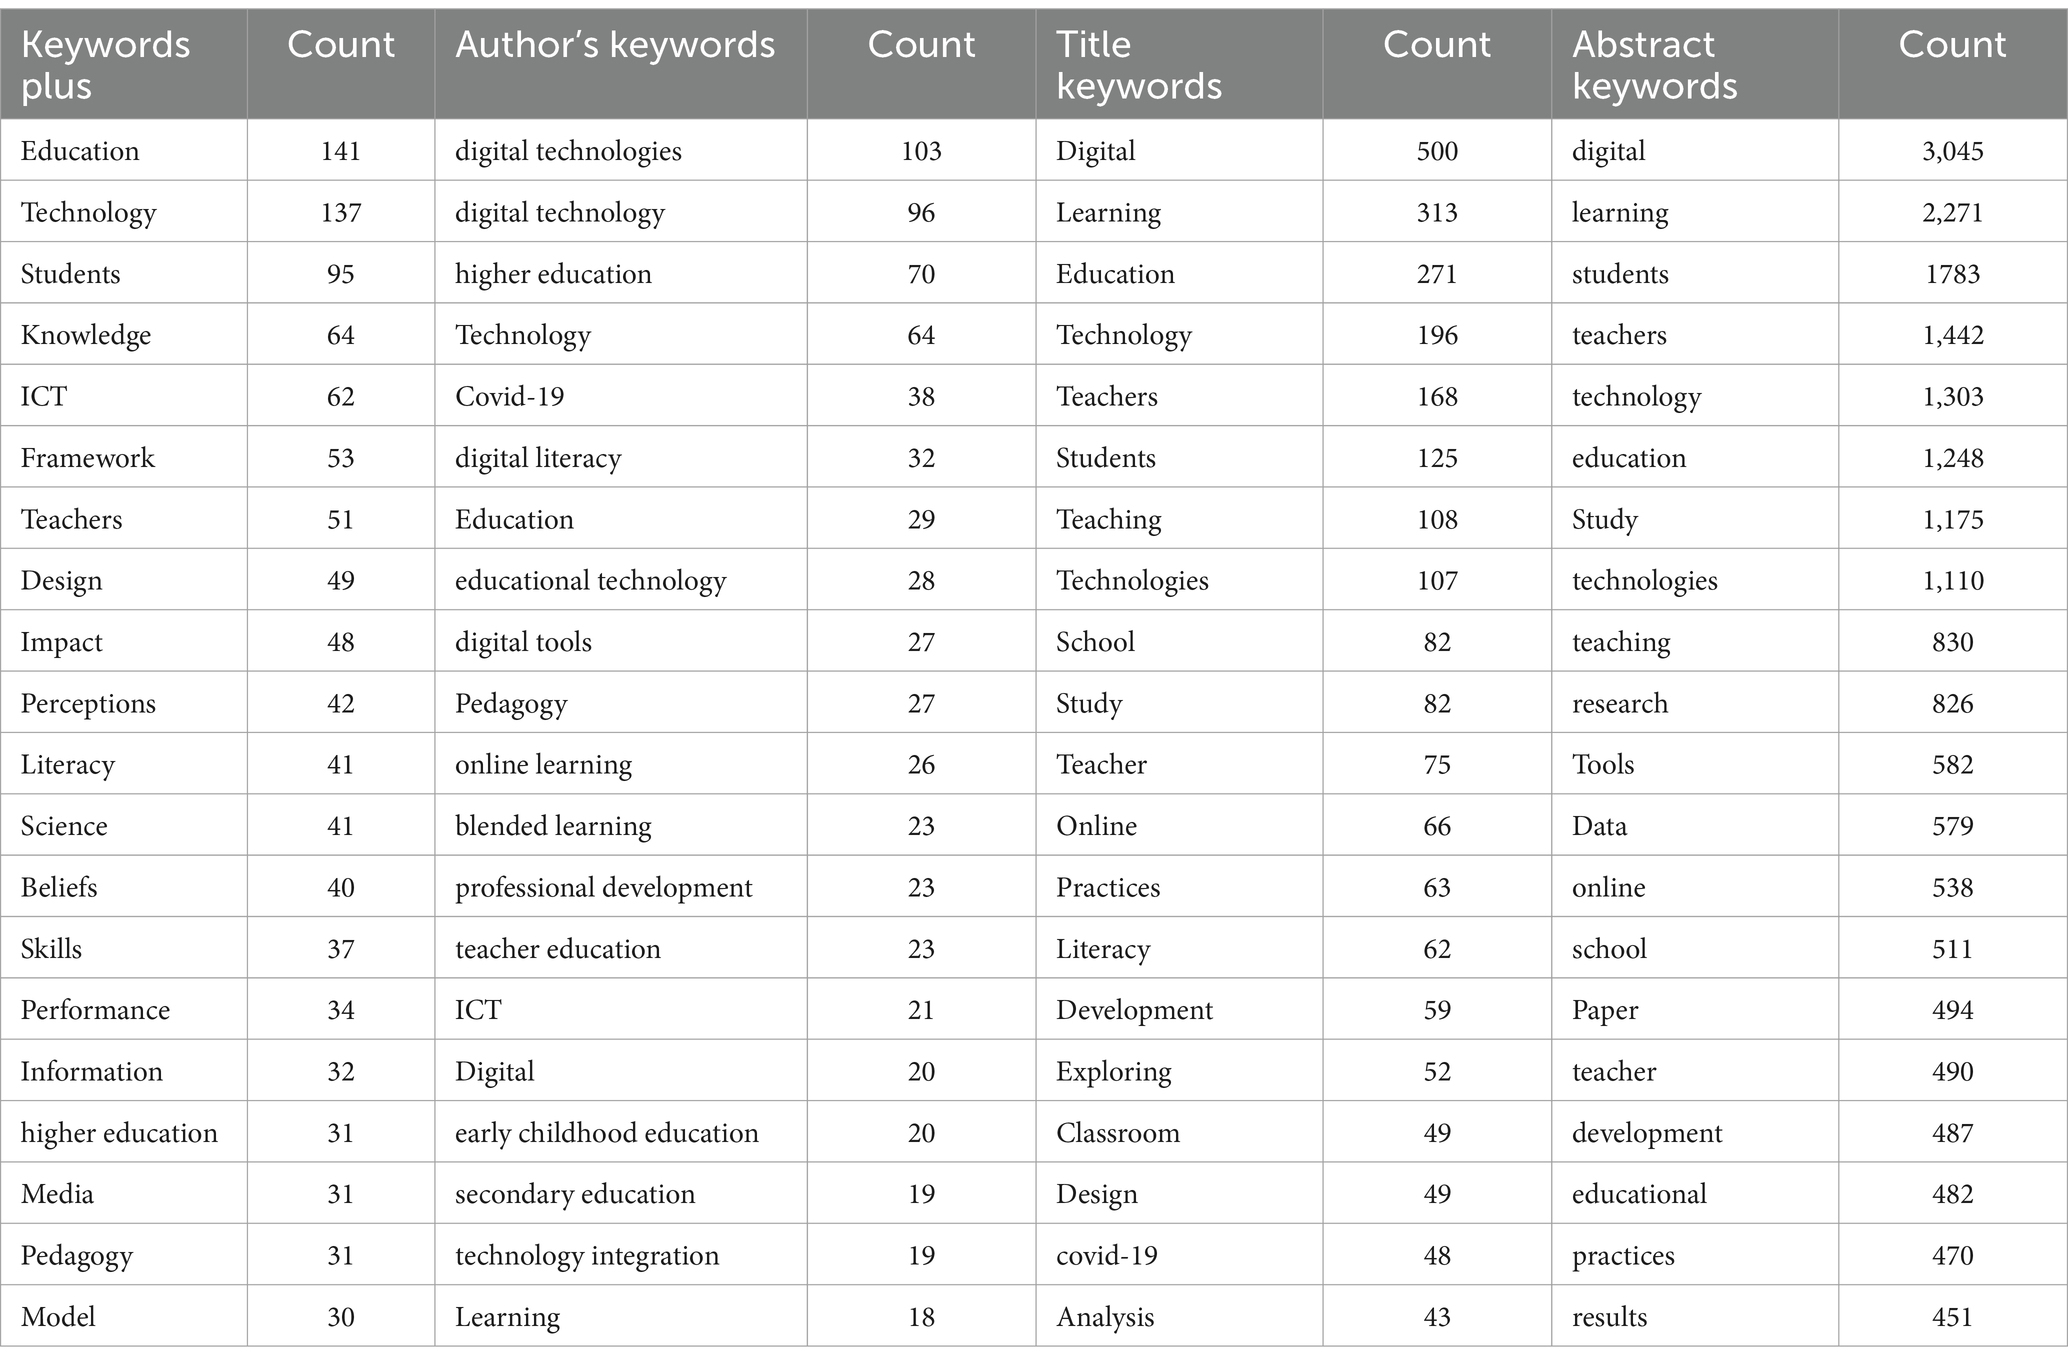
Table 7. Top 20 keywords ranked based on count.
In this section, we presented the findings of scientific mapping to conclude the analysis of digital technologies in the classroom. This involves identifying the conceptual, intellectual, and social structures surrounding the topic. Consequently, we aimed to address the second research question of this study:
RQ2: What are the prevalent structural aspects and hot research topics in digital technologies in classrooms over the last 10 years?
Conceptual structure enables researchers to highlight the relationships among identical terms occurring within a particular collection, referred to as co-occurrences (Ellegaard and Wallin, 2015). It identifies words that frequently appear together in a cluster, revealing conceptual or semantic groupings that research constituents regard as various topics or sub-topics (Aria and Cuccurullo, 2017). A keyword’s bubble became larger the more academics used it. Three standard weight attributes were utilized: links, occurrences, and total link strength. Links and total link strength indicate the number of connections an item has with other items and the cumulative strength of these connections, respectively. The co-occurrence of keywords in digital technologies in classroom research is shown in Figure 5.
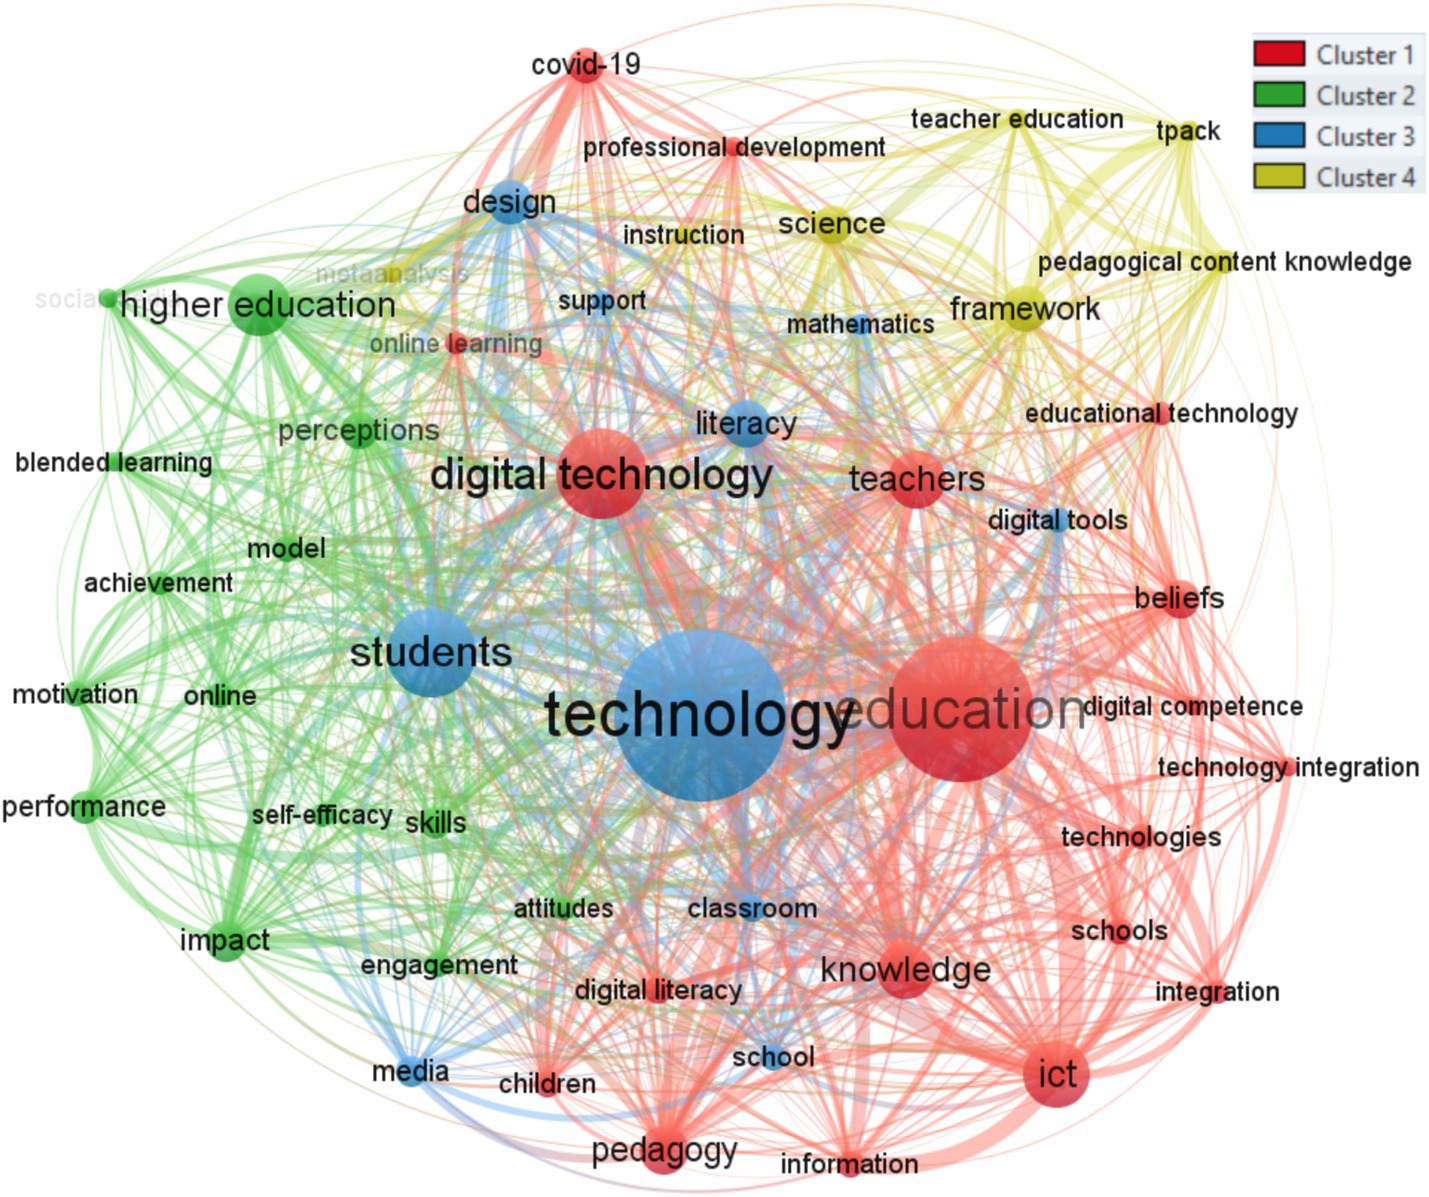
Figure 5. Co-occurrence network.
The primary emphasis of this study is technology or digital technology, which are more prominent nodes. Because those terms frequently occur together in certain instances, cluster 1 indicates that these subtopics or variables are closely related to digital education and pedagogy in COVID-19. Similarly, cluster 2 represents a concept of factors influencing online and blended learning in higher education. Furthermore, cluster 3 represents digital technology integration in classroom design and literacy support. Cluster 4 depicts the evaluation of digital technologies through conceptual frameworks, i.e., tpack. Table 8 presents the distribution of the clusters by frequency of occurrences (top 50 keywords).
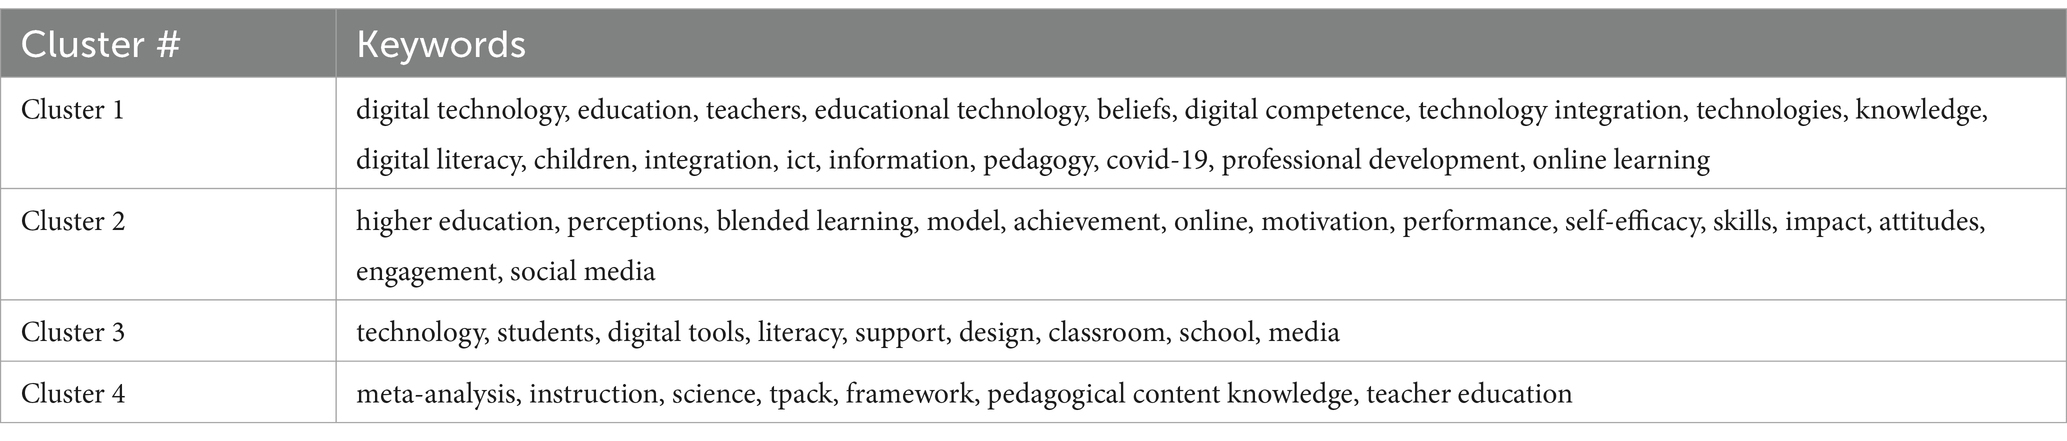
Table 8. Distribution of clusters based on number of occurrences (top 50 keywords).
This study also included a thematic analysis of digital technologies in the classroom. The thematic analysis uncovers themes from keyword clusters and their interconnections. Two crucial aspects defining these themes are density and centrality (Mostafa, 2023). Centrality is depicted along the horizontal axis, which signifies the association level between different themes, while density is represented along the vertical axis, which measures the coherence among nodes (Sinha et al., 2023). Additionally, the cohesion among nodes, representing the density of the field of study, determines its ability to expand and sustain itself over time. The thematic map was created using the walktrap clustering algorithm, acknowledged for its efficiency and effectiveness (Bathla et al., 2023). The thematic map is separated into four quadrants (Q1–Q4), as shown in Figure 6. Basic themes in the lower right quadrant (Q1) highlighted the well-established research themes that are highly pertinent to the field. Themes such as education, students, framework, and perceptions seen in Q1 are crucial for the field’s development. Motor themes are shown in the upper right quadrant (Q2), referring to the dominant or driving topics or areas that attract significant attention and research activity. Themes such as technologies and user acceptance, seen in Q2, suggested that the technology acceptance model or unified theory of acceptance and use of technology framework are essential for the evaluation to integrate digital technologies in classrooms.
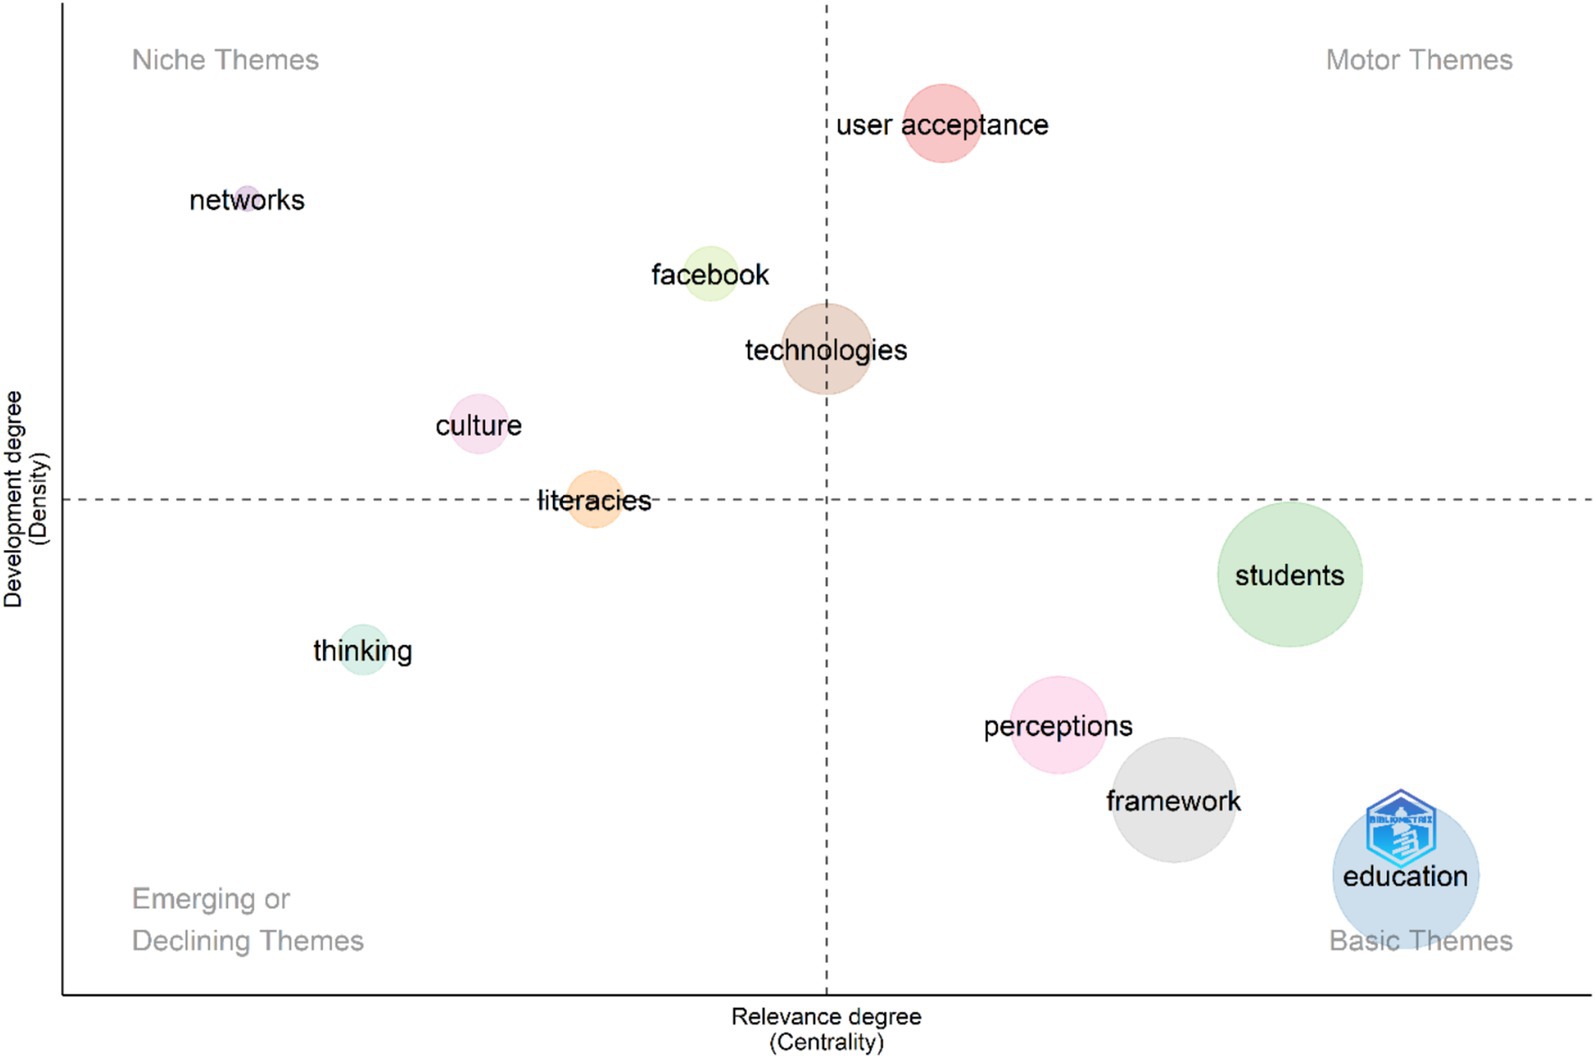
Figure 6. Thematic map.
Niche themes in the upper left quadrant (Q3) represented less explored topics that might not receive as much attention as motor themes but are of significant interest to certain researchers or subfields. These themes were social networks such as Facebook, culture (youth), thinking (users), and networks that can provide insights into research or opportunities for interdisciplinary collaboration. A theme, such as technologies sandwiched between Q2 and Q3, is well-developed and capable of structuring the multidisciplinary research field. The emerging/declining theme of “thinking” in the lower left quadrant (Q4) was determined by prior literature that suggested potential areas for further exploration.
Intellectual structure refers to knowledge organization within a field, determined by co-citation patterns regarding authors, articles, and sources. Co-citation analysis assesses the frequency with which two articles are cited in a third article (Aria and Cuccurullo, 2017; Zupic and Čater, 2015). This connection has been established not by the cited articles but by the third article referencing them (Noyons et al., 1999). Co-citation analysis operates under the assumption that authors cite other works based on their similarity, relevance, and interconnectedness (Callon et al., 1983). Figure 7 illustrates the co-citation network among authors. The size of each node corresponds to how often it is cited alongside others; larger nodes indicate more frequent co-citations. Meanwhile, distinct colors and node placements signify various clusters. Table 9 illustrates the cluster categorization for the author’s co-citation network based on citation count (top 25 authors). Our study utilized article-based co-citation analysis (Figure 8) to discern influential articles shaping the field. Additionally, we employed source-based (journal-based) co-citation analysis (refer to Figure 9).
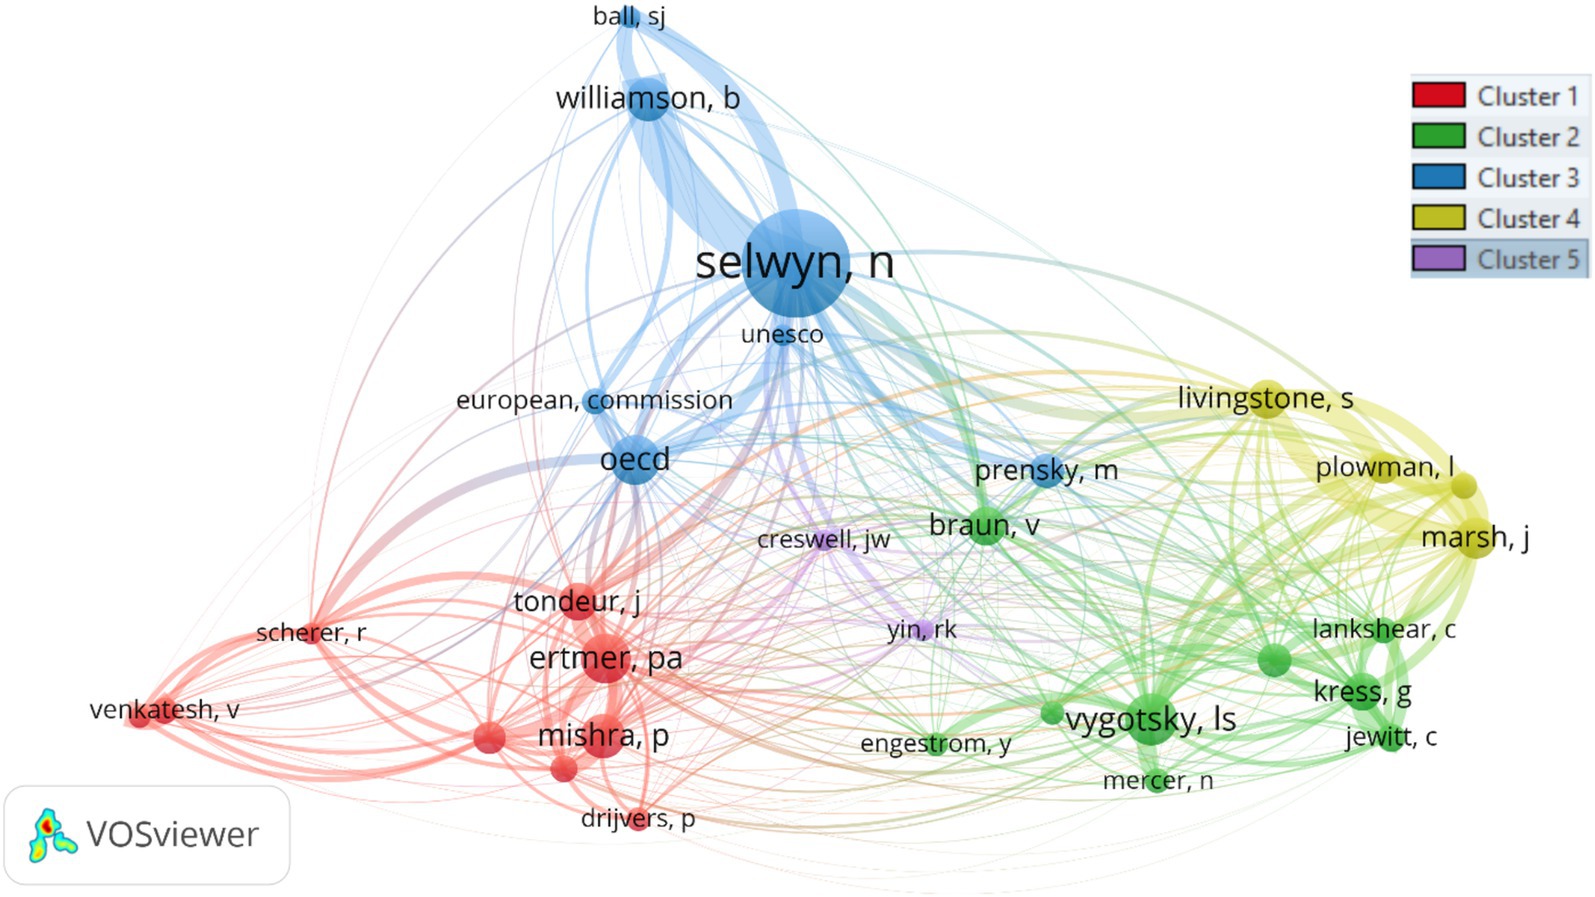
Figure 7. Author-based co-citation analysis.
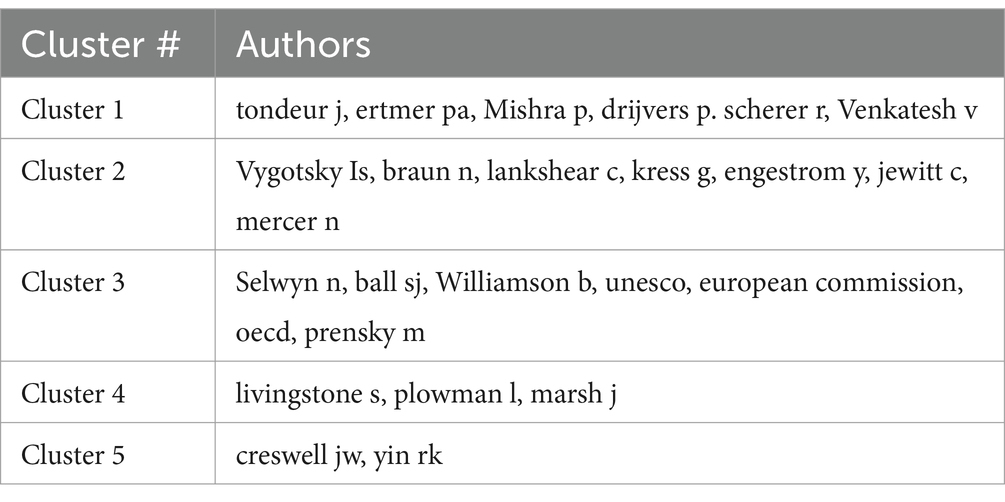
Table 9. Breakdown of clusters for author’s co-citation network based on citation count (top 25 authors).
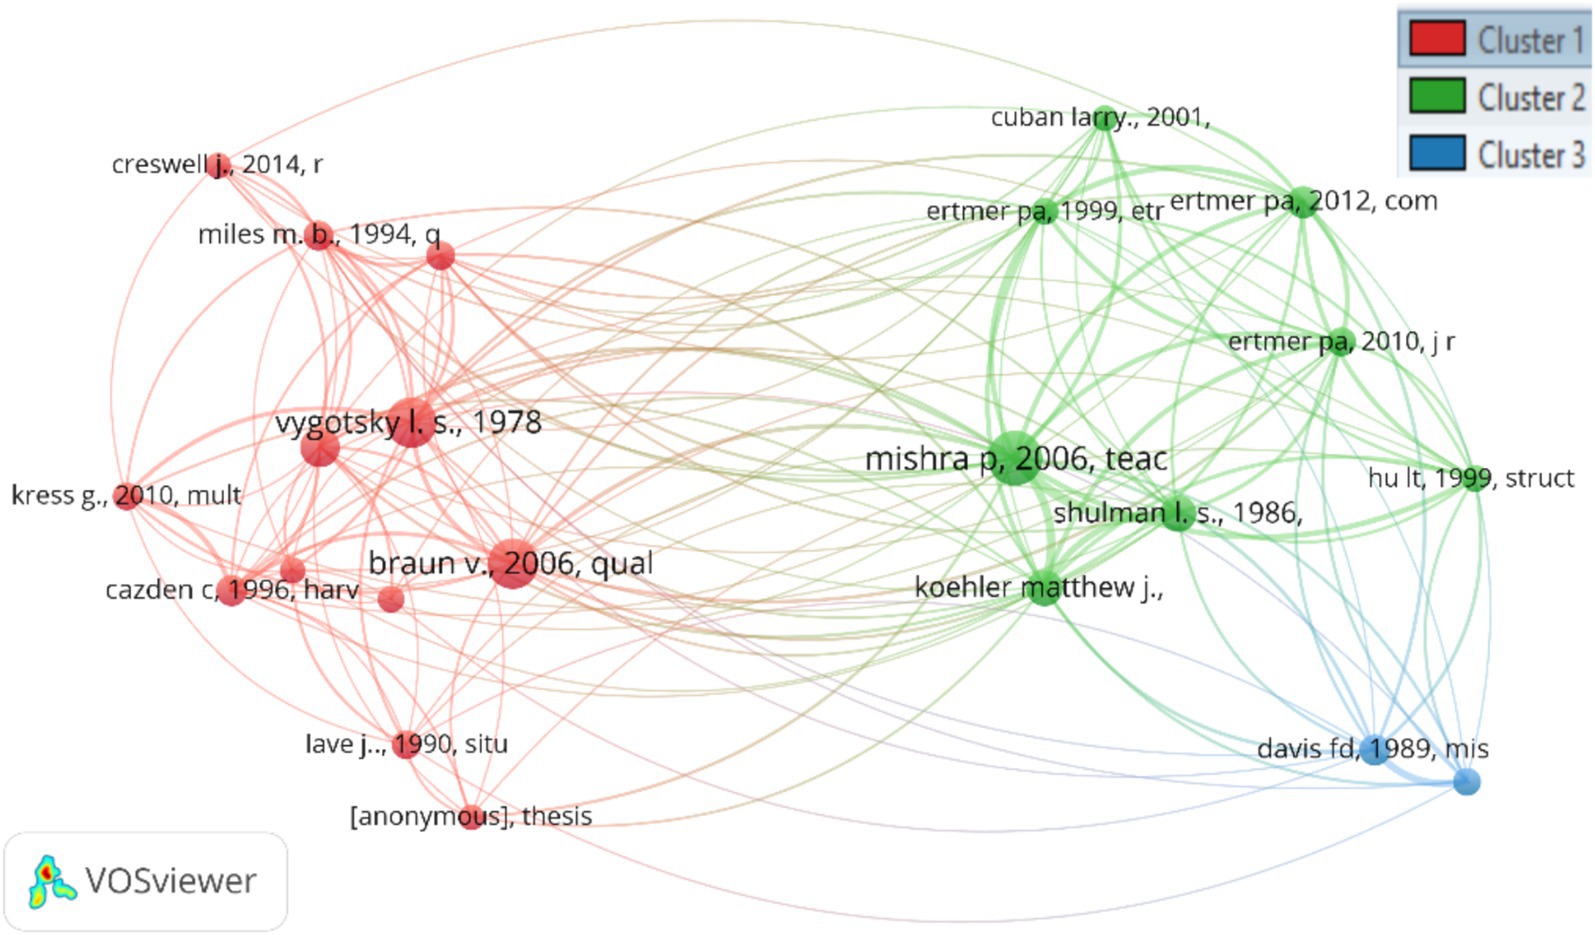
Figure 8. Article-based co-citation analysis.
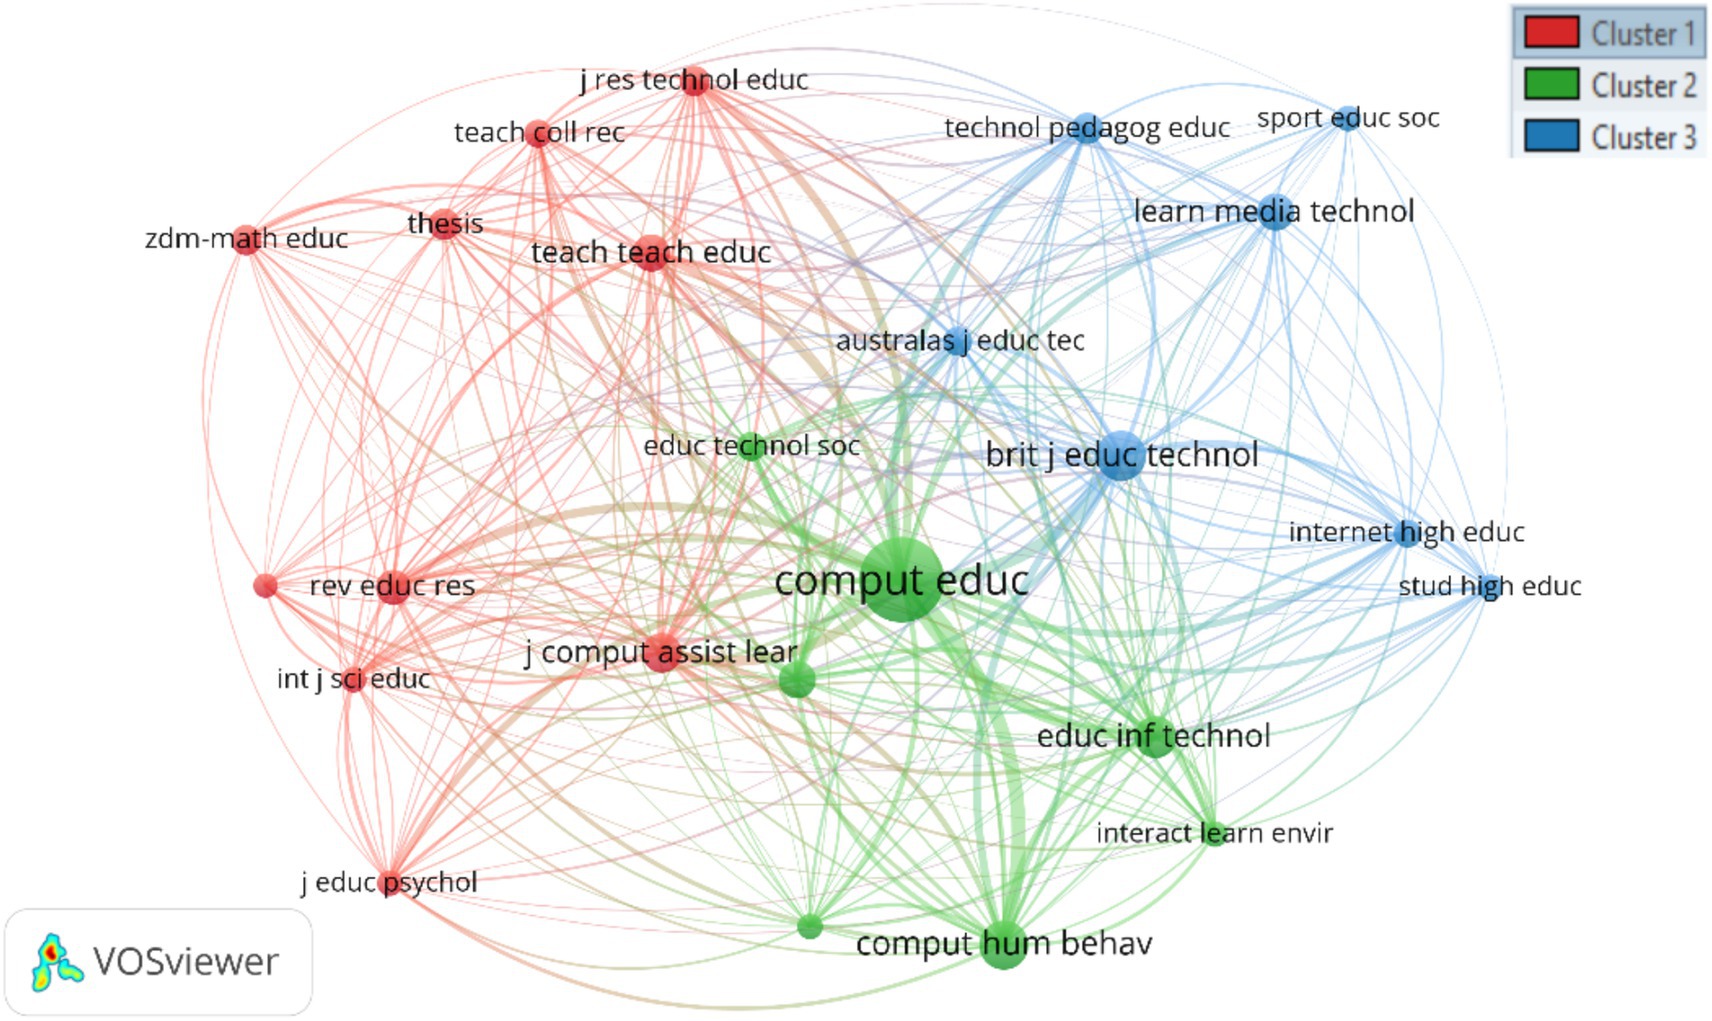
Figure 9. Source-based co-citation analysis.
Author-based co-citation analysis revealed five clusters in which cluster 1 discussed technology acceptance regarding teachers and students in classrooms. Ertmer (1999) worked on technological change, especially teacher beliefs, knowledge, and confidence about digital technologies in classrooms (Ertmer, 2005; Ertmer and Ottenbreit-Leftwich, 2010). Mishra and Koehler (2006) designed a framework for the complex dynamics of teachers incorporating technology into their pedagogical practices. Similarly, Tondeur et al. (2012) and Tondeur et al. (2016) explored strategies for training pre-service teachers in technology integration and developed a tool to assess their perceived support and training adequacy.
Venkatesh proposed TAM1 (Venkatesh, 2000), TAM2 (Venkatesh and Davis, 2000), TAM3 (Venkatesh and Bala, 2008), and the unified theory of acceptance and use of technology (Venkatesh et al., 2003) framework to evaluate the integration of digital tools in diverse settings. Cluster 2 is formed around the works of Vygotsky, Braun, Kress, and others. Key foundational ideas on emphasizing the sociocultural context are used to shape cognitive growth (e.g., Vygotskij and John-Steiner, 1979), thematic analysis to understand student’s perceptions (e.g., Braun and Clarke, 2006; Braun and Clarke, 2021), learning design in the digital age (e.g., Kress, 2005; Kress, 2003), and new literacies in the classroom (e.g., Lankshear and Knobel, 2006; Lankshear and Knobel, 2003) are central to this cluster. The authors in cluster 3 contributed to the field by providing digital technologies governance in education, broadly categorized under advantages and disadvantages of educational technology in the classroom (e.g., Selwyn, 2011; Selwyn, 2007), digital governance in education (e.g., Williamson, 2016b; Williamson, 2016a), and students as digital immigrants (Prensky, 2001). Selwyn, Williamson, and Prensky are the key authors of this cluster. Scholars in cluster 4 laid the foundations for the theme of digital technology for young children in school (e.g., Livingstone et al., 2014; Plowman and Stephen, 2007; Marsh et al., 2017). Cluster 5 provided the foundation for the theme of qualitative and quantitative evaluation of technological integration in classrooms (e.g., Creswell and Poth, 2016; Yin, 2009).
Article-based co-citation analysis revealed three clusters in which Vygotskij and John-Steiner (1979) and Braun and Clarke (2006) from cluster 1 are the most foundational articles. In cluster 1, the co-cited articles laid the foundation for a basic understanding of technology integration in classrooms (e.g., Vygotskij and John-Steiner, 1979; Braun and Clarke, 2006; Miles and Huberman, 1994).
They also provided foundational research on the sociocultural contexts in shaping cognitive growth (e.g., Vygotskij and John-Steiner, 1979) and thematic analysis to understand student’s perceptions (e.g., Braun and Clarke, 2006; Miles and Huberman, 1994). Mishra and Koehler (2006) article positioned the foundation of the research on a framework for the complex dynamics of teachers incorporating technology into their pedagogical practices. Mishra and Koehler (2006) was co-cited with other articles co-authored by Koehler and Mishra (2009) in cluster 2. Articles in Cluster 3 formed the basis for the themes of user acceptance of digital technologies (Davis, 1989; Venkatesh et al., 2003). Table 10 presents the cluster classification for the article’s co-citation network, organized by citation count (top 15 articles). Source-based co-citation analysis revealed three clusters of foundational journals. The “Journal of Computer-Assisted Learning,” “Teaching and Teacher Education,” “Journal of Research on Technology in Education,” and “ZDM-Mathematics Education” are the key journals that form cluster 1. The Journal of “Computers & Education” is the highest co-cited journal. It was co-cited with “Education and Information Technologies,” “Computer and Human Behavior,” and “Educational Technology & Society” in cluster 2. Cluster 2 also had the highest number of citations among all clusters. The “British Journal of Educational Technology,” “Learning Media and Technology,” “Technology Pedagogy and Education,” and “Internet and Higher Education” form cluster 3. Table 11 shows the source-based co-citation analysis clustered by citation count (top 20 sources).
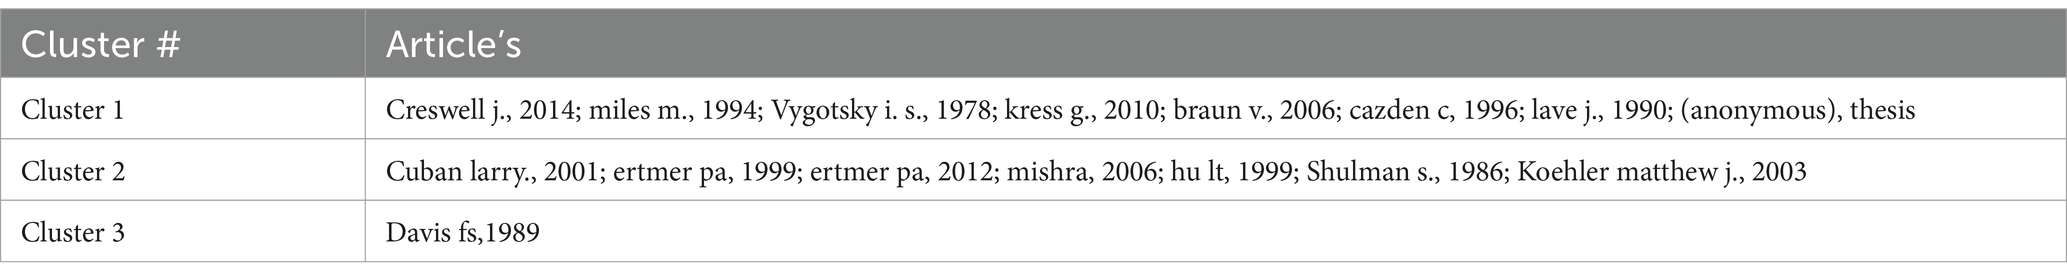
Table 10. Cluster grouping of article-based co-citation analysis grounded on citation count (top 15 articles).
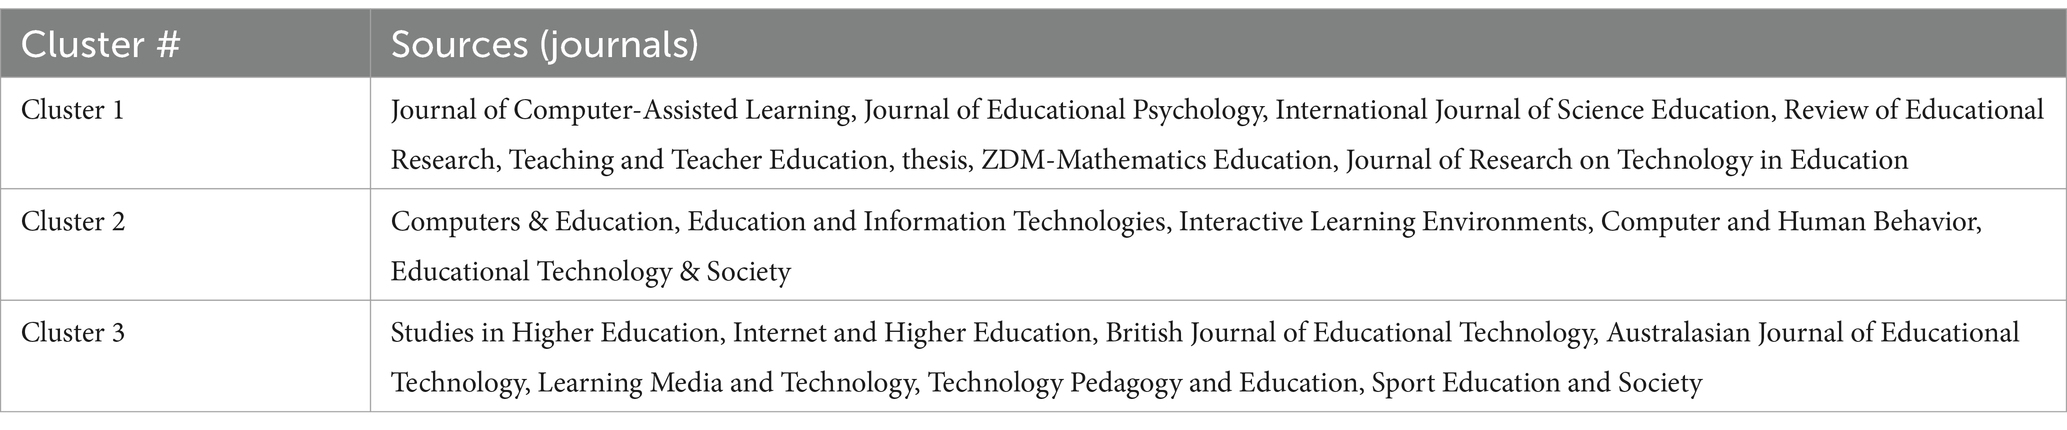
Table 11. Co-citation analysis of sources clustered according to citation count (top 20 sources).
Social structure in bibliometric analysis refers to the network of collaborations and interactions among researchers or countries within the scholarly community, typically examined through co-authorship networks or collaboration analysis (Aria and Cuccurullo, 2017). This section discussed the collaboration between authors and countries in classrooms regarding digital technologies. Author collaboration was assessed using betweenness and closeness centrality, commonly employed metrics for analyzing collaboration networks (Noyons et al., 1999). The nodes’ sizes correspond to the number of articles, while the connections between nodes represent the intensity of collaboration (Aria and Cuccurullo, 2017). Scholars who collaborate closely are clustered together and distinguished by various colors. The biggest group (red) includes 10 scholars, and the three Australian authors (Selwyn, Henderson, Pangrazio, Nemorin, and Bulfin) are at the center of this cluster, as shown in Figure 10. Other groups (grey) include five scholars from Switzerland (Petko, Schmid, Cattaneo, Antonietti, and Schmitz), the pink group is formed around the UK scholars (Warwick, Cook, Major, and Hennessy), and (the brown group) belongs to Netherlands (Bakker, Drijvers, and Sinclair). There are only four groups with more than three scholars, while the number of authors in the remaining groups is minimal. Author collaboration grouping through Walktrap algorithm (including betweenness, closeness, and PageRank metrics) is presented in Table 12.
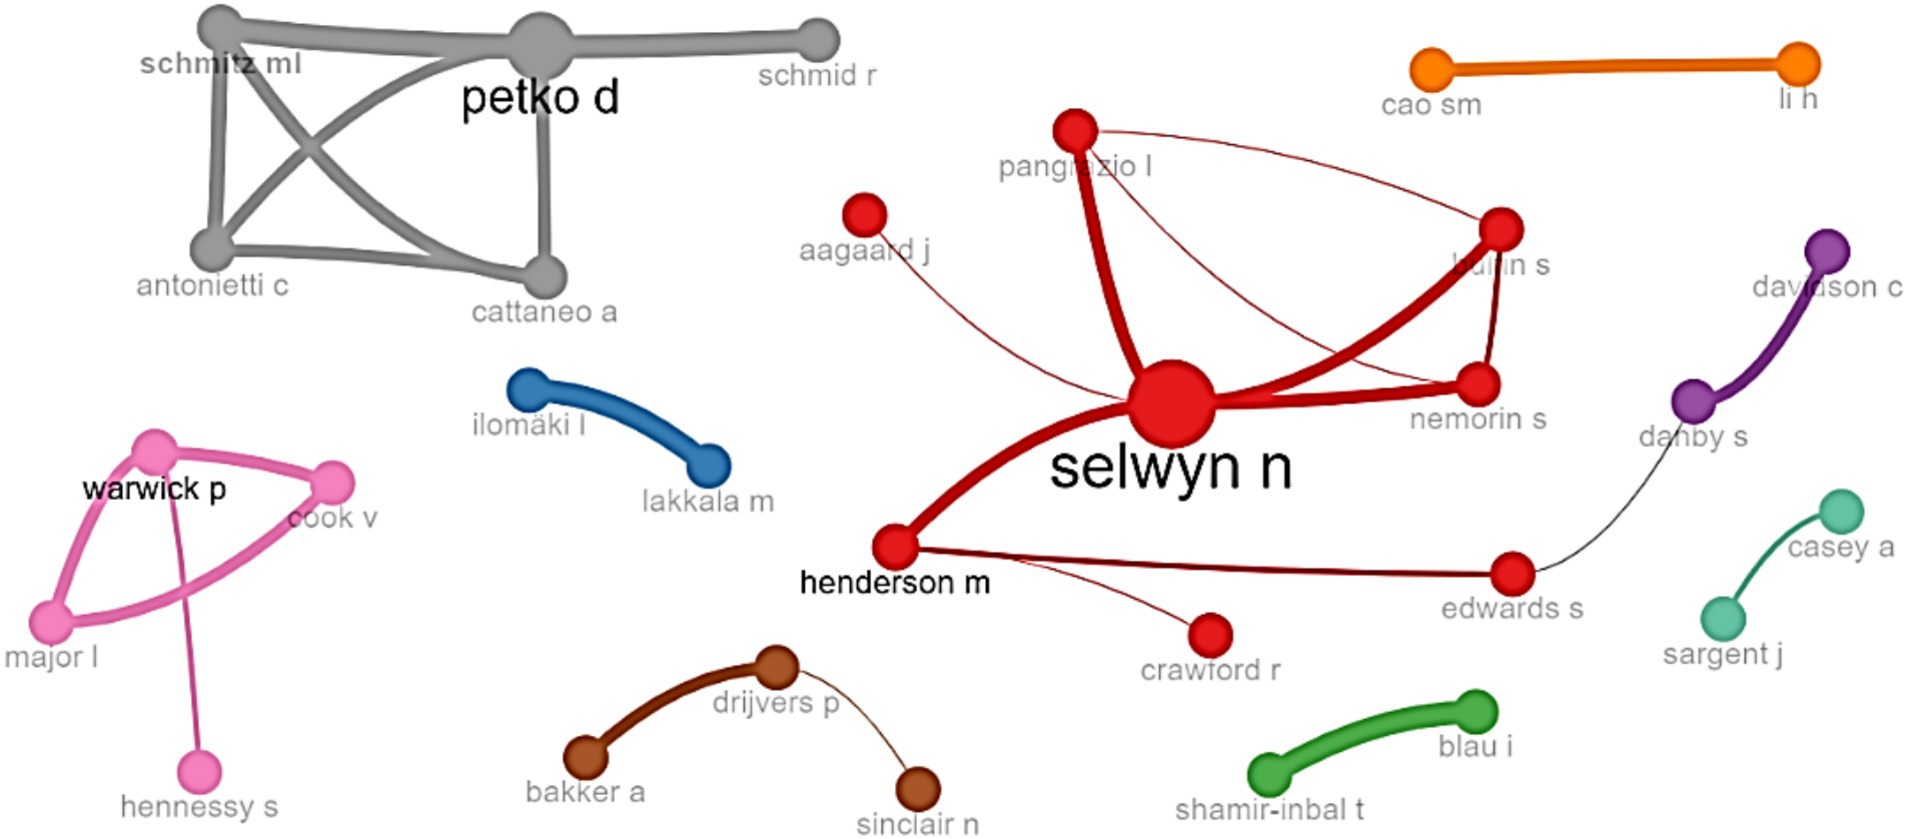
Figure 10. Author’s collaboration network.
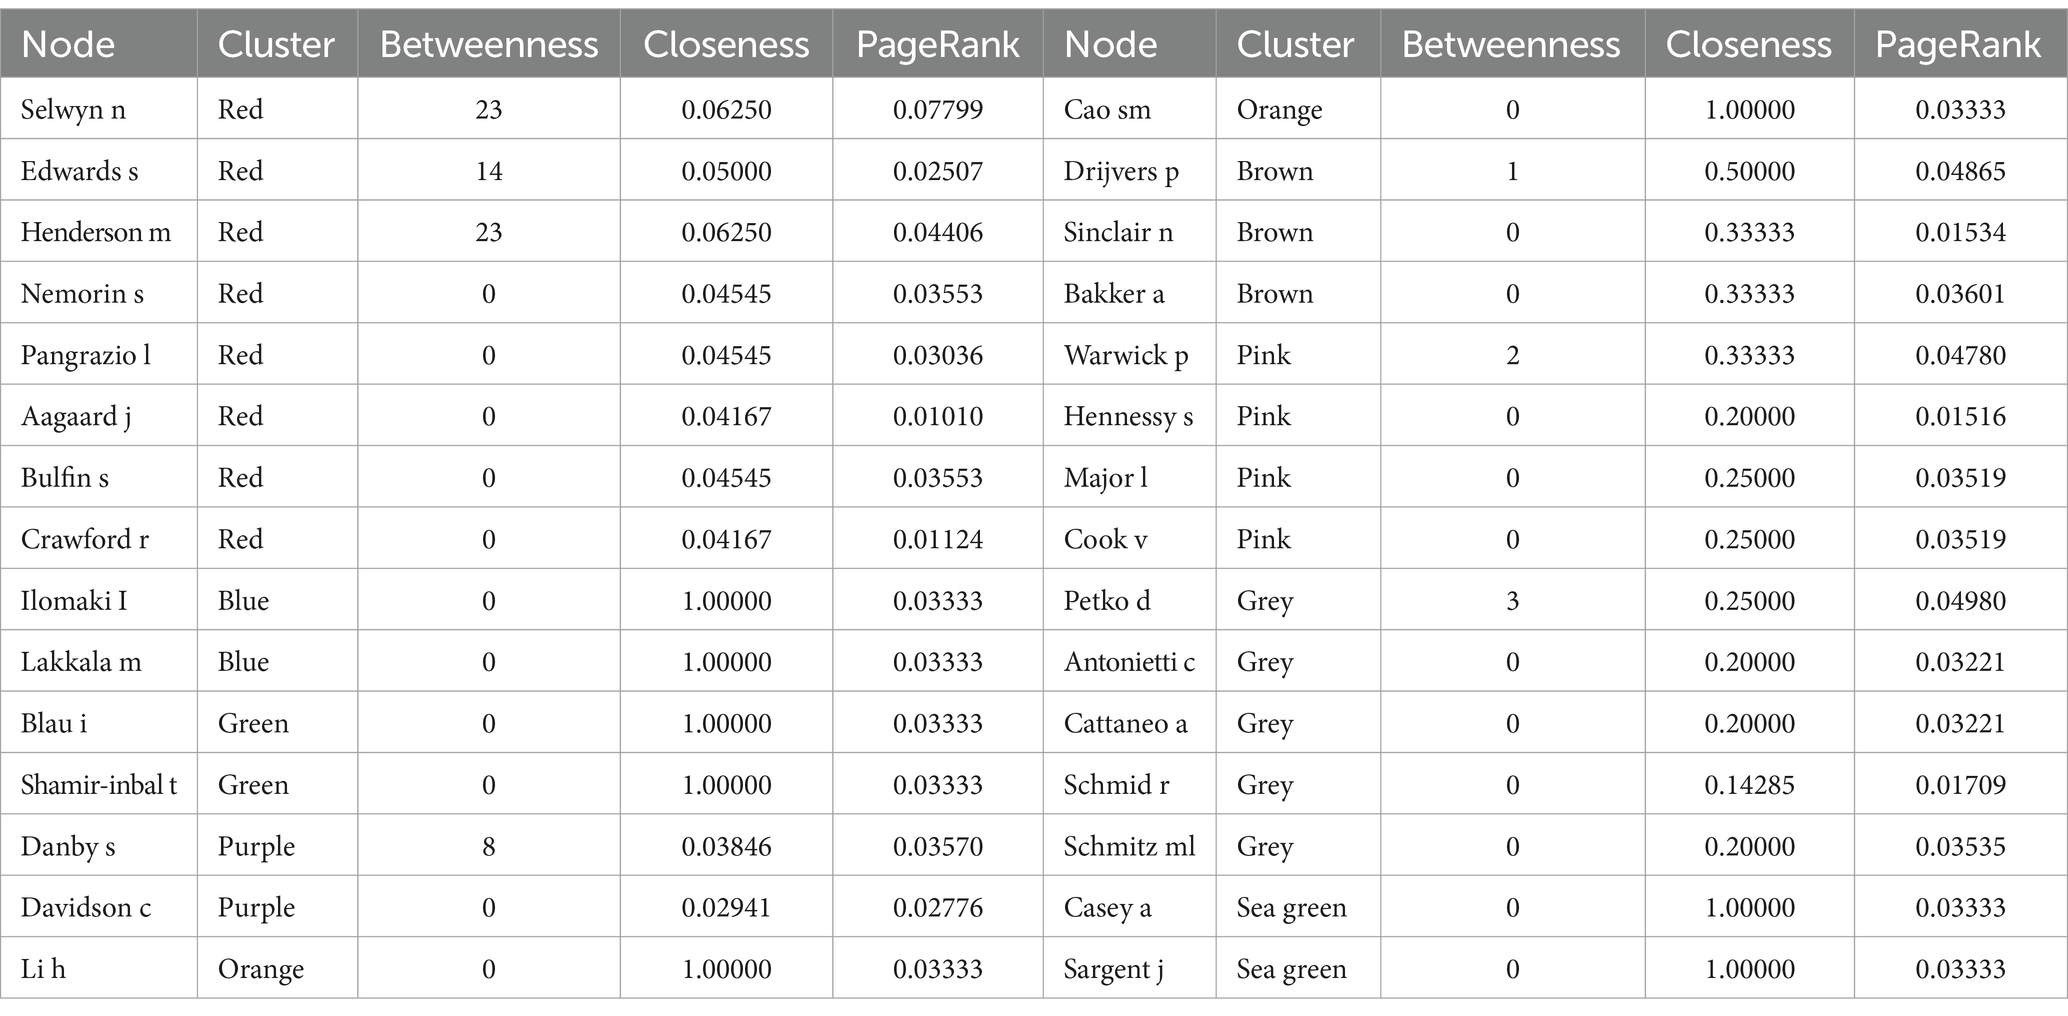
Table 12. Grouping of author’s collaboration through Walktrap algorithm (betweenness, closeness, pageRank).
The cross-country collaboration network facilitates collaborative efforts among partner countries. Every node symbolizes a country, with its size reflecting the volume of publications. The thickness of the lines connecting nodes correlates with the level of collaboration between countries (Aria and Cuccurullo, 2017). The countries collaborating with others include Australia, the UK, the USA, China, Australia, and Spain, as indicated in Figure 11.
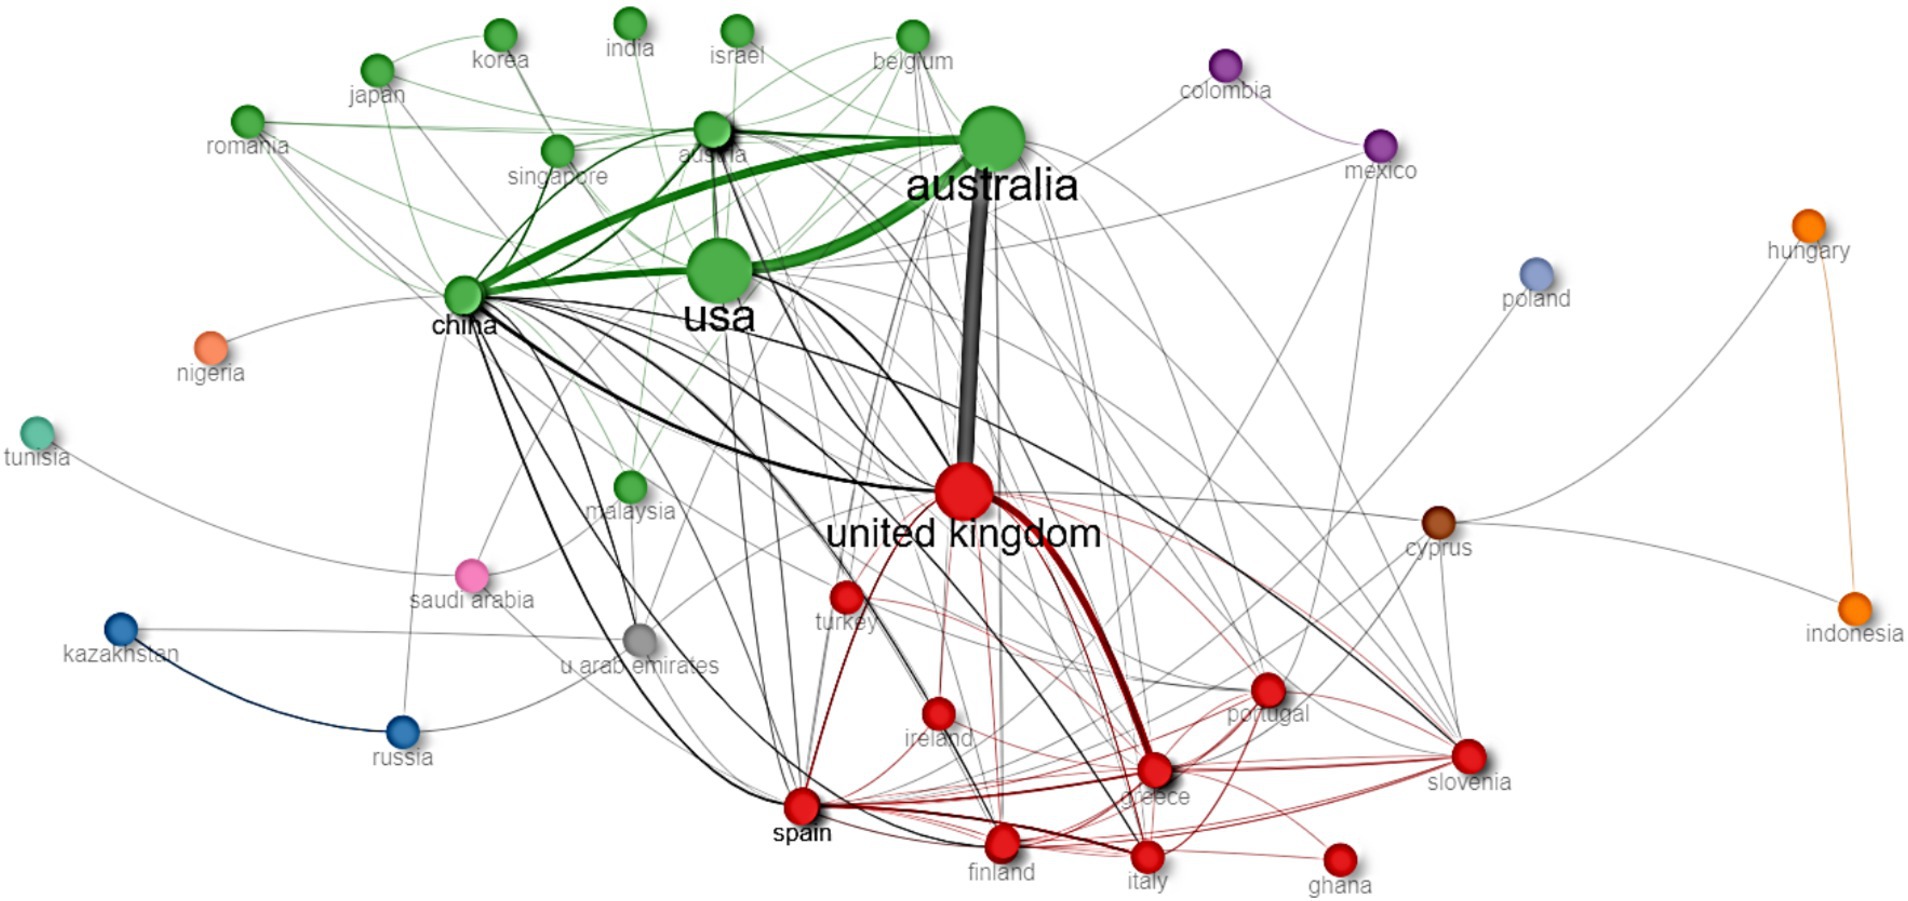
Figure 11. Cross-country collaboration network.
Australia and the UK have the highest collaborations in digital technologies in classrooms, followed by Australia and the USA, the USA and China, and Australia and China. Two more prominent clusters can be identified. The biggest (green) includes Australia, the USA, China, and other countries (Singapore, Belgium, Israel, India, Korea, Japan, Romania, and Austria). The second cluster (red) includes nine countries, and the UK is in the center, including Spain, Finland, Italy, Ghana, Slovenia, Portugal, Turkey, Ireland, and Greece. However, other clusters have a limited number of collaborations among countries. Cross-country collaboration through the Walktrap algorithm (betweenness, closeness, and PageRank) is presented in Table 13.
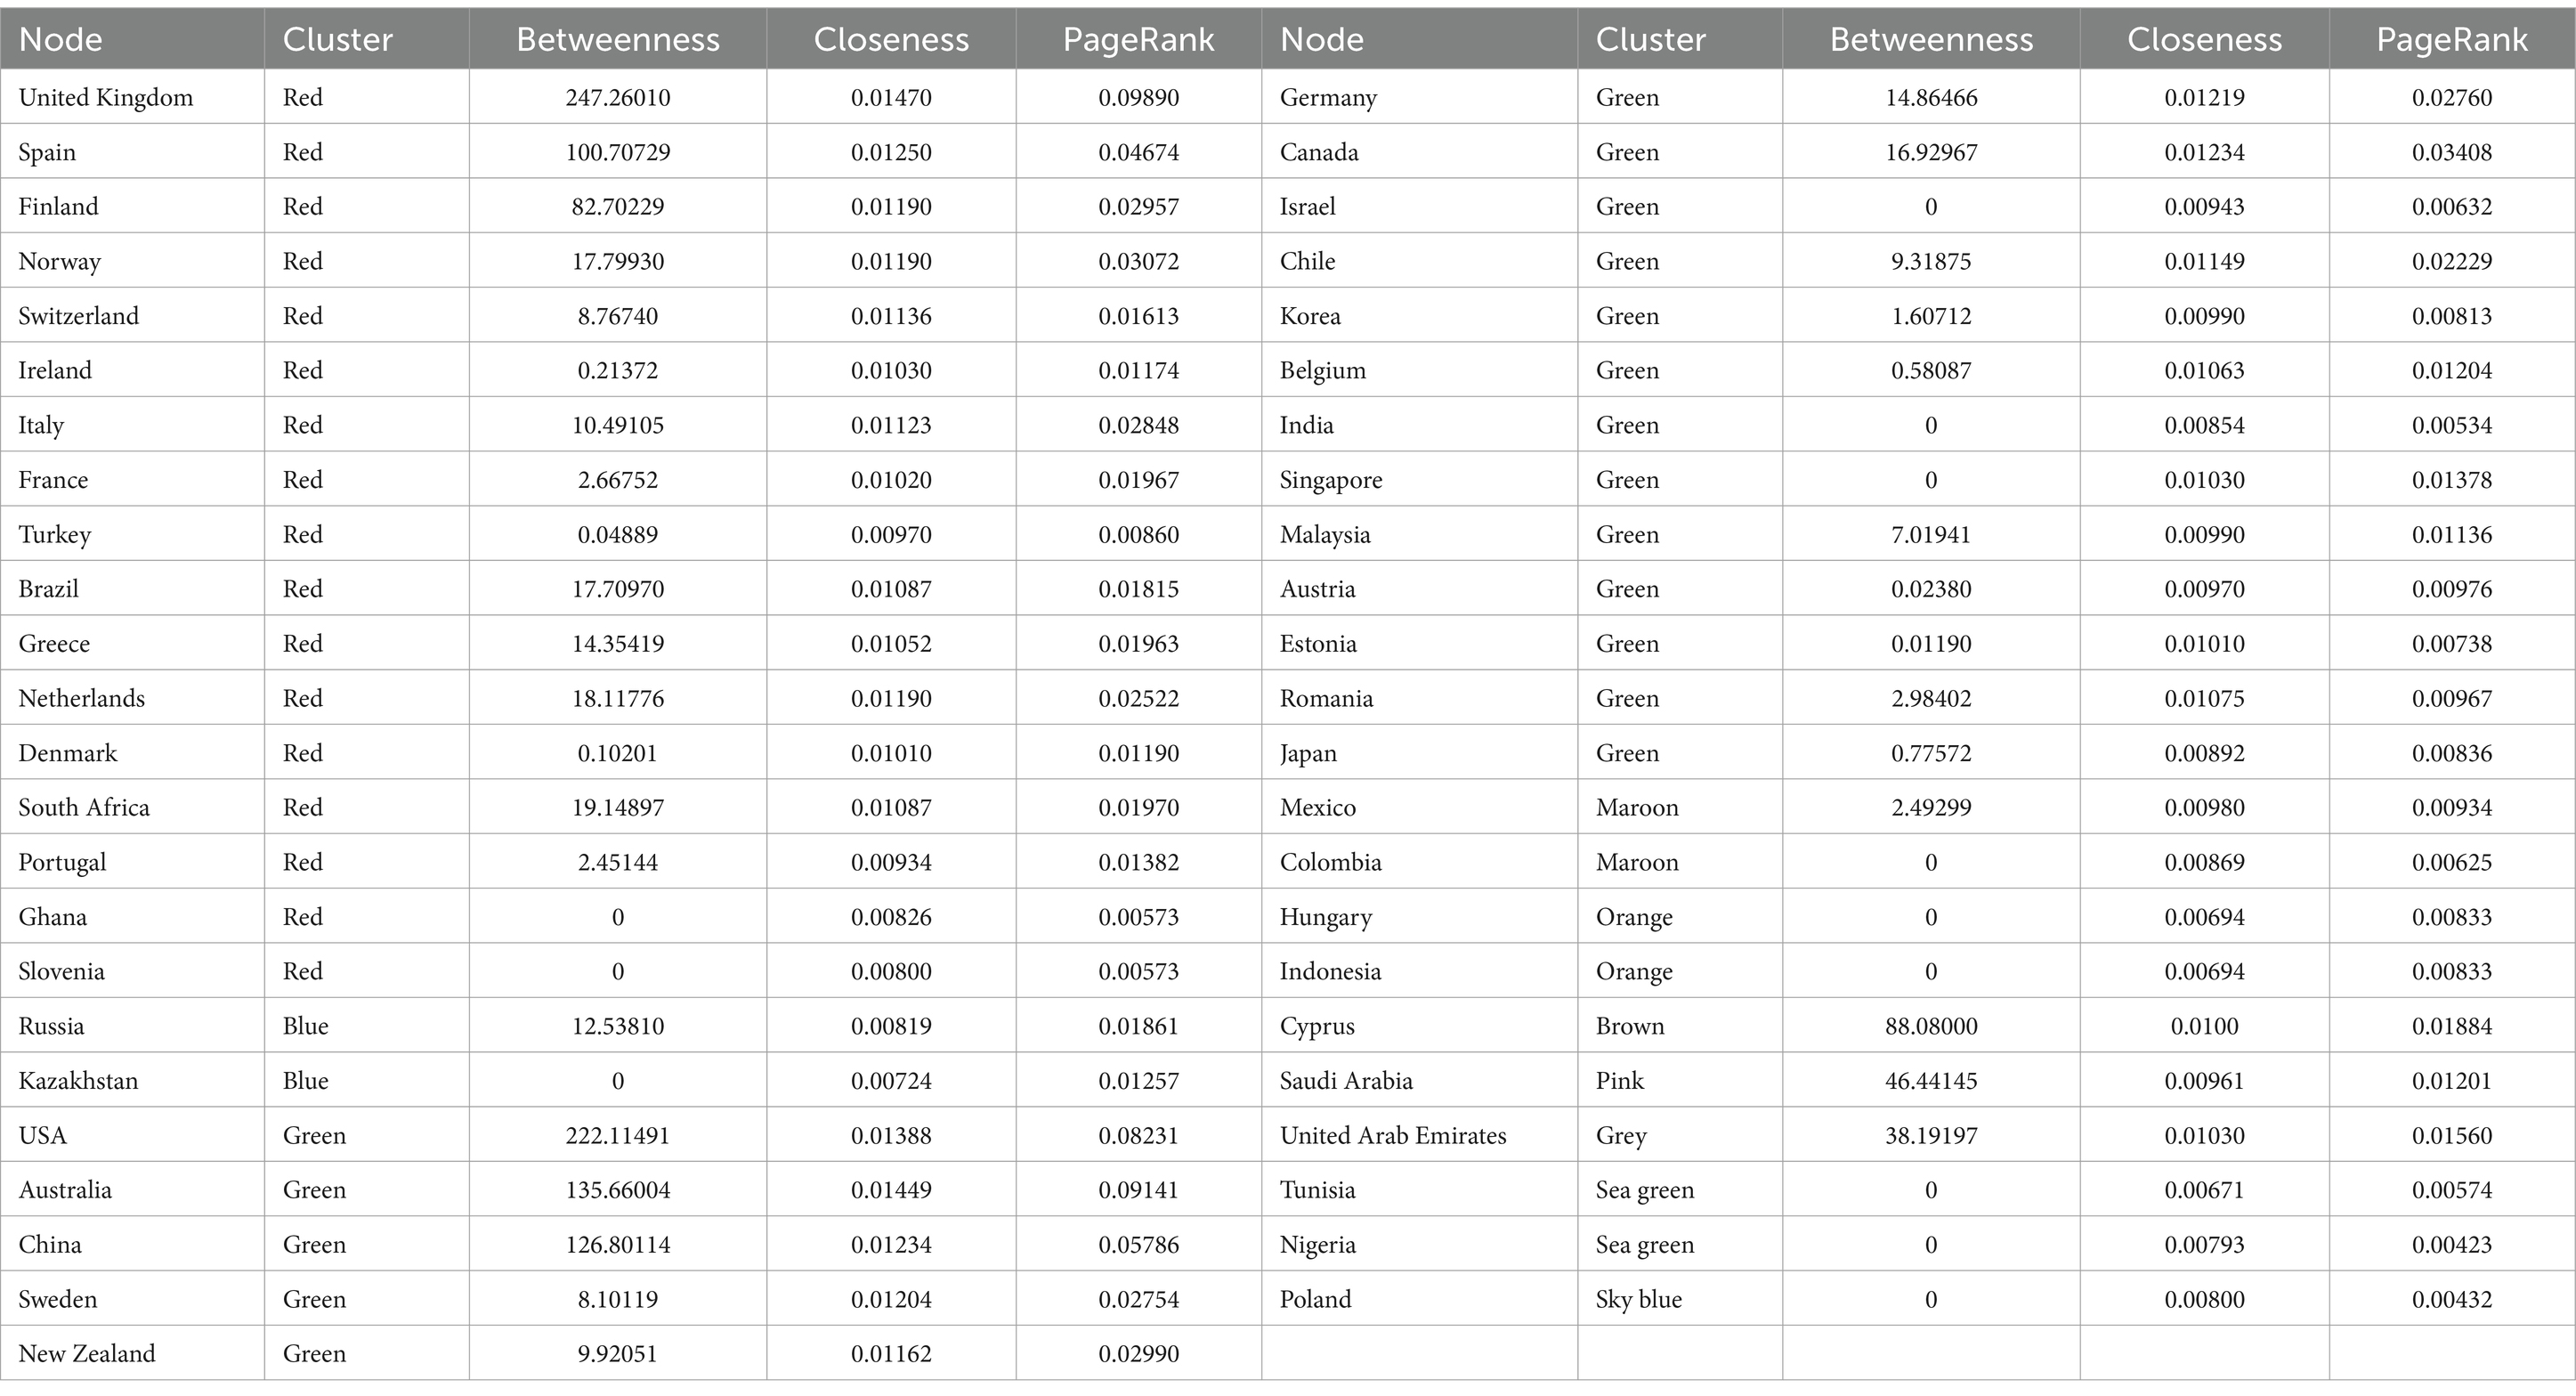
Table 13. Cross-country collaboration through Walktrap algorithm (including betweenness, closeness, and PageRank metrics).
In this study, we conducted a bibliometric analysis to address the research questions outlined earlier, focusing on digital technologies in the classroom. Our research enriches the field of digital technologies in the classroom by exploring performance analysis and scientific mapping over the past decade of digital technologies in the classroom. Previous research using bibliometric analyses has demonstrated their effectiveness in identifying trends and providing information for decision-making in educational contexts (Huang et al., 2020; Li and Wong, 2022). For example, such analysis has shed light on the adoption rates of digital tools in classrooms, guiding the development of educational policies and frameworks to support technology integration (Hao et al., 2020). The majority (72.2%) of the articles were published in the most recent 5 years, contrasting with only 27.8% published from 2014 to 2018. This trajectory, coupled with supporting data from longitudinal studies (e.g., Harju et al., 2019) suggests that this growth is likely to persist. The influential journal analysis reveals a notable recognition and popularity of articles contributing to advancing digital technologies in classroom settings, particularly since 2014. The top 20 most popular journals (Table 3) contain 47.55% of articles, and 23 published at least 10 papers between 2014 and 2023. This research will help scholars identify the top-tier journals in this interdisciplinary field based on PC, CC, H-index, IF, SJR, Citescore, and SNIP (Table 2), given the rapid spread of predatory journals in recent years, which pose a global threat to the integrity of scientific research (Strong, 2019). Most productive authors are from research institutions in developed countries, such as the “Monash University” in Australia, “the University of Gothenburg” in Sweden, “the University of London” in the UK, and “the University of Limerick” in Ireland. The absence of scholars from developing countries in Tables 4, 5 is noticeable because developed countries (for example, the United States, the United Kingdom, Netherlands, Switzerland, China, and Australia) have contributed significantly to the global literature. This disparity may attributed to factors such as limited funding, research infrastructure, and lack of international networks (Zaman et al., 2018). These disparities can be incorporated by increased funding, international collaborations, and capacity-building initiatives to ensure more inclusive and globally relevant research.
We went beyond highlighting the performance analysis and revealed the scientific mapping of digital technologies in the classroom, particularly its conceptual, intellectual, and social structure. The conceptual structure enabled the identification of four different research directions related to digital technologies in the classroom. These research topics focused on digital education and pedagogy in COVID-19, factors influencing online and blended learning in higher education, digital technology integration in classroom design, and literacy support and evaluation of digital technologies through technology acceptance frameworks (Alabdulaziz, 2021). Moreover, the outcomes of remote learning were mixed, with some studies indicating that students faced difficulties in maintaining engagement, motivation, and academic performance (Kumi-Yeboah et al., 2020; Alabdulaziz, 2021; Bergdahl and Bond, 2022). The analysis revealed four quadrants to understand the conceptual structure: basic themes like education, students, and frameworks; motor themes like technologies and user acceptance; niche themes like social networks and culture; and emerging/declining themes like “thinking.” Co-citation patterns regarding authors, articles, and sources determined the intellectual structure. Author-based co-citation analysis revealed various clusters: technology acceptance in classrooms (Alabdulaziz, 2021), thematic analysis to understand student perceptions (Braun and Clarke, 2021; Miles and Huberman, 1994), digital technologies governance in education (Williamson, 2016b; Williamson, 2016a), and qualitative and quantitative evaluation of technological integration in classrooms (Creswell and Poth, 2016; Yin, 2009). Article-based co-citation analysis revealed three clusters of foundational articles: the sociocultural context in shaping cognitive growth (Vygotskij and John-Steiner, 1979) and thematic analysis to understand students’ perceptions (Braun and Clarke, 2006), complex dynamics of teachers incorporating technology into their pedagogical practices (Mishra and Koehler, 2006), and user acceptance of digital technologies (Davis, 1989; Venkatesh et al., 2003). Source-based co-citation analysis revealed three clusters: The “Journal of Computer-Assisted Learning,” “Teaching and Teacher Education,” “Journal of Research on Technology in Education,” and “ZDM-Mathematics Education”; The “British Journal of Educational Technology,” “Learning Media and Technology,” “Technology Pedagogy and Education,” and “Internet and Higher Education”; “Education and Information Technologies,” “Computer and Human Behavior,” and “Educational Technology & Society.” Social structure analyzed the collaboration of authors and countries in which the most significant group includes (Selwyn, Henderson, Pangrazio, Nemorin, and Bulfin). There are only four groups with more than three scholars, while the number of authors in the remaining groups is minimal. The cross-country collaboration network facilitates collaborative efforts among partner countries. The countries collaborating with others include Australia, the UK, the USA, China, Australia, and Spain, as indicated in the collaboration map. Australia and the UK have the highest collaborations in digital technologies in classrooms, followed by Australia and the USA, the USA and China, and Australia and China.
Digital technologies have several educational benefits, such as increased accessibility, better engagement, personalized learning, and flexible learning environments (Cohen et al., 2022). Some researchers also pointed out significant institutional challenges, such as a lack of technology-driven culture, limited assistance for teachers, and a lack of proper training (Okoye et al., 2023), Institutional settings lacking ethical conduct, transparency, and accountability, which discourage teachers from adopting substantial reforms (McGarr and McDonagh, 2021); and an institutional skepticism about the potential risks of implementing new technologies (Cohen et al., 2022). Technical concerns must be resolved to make these tools practical (Ferrante et al., 2024). Additionally, the availability of adequate resources to meet demand is a concern; teachers can only plan courses featuring new technologies if classrooms have the necessary equipment (Okoye et al., 2023; Yildiz Durak, 2021). Furthermore, geographical differences show notable adoption gaps, especially in developing countries or regions with inadequate resources and infrastructure. While current challenges in integrating digital technologies in classrooms present obstacles, they also pave the way for future opportunities to innovate and enhance the educational experience. Digital technology integration in classroom instruction has become pervasive and continuously expanding to facilitate classroom dynamics (Harju et al., 2019). Hence, the focus should extend beyond whether digital technologies should be employed in classrooms or how they can be utilized in the classroom context (Kumi-Yeboah et al., 2020; Tondeur et al., 2012). Instead, attention should be directed toward optimizing the incorporation of diverse technologies to enhance the effectiveness and productivity of learning (Howard et al., 2015). The focus should be on recent technological advancements, such as artificial intelligence and virtual reality, and their applications in the classroom (Bathla et al., 2023). The blended or online mode needs to be harmonized with learning using digital technologies and digital learning materials. This also leads to project-based learning, flipped learning, adaptive learning, and using student data analysis to support teaching through personalizing learning (Britain, 2019). Teacher’s digital competence is not just about digitizing lectures or using software to prepare lessons but also about integrating tools for teaching methods, classroom management, and student interaction into the digital space (Luo et al., 2021). Teachers should be equipped with approaches to integrate digital tools into pedagogy, aligning them with curriculum goals and distinct student demands. Adopting digital tools requires professional development for teachers to improve their digital literacy efficiently. Policymakers should focus on teachers’ digital literacy and the digital gap and provide equal access to digital resources. Furthermore, digital technologies could also make evidence-based decisions that optimize their use in education. Artificial intelligence-based tools should be provided to the institutions to support instructional content creation and help personalize learning. The resources should be allocated to virtual and augmented reality technologies to create more immersive learning experiences and increase student engagement with instructional content (Bathla et al., 2023). Our contribution through this research offers practical implications for improving teaching and learning practices by examining the landscape of digital technology in classrooms over the past decade with current challenges and opportunities.
This research possesses a few limitations, such as a restriction to a few keywords, which may influence the search results, but future research should incorporate additional related keywords. Secondly, this study focused on a broad range of digital technologies rather than specific platforms. New digital technologies such as large language models or extended reality may lack extensive publication, resulting in lower bibliometric visibility despite their growing relevance in classrooms. Thirdly, only the WOS database was used for bibliometric analysis; other databases, such as Scopus, ProQuest, or IEEE Xplore, could strengthen the findings. Lastly, excluding non-English publications may limit the valuable insights from research conducted in other languages.
This study offers a comprehensive review of publications on digital technologies in the classroom from 2014 to 2023 through bibliometric analyses. It demonstrates how bibliometric analysis can be applied to other fields, including scientific mapping and performance analysis. Publication trends suggest a promising future for digital technologies in classroom research and highlight their significant value in applied settings. Insights into leading authors, institutions, journals, countries, articles, and keywords will assist researchers in identifying key contributors and suitable platforms for disseminating their work. International collaboration should be pursued to explore opportunities and address challenges. The compelling visualizations of keyword co-occurrence, thematic map, co-citation, and collaboration networks were created, allowing for a more thorough interpretation of the data. Our study also contributes by highlighting the research trends and developments in the field over the past 10 years, aiding scholars in becoming more aware of current research hotspots when choosing topics to pursue. Teachers should focus on professional development to enhance their digital competencies. At the same time, policymakers should invest in equitable access to infrastructure and support digital literacy through training programs that may impact technology integration in education. The present study’s potentially informative and valuable implications aid researchers, policymakers, and practitioners in understanding the past, present, and future scientific structure of the interdisciplinary field of education and digital technologies. Future research should focus on particular technologies, such as immersive, adaptive, or virtual learning.
TA: Conceptualization, Data curation, Formal analysis, Investigation, Methodology, Software, Visualization, Writing – original draft, Writing – review & editing. GS: Conceptualization, Investigation, Methodology, Project administration, Resources, Supervision, Writing – original draft, Writing – review & editing. KS: Conceptualization, Formal analysis, Project administration, Resources, Software, Validation, Visualization, Writing – original draft, Writing – review & editing. ÖÖ: Funding acquisition, Methodology, Resources, Supervision, Writing – original draft, Writing – review & editing.
The author(s) declare that no financial support was received for the research, authorship, and/or publication of this article.
The authors declare that the research was conducted without any commercial or financial relationships that could be construed as a potential conflict of interest.
The author(s) declared that they were an editorial board member of Frontiers, at the time of submission. This had no impact on the peer review process and the final decision.
The author(s) declare that no Generative AI was used in the creation of this manuscript.
All claims expressed in this article are solely those of the authors and do not necessarily represent those of their affiliated organizations, or those of the publisher, the editors and the reviewers. Any product that may be evaluated in this article, or claim that may be made by its manufacturer, is not guaranteed or endorsed by the publisher.
Alabdulaziz, M. S. (2021). Covid-19 and the use of digital technology in mathematics education. Educ. Inf. Technol. 26, 7609–7633. doi: 10.1007/s10639-021-10602-3
Aliu, J., and Aigbavboa, C. (2023). Reviewing the trends of construction education research in the last decade: a bibliometric analysis. Int. J. Constr. Manag. 23, 1571–1580. doi: 10.1080/15623599.2021.1985777
Aria, M., and Cuccurullo, C. (2017). Bibliometrix: an R-tool for comprehensive science mapping analysis. J. Informet. 11, 959–975. doi: 10.1016/j.joi.2017.08.007
Aytekin, A., Özköse, H., and Ayaz, A. (2022). Unified theory of acceptance and use of technology (Utaut) in mobile learning adoption: systematic literature review and bibliometric analysis. Collnet J. Scientometrics Inf. Manag. 16, 75–116. doi: 10.1080/09737766.2021.2007037
Banks, F., and Williams, P. J. (2022). International perspectives on technology education. Debates in design and technology education. London: Routledge.
Bathla, A., Aggarwal, P., and Manaswi, K. (2023). The role of digital Technology in Achieving Sustainable Development Goals (Sdgs): a systematic literature review, bibliometric analysis and content analysis. Foster. Sust. Dev. Age Technol. 13, 1–22. doi: 10.1108/978-1-83753-060-120231003
Bergdahl, N., and Bond, M. (2022). Negotiating (dis-) engagement in K-12 blended learning. Educ. Inf. Technol. 27, 2635–2660. doi: 10.1007/s10639-021-10714-w
Bourbour, M. (2023). Using digital technology in early education teaching: learning from teachers’ teaching practice with interactive whiteboard. Int. J. Early Years Educ. 31, 269–286. doi: 10.1080/09669760.2020.1848523
Braun, V., and Clarke, V. (2006). Using thematic analysis in psychology. Qual. Res. Psychol. 3, 77–101. doi: 10.1191/1478088706qp063oa
Braun, V., and Clarke, V. (2021). One size fits all? What counts as quality practice in (reflexive) thematic analysis? Qual. Res. Psychol. 18, 328–352. doi: 10.1080/14780887.2020.1769238
Britain, G. (2019). Realising the potential of technology in education: A strategy for education providers and the technology industry. London: Department for Education.
Callon, M., Courtial, J.-P., Turner, W. A., and Bauin, S. (1983). From translations to problematic networks: an introduction to co-word analysis. Soc. Sci. Inf. 22, 191–235. doi: 10.1177/053901883022002003
Cohen, A., Soffer, T., and Henderson, M. (2022). Students' use of technology and their perceptions of its usefulness in higher education: international comparison. J. Comput. Assist. Learn. 38, 1321–1331. doi: 10.1111/jcal.12678
Creswell, J. W., and Poth, C. N. (2016). Qualitative inquiry and research design: Choosing among five approaches. London: Sage publications.
Davis, F. D. (1989). Perceived usefulness, perceived ease of use, and user acceptance of information technology. MIS Q. 13, 319–340. doi: 10.2307/249008
Djeki, E., Dégila, J., Bondiombouy, C., and Alhassan, M. H. (2022). E-learning bibliometric analysis from 2015 to 2020. J. Comput. Educ. 9, 727–754. doi: 10.1007/s40692-021-00218-4
Donthu, N., Kumar, S., Mukherjee, D., Pandey, N., and Lim, W. M. (2021). How to conduct a bibliometric analysis: an overview and guidelines. J. Bus. Res. 133, 285–296. doi: 10.1016/j.jbusres.2021.04.070
Ellegaard, O., and Wallin, J. A. (2015). The bibliometric analysis of scholarly production: how great is the impact? Scientometrics 105, 1809–1831. doi: 10.1007/s11192-015-1645-z
Ertmer, P. A. (1999). Addressing first-and second-order barriers to change: strategies for technology integration. Educ. Technol. Res. Dev. 47, 47–61. doi: 10.1007/BF02299597
Ertmer, P. A. (2005). Teacher pedagogical beliefs: the final frontier in our quest for technology integration? Educ. Technol. Res. Dev. 53, 25–39. doi: 10.1007/BF02504683
Ertmer, P. A., and Ottenbreit-Leftwich, A. T. (2010). Teacher technology change: how knowledge, confidence, beliefs, and culture intersect. J. Res. Technol. Educ. 42, 255–284. doi: 10.1080/15391523.2010.10782551
Ferrante, P., Williams, F., Büchner, F., Kiesewetter, S., Chitsauko Muyambi, G., Uleanya, C., et al. (2024). In/equalities in digital education policy–sociotechnical imaginaries from three world regions. Learn. Media Technol. 49, 122–132. doi: 10.1080/17439884.2023.2237870
Forsler, I., and Guyard, C. (2023). Screens, teens and their brains. Discourses about digital media, learning and cognitive development in popular science neuroeducation. Learn. Media Technol. 4, 1–14. doi: 10.1080/17439884.2023.2230893
Gazali, N., and Saad, N. (2023). Bibliometric analysis of leadership and physical education based on Scopus data. IJERE 12, 1174–1184. doi: 10.11591/ijere.v12i3.22922
Haleem, A., Javaid, M., Qadri, M. A., and Suman, R. (2022). Understanding the role of digital technologies in education: a review. Sust. Oper. Comput. 3, 275–285. doi: 10.1016/j.susoc.2022.05.004
Hao, T., Chen, X., and Song, Y. (2020). A topic-based bibliometric analysis of two decades of research on the application of technology in classroom dialogue. J. Educ. Comput. Res. 58, 1311–1341. doi: 10.1177/0735633120940956
Harju, V., Koskinen, A., and Pehkonen, L. (2019). An exploration of longitudinal studies of digital learning. Educ. Res. 61, 388–407. doi: 10.1080/00131881.2019.1660586
Herlina, S., Kusumah, Y. S., and Juandi, D. (2025). Global research on emerging digital technology: a bibliometric analysis. J. Adv. Res. Appl. Sci. Eng. Technol. 51, 281–294. doi: 10.37934/araset.51.2.281294
Hirsch, J. E. (2005). An index to quantify an individual's scientific research output. Proc. Natl. Acad. Sci. 102, 16569–16572. doi: 10.1073/pnas.0507655102
Hirsch, J. E. (2007). Does the h index have predictive power? Proc. Natl. Acad. Sci. 104, 19193–19198. doi: 10.1073/pnas.0707962104
Howard, S. K., Chan, A., Mozejko, A., and Caputi, P. (2015). Technology practices: confirmatory factor analysis and exploration of teachers' technology integration in subject areas. Comput. Educ. 90, 24–35. doi: 10.1016/j.compedu.2015.09.008
Huang, C., Yang, C., Wang, S., Wu, W., Su, J., and Liang, C. (2020). Evolution of topics in education research: a systematic review using bibliometric analysis. Educ. Rev. 72, 281–297. doi: 10.1080/00131911.2019.1566212
Kelly, C. D., and Jennions, M. D. (2006). The h index and career assessment by numbers. Trends Ecol. Evol. 21, 167–170. doi: 10.1016/j.tree.2006.01.005
Koehler, M., and Mishra, P. (2009). What is technological pedagogical content knowledge (Tpack)? Contemp. Issues Technol. Teacher Educ. 9, 60–70. Available at: https://www.learntechlib.org/primary/p/29544/
Kumi-Yeboah, A., Kim, Y., Sallar, A. M., and Kiramba, L. K. (2020). Exploring the use of digital technologies from the perspective of diverse learners in online learning environments. Online Learning 24, 42–63. doi: 10.24059/olj.v24i4.2323
Lankshear, C., and Knobel, M. (2006). New literacies: Everyday practices and classroom learning. Keynote address presented at the 84th annual meeting of the American Educational Research Association, Chicago, IL. (ERIC Document Reproduction Service No. ED478121). England: Open University Press.
Li, K. C., and Wong, B. T.-M. (2022). Research landscape of smart education: a bibliometric analysis. Inter. Technol. Smart Educ. 19, 3–19. doi: 10.1108/ITSE-05-2021-0083
Livingstone, S., Marsh, J., Plowman, L., Ottovordemgentschenfelde, S., and Fletcher-Watson, B. (2014). Young children (0–8) and digital technology: A qualitative exploratory study-national report-Uk. European Commission, Luxembourg: Joint Research Centre. Available at: https://eprints.lse.ac.uk/60799/
Luo, W., Berson, I. R., and Berson, M. J. (2021). Integration of digital technology into an early childhood teacher preparation program in China. Early Childhood Educ. J. 49, 1165–1175. doi: 10.1007/s10643-020-01115-8
Major, L., Warwick, P., Rasmussen, I., Ludvigsen, S., and Cook, V. (2018). Classroom dialogue and digital technologies: a scoping review. Educ. Inf. Technol. 23, 1995–2028. doi: 10.1007/s10639-018-9701-y
Marsh, J., Hannon, P., Lewis, M., and Ritchie, L. (2017). Young children’s initiation into family literacy practices in the digital age. J. Early Child. Res. 15, 47–60. doi: 10.1177/1476718X15582095
Mcgarr, O., and Mcdonagh, A. (2021). Exploring the digital competence of pre-service teachers on entry onto an initial teacher education programme in Ireland. Ir. Educ. Stud. 40, 115–128. doi: 10.1080/03323315.2020.1800501
Merigó, J. M., Mas-Tur, A., Roig-Tierno, N., and Ribeiro-Soriano, D. (2015). A bibliometric overview of the journal of business research between 1973 and 2014. J. Bus. Res. 68, 2645–2653. doi: 10.1016/j.jbusres.2015.04.006
Miles, M. B., and Huberman, A. M. (1994). Qualitative data analysis: An expanded sourcebook. London: Sage.
Mishra, P., and Koehler, M. J. (2006). Technological pedagogical content knowledge: a framework for teacher knowledge. Teach. Coll. Rec. 108, 1017–1054. doi: 10.1111/j.1467-9620.2006.00684.x
Moon, U. J., and Hofferth, S. L. (2018). Change in computer access and the academic achievement of immigrant children. Teach. Coll. Rec. 120, 1–26. doi: 10.1177/016146811812000401
Moskovkin, V. M., Zhang, H., Sadovski, M. V., and Serkina, O. V. (2022). Comprehensive quantitative analysis of top-100s of Arwu, Qs and the world university rankings for 2014–2018. Educ. Inf. 38, 133–169. doi: 10.3233/EFI-211539
Mostafa, M. M. (2023). Three decades of interactive learning environments: a retrospective bibliometric network analysis. Interact. Learn. Environ. 31, 6968–6987. doi: 10.1080/10494820.2022.2057548
Noyons, E. C. M., Moed, H. F., and Luwel, M. (1999). Combining mapping and citation analysis for evaluative bibliometric purposes: a bibliometric study. J. Am. Soc. Inf. Sci. 50, 115–131. doi: 10.1002/(SICI)1097-4571(1999)50:2<115::AID-ASI3>3.0.CO;2-J
Okoye, K., Hussein, H., Arrona-Palacios, A., Quintero, H. N., Ortega, L. O. P., Sanchez, A. L., et al. (2023). Impact of digital technologies upon teaching and learning in higher education in Latin America: an outlook on the reach, barriers, and bottlenecks. Educ. Inf. Technol. 28, 2291–2360. doi: 10.1007/s10639-022-11214-1
Plowman, L., and Stephen, C. (2007). Guided interaction in pre-school settings. J. Comput. Assist. Learn. 23, 14–26. doi: 10.1111/j.1365-2729.2007.00194.x
Prensky, M. (2001). Digital natives, digital immigrants part 2: do they really think differently? Horizon 9, 1–6. doi: 10.1108/10748120110424843
Rogers, G., Szomszor, M., and Adams, J. (2020). Sample size in bibliometric analysis. Scientometrics 125, 777–794. doi: 10.1007/s11192-020-03647-7
Roldan-Valadez, E., Salazar-Ruiz, S. Y., Ibarra-Contreras, R., and Rios, C. (2019). Current concepts on bibliometrics: a brief review about impact factor, Eigenfactor score, CiteScore, Scimago journal rank, source-normalised impact per paper, H-index, and alternative metrics. Ir. J. Med. Sci. 188, 939–951. doi: 10.1007/s11845-018-1936-5
Selwyn, N. (2007). The use of computer technology in university teaching and learning: a critical perspective. J. Comput. Assist. Learn. 23, 83–94. doi: 10.1111/j.1365-2729.2006.00204.x
Selwyn, N. (2011). In praise of pessimism-the need for negativity in educational technology. Br. J. Educ. Technol. 42, 713–718. doi: 10.1111/j.1467-8535.2011.01215.x
Sinha, D. B., Sinha, S., Gs, A., Islam, M. T., and Sahoo, D. (2023). Twenty-five years of research in the journal of special education technology: a bibliometric analysis. J. Spec. Educ. Technol. 39, 174–189. doi: 10.1177/01626434231187095
Strong, G. (2019). Understanding quality in research: avoiding predatory journals. J. Hum. Lact. 35, 661–664. doi: 10.1177/0890334419869912
Tondeur, J., Van Braak, J., Sang, G., Voogt, J., Fisser, P., and Ottenbreit-Leftwich, A. (2012). Preparing pre-service teachers to integrate technology in education: a synthesis of qualitative evidence. Comput. Educ. 59, 134–144. doi: 10.1016/j.compedu.2011.10.009
Tondeur, J., Van Braak, J., Siddiq, F., and Scherer, R. (2016). Time for a new approach to prepare future teachers for educational technology use: its meaning and measurement. Comput. Educ. 94, 134–150. doi: 10.1016/j.compedu.2015.11.009
Torres-Ruiz, M., and Moreno-Ibarra, M. (2019). Challenges and opportunities in the digital transformation of the higher education institutions: the case of Mexico. Manage. Admin. Higher Educ. Inst. Times Change 4, 137–149. doi: 10.1108/978-1-78973-627-420191012
Tsay, M.-Y., and Yang, Y.-H. (2005). Bibliometric analysis of the literature of randomized controlled trials. J. Med. Libr. Assoc. 93, 450–458
UNESCO (2021). Futures of education: Reimagining how knowledge and learning can shape the future of humanity and the planet. Available at: https://www.unesco.org/en/futures-education (Accessed March 28, 2024).
Van Eck, N. J., and Waltman, L. (2014). Visualizing bibliometric networks. Measuring scholarly impact. Methods and practice. Cham: Springer.
Venkatesh, V. (2000). Determinants of perceived ease of use: integrating control, intrinsic motivation, and emotion into the technology acceptance model. Inf. Syst. Res. 11, 342–365. doi: 10.1287/isre.11.4.342.11872
Venkatesh, V., and Bala, H. (2008). Technology acceptance model 3 and a research agenda on interventions. Decis. Sci. 39, 273–315. doi: 10.1111/j.1540-5915.2008.00192.x
Venkatesh, V., and Davis, F. D. (2000). A theoretical extension of the technology acceptance model: four longitudinal field studies. Manag. Sci. 46, 186–204. doi: 10.1287/mnsc.46.2.186.11926
Venkatesh, V., Morris, M. G., Davis, G. B., and Davis, F. D. (2003). User acceptance of information technology: toward a unified view. MIS Q. 27, 425–478. doi: 10.2307/30036540
Vygotskij, L. S. F. A., and John-Steiner, V. (1979). Mind in society: The development of higher psychological processes. Cambridge, MA: Harvard University Press.
Wahid, S. H. (2024). Exploring the intersection of Islam and digital technology: a bibliometric analysis. Soc. Sci. Hum. Open 10:101085. doi: 10.1016/j.ssaho.2024.101085
Williamson, B. (2016b). Political computational thinking: policy networks, digital governance and ‘learning to code’. Critical Policy Studies 10, 39–58. doi: 10.1080/19460171.2015.1052003
Yildiz Durak, H. (2021). Preparing pre-service teachers to integrate teaching technologies into their classrooms: examining the effects of teaching environments based on open-ended, hands-on and authentic tasks. Educ. Inf. Technol. 26, 5365–5387. doi: 10.1007/s10639-021-10511-5
Zaman, K., Khan, H. U. R., Ahmad, M., and Aamir, A. (2018). Research productivity and economic growth: a policy lesson learnt from across the globe. Iranian Econ. Rev. 22, 627–641.
Zhu, Y. (2019). New national initiatives of modernizing education in China. Econ. Rev. Educ. 2, 353–362. doi: 10.1177/2096531119868069
Keywords: technology, bibliometric analysis, educational technology, performance analysis, scientific mapping
Citation: Alam TM, Stoica GA, Sharma K and Özgöbek Ö (2025) Digital technologies in the classrooms in the last decade (2014–2023): a bibliometric analysis. Front. Educ. 10:1533588. doi: 10.3389/feduc.2025.1533588
Edited by:
Yu-Tung Kuo, North Carolina Agricultural and Technical State University, United StatesReviewed by:
Novri Gazali, Islamic University of Riau, IndonesiaCopyright © 2025 Alam, Stoica, Sharma and Özgöbek. This is an open-access article distributed under the terms of the Creative Commons Attribution License (CC BY). The use, distribution or reproduction in other forums is permitted, provided the original author(s) and the copyright owner(s) are credited and that the original publication in this journal is cited, in accordance with accepted academic practice. No use, distribution or reproduction is permitted which does not comply with these terms.
*Correspondence: Talha Mahboob Alam, VGFsaGEubS5hbGFtQG50bnUubm8=
Disclaimer: All claims expressed in this article are solely those of the authors and do not necessarily represent those of their affiliated organizations, or those of the publisher, the editors and the reviewers. Any product that may be evaluated in this article or claim that may be made by its manufacturer is not guaranteed or endorsed by the publisher.
Research integrity at Frontiers
Learn more about the work of our research integrity team to safeguard the quality of each article we publish.