 Ana Oña
 Carmen Burgos
 Jorge Castillo2
94% of researchers rate our articles as excellent or good
Learn more about the work of our research integrity team to safeguard the quality of each article we publish.
Find out more
ORIGINAL RESEARCH article
Front. Educ., 10 March 2025
Sec. Higher Education
Volume 10 - 2025 | https://doi.org/10.3389/feduc.2025.1515877
This article is part of the Research TopicInstitutional Impact Measurement in Higher EducationView all 11 articles
Introduction: Higher education institutions, especially those reliant on public funding, focus heavily on academic performance and student dropout rates. Early identification of students with academic challenges is crucial for timely intervention. However, many predictive models are complex, data-intensive, and applicable only after students begin their studies.
Methods: This study employs the Analytic Hierarchy Process (AHP) to create an indicator predicting academic performance for first-year students. This indicator combines commonly used variables with insights from past dropout cases, tailored to each university’s and/or faculty context. The methodology was piloted with the Commercial Engineering department and the Technological Learning Complex at the University of Atacama in Chile. The index construction involved four stages: 1) defining dimensions and variables, 2) pairwise selection to determine weights, 3) index construction, and 4) validation.
Results: The index used 18 variables across four dimensions, with final weights assigned as follows: academic (49.7%), inclusion (32.8%), economic (8.9%), and social (8.6%). This academic risk index was tested against the 2018 cohort of the Commercial Engineering degree, showing an 82% match with actual student performance.
Discussion: This methodology offers a practical tool for creating academic performance indexes tailored to students entering to first time to the university, addressing the specific needs of individual institutions.
Education is a fundamental component in the development of societies and contributes to long-term economic growth (Pernas and Gómez, 2018; Rodríguez-Ponce, 2009). Formal education, especially higher education, is becoming increasingly important in meeting the demands and needs of an increasingly globalized world (Huesca-Reynoso et al., 2010; Gallo, 2005). This phenomenon has led to a significant increase in the number of students accessing higher education (Luchilo, 2006) and to a more active role for universities and the state in ensuring this process (Payá and Navarro, 2017).
Due to the growing demand for higher education, student attrition (individuals who leave a program of study before it has finished) is becoming a problem for students, for higher education institutions (HEIs), and for society as a whole (Gallo, 2005; Rama, 2009). It calls into question educational plans, the efficiency and quality of the education provided, and affects the accessibility and coverage of education (Cabrera et al., 2006; Castaño et al., 2004; Girón and Gómez, 2005).
In Chile, higher education funding has historically relied more on private contributions than public funding. In 2018, private contributions accounted for approximately 59% of total tertiary education funding, while public contributions made up the remaining 41%. The Free Education Policy (FEP), implemented in 2016, aimed to provide tuition-free education to students from households within the lowest 60% income bracket, enrolled in eligible institutions. Beneficiaries are exempt from paying tuition and registration fees for the standard duration of their degree programs. Eligibility criteria include not holding a prior professional or terminal bachelor’s degree, maintaining Chilean nationality or permanent residency after completing secondary education in Chile, and adhering to the formal program duration (Oradini et al., 2020).
Since the FEP’s implementation, higher education enrollment has increased significantly, addressing issues of student retention and the financial burdens associated with extended study periods. In 2016, 138,951 students benefited from free tuition, representing a state investment of approximately 395,194 million Chilean pesos. Of these beneficiaries, 50.5% attended state universities. Enrollment distribution by region was as follows: 30.7% in the Metropolitan Region, 17.2% in the Bío-Bío Region, 13.6% in the Valparaíso Region, and 1.6% in the Atacama Region. This law encouraging the beneficiary institutions to develop new tools to identify students at academic risk at an early stage. Not only because of the problems of student retention, but also because of the costs associated with excessive course duration (Carvajal et al., 2018). Academic risk models have been widely developed using historical information to predict the academic performance of students (Berlanga Silvente et al., 2018); however, there are specific characteristics that must be considered according to the reality of each higher education institution, especially for students entering for the first time to the universities (Himmel, 2002).
This study uses the Analytic Hierarchy Process (AHP) to construct an academic risk model. AHP is widely applied in various fields to solve complex decision-making problems as it incorporates people’s criteria to identify solutions that best meet their needs (Saaty, 2000; Montoya et al., 2008; Ishizaka and Lusti, 2006). In the context of education, we created an academic performance index that considers the specific characteristics of students entering university. We selected the University of Atacama for this study because it is the only public university in the region of Atacama and enrolls a higher number of vulnerable students. In many cases, these students are the first in their families to attend university, or do not have solid academic foundations and the Free Education Law has enabled them to access higher education (Barahona, 2014). Early identification and academic support can significantly impact these students’ success.
This model used data from the CTA-UDA Technological Learning Complex survey, which is given to all students during their enrollment before they enter the university (Complejo Tecnológico de Aprendizaje, 2018). To validate the results, we calculated the index for all students enrolled in the Commercial Engineering program in the first semester of 2018 and conducted a detailed analysis in cases where the index predictions were inaccurate. We chose this cohort because it was the first to implement the new competency-based institutional educational approach and due to the diverse profiles of its applicants. This study outlines the step-by-step application of the hierarchical analysis process in education to create the Academic Risk Index, allowing for easy replication and adaptation to other contexts.
Data comes from the CTA-UDA characterization survey, which is designed to support and guide students as they transition into university, aiming to reduce dropout rates and improve academic performance (Complejo Tecnológico de Aprendizaje, 2018). The survey is administered to all students during enrollment and is complemented by their previous academic profiles. It comprises 28 questions across various dimensions, including special needs, academic, economic, and social factors (Complejo Tecnológico de Aprendizaje, 2018). The CTA uses this information to perform a descriptive analysis, identifying the main characteristics of students in each program and the predominant learning styles. It is important to note that the survey is not mandatory, and follow-up is conducted only in certain programs to ensure all students provide complete information. As a result, the learning styles of students who did not complete the survey cannot be analyzed at the institutional level.
Experts: To define the dimensions, variables, and weights, we worked with academics from the Department of Comercial Engineering and experts from the CTA of the University of Atacama. In total, 20 workers contributed with the study.
Cohort: To apply the index, we only used data from students in the 2018 cohort of the Comercial Engineering. This cohort showed a significant increase in the number of students enrolled because of the implementation of the Free Education Law, and it was the first cohort to reform its curriculum and implement the competency-based model in 2018 (Complejo Tecnológico de Aprendizaje, 2018). The total cohort was 60 students, but the index could be applied and validated with 54 students because the other students changed courses, did not finish the semester, or did not complete the survey.
Four steps were established to construct the academic risk indicator. In the first stage, the variables, and dimensions that most influence student dropout were defined; in the second stage, they were weighted. In the third stage, the index was constructed, and in the final stage, the index was compared with the real academic performance of students in the Comercial Engineering program.
Understanding the factors that influence students’ academic performance is crucial because poor performance often leads to dropout (Constante-Amores et al., 2021; Sandoval et al., 2018). Academic performance is influenced by multiple factors, both internal and external, that interact in complex ways (Tuero Herrero et al., 2018). These factors can be broadly categorized into social, cognitive, and emotional components (Fernández-Lasarte et al., 2019). They are further classified into three main categories: personal determinants, social determinants, and institutional determinants, each encompassing various variables (Garbanzo Vargas, 2014). The selection of variables and dimensions included in the index was grounded in a review of relevant literature and informed by expert opinion. These variables were deemed essential for capturing critical aspects of academic risk within the chosen context. In the initial phase of this study, a literature review on dropout factors and input from CTA experts, based on the specific context of students at the University of Atacama, were used to define the dimensions and variables of the index. In addition to the main categories, inclusion was added as a new dimension.
After selecting the variables and dimensions, the second stage involved peer selection and the application of a survey to assess the importance of each variable. This survey was distributed digitally and completed by collaborators, including academics from the Commercial Engineering program and CTA staff. The expertise of these participants provided the basis for determining the weight of each determinant and variable. To synthesize this information and finalize the weightings, the Analytic Hierarchy Process (AHP) was used.
AHP is a tool for integrating stakeholder preferences in complex, multi-criteria decision-making processes (Saaty, 2000; Montoya et al., 2008; Mora-Picado, 2009). It allows for the assignment of subjective numerical values to reflect the perceived relative importance of different criteria, using a preference ratio scale (Saaty, 2000; Ishizaka and Lusti, 2006; Berumen and Redondo, 2007). To apply AHP, it is crucial to identify the criteria (and sub-criteria, if necessary) that will be evaluated, along with the various alternatives or options. The consistency of these evaluations is then calculated to ensure reliability (Berumen and Redondo, 2007).
For implementing the AHP model, free software such as Super Decisions (version 2.6.0-RC1) and Fuzzy were identified (Holecek and Talašová, 2016). However, it was ultimately decided to develop this methodology using an Excel spreadsheet, which replicated the parameters used in the software and allowed more flexibility to process and show the results. This approach not only facilitated understanding, development, and control of the AHP process but also served as a learning tool that does not rely on specialized software.
To exemplify the pairwise selection process, only the dimensions will be considered. Each participant was given the choice of the importance of the dimensions by comparing pairs of dimensions with numerical values ranging from 1 to 9. According to the Saaty scale, 1 represents that both criteria or elements are of equal importance and 9 for absolute importance of one criterion over another. Only odd numbers are used because they allow better discrimination of preferences (Saaty, 2000).
Once the survey is complete, an matrix was constructed with the pairs of comparisons or relative importance judgments, where is the element of , for . This matrix must satisfy the properties of reciprocity and consistency (See Equation 1).
Once the matrix was obtained, the values weree transformed to obtain a vector of priorities of all criteria. Different methods have been found to transform the values of the comparison matrix; in this case it was explained according to the method of the sum. The first step was to add the values of each column of the comparison matrix (Equation 2).
Then, each element of the matrix must be divided by the sum of its column to obtain the “normalized” comparison matrix. This step allowed the form responses, which were in text format, to be converted to numeric values (See Equation 3). For example, a response of “5 A” was transformed into 5, or a response of “5 B” was transformed into 1/5.
The average of the elements of each priority row was estimated, so that the column vector was calculated as it is reflected in Equation 4:
This vector contained the averages of the rows, obtaining the priority vector of the criteria (See Equation 5).
The same procedure was repeated until the priority vector for all criteria (both dimensions and variables) was obtained. Since the AHP method was used for decision-making between alternatives, the priority vectors of each alternative must be multiplied by the priority vectors of the criteria.
After gathering the experts’ responses and completing all the comparisons of determinants and variables in each comparison matrix, the consistency of the answers must be analyzed. If an expert’s consistency ratio was <10%, their answers were considered consistent and therefore acceptable for inclusion in the calculations of measurements and weightings. On the other hand, if the consistency ratio exceeded 10%, the expert’s responses were deemed inconsistent and must be excluded.
Once all results were collected, the consistency and weights assigned by each expert to the determinants and variables were analyzed. Only the consistent responses (weights) were accepted for generating the final weights. After analyzing the consistency of all experts’ responses, the final weights of the determinants and variables were calculated.
A combined indicator was a simplified representation that attempts to summarize a multidimensional concept into a simple (unidimensional) index based on an underlying conceptual model (Soto and Schuschny, 2009). For the construction of combined indicators, it was important that the attribute to be measured has a clear definition and that reliable information was available to carry out the measurement. These conditions were necessary to have a conceptual basis and to give validity to the indicator (Soto and Schuschny, 2009).
The combined index, academic risk index (IRA) for each student was made up of the weighted sum of the dimensions , formally according to the following Equation 6:
Where are the weights for each dimension . There were four dimensions: academic, economic, inclusion and social. In turn, each dimension was composed of the weighted sum of the variables that comprise it (See Equation 7).
Where was the weight for each variable of the dimension .
The index was validated into three stages: defining the index ranges, testing its robustness and sensitivity, and establishing cut-off points to classify students by risk. To validate the index, the number of credits failed by students at the end of the first semester was compared with the estimated index.
In the first stage, after constructing the index, fictitious scenarios were generated to test all possible combinations of variables and define the index ranges. In the second stage, robustness was assessed by altering the model, removing one variable at a time to observe its effect on the index. Sensitivity analysis involved modifying the values of independent variables related to academic, inclusion, economic, and social determinants to examine their impact on the academic risk index. This provided a comprehensive range of index values. In the third stage, the index was divided into three risk categories—low, medium, and high—based on the defined ranges.
For validation, different methods were considered, such as the weighted average of students and credits failed. However, due to the unique context of the Universidad de Atacama, where students can drop credits before exams, this approach was not suitable. Instead, the number of credits passed at the end of the first semester was used as a more accurate indicator to compare with the academic performance index.
The index was applied to the 2018 Commercial Engineering cohort, where 60 students entered, of which 38% are women and only 3% had children. Regarding the number of students per educational institution, subsidized private establishments represented 52% of the sample, 46% municipal establishments and only 2% paid private establishments. The average weighted score was 551.1 (max. Value 850), having different values per sex and type of educational institution. Women reported a higher value of 558.8, while men reached 549.6. Students coming from privately paid institutes reported the highest average of 576, while privately subsidized was 547. Considering academic variables from the characterized survey, 17% of the students stated that they had not participated in any school integration program (PIE) at their educational establishment. PIE is an inclusive strategy of the Chilean school system that provides educational support to students who need it, especially those with Special Educational Needs (SEN) (Tamayo Rozas et al., 2018). Less than 5% received psychological attention, showed learning difficulties or psychological disorders. As for funding, 57% of students were admitted with the benefit of free tuition and 32% were financed by their parents. The remaining students (6%) financed their studies with scholarships, loans, and their own funding (see Table 1).
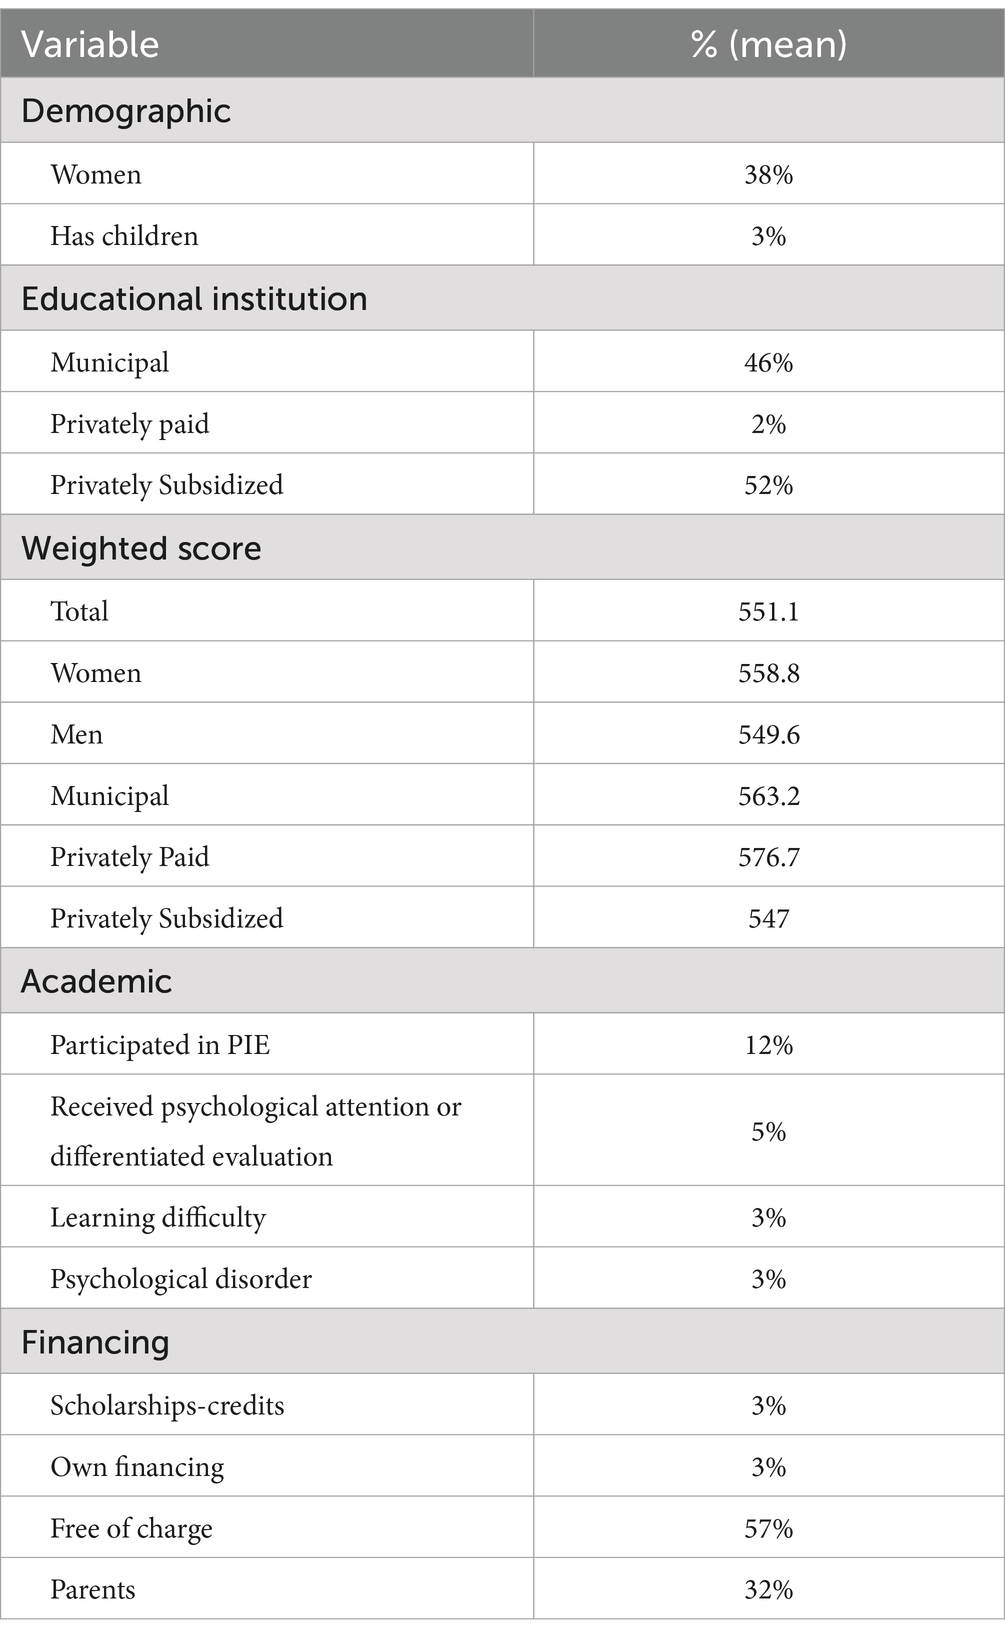
Table 1. Characteristics of students in the Commercial Engineering program at the University of Atacama, Chile, 2018 cohort.
The present study used four dimensions and 18 variables. The dimensions analyzed were academic, inclusion, economic, and social, as detailed in Table 2. The academic dimension included high school grades, scores from the university selection tests in Mathematics and Language, type of high school attended, study modality, and participation in the PIE program. The inclusion dimension considered factors related to psychological disorders and self-reported learning difficulties. The economic dimension focused on financial aspects, particularly how students funded their studies. Finally, the social dimension accounted for personal responsibilities, such as whether students had children.
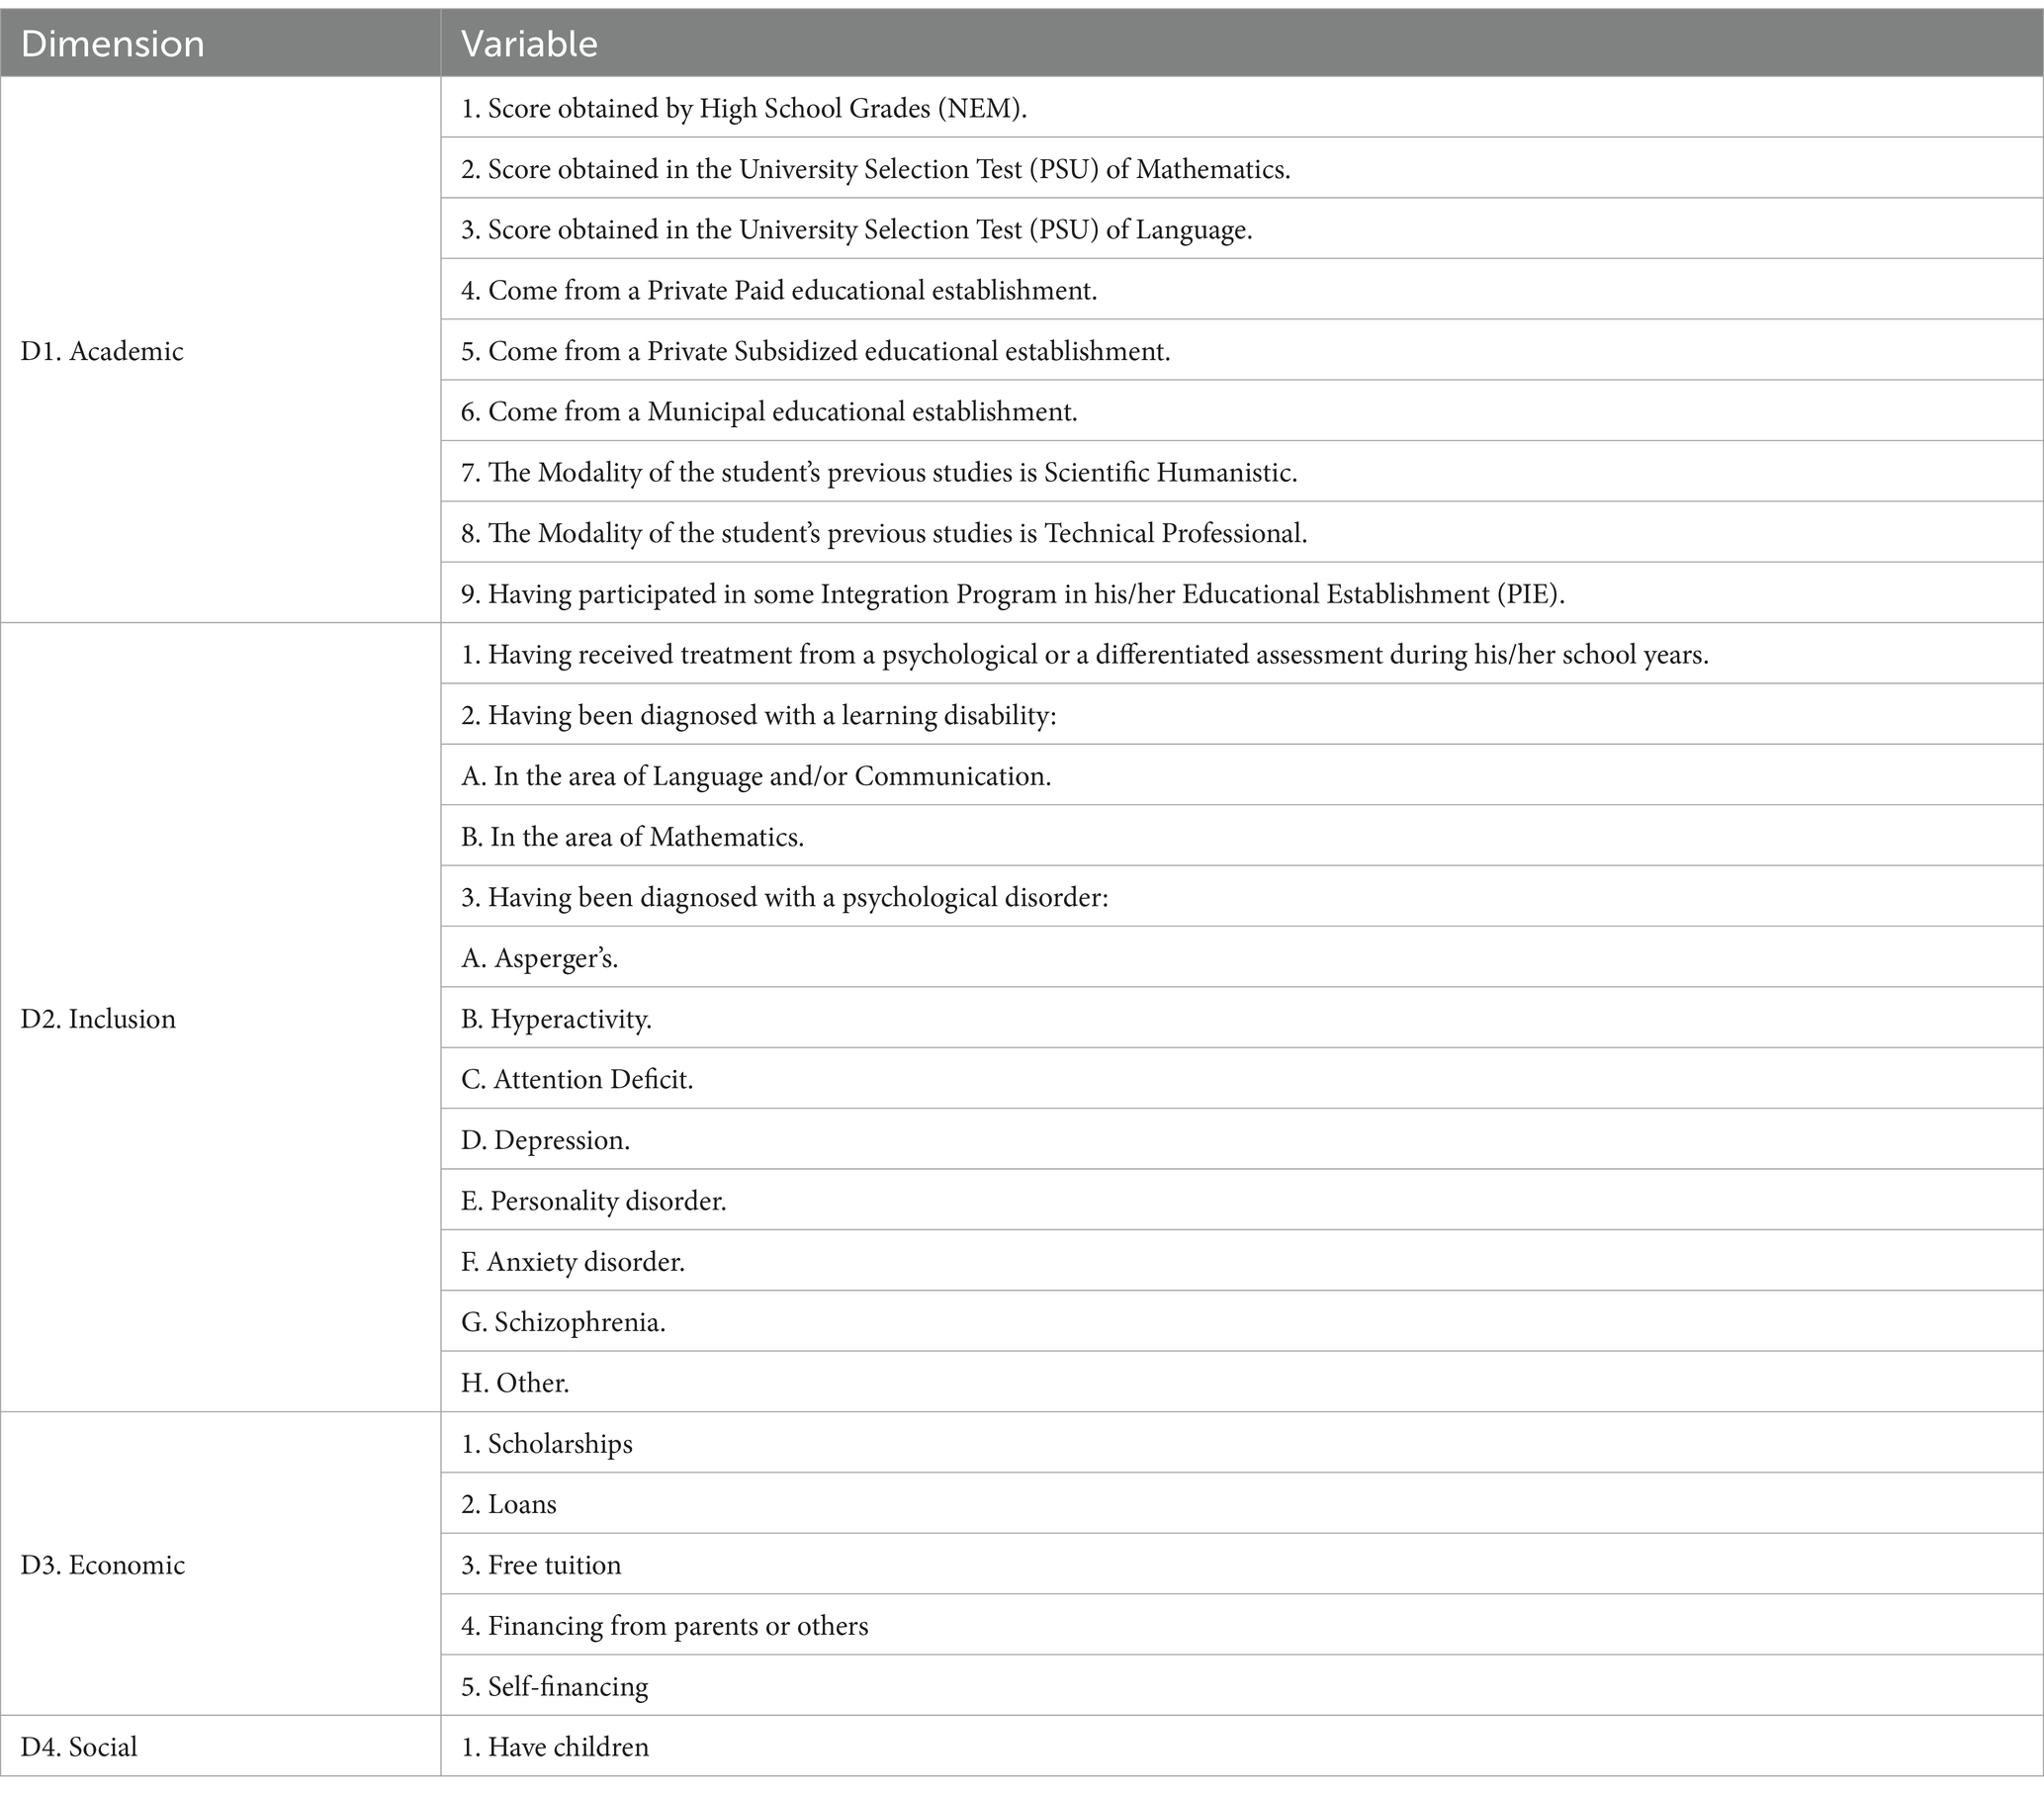
Table 2. Identification of determinants and variables in the survey characterizing the CTA technological learning complex.
Participants had to choose a rating of agreement between the dimension they consider most important A or B. At the dimension level, there were a total of 5 comparisons:
1. Academic determinants (A) vs. Social determinant (B).
2. Academic determinant (A) vs. Economic determinant (B).
3. Academic determinant (A) vs. Inclusion determinant (B).
4. Social determinant (A) vs. Economic determinant (B).
5. Social determinant (A) vs. inclusion determinant (B).
This process was also carried out for each variable within each dimension, except for the social dimension, which only has one variable. With the data generated, the weights for each variable and dimension were determined by applying the hierarchical analysis process. For each participant, a comparison matrix was established by determinants and by variables.
When all the results are obtained, both the consistency and the weights that each expert assigned to the determinants and variables were analyzed. Only the responses (weights) of the experts that were consistent were accepted to generate the final weights. The weights of the dimensions and variables were established as shown in Figure 1.
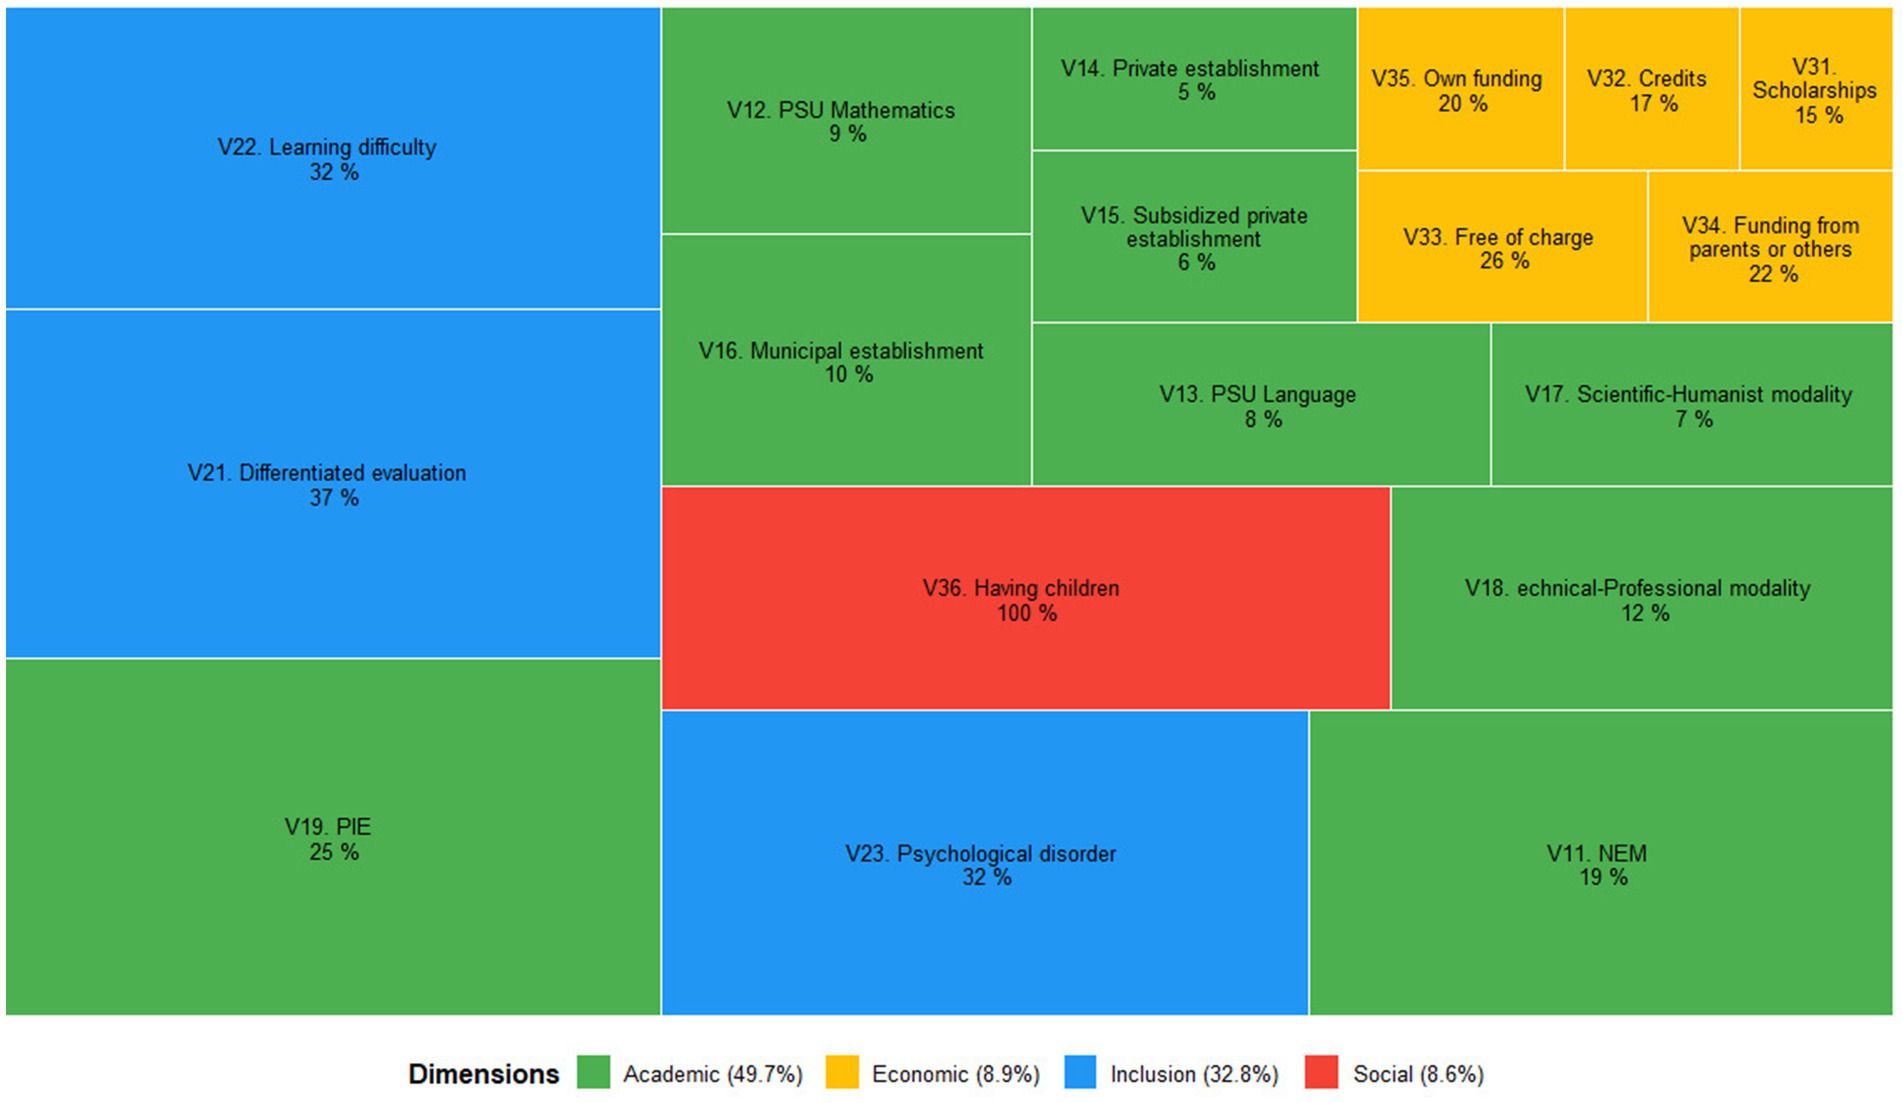
Figure 1. Weighting of the dimensions and variables of the academic performance index.
Formally, using the weights for each dimension, the index for each student is constructed with the following Equation 8:
Where each dimension in turn is composed as follows:
Once the index was constructed, the ranges of values that it can assume for each combination of determinants and variables were analyzed. After obtaining the ranges of possible values for the index, for the robustness of the model, one variable at a time was eliminated to see the variation of the index. This procedure was carried out 16 times, leaving out the last variable children, because it is the only variable that belongs to the social determinant (Figure 2). To see how robust the model is, confidence intervals were calculated at a confidence level of 99%, in order to obtain greater accuracy. The mean value of the model is: −0.066 (−0.124; −0.0086). When calculating the confidence intervals of the model, it can be concluded that the model is robust, since, when eliminating some variables, the values of the mean of the new estimated index do not escape the global confidence interval. These steps demonstrated that the index retained high accuracy, supporting its validity as a reliable tool for assessing academic risk.
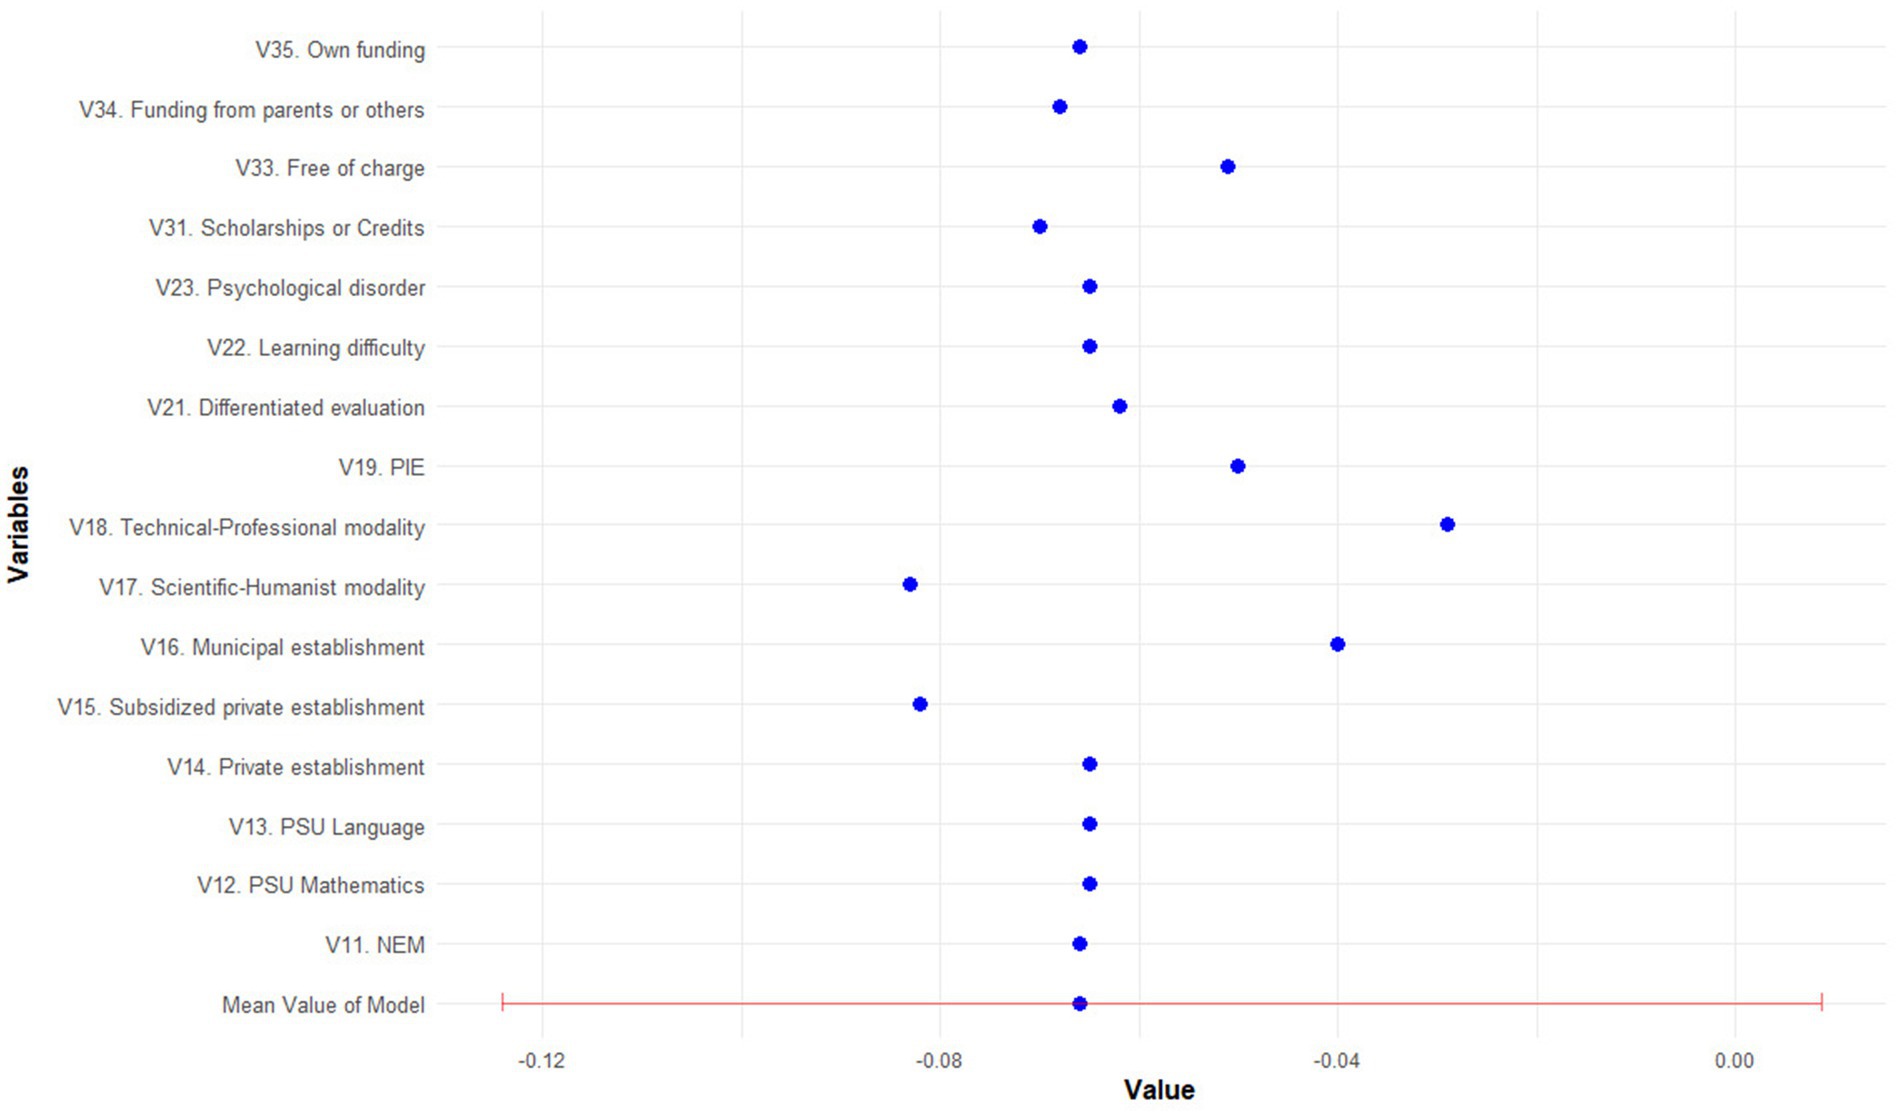
Figure 2. Robustness values of the index by eliminating variables.
The sensitivity analysis examined the impact of different scenarios on the Academic Risk Index by changing the values of the independent variables. To do this, the value of each variable was changed one by one for the academic, integration, economic and social determinants. In this way, all the scenarios and/or values that the variables can assume were developed, obtaining the range of values of the Academic Risk Index.
After obtaining the ranges of possible values for the index, the development of a traffic light continues to segment the students based on the values obtained with the combinations of determinants and variables. This traffic light is segmented into 3 sections, red, yellow and green. Red, for students who, due to their characteristics when they enter the university, present a high academic risk, assuming an index with values between −0.8085 and −0.2071, determined by obtaining combinations with the lowest values of the variables identified by experts as the most important for determining academic risk. Minimum score of 475 in the NEM and PSU tests, municipal establishment, technical-professional modality, having participated in PIE, having reported psycho-logical disorder, learning difficulty, differential assessment, free education and having children. Green, for students who, based on their characteristics of admission to the University, do not represent an academic risk, assuming an index with values between 0.0824 and 0.7107. Yellow, for students who, on the basis of their admission characteristics, present an average academic risk, assuming an index with values between −0.2070 and 0.0823, which is determined by obtaining combinations of the average values with the previously indicated variables, thus being the range of values between the index of high academic risk and that of low or no academic risk (Figure 3).
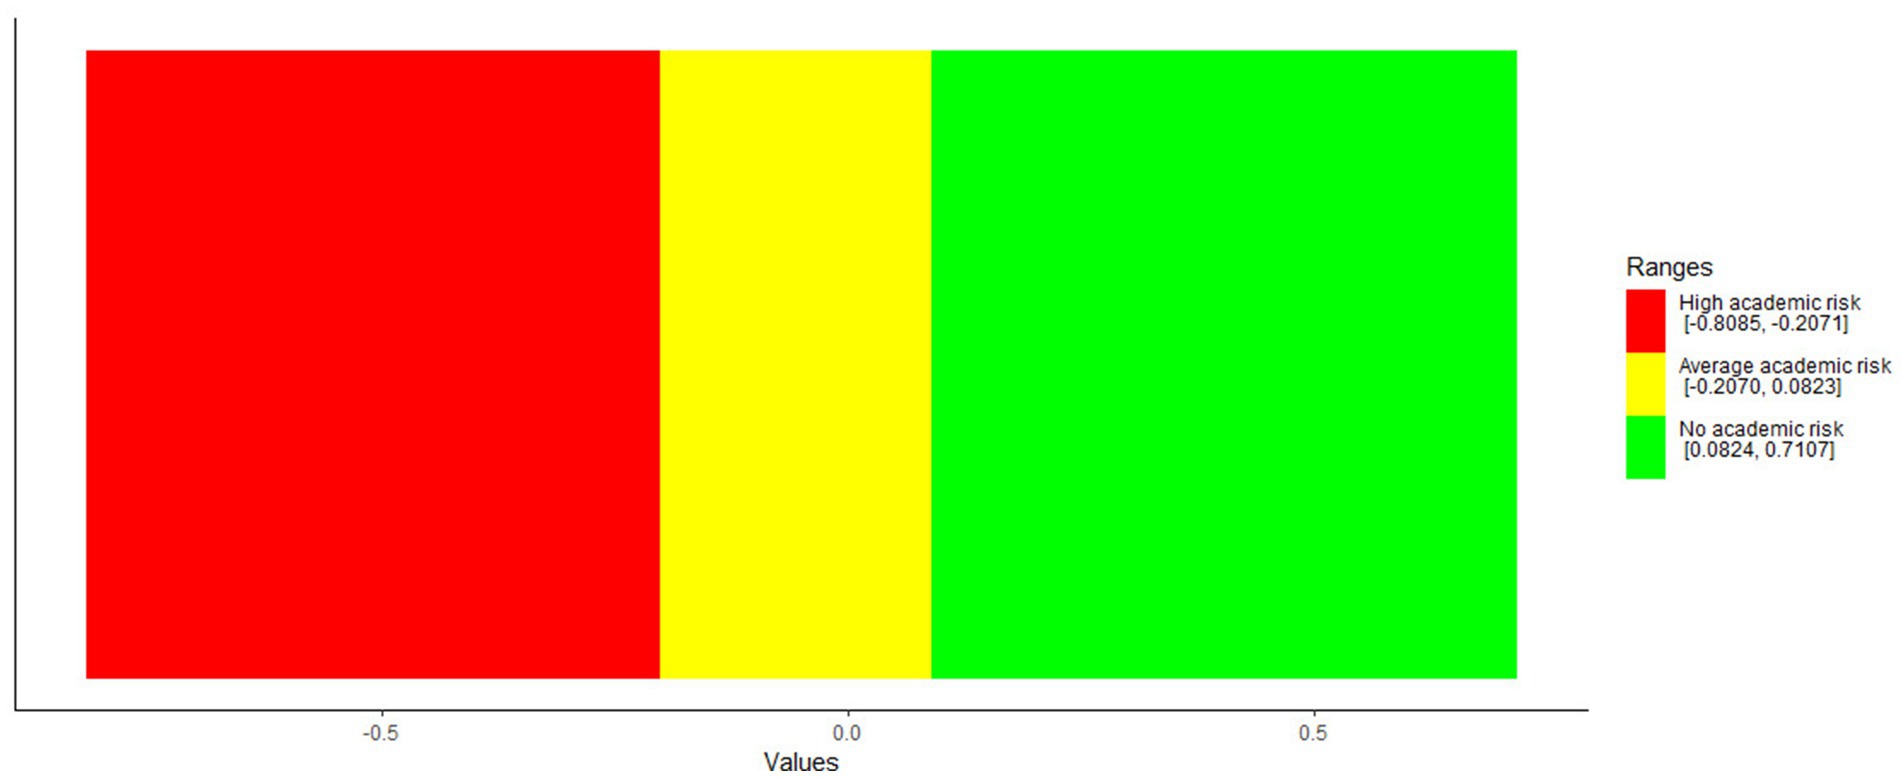
Figure 3. Traffic light.
Of the total of 59 students for whom there were records to perform the Academic Risk Index, the grades of 56 of them were obtained, since the other 4 students either dropped out before the end of the semester or changed their major. From this number, 46 matches were obtained when comparing the Academic Risk Index (initial values of each student) with the number of credits failed at the end of the first academic semester, so that the Academic Risk Index allowed predicting 82.14% of the cases.
This study illustrates how the Analytic Hierarchy Process (AHP) can be effectively used to construct academic performance indices that reflect the specific context and needs of higher education institutions. The study identified the following weights for variables contributing to academic risk, according to experts: Academic Determinant at 49.7%, Inclusion Determinant at 32.8%, Economic Determinant at 8.9%, and Social Determinant at 8.6%.
In countries where higher education is not universally accessible, students often rely on loans, scholarships, or personal funds. Dropout poses a financial burden on both the individual and the financing entity (González and Uribe, 2002). Free tuition offers students from low-income households the chance to continue their studies (Berlanga Silvente et al., 2018), yet the economic situation remains a significant determinant of academic risk (Opazo and Gaymer, 2017). Public institutions like the University of Atacama, which play a crucial role in their regions, must implement complementary measures to mitigate risks and ensure equitable opportunities for all students.
Based on both the literature review and the specific context of the University of Atacama, the key variables affecting academic performance include: attending a municipal educational establishment, having a technical-professional background, prior participation in an Integration Program (PIE), receiving psychological treatment or differentiated evaluations during school, being diagnosed with a learning difficulty or psychological disorder, being funded through free tuition or self-financing, and having children. These variables are consistent with findings from previous studies conducted at this and other higher education institutions (Barahona, 2014). However, we acknowledge that the exclusion of certain variables and the assignment of weights may appear subjective. In this study, the weighting process relied on the Analytical Hierarchy Process (AHP), which integrates expert judgment in a structured manner.
A major strength of this study is its detailed demonstration of a non-traditional methodology for creating academic performance indices tailored to new students. The study also highlights the specific variables influencing student attrition within a regional public university context (Barahona, 2014). This methodology offers flexibility, allowing different weights to be assigned according to the specific needs of each program and institution. For instance, in some programs, factors like parenthood may be more significant, thus altering the weights while using the same set of variables.
However, a limitation of this study is that it was applied only to one degree program at the University of Atacama. Due to academic disruptions in Chile—such as strikes, the pandemic, and the shift to online classes—it was not possible to validate the index at an institutional level. Although the index is in use, these exogenous factors may have biased the validation, with student attrition potentially influenced by unconsidered factors. The primary aim of our paper was to test the applicability of the AHP method in an educational context, not to generalize the findings. We selected the 2018 cohort because it represented a new and diverse generation of students, and the CTA survey was conducted before grades were assigned to avoid academic performance bias. While the study provides a foundation, future efforts should validate the method in other cohorts and educational settings to examine its broader applicability.
Despite this limitation, the Commercial Engineering program offered a diverse student body, including those with free tuition and prior academic challenges, which validated the inclusion of these variables in the index. Additionally, as the first program to implement a competency-based teaching model, the index could be effectively aligned with this approach.
There are methodological limitations in constructing composite indicators, such as potential biases introduced during data processing. Simplifying or reducing the explanation of complex phenomena when creating dimensions or variables may lead to a loss of nuanced understanding. The academic risk model relies on data from the CTA-UDA Technological Learning Complex survey, which is self-reported by students without external validation. While the model identifies students at higher risk for academic difficulties, other external factors may influence or mitigate this risk (Mateo and Ramírez, 2018). Furthermore, the weights of variables may change depending on the educational institution’s context, course characteristics, and expert perceptions. To mitigate these concerns, future research could incorporate complementary objective measures, such as attendance records or academic performance metrics, to validate self-reported data. Additionally, longitudinal studies that track students’ progress over time could provide further insights into the reliability and accuracy of the self-reported data and the use of different software tools, especially for longer samples.
While the primary focus of this study was the application of the AHP method, external factors such as educational policies or disruptions caused by the COVID-19 pandemic were not explicitly incorporated into the analysis. We recognize that these factors may influence academic risk and should be considered in future studies. Future studies with more granular data could explore these dimensions to identify patterns and tailor interventions more effectively. However, this method enabled the use of students’ initial characteristics to predict their academic performance, allowing for earlier interventions aimed at reducing attrition.
This study introduces new tools for creating performance indices that enable higher education institutions to take timely action. Future research could expand on this by applying the index to other faculties and validating it with additional variables, depending on the data available from different universities. The key is to develop tools that assess the student’s initial status, not only academically but also in integrative, economic, and social aspects, to implement preventive rather than reactive measures for students at academic risk.
The raw data supporting the conclusions of this article will be made available by the authors, without undue reservation.
AO: Conceptualization, Methodology, Supervision, Writing – original draft. CB: Writing – review & editing. JC: Data curation, Formal analysis, Writing – review & editing. MaM: Data curation, Formal analysis, Writing – review & editing. MiM: Supervision, Writing – review & editing.
The author(s) declare that no financial support was received for the research, authorship, and/or publication of this article.
The authors would like to thank the staff of the Technological Learning Center (CTA) and the academics of the Department of Commercial Engineering (INGECO) of the University of Atacama for all the collaboration provided in the development of this research.
The authors declare that the research was conducted in the absence of any commercial or financial relationships that could be construed as a potential conflict of interest.
The author(s) declare that no Gen AI was used in the creation of this manuscript.
All claims expressed in this article are solely those of the authors and do not necessarily represent those of their affiliated organizations, or those of the publisher, the editors and the reviewers. Any product that may be evaluated in this article, or claim that may be made by its manufacturer, is not guaranteed or endorsed by the publisher.
Barahona, P. (2014). Factores determinantes del rendimiento académico de los estudiantes de la Universidad de Atacama. Estudios Pedag. 40, 25–39. doi: 10.4067/S0718-07052014000100002
Berlanga Silvente, V., Figuera Gazo, M. P., and Pons, F. E. (2018). Modelo Predictivo De Persistencia Universitaria: Alumnado Con Beca Salario. Educacion XX1. 21:20193. doi: 10.5944/educxx1.20193
Berumen, S. A., and Redondo, F. L. (2007). La utilidad de los métodos de decisión multicriterio (como el AHP) en un entorno de competitividad creciente. Cuadernos Admin. 20, 65–87.
Cabrera, L., Bethencourt, J. T., Pérez, P. A., and Afonso, M. G. (2006). El problema del abandono de los estudios universitarios. RELIEVE 12:2. doi: 10.7203/relieve.12.2.4226
Carvajal, C. M., González, J. A., Tassara, C. A., and Álvarez, M. S. (2018). Sobre-duración: una Aproximación Cuantitativa. Formación Univ. 11, 19–28. doi: 10.4067/S0718-50062018000300019
Castaño, E., Gallón, S., Gómez, K., and Vásquez, J. (2004). Deserción estudiantil universitaria: una aplicación de modelos de duración. Lecturas Econ. 60, 39–65. doi: 10.17533/udea.le.n60a2707
Complejo Tecnológico de Aprendizaje (2018). Informe Perfil de Ingreso estudiantes cohorte 2018. Copiapó: Universidad de Atacama.
Constante-Amores, A., Martínez, E. F., Asencio, E. N., and Fernández-Mellizo, M. (2021). Factores asociados Al abandono universitario. Educación XX1 24, 17–44.
Fernández-Lasarte, O., Ramos-Díaz, E., Palacios, E. G., and Rodríguez-Fernández, A. (2019). Estudio comparativo entre educación superior y media: efecto del apoyo social percibido, el autoconcepto y la inteligencia emocional en el rendimiento académico. Educación XX1. 22:22526. doi: 10.5944/educxx1.22526
Gallo, M. E. (2005). Masificación de la educación superior: una reflexión acerca de sus causas y contradicciones. Faces 11, 49–64.
Garbanzo Vargas, G. M. (2014). Factores asociados al rendimiento académico tomando en cuenta el nivel socioeconómico: Estudio de regresión múltiple en estudiantes universitarios. Rev. Electr. Educ. 18, 119–154. doi: 10.15359/ree.18-1.6
Girón, L., and Gómez, D. E. G. (2005). Determinantes del rendimiento académico y la deserción estudiantil, en el programa de economía de la Pontificia Universidad Javeriana de Cali. Cali: Universidad Javeriana-Cali.
González, L. E., and Uribe, D. (2002). Estimaciones sobre la" repitencia" y deserción en la educación superior chilena. Consideraciones sobre sus implicaciones. Calidad Educ. 17, 75–90. doi: 10.31619/caledu.n17.408
Himmel, E. (2002). Modelo de análisis de la deserción estudiantil en la educación superior. Calidad Educ. 17, 91–108. doi: 10.31619/caledu.n17.409
Holecek, P., and Talašová, J. (2016). “A free software tool implementing the fuzzy AHP method,” in Proceedings of the 34th International Conference on Mathematical Methods in Economics.
Huesca-Reynoso, L., Castro-Lugo, D., and Rodríguez-Pérez, R. E. (2010). Cambio tecnológico y sus efectos en el mercado de trabajo: una revisión analítica. Econ. Soc. Territorio. 10, 749–779. doi: 10.22136/est002010134
Ishizaka, A., and Lusti, M. (2006). How to derive priorities in AHP: a comparative study. CEJOR 14, 387–400. doi: 10.1007/s10100-006-0012-9
Luchilo, L. (2006). Movilidad de estudiantes universitarios e internacionalización de la educación superior. Rev. Iberoamericana Ciencia Tecnol. Soc. CTS 3, 105–133.
Mateo, I. M., and Ramírez, F. C. (2018). La repetición escolar en educación secundaria y factores de riesgo asociados. Educación XX1. 21, 41–61.
Montoya, D. G., Giraldo, G. A. M., Morales, E. M., Chavarro, G. O., and Hoyos, Á. T. (2008). Metodología basada en proceso de jerarquía analítica (AHP) para seleccionar cadenas productivas que buscan soluciones de automatización a bajo costo. Ingeniería. 13, 15–26.
Mora-Picado, C. (2009). Propuesta para la aplicación del método multicriterio AHP para la valoración de condominios verticales en Costa Rica. Instituto Tecnológico de Costa Rica, Escuela de Ingeniería en Construcción.
Opazo, V. S., and Gaymer, M. (2017). Política pública de gratuidad en educación superior en Chile: ¿ resuelve todo el problema? Inv. Econ. Educ. 12, 75–92.
Oradini, N. B., Castillo, L. A., Duque, Á. A., Jara, V. Y., Acle, X. G., and Orellana, C. C. (2020). Gratuidad de la Educación Superior en Chile. Arandu UTIC. 7, 163–188.
Payá, M. A., and Navarro, E. M. (2017). Accesibilidad universal: sentido normativo e implicaciones en la educación y la práctica profesional. REDIS 5, 25–41. doi: 10.5569/2340-5104.05.01.02
Pernas, R. G., and Gómez, J. A. C. (2018). La educación social como un derecho al servicio de los pueblos y la vida. Educ. Soc. Rev. Int. Socioeduc. 68, 11–21.
Rama, C. (2009). La tendencia a la masificación de la cobertura de la educación superior en América Latina. Rev. Iberoamericana Educ. 50, 173–195. doi: 10.35362/rie500668
Rodríguez-Ponce, E. (2009). El rol de las Universidades en la sociedad del conocimiento y en la era de la globalización: evidencia desde Chile. Interciencia 34, 824–829.
Saaty, T. L. (2000). Fundamentals of decision making and priority theory with the analytic hierarchy process. England: RWS Publications.
Sandoval, I., Sánchez, T., Velasteguí, V., and Naranjo, D. (2018). Factores asociados al Abandono en estudiantes de grupos vulnerables. Quito: Caso Escuela Politécnica Nacional.
Soto, H., and Schuschny, A. R. (2009). Guía metodológica: diseño de indicadores compuestos de desarrollo sostenible. Comisión Económica para América Latina y el Caribe (CEPAL) with collaboration eutsche Gesellschaft für Technische Zusammenarbeit (GTZ).
Tamayo Rozas, M., Carvallo Arrau, M. F., Sánchez Cornejo, M., Besoaín Saldaña, Á., and Rebolledo, S. J. (2018). Programa de Integración Escolar en Chile: brechas y desafíos para la implementación de un programa de educación inclusiva. REDIS 6, 161–179. doi: 10.5569/2340-5104.06.01.08
Keywords: higher education, student dropout, dropout rate, composite index, analytic hierarchy process
Citation: Oña A, Burgos C, Castillo J, Molina M and Murillo M (2025) Academic risk model through the analytical hierarchical process. Front. Educ. 10:1515877. doi: 10.3389/feduc.2025.1515877
Edited by:
Juanjo Mena, University of Salamanca, SpainReviewed by:
César Augusto Hernández Suárez, Francisco de Paula Santander University, ColombiaCopyright © 2025 Oña, Burgos, Castillo, Molina and Murillo. This is an open-access article distributed under the terms of the Creative Commons Attribution License (CC BY). The use, distribution or reproduction in other forums is permitted, provided the original author(s) and the copyright owner(s) are credited and that the original publication in this journal is cited, in accordance with accepted academic practice. No use, distribution or reproduction is permitted which does not comply with these terms.
*Correspondence: Ana Oña, YW5hLm9uYUBwYXJhcGxlZ2llLmNo
Disclaimer: All claims expressed in this article are solely those of the authors and do not necessarily represent those of their affiliated organizations, or those of the publisher, the editors and the reviewers. Any product that may be evaluated in this article or claim that may be made by its manufacturer is not guaranteed or endorsed by the publisher.
Research integrity at Frontiers
Learn more about the work of our research integrity team to safeguard the quality of each article we publish.