 Swati Singh
 Amanpreet Kaur
 Yonis Gulzar
- 1Chitkara University Institute of Engineering and Technology, Chitkara University, Chandigarh, Punjab, India
- 2Department of Management Information Systems, College of Business Administration, King Faisal University, Al-Ahsa, Saudi Arabia
Education is one of the many sectors in which augmented reality has been successfully implemented. To determine how Augmented Reality (AR) supports education, this bibliometric study analyzes 1734 articles extracted from the Scopus database between 2010 and mid-2023. The study aimed to determine patterns in productivity, authorship and collaboration patterns, publications, citation structures, general research tendencies, and bibliographic coupling. Biblioshiny and VOSviewer were employed in this investigation. The outcomes of the study indicate an ongoing trend of increasing publication counts or more contributions since 2016, and still a trending topic studies on interactive learning environments and AR in education and knowledge constitute niche areas, while epidemiology, science education, and mobile augmented reality are important research topics that were underdeveloped and indicate a relationship that is both emerging and declining, based on a thematic analysis of the papers. Furthermore, the outcomes demonstrate that the USA, Spain, and the United Kingdom have the strongest global cooperation despite the USA writing more articles. To offer an ideal road map for scholars who would like to carry out research in this area, this paper also looks at the trendsetting in augmented reality in education.
1 Introduction
The ability of AR to communicate new knowledge and alter user perceptions has recently significantly impacted the scientific and industrial fields (Kesim and Ozarslan, 2012). There are numerous definitional choices. For example, AR enables users to perceive the real world with digital information placed on it (Azuma, 1997). It enhances the user experience (Garzón, 2021) by superimposing digital data over real-world objects or locations, AR aims to enhance the user experience (Berryman, 2012). Similarly, AR can improve the visual experience for users, expand their visual field, and facilitate more natural completion of tasks (Ke et al., 2005). AR has been used in many areas, such as manufacturing (Egger, 2020), healthcare (McCarthy and Uppot, 2019), Entertainment (Pucihar, 2015), and military and defense (Chmielewski et al., 2019). However, the field of education has one of the most significant potential applications (Bacca Acosta et al., 2014; Singh, 2022). The use of AR in teaching has increased recently (Zhang et al., 2020), from preschool to graduation, with an increasing presence at various levels. According to numerous studies, AR has many advantages in complementing instructional methods (Pribeanu et al., 2017). It provides teachers with the chance to deliver learning content in novel ways. Allowing them to create more engaging learning environments that will spark students' curiosity and enhance academic achievement (Osman, 2020), such as student motivation (Saadon et al., 2020), confidence, and satisfaction (Tee et al., 2018). As a result, AR techniques have progressively helped several learning disciplines. This technology has recently been used in several domains, including history (Trista and Rusli, 2020), mathematics (Omurtak, 2022), physics (Fidan and Tuncel, 2019), and biology (Vega Garzón et al., 2017). AR technology helps university students develop positive attitudes toward physics laboratory work and improves their laboratory skills (Akçayir et al., 2016). AR applications can be beneficial during social separation, like the COVID-19 pandemic, as they let students work from home using ordinary mobile devices.
This work has contributed to the following contributions:
• It illustrates the many research publishing categories for AR in education.
• It discusses different trends in publications categorized by the year the research was conducted.
• It demonstrates that different countries or regions are contributing more to the subject.
• It discusses the authors who produce significant contributions to improving the education field with the help of AR.
• It covers many publication trends according to affiliations (colleges/organizations).
• It illustrates the number of citations for each contribution to AR in education.
The format of this study is as follows: The necessity of bibliometric research and relevant instruments are covered in Section 2. Section 3 provides the required further information. Section 4 talks about the procedure. Section 5 covers results and data, whereas Section 6 covers scientific mapping. Sections 7, 8 deal with the social and intellectual structures, respectively, and Section 9 concludes the article.
2 Necessity for bibliometric analysis
A statical analysis of articles or publications known as “bibliometric analysis” makes use of statistics to examine bibliometric data that is extracted from scientific databases like DBLP, Web of Science (Ley, 2002; Biryukov, 2010), Scopus, and PubMed (Pranckut, 2021), to mention a few (Donthu et al., 2021; Caputo and Kargina, 2022). This data includes keywords, authors, citations, and country distribution. Here, another advantage is determining present patterns and potential future interests in a particular field. A bibliometric study consists of two parts:
• Performance analysis, which evaluates the performance of writers, nations, or publications, is the basis of bibliometric research.
• “Scientific mapping” examines the connections between the research components mentioned above. This cover includes keyword, collaboration, and citation analyses (Aria and Cuccurullo, 2017).
2.1 Bibliometric tools
Various instruments are available for bibliometric analyses, each with unique capabilities. As we all know, graphic representation is more visually appealing than plain text. Clarifying the relationships between research parts is made more accessible by bibliometric analysis when supported by graphical or scientific map representation. Various options include SciMat, Biblioshiny, CiteSpace, and VOSviewer. The following is a description of these tools.
R-studio is a powerful tool used to conduct bibliometric analysis. R is widely used for data analysis and statistical software development. There are various data sources for calculating bibliometric analysis; majority of bibliometric studies relies on data sourced from scientific international journals listed in the academic citation databases: namely WoS (Clarivate Analytics), Science Direct, PubMed, and Scopus (Elsevier).
Anyone without coding experience can efficiently utilize Bibliometrix thanks to a web application called Biblioshiny. Scholars can utilize Biblioshiny to access Bibliometrix's primary features, including analytics, graphs for four distinct metrics levels (sources, authors, publications, and grouping by coupling), and an easy-to-import data set. Moreover, users can use Scopus, WoS, PubMed, Lens, and Dimensions data to evaluate three k-structures (knowledge structure) divided into conceptual, intellectual, and social structures (Moral-Muñoz et al., 2020).
The CiteSpace software, crafted by chaomeichenof at Drexel University, USA, is a visualization tool tailored for measuring and analyzing literature data. It generates tree rings and geospatial maps leveraging information gathered from diverse bibliometric toolkit such as ERIC, Science Direct, WoS, and many other resources (Su and Li, 2019; Zardari et al., 2022).
SciMat tool is a freely available software developed by Granada University's Secaba Lab in Spain. This mapping analysis software is designed particularly for bibliometric research and visualization analysis. Similarly, IntellSOK software generates a bibliometric analysis. This software is developed by Cardiz University in Spain. It generated analysis reports in HTML or in LaTex format (Cobo et al., 2012; López-Robles et al., 2021).
Leiden University, located in the Netherlands, has developed a web-based graphical user interface software, VOSviewer, that is accessible to everyone. This software is designed for scientific mapping and can accept data from various sources such as WoS, RIS, Dimensions, PubMed, and Scopus. VOSviewer offers a comprehensive visual representation of the connections between different study components. The program uses three data types to construct the visualization capabilities: network, bibliographic, and text data. VOSviewer also accommodates Dimensions, WoS, Scopus, and PubMed database files (Jan van Eck and Waltman, 2015).
3 Literature review
3.1 Literature review on bibliometric analysis of AR in education
The term “bibliometric analysis,” first used by Pritchard (1969), is used in this study. Gokhale et al. (2020) say it can be applied to any study assessing the written communication process. Bibliometric analysis is a methodology that uses a range of quantitative techniques to quantify, monitor, and evaluate academic publications (Talan, 2021). Bibliometric analysis is often used to assess the citation problem and provide an overall evaluation of the performance of publications. The most cited study, most cited author, most cited journal, most researched topic, most collaborated country, bibliometric coupling, authors cited together in a study, and keywords and concepts they commonly utilize relating a given problem-solving are the fundamental aspects of citation. The primary concerns raised by the publications' performance are those of evaluating the situations of various individuals, organizations, and countries (Karakus and Ersozlu, 2019; Hincapie et al., 2021).
Carried out a bibliometric analysis of the literature's studies on using AR applications in STEM education. Data on scientific productivity were gathered through bibliometric analysis of 1,977 publications released between 2005 and 2019 (Talan, 2021). Similarly, 437 research on educational AR applications published between 1999–2018 and included in the database of Web of Science that were subjected to bibliometric evaluation (Karakus and Ersozlu, 2019). Bibliometrically examined articles published in WoS between 2013 and 2018 about AR technology in learning and teaching science concepts (Arici et al., 2019). Using an integrated education strategy, another study examined the study on AR technology in education from 2013 to 2019, published in several databases. Relevant bibliometric techniques have been used, especially in the recent few years (Talan, 2021). Relevant bibliometric methods have been used, especially in the recent few years. Once more, a bibliometric analysis was conducted on positive attitude towards AR tool. For this study, 1275 publications published in WoS between 2008 and 2022 were evaluated (Min and Yu, 2023).
3.2 AR in education
This section reviews the literature on several research studies on augmented reality in education and related subjects. In education, AR as well as Virtual Reality (VR) is seen as a crucial technological advancement, like AR VR is also a simulated experience that employs 3D and it gives the user an immersive feel or a virtual word, this section discussed about the AR in education. It uses information manipulation, sensory immersion, and navigation to encourage emotional meditation, enhancing learning outcomes, and the learning process (Cheng and Tsai, 2013; Wu et al., 2013; Singh et al., 2021).
Studies have shown that there are four different categories of AR-based learning methodologies. These methods include experiential, cooperative, game-based, and interactive study. By integrating AR into the education system, Teachers can create interactive and attractive classroom experiences that empower students to handle the challenges of the 21st century (Hanid et al., 2020).
A study by a few other authors demonstrates the efficacy of implementing AR. Increased student motivation, high levels of retention and comprehension, high learning achievements, improvements in laboratory skills, positive attitudes, and practical improvements in spatial and visual thinking are among the many educational advantages. Additional study that provides methods for improving learning in specific domains (Guntur et al., 2020; Hanid et al., 2020; Nurbekova and Baigusheva, 2020).
The use of AR in studying physics, chemistry, anatomy, mathematics, and architecture is discussed in other articles. AR may help in anatomy studies with its visual effects and information on the bones and organs. Without putting any living object in danger, observing the impact of medical preparation or operation on a single body and a group of them is possible. As stated by the same authors, AR can be utilized as a real-time AR visualization tool or as a virtual experimentation tool in science classrooms for architectural models in architecture studies. Chemistry education actively uses technology, and its efficacy has been shown.AR technologies are frequently used in chemistry education to visualize atom, molecule, and crystal structures in three dimensions (Yuen and Yaoyuneyong, 2011; Singh, 2022; Nechypurenko et al., 2020; Singh et al., 2019).
A few studies (Fernández-Enríquez, 2020; Cabero-Almenara et al., 2019) discuss using AR educational resources as a didactic teaching tool. AR technologies are provided by mobile smartphone applications that are portable and reasonably priced (Venkatesan et al., 2021). According to a different author's study, IT professors are highly interested in AR technology and have access to computers and mobile devices [need to add ref]. Mobile devices and marker-based AR have become famous for early childhood education (Tuli and Mantri, 2020) and higher education (Martín-Gutiérrez et al., 2015). In other research, the integration of AR in digital learning resources as an instructive tool improves education through factors including increased visibility, conceptual material that is more accessible, and engaging and intelligible learning content. Experimental research results also point to AR's viability, provided the connection between traditional and new learning methods—develop the connection between theory and practice (Albaladejo et al., 2020; Satpute, 2018; Datta et al., 2024).
4 Methodology
The research methodology is discussed in this section. The field's research output was analyzed statistically and visually using bibliometric analysis as the study approach. Defining research questions was the initial stage before starting the analysis, and the proper research approach was then selected to get the results.
The following research questions are addressed in this study:
RQ1: How have publications and citations in AR in education been performed?
RQ2: Which nations, publications, and sources on AR in education are the most relevant and significant?
RQ3: Which research topics and keyword searches are most frequently used while utilizing AR in education?
RQ4: Which are the primary clusters of co-citation authors related to AR in education?
RQ5: What is the collaboration network of the nation for educational AR?
Using the VOSviewer version 1.6.18 (Albaladejo et al., 2020) and the Biblioshiny tool, these research questions have been addressed in descriptive review, clustering, conceptual framework examination, intellectual framework analysis, and social framework analysis. This study first collected data using a search string, followed by data selection, data exportation, and then performed analysis as shown in Figure 1.
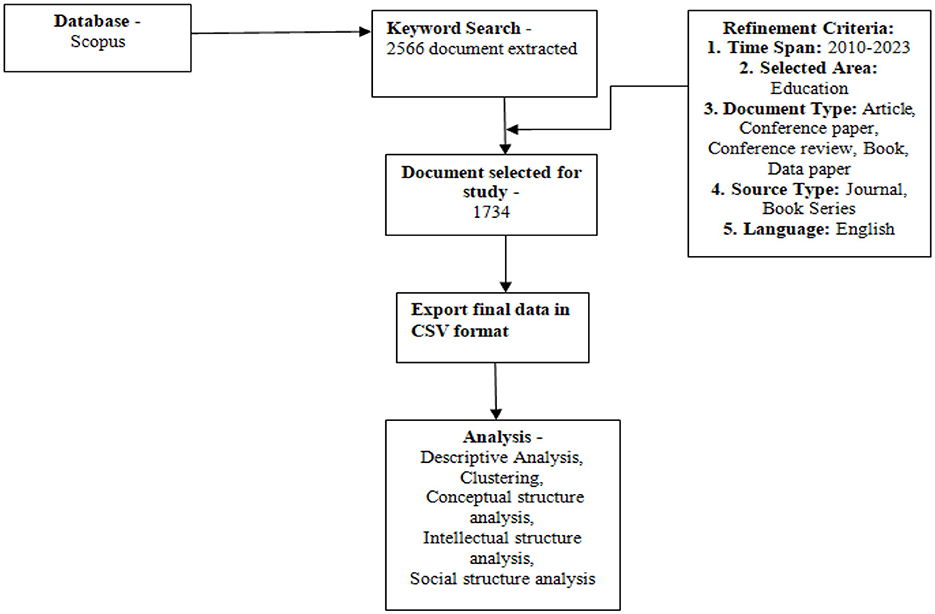
Figure 1. Research methodology.
4.1 Data collection
A structured data collection is called a database. It falls under the category of multidisciplinary and field-specific. Elsevier's multidisciplinary Scopus database provided the data for this study from 2012 to 2023 (up till July). Launched in 2004, Scopus is a peer-reviewed database of citations and abstracts for literature that contains books, conference proceedings, and scientific journals. It offers a comprehensive summary of the output of transdisciplinary research worldwide. For the Elsevier Research Intelligence portfolio, Scopus is the primary data source used by over 3,000 corporates, governmental, and academic institutions (Baas et al., 2020).
4.2 Preparing data for analysis
Data was collected from the Scopus database in a decrypted form to meet the software's requirements. On July 10, 2023, documents that satisfied the below search criteria were selected for shortlisting.
Search string: The simple, concise words that best summarize the information are called keywords. There are several terms for augmented reality. Most of the study contributions utilized the words augmented reality and augmented reality interchangeably. Understanding the topic of an article depends heavily on its title and abstract. A total of 2,566 pages were first extracted using the keyword search parameters to locate scholarly knowledge regarding augmented reality in education. The search term that was used for this investigation is as follows: (“Augmented Reality” OR “AR” AND “Education”), term used for search string: Year Range: Every year between 2012 and 2022 was taken into account.
Subject area or categories: AR has a wide variety of impacts on many different businesses and aspects of daily life. However, just the education domain was considered here.
Document type: All publications were considered, such as research papers, review papers, conference articles, and book chapters.
Type of source: Books, Journals, and other materials were considered.
Country: Since AR in education is a worldwide subject, all countries were considered.
Language: The final dataset of 1,734 papers was collected by applying an English language filter to the shortlisted items. These papers' titles, authors, abstracts, and keyword information were downloaded in CSV format.
Data analysis and visualization tools: VOSviewer and Biblioshiny software applications produced their studies in pictures; Biblioshiny software offers bibliometric over the internet interface. It assists researchers in utilizing Bibliometrix's primary capabilities with ease, including data import and conversion to data frame collecting. The tool can gather data from different bibliometric sources such as Web of Science, Scopus, PubMed, Lens.org, Dimensions, Semantic Scholar, COCI, and others. It can also import data from standard formats and popular networking tools like GML, JSON, and Pajek.
- It provides four types of citation-based analyses: Co-authorship, Citation, Bibliometric coupling, and Co-citation across different levels of analysis (e.g., author, journal, organization, and country). It also offers keyword co-occurrence and term (title + abstract) co-occurrence maps.
- Each map can be viewed with density overview and overlay overview, as well as the standard network view.
- Additionally, it features a VOSviewer Online option for sharing interactive visualizations created with VOSviewer, along with the data file stored in Google Drive, Dropbox, or Onedrive (Caputo and Kargina, 2022). While there are numerous tools for this kind of work, we choose these two because they offer a comparatively easy method to gain the fundamental functionality needed to visualize bibliometric networks. Seven main categories have been identified through Biblioshiny analysis: The work is organized into seven sections: (1) summary, (2) document sources, (3) document authors, (4) articles, (5) conceptual frameworks, (6) scientific mapping, and (7) intellectual structure. The graphs and performance analytics are exported in several formats, such as HTML and Pajek, and tables are saved as both can be Excel or PDF files.
On the other hand, an extensive range of bibliometric resources, such as PubMed, Science Direct, Scopus, Lens.org, ERIC, Semantic Scholar, Web of Science, and COCI, are accepted as inputs by VOSviewer. VOSviewer can exports citation analysis file in JSON, GML, or Pajek format. It offers four forms of citation analysis: citation, co-citation, co-authorship, and bibliometric coupling. It has different levels of analysis, such as organization, country, journal, and author. It also provides phrase (title + abstract) and keyword co-occurrence maps. This feature enables data files saved in OneDrive, Dropbox, or Google Drive to be shared with interactive online visualizations made with VOSviewer. Every map has the standard network view, an overlay overview, and a density overview.
5 Analysis of data and results
Figure 2 illustrates the two components of bibliometric evaluation (Donthu et al., 2021).
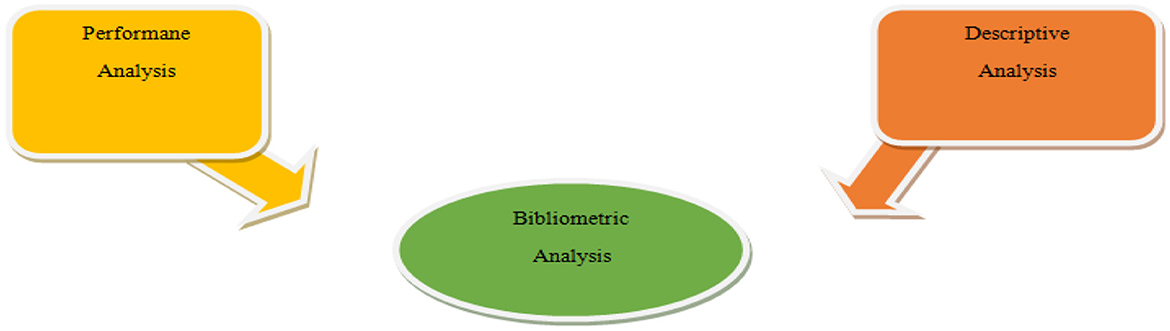
Figure 2. Bibliometric evaluation: components.
5.1 Performance analysis
“By utilizing bibliometric data taken from academic databases such as WoS, Scopus, and DBLP Computer Science Bibliography (Ley, 2002), performance analysis” (Castañeda et al., 2022) assesses the performance of writers, nations, or literature magazines. For bibliometric research, it is regarded as the gold standard.
5.2 Analyzing descriptively
A wide range of subjects, including documents, sources, and authors, can be covered by bibliometric analysis as a descriptive technique (Figure 3). The document tile contains all of a document's components, such as the most commonly used terms, trending topics, global and local references, word dynamics, and reference spectroscopy, to mention a few.
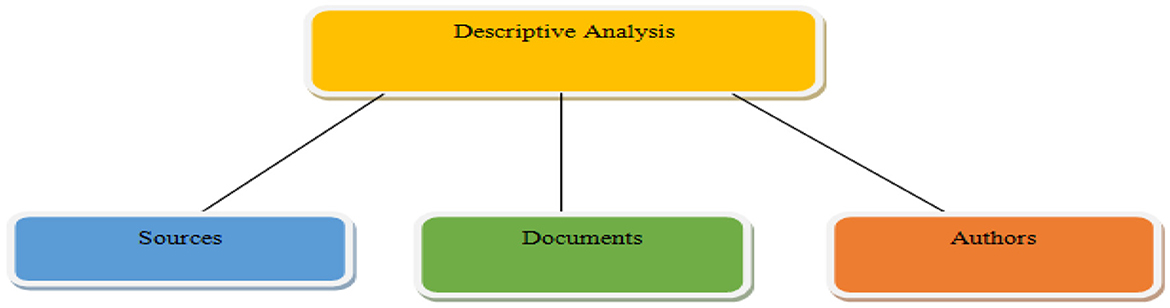
Figure 3. Descriptive analysis.
5.2.1 The dataset
The data frame for bibliometric analysis of the 1,734 articles chosen by a comprehensive search query on the Scopus database is summarized in Table 1. These papers were published in 745 sources, with an average citation per article of 14.59 and an international Co-authorship rate of 20.01%, suggesting that they had been the focus of substantial earlier research, including collaboration between researchers. An overview of all the data selected for our study is shown in Table 1. First, the vital information is provided, covering 2010 through 2023. Seven hundred and five sources in total—books and journal articles—were evaluated. In the 1,734 articles, the Average age was 4.41, and the growth rate was 24.41. There were 64,570 references in the overall dataset, with an average of 14.59 citations per document. Second, the summary contained comprehensive keyword information, such as 4,085 at-risk terms and 6,845 other keywords. Thirdly, the summary showed that 4.67 co-authors, on average, worked with 109 writers on the texts, whereas 109 papers had just one author. The report concludes with a list of the publications' kinds and counts, comprising 453 conference papers, 1,149 articles, and 132 reviews.
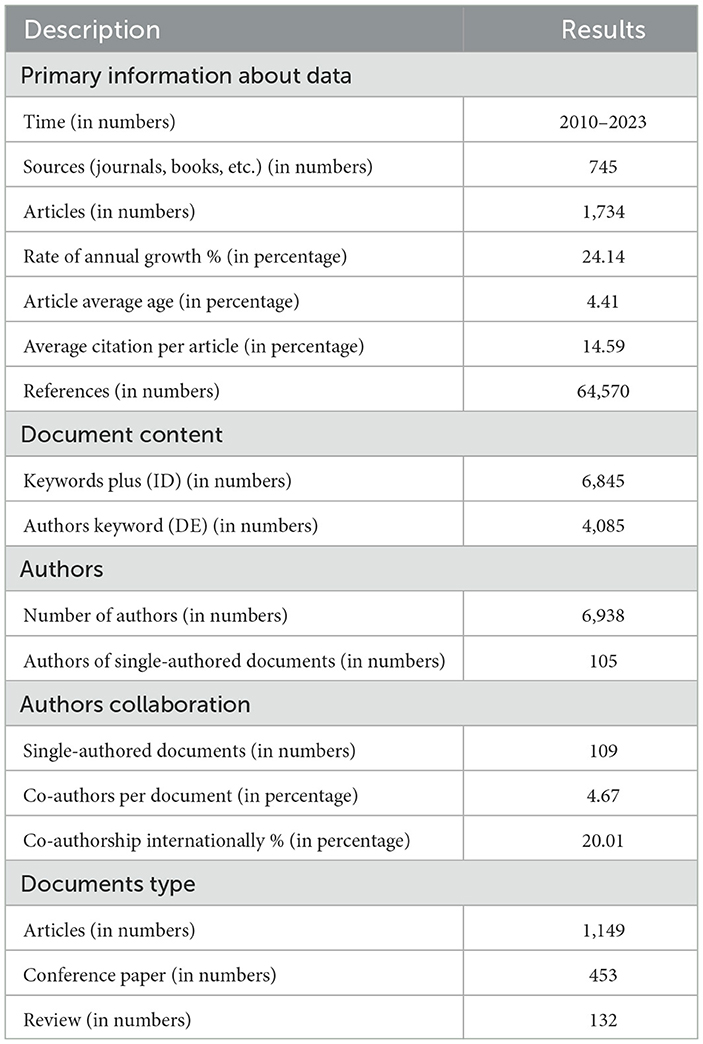
Table 1. Overview of the dataset.
5.2.2 Structure of publication and citation
To carry out this research, articles related to AR in education were gathered over years, from July 2010 to July 2023. Figure 4 depicts the annual developments in AR in education, despite further contributions made after 2016. We can detect the highest publication received in 2022 Despite the search was conducted in 2023; thus, the number of publications is incomplete.
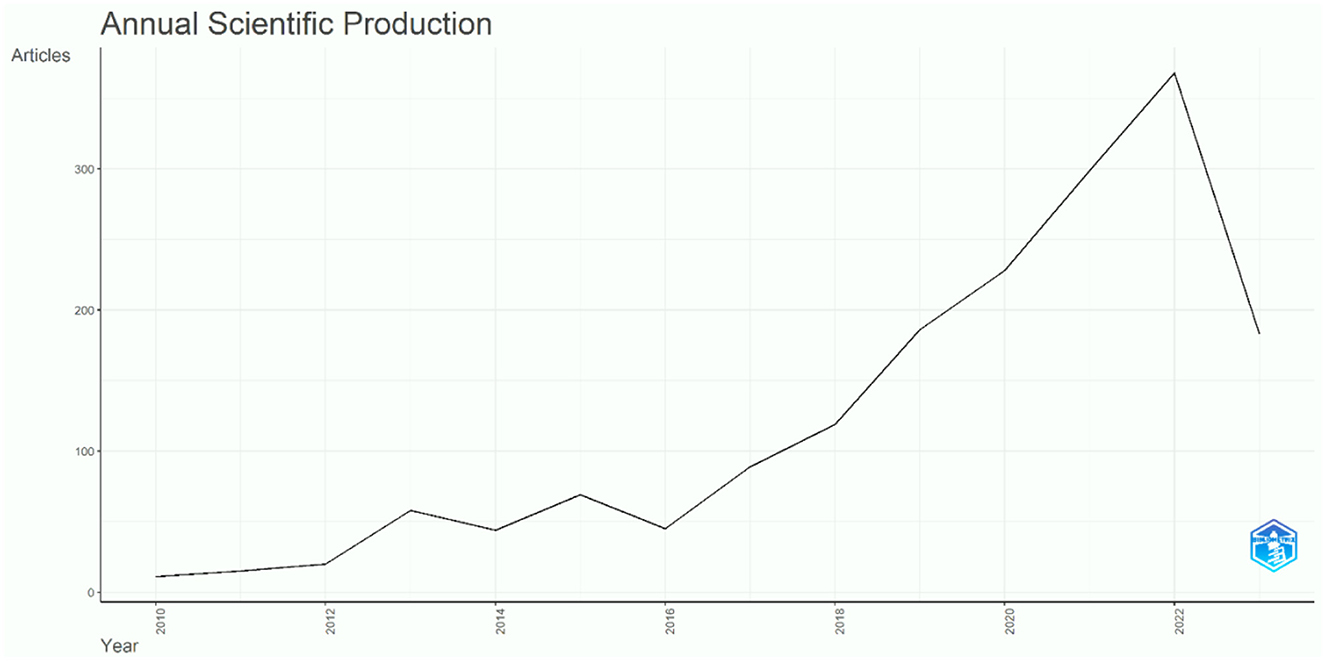
Figure 4. Yearly scientific production.
Table 2 shows the citations years, the mean of the citation per article, articles released annually, and the total citations received each year. There was no discernible pattern in the citation structure other than the obvious one: older articles received more citations. The analysis in the first section shows research productivity based on the annually released papers. The number of papers published each year would give academics insight into the patterns and popularity of this field of study. Notes: “MeanTCperArt” is the average of the total citations per article; “MeanTCper Year” is the average of total annual citations; N represents total number of publications.
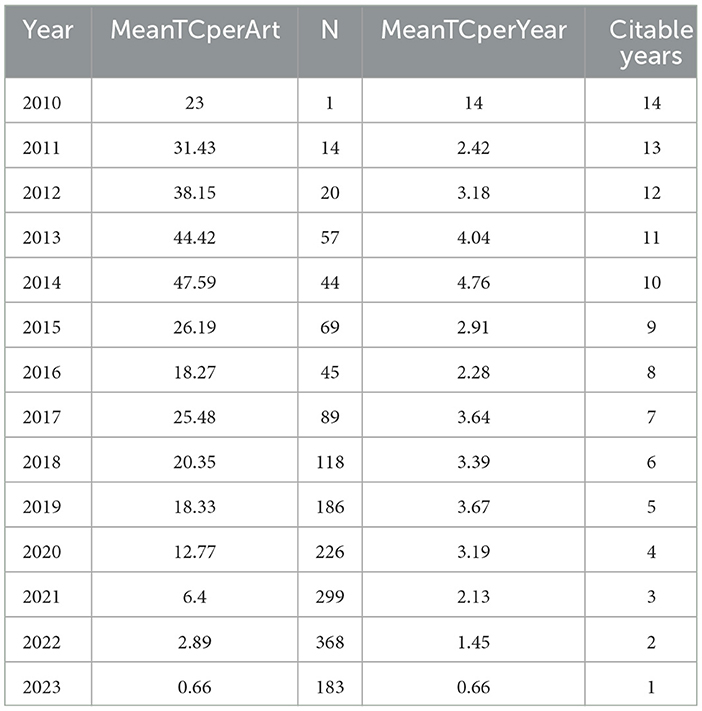
Table 2. Number of citations annually.
5.2.3 Three- fields plots
Sankey Plots (Figure 5) were used to show the three fields “relationship with each other in proportionate to the node value.” The left, middle, and right rows of the list, respectively, contain the keywords, authors, and sources that were selected for analysis. Prominent keywords in each item were augmented reality, mobile learning, education, education technology, mixed reality, e-learning, and artificial intelligence. These keywords led to prominent authors' inclusion of these themes in all ten influential journals. The Journal of Physics: Conference Series, then Expert Systems with Applications, took the top spot.
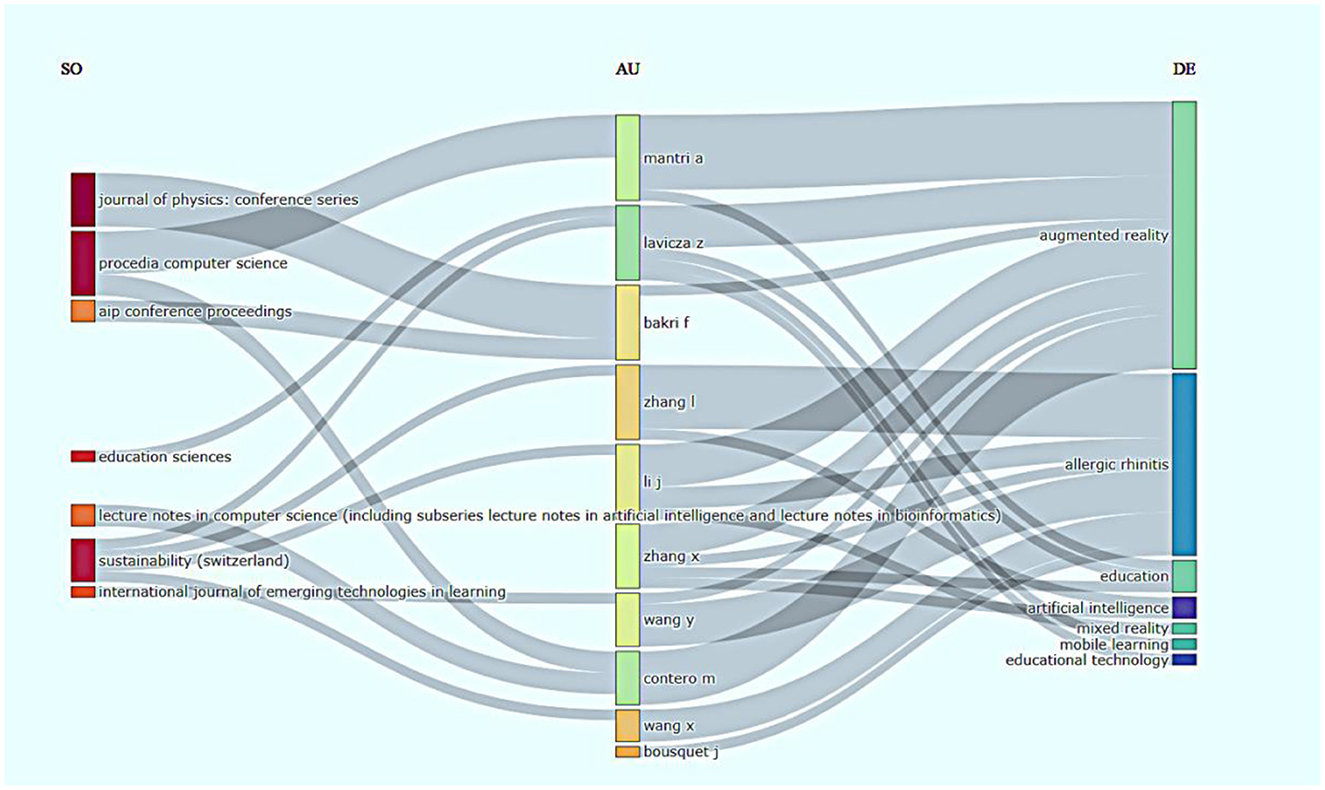
Figure 5. Three-field plot.
5.2.4 Relative sources
The ten best journals with a high impact factor based on citation counts are shown in Figure 6. These are vital indicators of a journal's standing. The Procedia Computer Science after the Journal of Physics: Conference Series, the journals most popular with academics searching for high-quality papers are Sustainability and Computer Science.

Figure 6. Relevant sources.
5.2.5 Local impact of source
Citations acquired by author or from another available document, that incorporated within the study are known as local citations (Chughtai et al., 2018). On the other hand, the total citations (TC) that an evaluation gathers from texts included in a bibliographic database (Kaur et al., 2022). With 1,875 local citations, Computers and Education ranked first in Figure 7, followed by Procedia Computer Science (1,201).
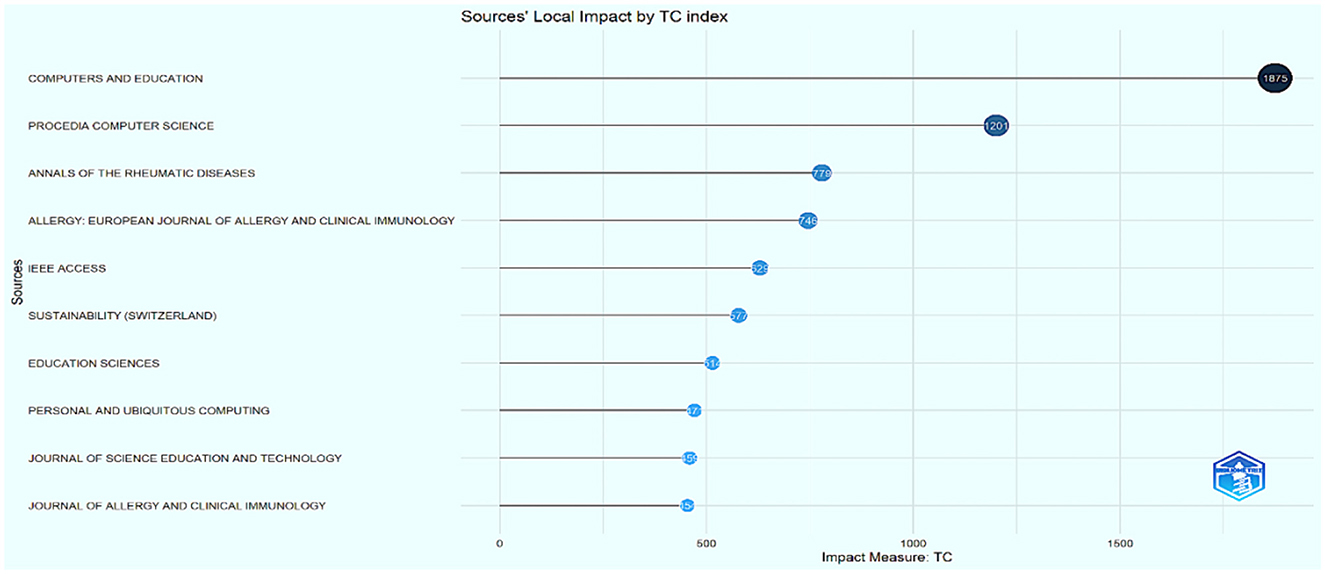
Figure 7. Source's local impact.
5.2.6 Sources production over time
The quantity of publications cross various periods was displayed using the “LOESS” (locally estimated scatterplot smoothing) method to show the expansion in sources for the top five journals. Based on these findings, studies on AR in the classroom started just before 2010. Since 2010, the Journal of Physics: Conference Series has grown significantly. Journal of Physics: Conference Series published three papers in 2010, 111 articles in 2022, and 112 articles until mid-2023 (till July). Since 2012, the number of documents published in Procedia Computer Science has increased significantly. As of mid-2023, 64 publications have been published in Procedia Computer Science, compared to just one paper in 2012 as shown in Figure 8.
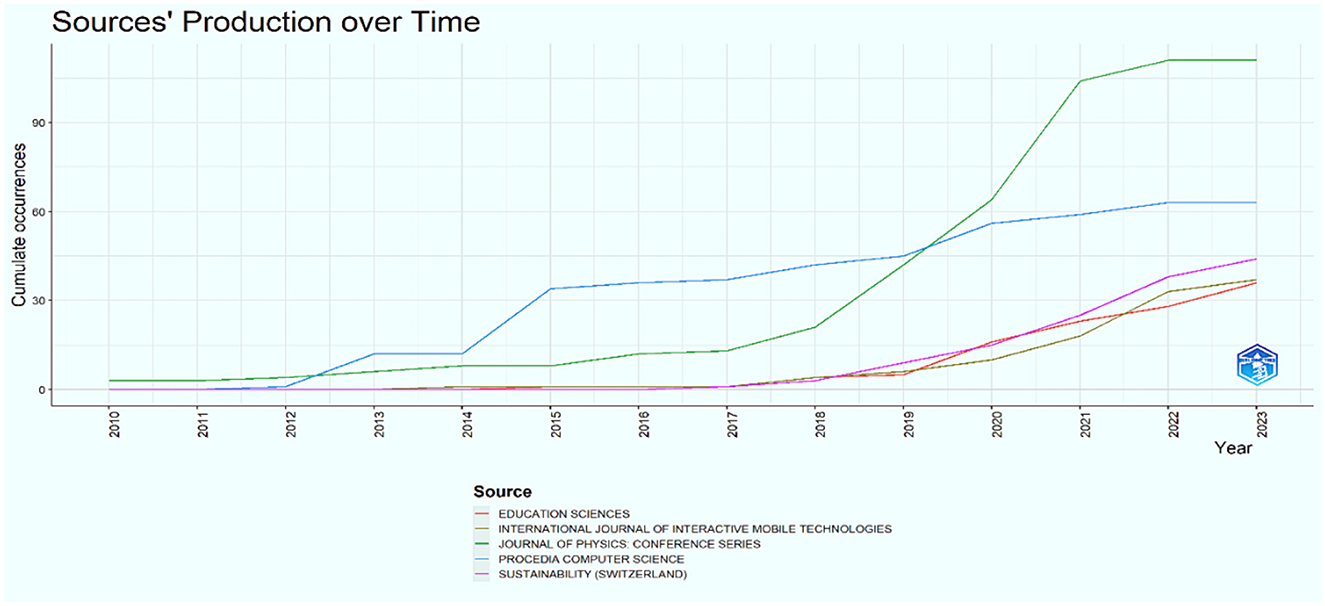
Figure 8. Dynamics of sources.
5.2.7 Relevant affiliation
A citation can be used to connect documents as well as ideas (Kaur et al., 2022). Citation analysis is a helpful tool for tracking transformations in their performance throughout time and analyzing the impacts of numerous variables on the research phase, including countries, universities, research centers, and journals. Figure 9 shows that the universities have the highest citation rates for works by affiliated authors. It was found that London Malang, Indonesia, dominated in citations; Imperial College London obtained a minimum of 42 citations, while University Negeri Malang received 40. The graph displays the top 10 associations, ordered by the number of articles, for identifying augmented reality in education.
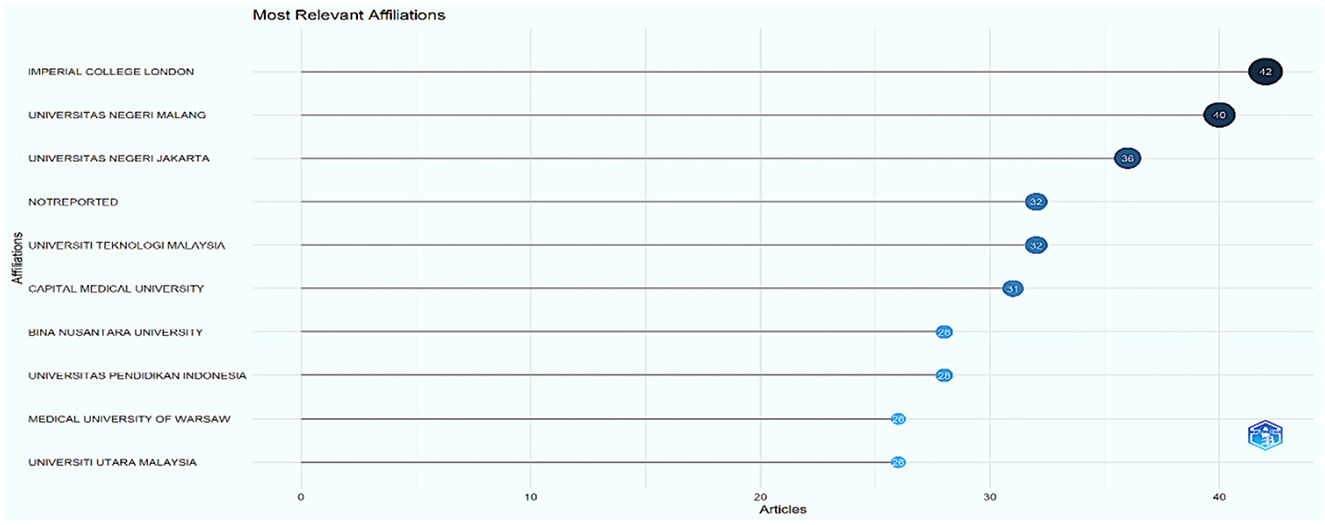
Figure 9. Relevant affiliation.
5.2.8 Nations or regional distribution
Since education is a worldwide issue that affects all aspects of society, it is not limited to one country. It has, therefore, been the subject of investigation worldwide. Based on Table 3's breakdown of publication frequency by nation, it is evident that the United States, China, and Indonesia are the three most dominant nations in this subject.
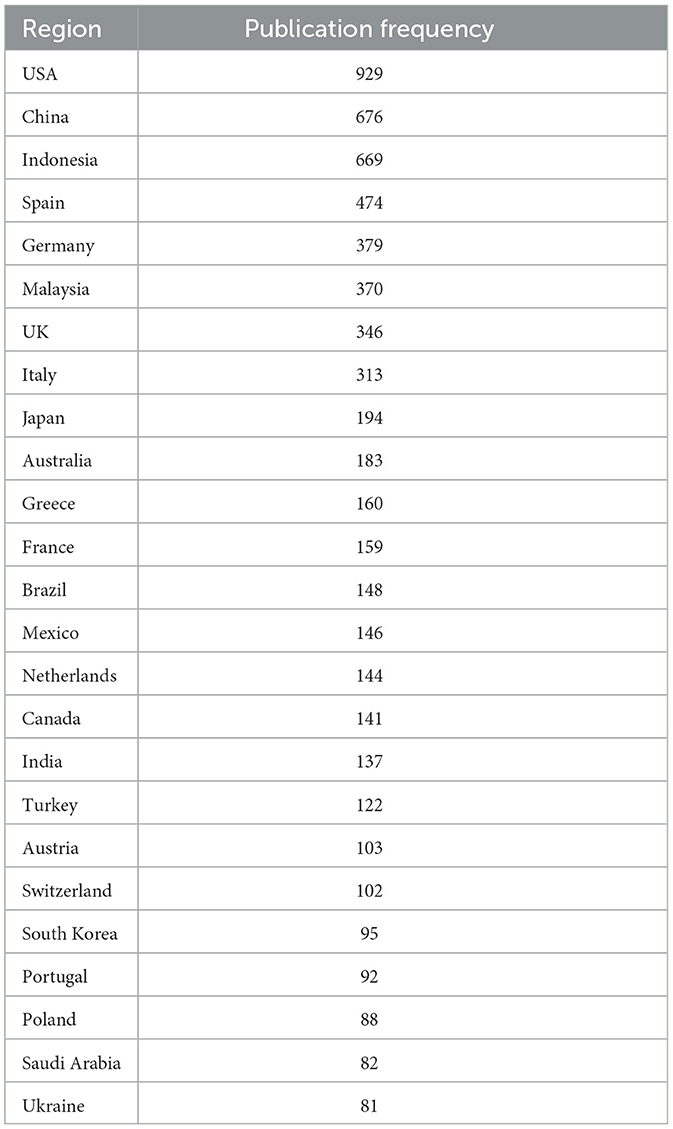
Table 3. Countries' scientific production.
Table 4 displays the nation's total citation acquisition and the average number of article citations. Notes: Total Citation is TC.

Table 4. Countries most cited.
5.2.9 Production of the country over time
Figure 10 demonstrates how different countries contributed to the scientific production theme, with five countries concentrating on their research. Out of the five countries, the country that produces the most significant number of scientific articles is the United States of America. China, Indonesia, Germany, and Spain take the following five positions.
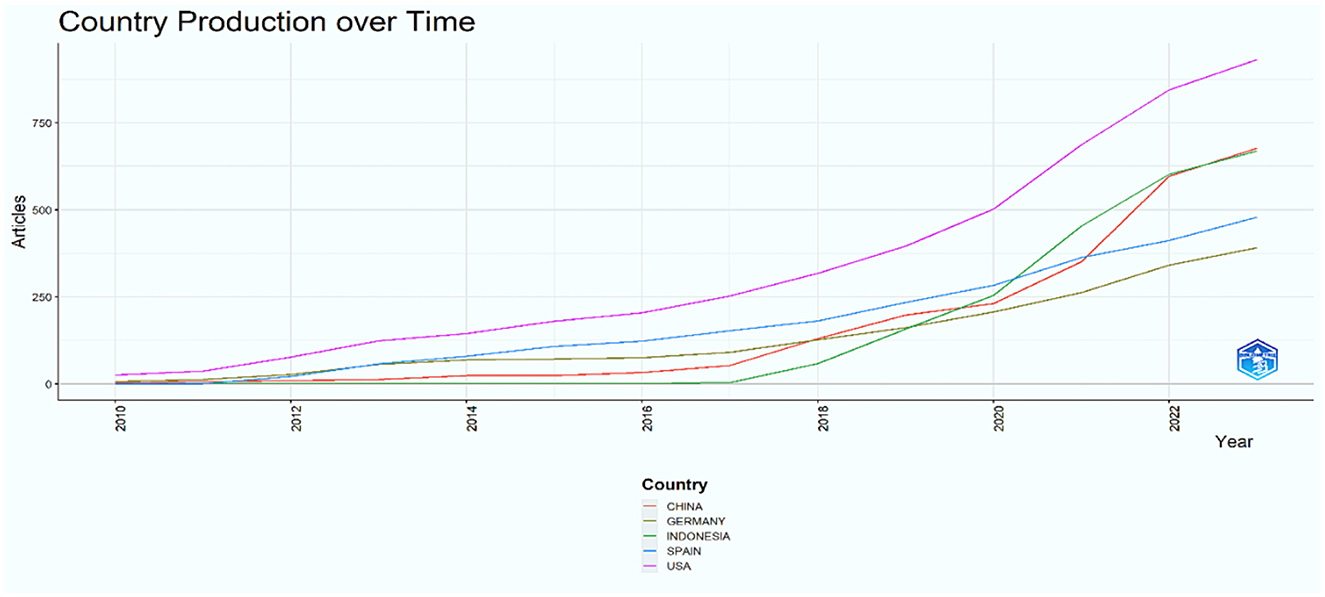
Figure 10. Production of the country over time.
5.2.10 Documents
The total number of documents cited throughout all database articles was calculated using global citations. Highly referenced papers can also be found using global citations. Local citations were used to determine citations number received by a document from the other articles within the collection under review. As per Scopus, the most commonly cited works are displayed in Figure 11. According to research, 25,292 citations were made to 1,734 internationally referenced papers. Thirty of the 1,734 papers with worldwide citations obtained more than 100 citations, while the remainder received fewer than 100. Out of the 1,734 documents that were cited globally, 181 were successful in acquiring a citation, while the remaining 372 publications were unsuccessful in doing so.
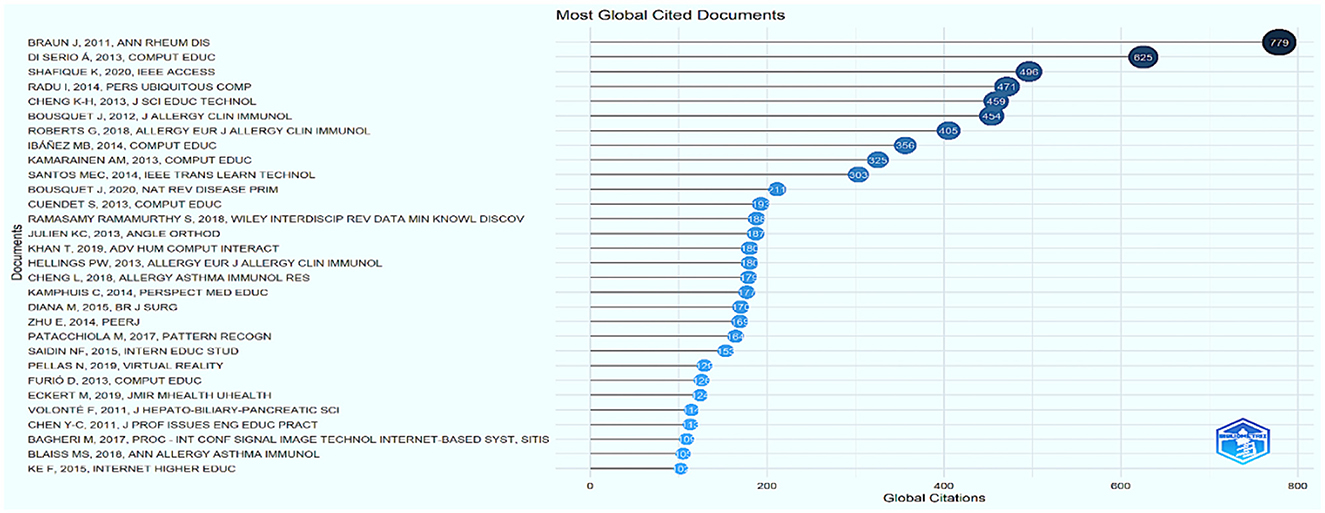
Figure 11. Global citation.
5.2.11 Word cloud
Word clouds (wordless), word collages, or word clouds, depict visually highlighted words that appear with greater frequency (DePaolo and Wilkinson, 2014). This type of visualization highlights the most commonly used phrases, making it easier for future scholars to comprehend the state of the selected subject. As shown in Figure 12, a word cloud was produced by downloading a Scopus file among the 50 foremost authors. Two keywords appear in academic writings: Keywords Plus, which are terms or phrases commonly found in the titles of referenced references, and Author Keywords, which are terms or phrases selected by the original authors (DePaolo and Wilkinson, 2014; Zhang et al., 2016; Tripathi et al., 2018; Garfield, 1990).
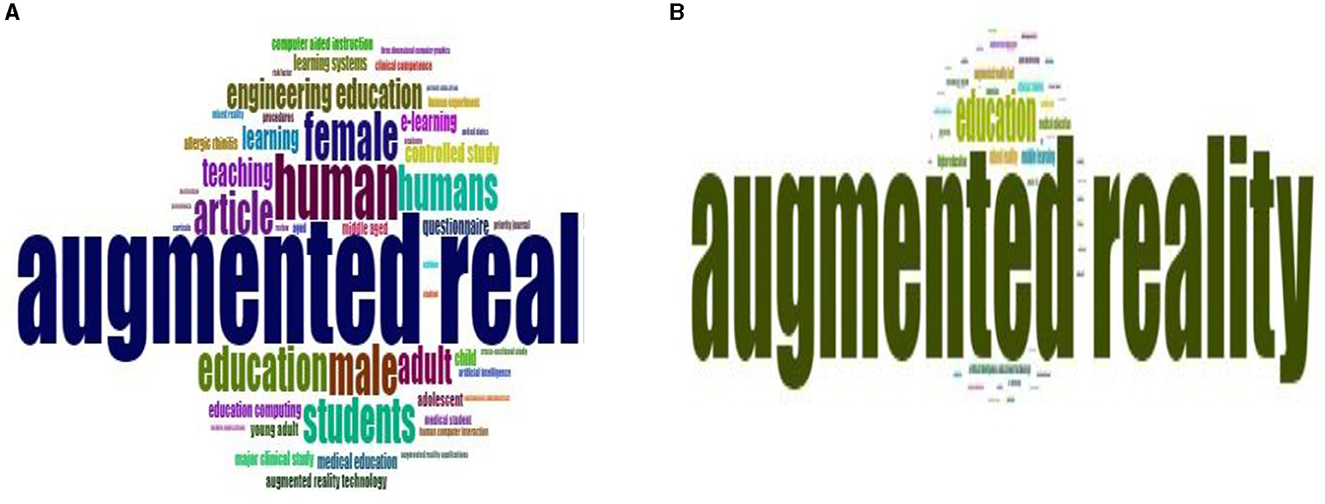
Figure 12. Word cloud: (A) keyword plus; (B) author's keyword.
Table 5 displays Figure 12's top ten keywords and additional keywords.
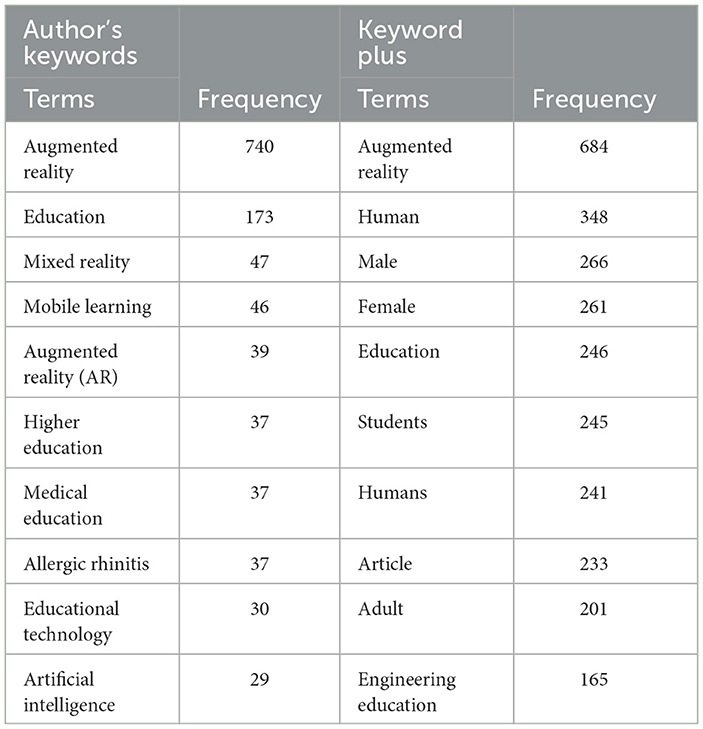
Table 5. Keywords plus and keywords from the top 10 authors.
5.2.12 TreeMap
To identify relevant articles, search engines and indexers use keywords included in articles. If database search engines find writers' keywords, readers can access the work. As a result, the manuscript is viewed by more people and receives more citations. These data can be used to identify areas of potential interest for further research, as well as knowledge gaps and research trends. For each article, the top 50 most used terms are shown in a word tree map (Su and Li, 2019). The TreeMap in Figure 13 combines potential keywords, augmented reality, and education. The most common keywords were “augmented reality,” “education,” “higher education,” “medical education,” and “mixed reality. The field of AR in education has been significantly touched by COVID-19, artificial intelligence, and educational technology.
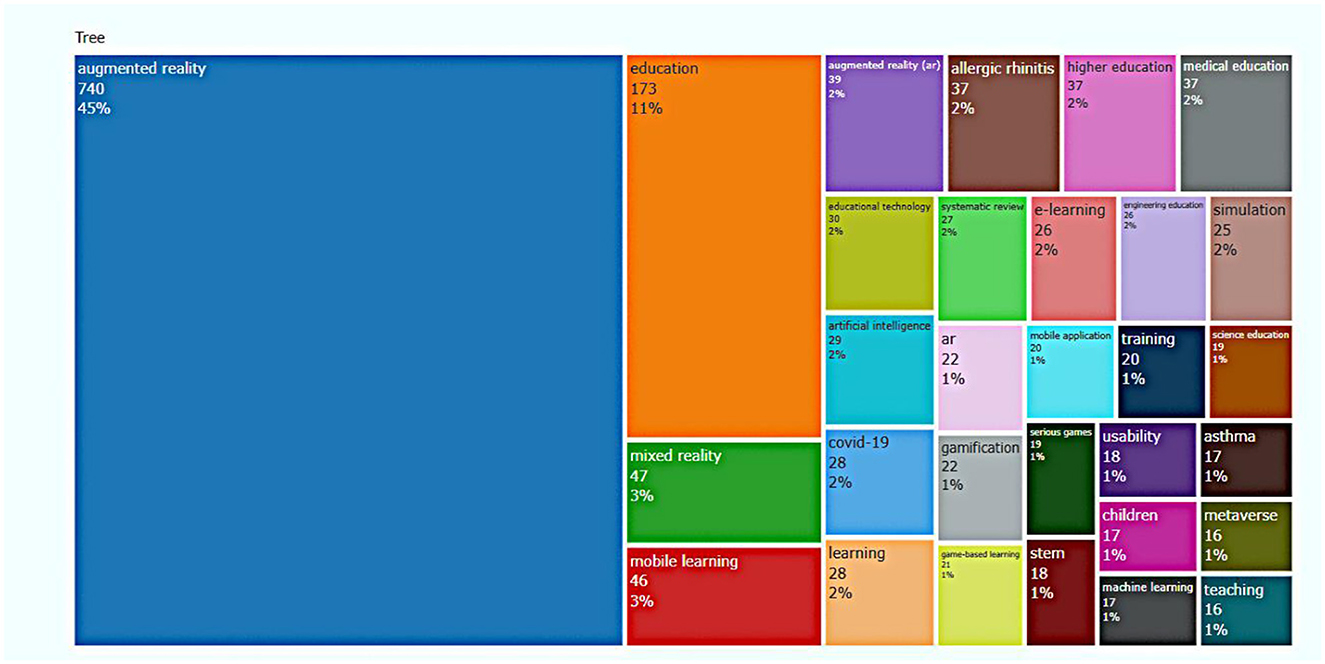
Figure 13. Tree map.
5.2.13 Trending topics
Figure 14 shows the trends of keyword searches for writers from 2018 to 2023. The years q1, q2, and q3 represent the various periods. Bubbles on a line depicting a popular topic, like X, can indicate how many articles have been written about the bubble size. A bubble in a particular year signifies that the year saw the publication of at least one paper on this topic. Between 2018 and 2020, case studies featured 5 times; autism appeared 7 times; game-based learning appeared 20 times; medical education appeared 34 times; mixed reality appeared 46 times; education appeared 33 times; and between 2020 and 2022, augmented reality appeared 599 times. Between 2022 and 2023, telehealth made eight appearances, mobile phones made seven appearances, and healthcare made seven appearances. Between 2019 and 2022, mobile devices showed up seven times, higher education 31 times, and educational technology 30 times.
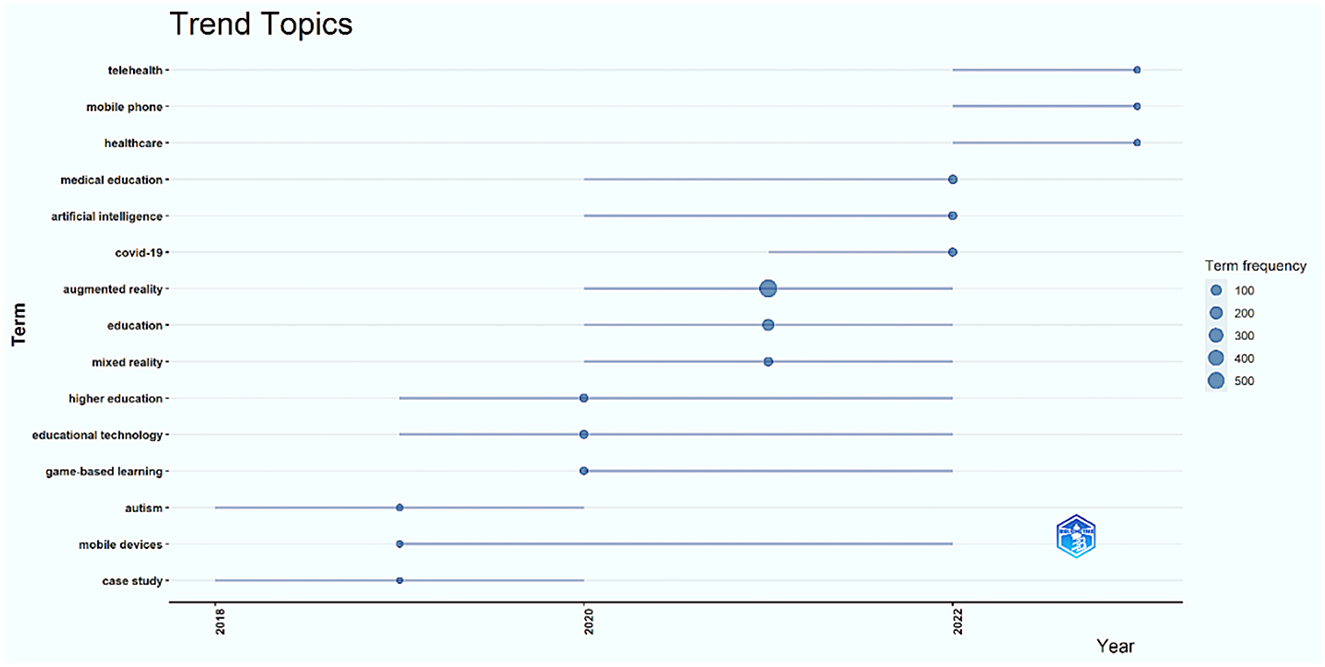
Figure 14. Trend topics.
6 Scientific mapping
Examining the connections between the abovementioned research components is known as scientific mapping. The goal is to determine the conceptual and structural relationships between and among the various study components. Scientific mapping methods use citation analysis (Meho and Rogers, 2008). To determine the connections among articles and which ones are the most significant. Keywords are succinct, fundamental terms that describe the topic of the material. Co-word analysis—Research trends are determined through scientific mapping using textual data (keywords), encompassing abstract and title. Author collaborations are found via co-authorship analysis. Bibliographic coupling helps ascertain the connections between referenced articles (Noyons et al., 1999).
6.1 Conceptual approach
Researchers commonly use conceptual frameworks to understand the issues that academics address (referred to as “research fronts”) to choose the most current topics (Aria and Cuccurullo, 2022; Cobo et al., 2018). A conceptual framework can illuminate the topology of a scientific field through the application methods like metric multidimensional scaling (MDS), multiple correspondence analysis (MCA) (Castañeda et al., 2022), correspondence analysis (CA), and generating a bipartite network of the terms sourced from abstracts, titles, or keywords.
6.1.1 Network approach
Numerous network structures are revealed by bibliometric analysis, the two primary ones being collaboration networks, where connections indicate co-authorships of papers, and citation networks, where links reflect bibliographic citations. Either with VOSviewer or R scripts, the network Plot enables the visualization of a network constructed by biblio Network. When bibliometric units like scholars and journals are appropriately studied, essential components of the underlying research system are captured.
6.1.2 Co-occurring network keywords
Keywords are the fundamental concepts that explain the data and content (Zardari et al., 2022). We may produce a map of networks for visualization using text-based scientific mappings (keywords), such as the title and abstract. A node in this network represents a keyword, and the edges connecting these nodes constitute the co-word network. A correlation is present if two nodes, or keywords, are linked. Closer nodes and vice versa indicate higher correlations. A larger node implies that it is carrying more weight. Of 4,219 terms, 169 meet this analysis's five minimum occurrence thresholds. The investigation of 1,734 articles produced 169 keywords, or nodes (n), which were mapped into 14 clusters using the default setting of selecting the 60% most relevant phrases. Figure 15 illustrates this process.
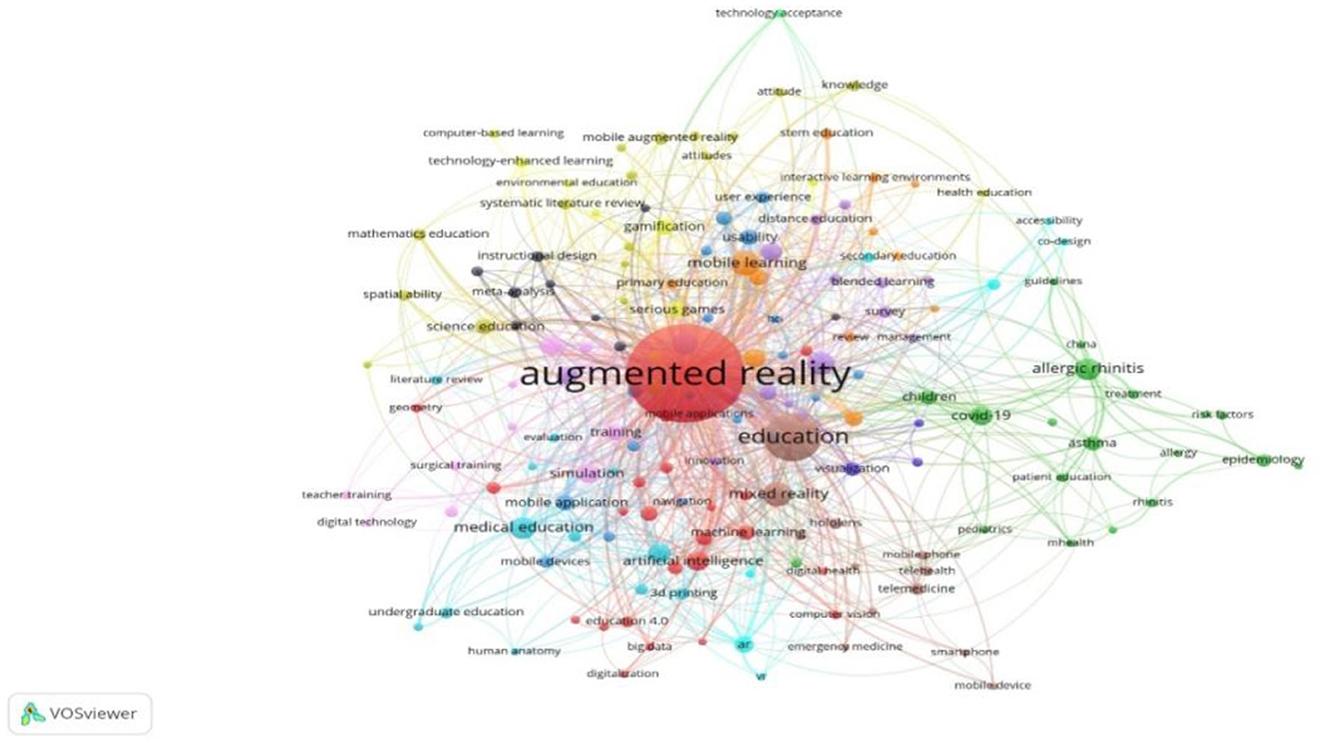
Figure 15. Co-occurring network keywords.
An assessment of the created clusters in the visualization map network was also conducted to find trends and patterns in the research. Different colors were used to indicate each cluster. The red cluster (n = 21), dominated by augmented reality, included active learning, artificial intelligence, autism, big data, computer vision, digital health, education 4.0, emerging technologies, teaching, mobile applications, and online education. The green cluster (n = 19) mainly focused on allergic rhinitis and COVID-19, asthma, health, pediatrics, treatment, children, and public health in China. The blue cluster (n = 18) focused on new technology, including Google Glass, usability, teacher education, navigation, and smart glasses. The golden cluster (n = 18) included the following keywords: academic accomplishment, attitude, chemistry education, cognitive load, and health education. Augmented reality (ar), bibliometric analysis, e-learning, the metaverse, and survey keywords were all found in the purple cluster (n = 16). Classification, 3D printing, learning, literature review, medical students, medical education, and human anatomy were all included in the sky-blue cluster (n = 12). Finally, case study, game-based learning, mobile learning, stem, and primary education keywords were found in the orange cluster (n = 12). The education-dominated brown cluster includes Hololens, emergency medical, telemedicine, mixed reality, mobile computing, and surgery (n = 12). Anatomy, digital technology, nursing education, and the term “laparoscopy” were all included in the pink cluster (n = 10). The gray cluster concentrated on primary education and using augmented reality in the classroom (n = 9). The yellow cluster (n = 8) is devoted to video games and gamification. The turquoise color cluster contained seven VR, co-design, collaborative learning, and distant learning activities. The dark blue cluster (n = 3) included visualization, augmented reality technology, and mathematics. There was one light green cluster (n = 1) with technology access. Future studies can gain the following insights by looking at the co-occurring terms in the abstract and title:
• In what ways may Augmented reality enhance traditional methods of instruction to improve student engagement and knowledge, especially in science subjects?
• How may the metaverse be used to provide immersive learning environments for healthcare specialties like patient counseling or surgical training?
• How may AR and MR technologies promote collaborative learning experiences that help healthcare workers share knowledge and improve their skills?
• What cognitive effects do prolonged use of AR technologies have on the ability to retain information?
• How can e-learning systems include game-based learning approaches in an effective way to increase student motivation?
• When physical laboratories are unavailable or have limited resources, how might AR-based laboratory simulations be created to give students real-world, hands-on experiences?
• In disciplines like biology, engineering, and archaeology, where practical experimentation and discovery are crucial, how can 3D AR simulations support actual learning experiences?
• How do AR apps affect cooperative and collaborative learning experiences that help young kids develop their social skills, teamwork abilities, and peer connections in elementary school settings?
• What difficulties exist in using AR technology in elementary education settings with limited resources, like rural schools or low-income areas?
• How can dynamic and immersive learning environments be created in the classroom using HoloLens technology?
• How does using AR in distance education affect student motivation and learning outcomes?
6.1.3 Thematic map
Thematic maps come in two dimensions to illustrate the typological motifs (Castañeda et al., 2022; Bhatt et al., 2022). Co-word analysis is used to find keyword clusters, which lead to themes within the research subject. These motifs fall into four quadrants on a two-dimensional network where the two dimensions are centrality and density. A bubble on the map represents each theme on the graph (Figure 16). The subjects discussed the most were augmented reality, education, mobile learning, higher education, and educational technology.
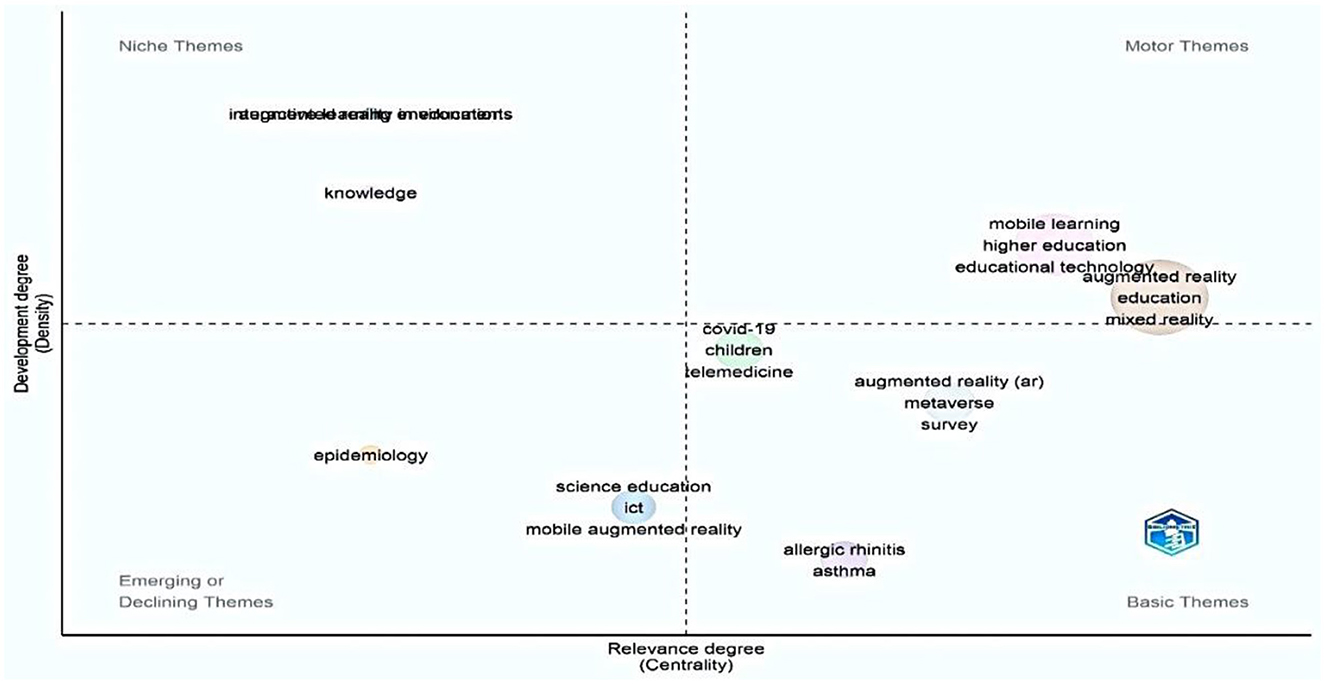
Figure 16. Thematic map.
Additionally, these topics were the most centrally distributed and most significant density located in the diagram's upper right quadrant. The line between the first and second quadrants demonstrated how immature and dense blended reality was. The core themes in the lower right quadrant—children, telemedicine, augmented reality (ar), metaverse, COVID-19, and survey—indicate important yet underdeveloped areas. Niche themes, such as interactive learning environments and well-developed knowledge but weak and minor value in external relationships, were depicted in the upper left quadrant. Although their significance, epidemiology, science education, and mobile augmented reality were underdeveloped, they represented both “emerging” and “declining ties.”
6.1.4 Factorial evaluation
In addition to keywords, Bibliometrix extracts words from publications titles and abstracts using Multiple correspondence analysis (MCA), correspondence analysis (CA), and network analysis (Cobo et al., 2018; Bhatt et al., 2022; Kaushal et al., 2021; Surwase et al., 2011). The conceptual structure is displayed in two dimensions via CA and MCA (Figure 17). Cluster 1 (red) covered gamification, augmented reality, mobile applications, education, e-learning, training, higher education, engineering education, and educational technology. These terms have something to do with education. Concepts including COVID-19, allergic rhinitis, and augmented reality (AR) were presented by Cluster 2 (blue). These phrases relate to medical science and augmented reality services for COVID-19.
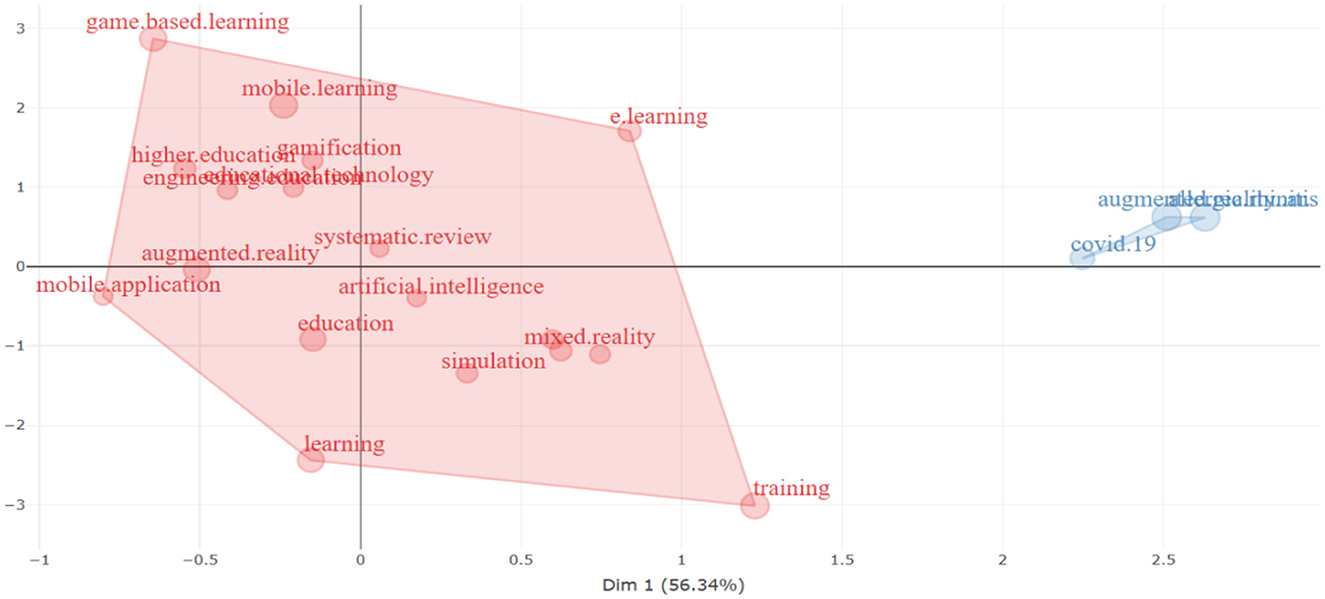
Figure 17. Factorial evaluation multiple correspondence conceptual structure map examination of keywords.
7 Intellectual structure
By examining writer-nation interactions, the intellectual framework allows for deriving conclusions regarding how different writers impact the scientific community. Examining citations and co-citations can reveal the research community's collaborations and these organizations' relationships with other institutions.
7.1 Bibliographical coupling between countries
Bibliographical and co-citations interconnection are the contrary of one another. If a 3rd publication is cited in both of the aforementioned publications, then the publications are bibliographically connected. Put another way, “Bibliographic coupling” is the procedure of both studies referring to a 3rd publication the bibliographies; this refers to a publication overlap reference list. When two publications have a stronger bibliographic coupling, they exchange more references. A bibliographic coupling map can be made with VOSviewer's Create MapWizard using documents, sources, authors, organizations, and nations (Jan van Eck and Waltman, 2015). Instead of co-citation analysis, canonical symbiosis might highlight specialized and recent articles more prominently because the citing publications form the subject clusters in this case. As a result, the analysis accurately portrays the state of the field.
7.2 Document X citations
Only 68 of the 124 countries fulfilled the minimum requirements for document magnitude, and the number of citations was set at 50. We calculated the overall intensity of the bibliographic connection coupling with other countries for each of the 68 countries, as shown in Table 6 and Figure 18.
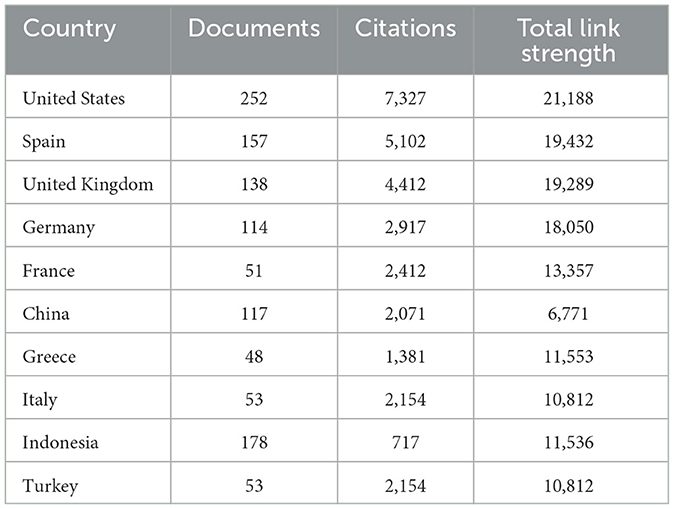
Table 6. Country connection in the literature.
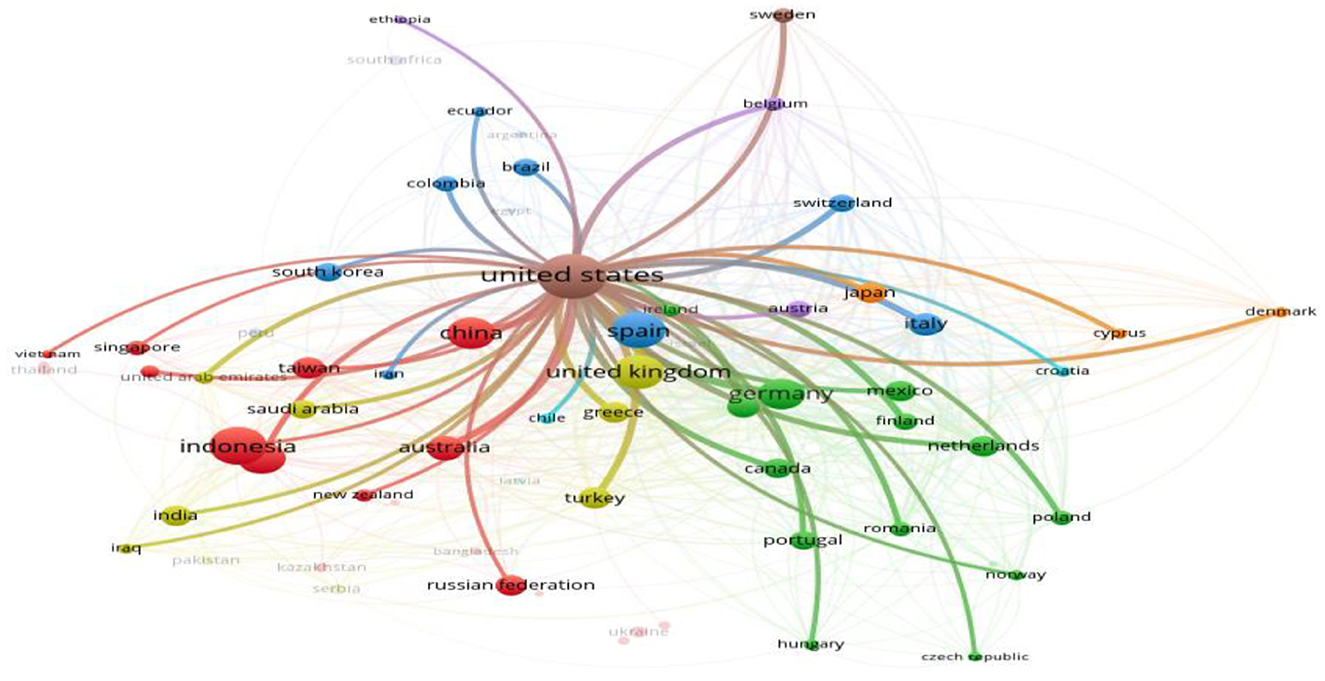
Figure 18. Document * citation.
After the United States came to Spain, the United Kingdom, Germany, France, China, Greece, Italy, Indonesia, and Turkey had the most incredible articles written. The countries with the most citations were Germany, Spain, Indonesia, and the United States. Eight groups of countries were identified using the cluster analysis.
7.3 Co-citation authors
Regularly referring to two documents together in other publications is known as co-citation. If both documents are cited in at least one other document, they are considered co-cited (López-Robles et al., 2021). When two papers have a higher co-citation potency, there is a higher chance that they are semantically related and will receive additional co-citations. This enables us to draw attention to subfields and recently developed analysis areas within the subject of study and how they relate to other specializations. Author co-citation analysis examined a subject domain's intellectual structure (Jeong et al., 2014; Katz and Martin, 1997). Citations, cited sources, or cited authors can be used as the unit of study in a co-citation analysis, the relationships between the three author clusters are shown in Figure 19. Of the 101,522 authors, 159 had a minimum of 50 citations, meeting the required number. The co-citation connection strength for each of the 159 authors was computed. VOSviewer was used to construct this visualization, in which each circle represents a distinct author. The closer the two circles are the stronger the link between them. Based on this study, the authors with the most significant impact were Baldiris S (the red cluster), 240 citations; Bousquet J (the green cluster), 260 citations; and Wang X, 230 citations; Billinghurst M (the blue cluster), 407 citation and Azuma R T 213 citations; Radu I (the purple cluster) 179 citations; and Hawng G J (the yellow cluster) 131 citations.
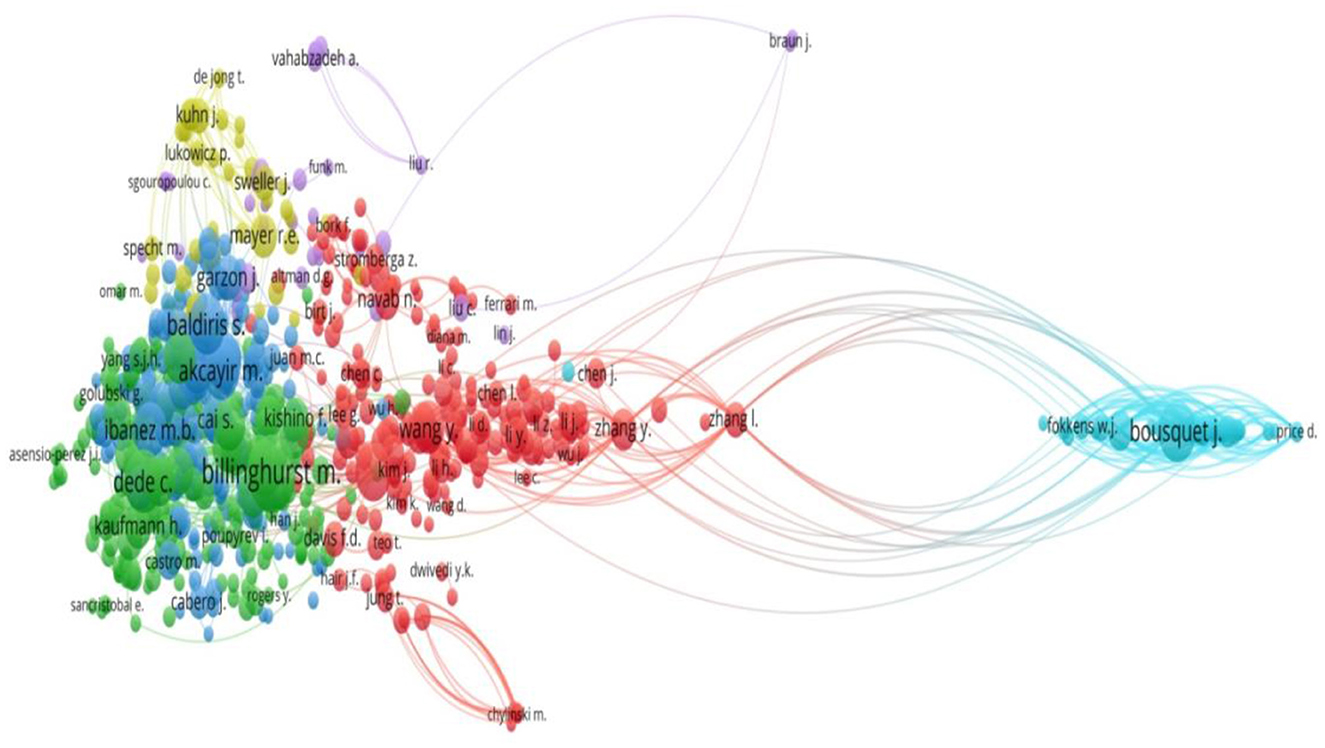
Figure 19. Co-citation authors.
8 Social structure
The educational AR area's social structure reveals the connections between authors, organizations, and countries (van Eck and Waltman, 2010).
8.1 Collaboration network
Over the past few decades, research collaboration has grown in popularity (Lewis, 2021). The noted increase in co-authorship provides some evidence for greater research collaboration. Researchers collaborate for several reasons, including the need to find solutions to complex research challenges, the goal of advancing knowledge and productivity in the field, the need to reduce expenses related to their jobs, and the requirement for intellectual stimulation (Huang, 2014; Michailidis, 2022). Researchers have started collaborating regularly. The research theories and their methods have become more complex (Bansal et al., 2019). Academic collaboration can improve research; different perspectives, for example, may provide additional depth and clarity. As the data below shows, a collaboration between writers can unavoidably outcome in cooperation between organizations and countries.
8.1.1 Author-wise collaboration
The arrangement of social organization is co-authorship form. According to Biryukov (2010), Co-authorship networks make it possible to find groups of famous and prolific authors, relevant academic organizations in a particular field of research, cooperative efforts, and more. Figure 20 displays the network of authorship ties between the authors, publications. Strong links to other authors are indicated by color in author clusters.
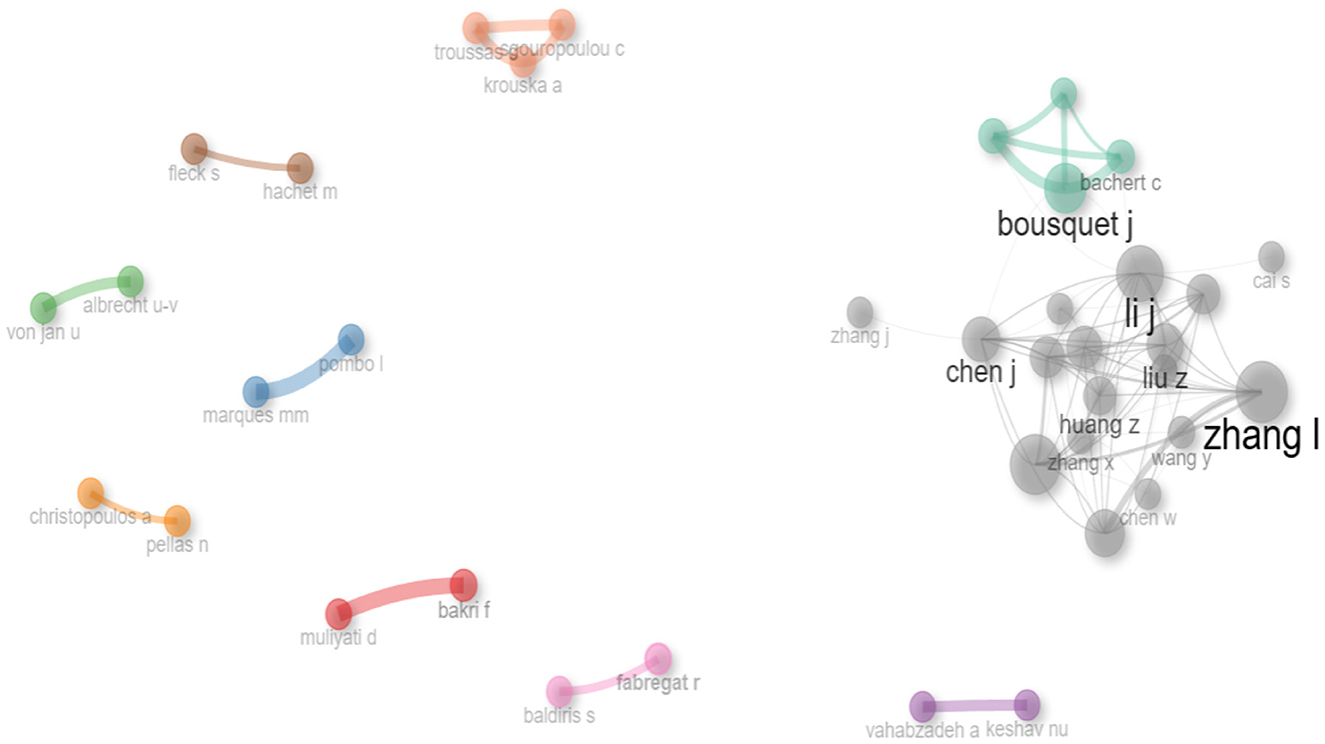
Figure 20. Connections between published authors in terms of co-authorship.
The Biblioshiny app uses the Walk trap clustering method to create the diagram up above. Every node is a researcher, and these nodes are grouped into clusters. Nodes and clusters with connecting lines show a co-authorship relationship. A group of people, Zhang X, Zhang J, Wnag Y, Chen W, Li J, Chen J, Liu J, Haung Z, Bousquet J, Bachert C, Hellings PW, and Scadding G, worked together to build a cluster (gray).
8.1.2 Collaboration of institute
“Collaboration” means that several academics work together to achieve a common objective. By working together, academic institutions can provide researchers with access to databases, personnel, tools, and study populations. They can also connect with other specialists in related fields and gain credibility by associating their names with famous departments, institutions, and researchers (Moral-Muñoz et al., 2020). Working with teams from different institutions might help bring new views to bear on research topics. Future collaboration may result from collaborating across institutions to increase the scope of one's research contact network. Figure 21 displays the affiliation network between the institutes with co-authored publications. Color indicates strong network connections between author clusters. They all belonged to the same cluster (red); they worked with the Imperial College London, University of California, Medical University of Warsaw, “Radboud University Medical Center,” and “Leiden University Medical Center.” They also collaborated with the institutes of the blue and purple color clusters. The blue color cluster included the “University of Toronto and the Technical University of Munich.” In contrast, the purple color cluster included “Capital Medical University, Huazhong University of Science and Technology,” and “Sun Yat-sen University.”
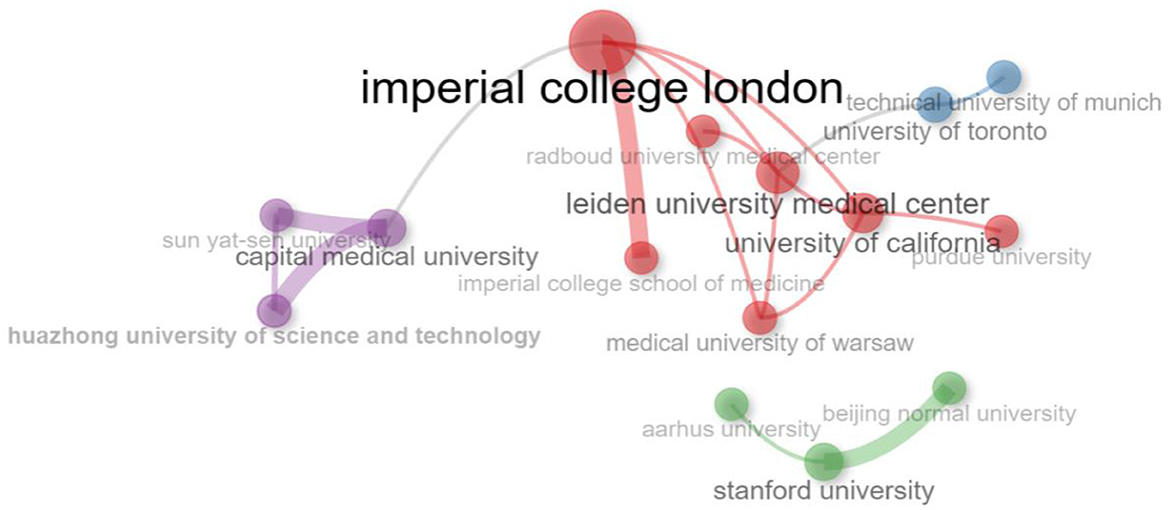
Figure 21. Co-authorship relationships among institutes.
8.2 World map of collaboration
Collaboration in academic analysis and research across international borders is becoming very normal. Global collaboration among researchers is helpful for their work since it can lead to developing novel ideas, acquiring specialized equipment, or access to new funding sources (Aria et al., 2021). Across borders and disciplines, scientists and researchers collaborated in remarkable ways during the pandemic. Figure 22 illustrates the global collaboration.
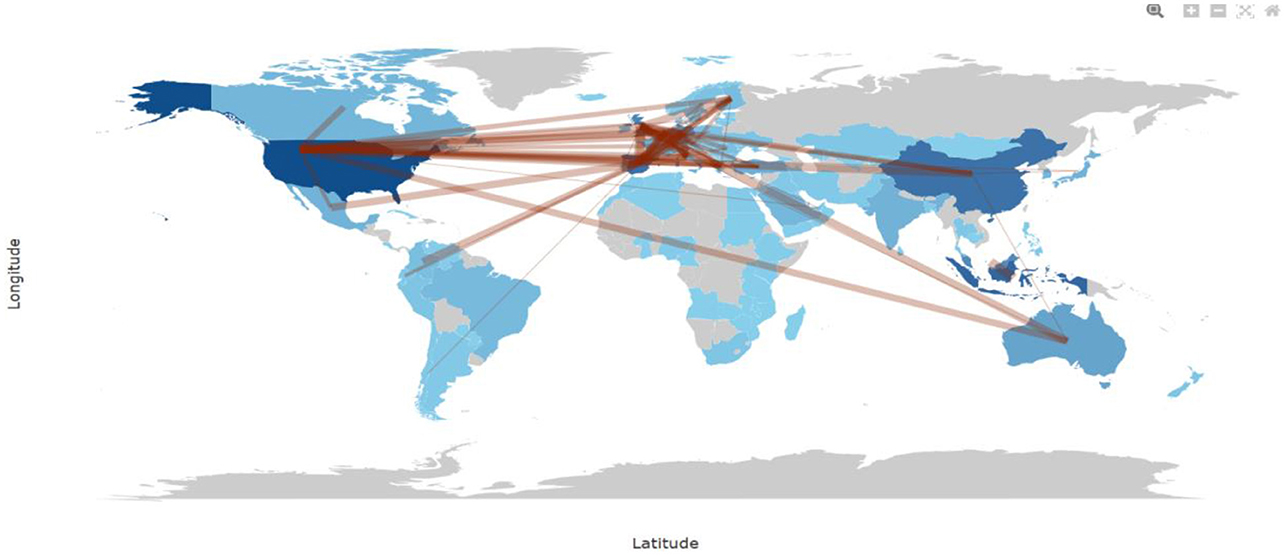
Figure 22. World wide collaboration.
A web application called Biblioshiny, which provides a Bibliometrix web interface, was used to create this diagram. In mathematics, a link between two nodes (vertices) is called a graph or an edge in a network. Here, the country act as the node, while collaboration between two countries acts as the edge. The edges frequency was set to a minimum of five. Examples of several of the partnerships are shown in Table 7. Germany and France (n = 13), the UK and Australia (n = 13), the USA and the UK (n = 14), and Germany and the Netherlands (n = 11) have the strongest collaboration links.
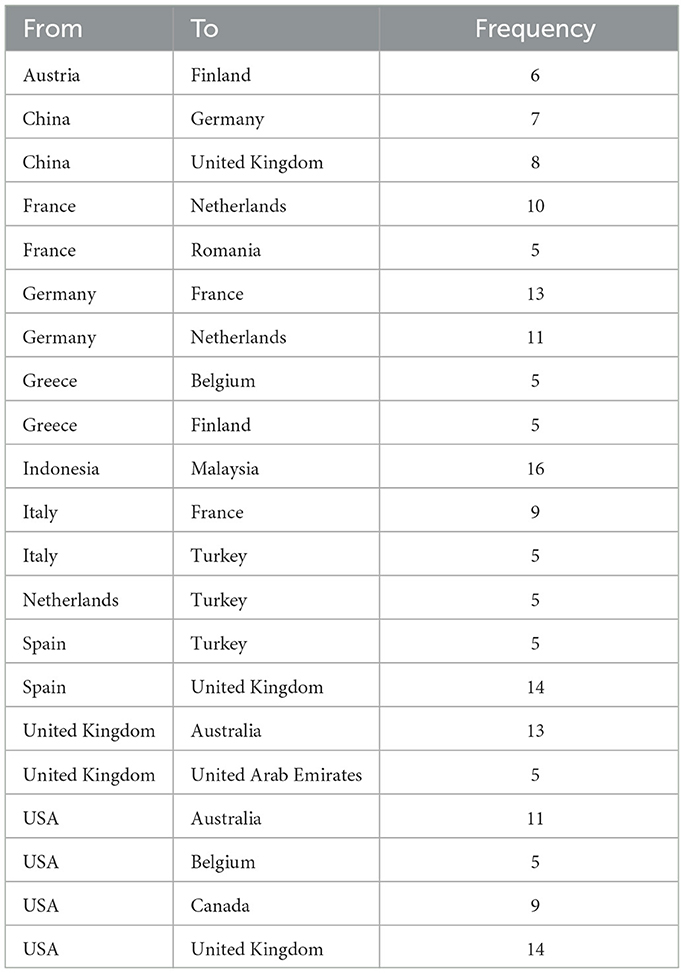
Table 7. Frequency of collaboration at global levels.
9 Conclusions and future directions
The study visualized research on augmented reality in education from 2010 to mid-2023 using bibliometric analysis. Viewer for VOS and the Bibliometrix R-package were selected as the work's tools because of their versatility and ease of use. There are additional bibliometric databases that are accessible nicely, some of which are free to use and some of which need a subscription, like Scopus, Web of Science, PubMed, and DBLP. People frequently utilize Google Scholar for this purpose because real-time mapping is available. However, using Google Scholar to look for predatory journals is not possible. The reputation of a research paper is likewise affected when it references a fraudulent journal. When a fake publication is cited in a study that, its credibility is damaged. The dataset for this study was created taking into account the Scopus database's availability, software compatibility, formal organization, and exceptional data sources.
The study's findings demonstrate that scholarly emphasis has evolved in the number of papers, especially those on augmented reality in education. The world's most significant production of articles on this subject is from the USA. For scholars searching for high-quality papers, the Journal of Physics: Conference Series is the most popular journal; nevertheless, since 2012, the number of publications in Procedia Computer Science has significantly expanded. Key phrases like education, mixed reality, augmented reality, and mobile learning were common. Imperial College London and University Negeri Malang received the most citations. Mixed reality, medical education, and augmented reality in the classroom were popular subjects. The two most frequently cited papers were Di Serio's (2013) and Braun's (2011).
Furthermore, by utilizing the bibliometric analysis to examine the publication of highly influential works written by well-known authors, global cooperation, and thematic development, new research possibilities are available for students who want researchers. Keyword co-occurrence in bibliometric coupling is classified into several clusters, with most of the clusters serving as augmented reality in healthcare, chemistry education, and education, and other clusters serving as technology, VR, metaverse, and Google Glass. In this examination, Liu H had the most significant influence among the authors, with 394 citations, Li Y (225 citations), and Zeng L (52 citations) in second and third place.
Terms that appear together (Co-occurring) in abstracts and titles might also be helpful to upcoming scholars because they can provide ideas for possible research issues. Because this bibliometric analysis just examined Scopus, there's still space for improvement. Scientific Citation Index articles can be helpful for further investigation. The fact that the study's conclusions were restricted to the keywords in Section 4.2 is an additional limitation. Including additional terms might make the keyword search more comprehensive and include further relevant articles to the study's topic. Since this study's methodology was limited to correlation and quantitative analysis, qualitative examination of the articles through careful reading of the whole text could reinforce its conclusions and provide a more thorough grasp of the research issue.
Author contributions
SS: Conceptualization, Data curation, Formal analysis, Investigation, Software, Visualization, Writing – original draft, Writing – review & editing. AK: Conceptualization, Data curation, Formal analysis, Investigation, Methodology, Project administration, Software, Supervision, Writing – original draft, Writing – review & editing. YG: Conceptualization, Data curation, Formal analysis, Funding acquisition, Investigation, Methodology, Project administration, Resources, Software, Supervision, Validation, Visualization, Writing – original draft, Writing – review & editing.
Funding
The author(s) declare financial support was received for the research, authorship, and/or publication of this article. This work was supported by the Deanship of Scientific Research, Vice Presidency for Graduate Studies and Scientific Research, King Faisal University, Saudi Arabia, under project KFU241441.
Conflict of interest
The authors declare that the research was conducted in the absence of any commercial or financial relationships that could be construed as a potential conflict of interest.
Publisher's note
All claims expressed in this article are solely those of the authors and do not necessarily represent those of their affiliated organizations, or those of the publisher, the editors and the reviewers. Any product that may be evaluated in this article, or claim that may be made by its manufacturer, is not guaranteed or endorsed by the publisher.
References
Akçayir, M., Akçayir, G., Pekta,ş, H. M., and Ocak, M. A. (2016). Augmented reality in science laboratories: the effects of augmented reality on university students' laboratory skills and attitudes toward science laboratories. Comput. Human Behav. 57, 334–342. doi: 10.1016/j.chb.2015.12.054
Albaladejo, E. G., Cerdá, A. G., Carreres, A. L., Lledó, G. L., and Lledó, A. L. (2020). Differences between traditional and augmented reality teaching. Educ. New Dev. 226:49. doi: 10.36315/2020end049
Aria, M., Alterisio, A., Scandurra, A., Pinelli, C., and D'Aniello, B. (2021). The scholar's best friend: Research trends in dog cognitive andbehavioral studies. Anim. Cogn. 24, 541–553. doi: 10.1007/s10071-020-01448-2
Aria, M., and Cuccurullo, C. (2017). bibliometrix: an R-tool for comprehensive science mapping analysis. J. Informetr. 11, 959–975. doi: 10.1016/j.joi.2017.08.007
Aria, M., and Cuccurullo, C. (2022). Science Mapping Analysis with Bibliometrix R-Package: An Example Install and Load BibliometrixR-Package. 2007–2017. Available at: https://bibliometrix.org/documents/bibliometrix_Report.html#section-1-descriptive-analysis (accessed May 5, 2024).
Arici, F., Yildirim, P., Caliklar, S., and Yilmaz, R. M. (2019). Research trends in the use of augmented reality in science education: content and bibliometric mapping analysis. Comput. Educ. 142:103647. doi: 10.1016/j.compedu.2019.103647
Azuma, R. T. A. (1997). Survey of augmented reality. Presence 6, 355–385. doi: 10.1162/pres.1997.6.4.355
Baas, J., Schotten, M., Plume, A., Côté, G., and Karimi, R. (2020). Scopus as a curated, high-quality bibliometric data source for academic research in quantitative science studies. Quant. Sci. Stud. 1, 377–386. doi: 10.1162/qss_a_00019
Bacca Acosta, J. L., Baldiris Navarro, S. M., Fabregat Gesa, R., and Graf, S. (2014). International forum of educational technology and society augmented reality trends in education : a systematic review of research and applications. Educ. Technol. 17, 133–149.
Bansal, S., Mahendiratta, S., Kumar, S., Sarma, P., Prakash, A., Medhi, B., et al. (2019). Collaborative research in modern era: need andchallenges. Indian J. Pharmacol. 51, 137–139. doi: 10.4103/ijp.IJP_394_19
Berryman, D. R. (2012). Augmented reality: a review. Med. Ref. Serv. Q. 31, 212–218. doi: 10.1080/02763869.2012.670604
Bhatt, K., Seabra, C., Kabia, S. K., Ashutosh, K., and Gangotia, A. C. O. V. I. D. (2022). Crisis and tourism sustainability: an insightful bibliometric analysis. Sustainability 14:12151. doi: 10.3390/su141912151
Biryukov, M. (2010). “Analysis of computer science communities based on DBL,” in Research P, and Advanced Technology for Digital Libraries: 14th European Conference, ECDL 2010, Glasgow, UK. September 6-10, 2010. Proceedings 14 (Springer Berlin Heidelberg), 228–235.
Braun, J. V., van den Berg, R., Baraliakos, X., Boehm, H., Burgos-Vargas, R., Collantes-Estevez, E., et al. (2011). 2010 update of the ASAS/EULAR recommendations for the management of ankylosing spondylitis. Ann. Rheum. Dis. 70, 896–904. doi: 10.1136/ard.2011.151027
Cabero-Almenara, J., Barroso-Osuna, J., Llorente-Cejudo, C., and del Martínez, M. F. (2019). Educational uses of augmented reality (AR): experiences in educational science. Sustainability 11, 1–18. doi: 10.3390/su11184990
Caputo, A., and Kargina, M. (2022). A user-friendly method to merge Scopus and Web of Science data during bibliometric analysis. J. Market. Analy. 10, 82–88. doi: 10.1057/s41270-021-00142-7
Castañeda, K., Sánchez, O., Herrera, R. F., and Mejía, G. (2022). Highway planning trends: a bibliometric analysis. Sustainability 14:5544. doi: 10.3390/su14095544
Cheng, K. H., and Tsai, C. C. (2013). Affordances of augmented reality in science learning: suggestions for future research. J. Sci. Educ. Technol. 22, 449–462. doi: 10.1007/s10956-012-9405-9
Chmielewski, M., Sapiejewski, K., and Sobolewski, M. (2019). Application of augmented reality, mobile devices, and sensors for a combat entity quantitative assessment supporting decisions and situational awareness development. Appl. Sci. 9:4577. doi: 10.3390/app9214577
Chughtai, G. R., Lee, J., Khan, M. M. A., Abbasi, R., Kabir, A., Hassan, M. A. S., et al. (2018). Global citation impact rather than citation count. Int. J. Adv. Comput. Sci. Appl. 9, 246–253. doi: 10.14569/IJACSA.2018.090735
Cobo, M. J., Jürgens, B., Herrero-Solana, V., Martínez, M. A., and Herrera-Viedma, E. (2018). Industry 4.0: A perspective based on bibliometric analysis. Procedia Comput. Sci. 139, 364–371. doi: 10.1016/j.procs.2018.10.278
Cobo, M. J., López-Herrera, A. G., Herrera-Viedma, E., and Herrera, F. (2012). SciMAT: a new science mapping analysis software tool. J. Am. Soc. Inf. Sci. Technol. 63, 1609–1630. doi: 10.1002/asi.22688
Datta, P., Kaur, A., Sassi, N., and Gulzar, Y. (2024). An evaluation of intelligent and immersive digital applications in eliciting cognitive states in humans through the utilization of Emotiv Insight. MethodsX 12:102748. doi: 10.1016/j.mex.2024.102748
DePaolo, C. A., and Wilkinson, K. (2014). Get your head into the clouds: using word clouds for analyzing qualitative assessment data. Tech. Trends 58, 38–44. doi: 10.1007/s11528-014-0750-9
Di Serio, Á., Ibáñez, M. B., and Kloos, C. D. (2013). Impact of an augmented reality system on students' motivation for a visual art course. Comput. Educ. 68, 586–596. doi: 10.1016/j.compedu.2012.03.002
Donthu, N., Kumar, S., Mukherjee, D., Pandey, N., and Lim, W. M. (2021). How to conduct a bibliometric analysis: an overview and guidelines. J. Bus. Res. 33, 285–296. doi: 10.1016/j.jbusres.2021.04.070
Egger, J. (2020). Augmented reality in support of intelligent manufacturing–a systematic literature review. Comput. Industr. Eng. 140:106195. doi: 10.1016/j.cie.2019.106195
Fernández-Enríquez, R. (2020). Augmented reality as a didactic resource for teaching mathematics. Appl. Sci. 10:2560. doi: 10.3390/app10072560
Fidan, M., and Tuncel, M. (2019). Integrating augmented reality into problem-based learning: The effects on learning achievement and attitude in physics education. Comput. Educ. 142:103635. doi: 10.1016/j.compedu.2019.103635
Garfield, E. (1990). KeyWords plus: isi's breakthrough retrieval method. part 1. expanding your searching power. Curr. Contents Disk. 32, 3–7.
Garzón, J. (2021). An overview of twenty-five years of augmented reality in education. Multimodal Technol. Inter. 5:37. doi: 10.3390/mti5070037
Gokhale, A., Mulay, P., Pramod, D., and Kulkarni, R. (2020). A bibliometric analysis of digital image forensics. Sci. Technol. Libr. 39, 96–113. doi: 10.1080/0194262X.2020.1714529
Guntur, M. I. S., Setyaningrum, W., Retnawati, H., and Marsigit, M. (2020). “Assessing the potential of augmented reality in education,” in ACM International Conference Proceeding Series, 93–97. doi: 10.1145/3377571.3377621
Hanid, M. F. A., Mohamad Said, M. N. H., and Yahaya, N. (2020). Learning strategies using augmented reality technology in education: meta-analysis. Unive. J. Educ. Res. 8, 51–56. doi: 10.13189/ujer.2020.081908
Hincapie, M., Diaz, C., Valencia, A., Contero, M., and Güemes-Castorena, D. (2021). Educational applications of augmented reality: a bibliometric study. Comput. Electr. Eng. 93:107289. doi: 10.1016/j.compeleceng.2021.107289
Huang, J. S. (2014). An interpersonal perspective for research capacity building. J. Res. Adm. 42, 89–112.
Jan van Eck, N., and Waltman, L. (2015). VOSviewer Manual. Available at: http://www.vosviewer.com (accessed May 04, 2024).
Jeong, Y. K., Song, M., and Ding, Y. (2014). Content-based author co-citation analysis. J. Informetr. 8, 197–211. doi: 10.1016/j.joi.2013.12.001
Karakus, M., and Ersozlu, A. (2019). Augmented reality research in education: a bibliometric study. EURASIA J. Mathem. Sci. Technol. Educ. 15:em1755. doi: 10.29333/ejmste/103904
Katz, J. S., and Martin, B. R. (1997). What is research collaboration? Res. Policy 26, 1–18. doi: 10.1016/S0048-7333(96)00917-1
Kaur, G., Kaur, P. A., and Khurana, M. (2022). A review of opinion mining techniques. ECS Trans. 107:10125. doi: 10.1149/10701.10125ecst
Kaushal, C., Refat, M. A. R., Amin, M. A., and Islam, M. K. (2021). “Comparative micro blogging news analysis on the COVID-19 pandemic scenario,” in Proceedings of the International Conference on Data Science andApplications, Kolkata, India, 241–248. doi: 10.1007/978-981-16-5348-3_30
Ke, C., Kang, B., Chen, D., and Li, X. (2005). “An augmented reality-based application for equipment maintenance,” in Affective Computing and Intelligent Interaction: First International Conference, ACII 2005, Beijing, China, October 22-24, 2005. Proceedings 1 (Springer Berlin Heidelberg), 836–841. doi: 10.1007/11573548_107
Kesim, M., and Ozarslan, Y. (2012). Augmented reality in education: current technologies and the potential for education. Procedia Soc. Behav. Sci. 47, 297–302. doi: 10.1016/j.sbspro.2012.06.654
Lewis, Y. (2021). Research collaborations bring big rewards: the world needs more. Nature 594, 301–302. doi: 10.1038/d41586-021-01581-z
Ley, M. (2002). “The DBLP computer science bibliography: Evolution, research issues, perspectives,” in International symposium on string processing and information retrieval (Berlin, Heidelberg: Springer Berlin Heidelberg), 1–10. doi: 10.1007/3-540-45735-6_1
López-Robles, J. R., Cobo, M. J., Gutiérrez-Salcedo, M., Martínez-Sánchez, M. A., Gamboa-Rosales, N. K., and Herrera-Viedma, E. (2021). 30th Anniversary of Applied Intelligence: a combination of bibliometrics and thematic analysis using SciMAT. Appl. Intell. 51, 6547–6568. doi: 10.1007/s10489-021-02584-z
Martín-Gutiérrez, J., Fabiani, P., Benesova, W., Meneses, M. D., and Mora, C. E. (2015). Augmented reality to promote collaborative and autonomous learning in higher education. Comput. Hum. Behav. 51, 752–761. doi: 10.1016/j.chb.2014.11.093
McCarthy, C. J., and Uppot, R. N. (2019). Advances in virtual and augmented reality—exploring the role in health-care education. J. Radiol. Nurs. 38, 104–105. doi: 10.1016/j.jradnu.2019.01.008
Meho, L. I., and Rogers, Y. (2008). Citation counting, citation ranking, and h-index of human-computer interaction researchers: a comparison of scopus and web of science. J. Am. Soc. Inf. Sci. Technol. 59, 1711–1726. doi: 10.1002/asi.20874
Michailidis, P. D. (2022). Visualizing social media research in the age of COVID-19. Information 13:372. doi: 10.3390/info13080372
Min, W., and Yu, Z. (2023). A bibliometric analysis of augmented reality in language learning. Sustainability 15:7235. doi: 10.3390/su15097235
Moral-Muñoz, J. A., Herrera-Viedma, E., Santisteban-Espejo, A., and Cobo, M. J. (2020). Software tools for conducting bibliometric analysis in science: an up-to-date review. Profesional de la Información 29, 1–20. doi: 10.3145/epi.2020.ene.03
Nechypurenko, P. P., Stoliarenko, V. G., Starova, T. V., Selivanova, T. V., Markova, O. M., Modlo, Y. O., et al. (2020). “Development and implementation of educational resources in chemistry with elements of augmented reality,” in CEUR Workshop Proceedings (CEUR-WS.org), 156–167. doi: 10.31812/123456789/3751
Noyons, E. C. M., Moed, H. F., and Van Raan, A. F. J. (1999). Integrating research performance analysis and science mapping. Scientometrics 46, 591–604. doi: 10.1007/BF02459614
Nurbekova, Z., and Baigusheva, B. (2020). On the issue of compliance with didactic principles in learning using augmented reality. Int. J. Emer. Technol. Lear. 15, 121–132. doi: 10.3991/ijet.v15i15.14399
Omurtak, E. (2022). The effect of augmented reality applications in biology lesson on academic achievement and motivation. J. Educ. Sci. Environ. Health 8, 55–74. doi: 10.21891/jeseh.1059283
Osman, S. (2020). The effect of augmented reality application toward student's learning performance in PC assembly. Int. J. Adv. Trends Comput. Sci. Eng. 9, 401–407. doi: 10.30534/ijatcse/2020/5791.42020
Pranckuté, R. (2021). Web of Science (WoS) and Scopus: the titans of bibliographic information in today's academic world. Publications 9:12. doi: 10.3390/publications9010012
Pribeanu, C., Balog, A., and Iordache, D. D. (2017). Measuring the perceived quality of an AR-based learning application: a multidimensional model. Inter. Lear. Environ. 25, 482–495. doi: 10.1080/10494820.2016.1143375
Pucihar, K. C. (2015). Exploring the evolution of mobile augmented reality for future entertainment systems. Comput. Entert. 11, 1–16. doi: 10.1145/2582179.2633427
Saadon, N. F. S. M., Ahmad, I., and Pee, A. N. C. (2020). “The implementation of augmented reality in increasing student motivation: systematic literature review,” in IOP Conference Series: Materials Science and EngineerinG (IOP Publishing), 012043. doi: 10.1088/1757-899X/854/1/012043
Satpute, T. (2018). “Augmented reality in higher education supported with Web 2.0: a case study in chemistry course,” in Techno-Societal 2016: Proceedings of the International Conference on Advanced Technologies for Societal Applications (Springer International Publishing), 1033–1041. doi: 10.1007/978-3-319-53556-2_103
Singh, G., Mantri, A., and Sharma, O. (2021). Virtual reality learning environment for enhancing electronics engineering laboratory experience. Comput. Applic. Eng. Educ. 29, 229–243. doi: 10.1002/cae.22333
Singh, G., Mantri, A., Sharma, O., and Dutta, R. (2019). Evaluating the impact of the augmented reality learning environment on electronics laboratory skills of engineering students. Comput. Applic. Eng. Educ. 27, 1361–1375. doi: 10.1002/cae.22156
Singh, S. (2022). “Amalgamation of 3-dimensions in education field using augmented reality technology,” in 2022 7th International Conference on Communication and Electronics Systems (ICCES) (IEEE), 114–119. doi: 10.1109/ICCES54183.2022.9835871
Su, X., and Li, X. (2019). A bibliometric analysis of research on intangible cultural heritage using CiteSpace. Sage Open 9:2158244019840119. doi: 10.1177/2158244019840119
Surwase, G., Sagar, A., Kademani, B. S., and Bhanumurthy, K. (2011). “Co-citation analysis: an overview,” in Proceedings of the Beyond Librarianship: Creativity, Innovation and Discovery, Mumbai, India, 9.
Talan, T. (2021). Augmented reality in STEM education: bibliometric analysis. Int. J. Technol. Educ. 4, 605–623. doi: 10.46328/ijte.136
Tee, N. Y. K., Gan, H. S., Li, J., Cheong, B. H. P., Tan, H. Y., Liew, O. W., et al. (2018). Developing and demonstrating an augmented reality colorimetric titration tool. J. Chem. Educ. 95, 393–399. doi: 10.1021/acs.jchemed.7b00618
Tripathi, M., Kumar, S., Sonker, S. K., and Babbar, P. (2018). Occurrence of author keywords and keywords plus in social sciences and humanities research: a preliminary study. COLLNET J. Sci. Inf. Manag. 12, 215–232. doi: 10.1080/09737766.2018.1436951
Trista, S., and Rusli, A. (2020). Historiar: Experience indonesian history through interactive game and augmented reality. Bull. Electr. Eng. Inf. 9, 1518–1524. doi: 10.11591/eei.v9i4.1979
Tuli, N., and Mantri, A. (2020). Usability principles for augmented reality-based kindergarten applications. Procedia Comput. Sci. 172, 679–687. doi: 10.1016/j.procs.2020.05.089
van Eck, N. J., and Waltman, L. (2010). Software survey: VOSviewer, a computer program for bibliometric mapping. Scientometric 84, 523–538. doi: 10.1007/s11192-009-0146-3
Vega Garzón, J. C., Magrini, M. L., and Galembeck, E. (2017). Using augmented reality to teach and learn biochemistry. Biochem. Molec. Biol. Educ. 45, 417–420. doi: 10.1002/bmb.21063
Venkatesan, M., Mohan, H., Ryan, J. R., Schürch, C. M., et al. (2021). Virtual and augmented reality for biomedical applications. Cell Rep. Med. 2, 1–13. doi: 10.1016/j.xcrm.2021.100348
Wu, H. K., Lee, S. W. Y., Chang, H. Y., and Liang, J. C. (2013). Current status, opportunities and challenges of augmented reality in education. Comput. Educ. 62, 41–49. doi: 10.1016/j.compedu.2012.10.024
Yuen, S. C. Y., and Yaoyuneyong, G. (2011). Augmented reality: an overview and five directions for AR in education. J. Educ. Technol. Dev. Exchange 4:11. doi: 10.18785/jetde.0401.10
Zardari, S., Alam, S., Al Salem, H. A., Al Reshan, M. S., Shaikh, A., Malik, A. F. K., et al. (2022). A comprehensive bibliometric assessment on software testing (2016–2021). Electronics 11:1984. doi: 10.3390/electronics11131984
Zhang, J., Yu, Q., Zheng, F., Long, C., Lu, Z., Duan, Z., et al. (2016). Comparing keywords plus of WOS and author keywords: a case study of patient adherence research. J. Assoc. Inf. Sci. Technol. 67, 967–972. doi: 10.1002/asi.23437
Zhang, P., Li, J., Chang, J., and Li, S. (2020). “A comparative study of the influence of interactive AR-based experiential teaching on cognitive ability in a chemical electrolytic cell course,” in 2020 International Symposium on Educational Technology (ISET) (IEEE), 88–92. doi: 10.1109/ISET49818.2020.00028
Keywords: augmented reality, bibliometric, scientific mapping, bibliographic coupling, VOSviewer, educational technology
Citation: Singh S, Kaur A and Gulzar Y (2024) The impact of augmented reality on education: a bibliometric exploration. Front. Educ. 9:1458695. doi: 10.3389/feduc.2024.1458695
Received: 02 July 2024; Accepted: 16 September 2024;
Published: 03 October 2024.
Edited by:
Emilio Jesús Lizarte, University of Granada, SpainReviewed by:
Fca. Angélica Monroy, Universidad de Extremadura, SpainPrudencia Gutiérrez-Esteban, University of Extremadura, Spain
Copyright © 2024 Singh, Kaur and Gulzar. This is an open-access article distributed under the terms of the Creative Commons Attribution License (CC BY). The use, distribution or reproduction in other forums is permitted, provided the original author(s) and the copyright owner(s) are credited and that the original publication in this journal is cited, in accordance with accepted academic practice. No use, distribution or reproduction is permitted which does not comply with these terms.
*Correspondence: Yonis Gulzar, eWd1bHphckBrZnUuZWR1LnNh; Amanpreet Kaur, YW1hbnByZWV0LmthdXJAY2hpdGthcmEuZWR1Lmlu