 Pauline Roberts
 Lennie Barblett
- Early Childhood Studies, School of Education, Edith Cowan University, Perth, WA, Australia
Standardized testing of academic knowledge is common in many developed countries. In Australia, the process implemented is the National Assessment Program for Literacy and Numeracy (NAPLAN). The stand-alone tests were introduced in 2008 for several educational and political reasons, and since that time, the results of this assessment have been used beyond their initial purpose and brought about an unintended consequence of making the tests high-stakes. The pressure of these assessments has the potential to impact student’s wellbeing, but little research has been done in this area and even less where the student’s perspectives are considered. This research examined the impact of NAPLAN testing on the wellbeing of 1,015 students in Years 3 and 5 across 23 school sites within metropolitan Perth in Western Australia through three iterations. This research gave students the opportunity to draw or write how they felt about NAPLAN as a participatory approach to hearing children’s voices in research. This paper reports on the two-stage analysis of the 917 drawn images provided. Stage 1 analysis by two researchers categorized the images as initially positive, negative, or mixed/neutral and identified the impact across the cohorts of students was not significantly negative with an average of 22.5% of the images coded as negative. Stage 2 involved detailed systematic content analysis examining the actors, locations, and emotions of the drawings, which indicated high levels of stress and anxiety for a small number of these students. It was evident that the tests can have a negative impact on the wellbeing of some students and this finding requires consideration by policymakers and curriculum teams engaged with writing, implementing, and assessing NAPLAN as well as those using the results for both intended and unintended purposes.
Introduction
There are several standardized tests used within developed countries to examine a range of academic content and skills. Some are developed by individual countries while others are used for international benchmarking such as the Program for International Student Assessment (PISA) (OECD, n.d.). In Australia, the National Assessment Program for Literacy and Numeracy (NAPLAN) was introduced in 2008 in response to several educative and political concerns including falling results against international benchmarks and increased Federal involvement in previously State-/Territory-run education systems in relation to a National Curriculum, National teaching standards, and increased accountability measures including a national assessment strategy. NAPLAN is a stand-alone set of assessments that was developed to assess students in Years 3 (7- to 8-year-olds), 5 (9- to 10-year-olds), 7 (11- to 12-year-olds), and 9 (13- to 14-year-olds) in May1 of each year across four tests that encompass a range of literacy and numeracy skills. More specifically, the tests examine reading and comprehension skills, writing ability in response to a prompt, understanding of language conventions, and broad numeracy knowledge. According to the Australian Curriculum, Assessment, and Reporting Authority (ACARA) who developed the tests, the results are used to “determine whether or not young Australians have the literacy and numeracy skills that provide the critical foundation for other learning” (ACARA, 2016a) and for schools, states, and territories to identify programs and areas that need to be prioritized for improvement. Since the introduction of NAPLAN, many alternate uses of the data have been identified including the performance management of principals and teachers (Department of Education, 2018), the ranking of schools on a publicly available website (MySchool), and allowing students entry into secondary school programs [School Curriculum and Standards Authority (SCSA), 2014]. These additional purposes have made NAPLAN testing high stakes (Thompson, 2015), which has led to research into the impacts of the testing.
Previous research into the effects of NAPLAN has included the examination of the impact on the curriculum, which is said to have narrowed in focus and led to procedures of ‘teaching to the test’ (Hardy, 2015; Thompson and Harbaugh, 2013); the effectiveness of the tests in relation to the use of the data generated for planning decisions (Ward, 2012); the effect of the tests on teachers who work in the NAPLAN year levels (Rogers et al., 2016); and the impacts the tests may have on principals, teachers, parents, and students (Dulfer et al., 2012).
Since the collection of these research data, the 2020 global COVID-19 pandemic impacted schooling, which resulted in NAPLAN not being implemented within Australian schools in that year. As Australia embarked on NAPLAN in 2021, the Federal branch of the Australian Education Union (AEU) has called for “NAPLAN to go” (Australian Education Union-Federal Office, 2021). Citing 2020 survey results of 12,000 public school staff, the AEU has identified that teachers do not feel NAPLAN is effective for school comparison (75%) or for measuring school performance (74%). This study also identified that 94% of teachers and 87% of principals believe that NAPLAN contributes to student stress and anxiety.
Of these concerns, the impact on young students has received the least amount of attention and when it has been the focus of research, it has been from the adult perspective on the impact with little research asking the students how they feel (Rogers et al., 2016). This, therefore, was the key intention of this research. The investigation discussed in this paper aimed to explore the perceptions of young students of the impact of NAPLAN on their wellbeing and to facilitate this through an open-ended mode of drawing.
The use of drawing analysis in education is on the rise as drawing allows children to express their emotions in an open-ended format that does not rely on them being able to put these feelings into words to explain to others (Hamama and Ronen, 2009). There are several ways to interpret drawn images including the size, shape, proximity, and omissions in drawings (Gross and Hayne, 1998), the tools and materials used to draw (Farokhi and Hashemi, 2011), or the metaphorical nature of the content portrayed (Howell, 2012). For this research, a two-stage process was implemented in which images2 were initially coded based on an overall initial impression, and then, a protocol was developed, trialed, and implemented to examine the drawings3 for the actors—the people depicted in the image, the location/setting, the context, and actions/behaviors displayed. This additional detail amplified students’ voices to describe more nuanced intent in the drawn images.
The voices of the students were particularly important in this research as the focus was on the impact of the tests on their personal wellbeing. It has been identified that anxiety around tests can impact student self-esteem (Aybüke Sari et al., 2018) and wellbeing (Rodriguez et al., 2020). For this reason, it was imperative to explore the impact of external pressures such as standardized tests on student’s wellbeing from their perspective.
Literature review
To provide context for this research, the literature review will provide a brief overview of NAPLAN in Australia, including the adjustments that have led to this point. It will then explore the construct of wellbeing for students, with particular attention to the impact of academic assessment processes on that.
NAPLAN testing
NAPLAN was introduced by ACARA in 2008 to test the literacy and numeracy skills of Australian students in Years 3, 5, 7, and 9. According to ACARA (2016a, par 4), the “two benefits of the [National Assessment Program] NAP are to help drive improvements in student outcomes and provide increased accountability for the community.” The mention of community accountability is reflected in the decision in 2010 to begin to publish the results of NAPLAN each year on the MySchool website. The instigation of a national assessment strategy was part of a larger political agenda that also included the development of a national curriculum, teaching standards, partnership agreements, and reward funding (Lingard, 2010). The political agenda as well as the focus on performance targets has led to additional and unintended consequences of NAPLAN that have resulted in the tests becoming high stakes. High-stakes assessments refer to standardized assessments that are used to determine progression through education systems or those that allow or exclude entry to specific programs (Salaky, 2018). These assessments have been found to be the unintended consequence of the political implementation of failed testing programs across other countries that Australia has chosen to follow (Klenowski, 2011; Klenowski and Wyatt-Smith, 2012).
Since the federal election result of 2007, there has been an increased presence of federal government involvement in education policy (Lingard, 2010; Lingard and Sellar, 2013). The focus on accountability, transparency, and public confidence (Klenowski and Wyatt-Smith, 2012) led to the development of ACARA that oversaw the national curriculum (Lingard, 2010), national performance standards for teachers and students, and calls for transparent results against national benchmarks (Blaise, 2018). The implementation of national partnership agreements where performance targets were set and reward payments were offered (Hardy, 2015) also led to multiple states implementing strategies for what has been termed ‘gaming the system’ (Lingard and Sellar, 2013). The social constructs of the testing made the process more about the test than the learning (Hardy, 2015) with limited alignment across the curriculum, school-based assessments, and standardized tests (Klenowski, 2011). This had an impact on the relationships between and within schools (Mayes and Howell, 2018) as well as with teachers whose performance appraisal processes began to be aligned with student test scores (Smith and Holloway, 2020). These impacts were exacerbated once results were published on the MySchool website (Klenowski, 2011) and rewarded through funding as defined by the Council of Australian Governments (COAG) (Comber, 2012). Research has additionally been conducted on the public perception of NAPLAN as an important factor in sustaining government policies (Lee et al., 2022), which further highlights the political nature of the testing process. NAPLAN, however, is not an equal measure for everyone.
Studies have found that several factors such as gender, Indigenous status, language background, geolocation, school sector, and family-related factors can be predictors of student results in numeracy (Getenet and Berswick, 2021). In addition, in Queensland, Cumming et al. (2019) found a definite gap between Aboriginal and non-Aboriginal student achievement that widens over time, especially for students in remote or very remote areas. The aggregation of achievement data and the lack of detailed analysis for these students suggest that the impact of testing may be greater but also provides additional evidence of the political agenda, leading to NAPLAN becoming high stakes and therefore having a range of unintended consequences for education across the country.
One of the unintended consequences has been the narrowing of the curriculum (Thompson and Harbaugh, 2013). Having the NAPLAN results publicly available to the community through the MySchool website has led to pressure being felt by school principals and teachers to ensure schools perform well on the tests, and therefore, a culture of competition has developed (Thompson, 2013). This has led to an increased focus on literacy and numeracy within school classrooms and more specifically a focus on teaching specific text types such as narrative for the writing tasks (Polesel et al., 2014). The pressure of the tests has also resulted in schools teaching the test so that the results reflect well on all stakeholders.
The testing process itself has led to schools teaching test-related skills such as completing multiple-choice tests and working within time limits for writing tasks (Polesel et al., 2014). The addition of the online testing process trialed since 2017 has required students to develop typing skills and keyboard literacy in addition to the skills needed to process and answer the questions on a screen, instead of paper (Mulheron, 2017). Many of these skills are especially difficult for students with different cultural backgrounds or younger students as they are still learning to recognize letters and write fluent sentences.
Additionally, research has identified the pressure to perform in tests has pushed down the curriculum and ‘schoolified’ the early years to ensure students start preparing for the tests even earlier (Roberts et al., 2019). The curriculum expectations in numeracy and literacy are currently expected to be mastered earlier and to a higher level at the expense of other curriculum and areas and foundational skills (Roberts et al., 2019; Jay and Knaus, 2018). This pushdown of curriculum and other high-stakes consequences of standardized testing has been shown to negatively influence student’s wellbeing, learning, and development (Harmon and Viruru, 2018).
Testing impact on student’s wellbeing
Wellbeing has become an important construct within the education system over recent years with schools being seen as needing to take a key role in supporting and promoting student’s wellbeing (Powell and Graham, 2017). In this context, wellbeing is understood to encompass “the health of the whole person – physical, mental, social and emotional… and can be influenced by what’s happening in a specific moment and the actions that people take” (Beyond Blue, 2024, par. 1). The attention on wellbeing has shifted from focusing on individual children with social and emotional problems to universal programs for social and emotional development from a strengths-based perspective (Powell and Graham, 2017). This focus is represented within the most recent Australian Education Declaration from Alice springs—Mparntwe (Education Council, 2019) that references wellbeing eight times, in relation to education contributing to and promoting wellbeing. Goal 2 of the declaration aims to develop “confident and creative individuals” who “manage their emotional, mental, cultural, spiritual and physical wellbeing” (Education Council, 2019, p. 6) through partnerships with parents and families.
For the middle years of school (when NAPLAN occurs for Years 7 and 9), the Declaration highlights the commitment to action to assist students to find “a sense of self and require[s] investment in their emotional wellbeing” as well as develop “healthy peer relationships… including a focus on student engagement and wellbeing” (Education Council, 2019, p. 13), yet studies have only just started to be completed on the possible impact of high-stakes testing on student’s wellbeing.
It has been identified that “[i]t is common for adolescents to feel anxious about standardised testing due to the demand and expectation placed upon students from schools, educators and parents to perform well” (Abdul Latif, 2021, p. 198). Some studies have begun to explore test anxiety around subject areas such as mathematics (Carey et al., 2017) or to examine possible links between self-esteem and test anxiety in secondary school students (Aybüke Sari et al., 2018). Others have looked at wellbeing in relation to stress scales for primary school students as they prepare to sit standardized tests (Jerrim, 2021) and while these showed small levels of impact, many of these tests were not considered high stakes and the questions were not directly related to taking the tests. In relation to NAPLAN, the study by Howell (2017) identified that children were confused about the purpose and significance of NAPLAN and showed concern about letting families down, failing tests, or the possible impact on school progression, including concerns from some students in Year 3 about the results impacting on their future. While this study concluded that students perceived NAPLAN as low stakes, it did raise questions about the potential impact on wellbeing but also led to a focus on drawing as a methodology for giving children an age-appropriate method of describing and recounting their feelings about NAPLAN.
Methodology
The larger project of which this paper is drawn (Rogers et al., 2016) is a mixed-method study using a phenomenological lens. As van Manen (1990) suggests using this lens assists in learning about the lived experiences of others and provides insight into the nature of the experience from the participant’s point of view. Within this lens, the researchers needed to position themselves (Creswell, 2013), and in this case, ‘bracketing’ was used to suspend personal judgments to enable analysis based on what the participants would (see Daly, 2007). While not typically applied to survey-based data, the use of student’s drawings in this project from a content analysis framework allowed the students to share their subjective lived experience of NAPLAN without being restricted to language that may pose barriers to participation. Alongside this, the researchers acknowledge children as social actors who have the capacity to influence matters that affect them and the role they have in offering opinions (United Nations, 1989). Valuable insights into children’s worlds and experiences are found when children’s agency to participate in research is acknowledged and facilitated (Shier, 2019). When NAPLAN is viewed as part of an enacted curriculum influenced by adjacent policies and aligned with the ‘lived experience’ of teaching and learning (Luke, 2010), the lived experiences of the students as shown through drawing become a sound theoretical focus.
The method used to describe students’ perspectives of NAPLAN was a paper-based survey the students completed in a classroom with a writing/drawing instrument they brought with them. To describe student’s perspectives not only were set questions used, but an open-ended way to express themselves was included at the end of the survey. Students were asked to “draw or write what they felt about NAPLAN,” and while the findings of the survey set questions have been reported elsewhere (Rogers et al., 2016), the images, how they were collected and analyzed, and the findings discovered will be described here.
The use of images has theoretical foundations linking back to Freud and Vygotsky where the drawing has been recognized as a form of communication and a source of data (Farokhi and Hashemi, 2011; Pahl, 1999; Papandreou, 2014). Drawing provides children with a voice if they cannot find the right words to articulate their feelings (Hadley et al., 2021; Hamama and Ronen, 2009). Studies such as those by Kress (1997), Pahl (1999), and Wright (2003) have considered drawing as a mode of communication and usually used a narrative style to analyze their meaning. Children’s familiarity (and experience) with drawing as a form of communication and representation allows their participation in meaningful ways (Clark, 2011; Hadley et al., 2021; Halpenny, 2021). Additionally, it provides opportunities for these important perspectives to be heard in research, particularly on areas that impact on their lives (Clark and Flewitt, 2020). Innovative ways are required to capture children’s voices and meaningful drawings can facilitate the expression of their views (Berblett et al., 2022; Mayne et al., 2018) shifting from a traditional focus on words for communication (Tay-Lim and Lim, 2013).
Drawing as a methodology has been used for some time in health services such as counseling and family therapy, and it is gaining traction in education as the importance of student participation in research is being identified (Howell, 2012). This is especially important for children from diverse cultural and social groups who may be more able to participate in drawing than writing or speaking, to facilitate an element of social justice that should underlie all educative practices. The use of drawing empowers children and gives them agency to present their own views, rather than relying on the interpretation of others (Bland, 2012, 2018; Farokhi and Hashemi, 2011; Mayaba and Wood, 2015; Swain et al., 2018). Drawing is a complex process where children’s thoughts, bodies, and emotions are constantly interconnected (Wright, 2003).
The use and analysis of drawing data allow children to represent their feelings and ideas in the actual image but also through other elements of the drawing. Content of drawings being classified into different subjects (Spence, 1928; Kellogs, 1959, and Coates, 2002 all cited in Deguara, 2019) or through examination of the mechanics of the drawing including the choice of colors, the force applied when completing the drawing, the positions of the parts of the image on the page (Farokhi and Hashemi, 2011; Gross and Hayne, 1998; Howell, 2012).
Drawing allows children to express their emotions in an open-ended format that does not rely on them being able to put these feelings into words to explain to others (Hamama and Ronen, 2009). There are several ways to interpret drawn images including the size, shape, proximity, and omissions in drawings (Gross and Hayne, 1998) the tools and materials used to draw (Farokhi and Hashemi, 2011) or the metaphorical nature of the content portrayed (Howell, 2012) The methodology will describe the sample, development of the survey, analysis, and ethical considerations considered when researching with children.
Sample
Twenty-three independent schools across the three iterations of the project accepted the invitation to participate in the study. The schools in this sample had above-average Index of Community Socio-Educational Advantage (ICSEA) scores. In Australia, an ICSEA is applied to schools to provide an indication of the socio-educational backgrounds of students including factors such as parental occupation and education levels, geographic location, and population of Indigenous students. The score is used to “allow fair and reasonable comparison among schools with similar students” (ACARA, 2016b, par. 1). The average ICSEA is 1,000 and is set to be used as a benchmark when compared to above or below the average (ACARA, 2016b). Each site additionally reported that they were implementing programs directly related to emotional wellbeing as a school priority, and so the focus on wellbeing was important to them in relation to the NAPLAN process.
The survey was developed to gain the perspective of teachers, parents, and students on the impact on wellbeing of the NAPLAN testing process. After receiving ethics approval, a full piloting process was completed in the development of the instrument. The complete survey included six introductory questions to gain demographic information on the participants that allowed comparison of their responses to their test results and then eight Likert-scale questions with emotion emojis as responses and the drawing prompt. The Likert questions asked for student’s emotional responses during the completion of the Reading and Mathematics related tests, their feelings before and after the tests, and their response to prompts about their reaction to results, other people’s responses to their results, the use of the results for future purposes, and their emotional response since the testing has ended.
The implementation took place within 3 weeks of the NAPLAN tests being completed by the students within the classroom setting on their school site. For the Year 3 students, the teacher was present in the room. The survey was implemented by a member of the research team with the students whose parents had given permission and who agreed to be involved using a survey protocol. The attending researcher read through each of the questions, in turn, to the whole group to ensure all students understood the questions and what was required in terms of the response type in each section. The researcher answered all of the students’ questions or queries. Each implementation took approximately 30 mins to complete, and the students could withdraw from this process at any time.
The school principal invited families to consent to their children participating prior to the data collection being undertaken, and students were asked for their assent to participate on the day. Across the 3 years of data collection, a total of 1,015 completed surveys were collected. Nine of these 23 sites participated twice in the research—iteration 1 and iteration 3. Of the completed surveys, 917 (90%) included images that were analyzed within stage 1 of drawing analysis. Table 1 provides a breakdown of the data collected from each cohort in each iteration with the percentage representing the inclusion of images from the whole sample of surveys collected.
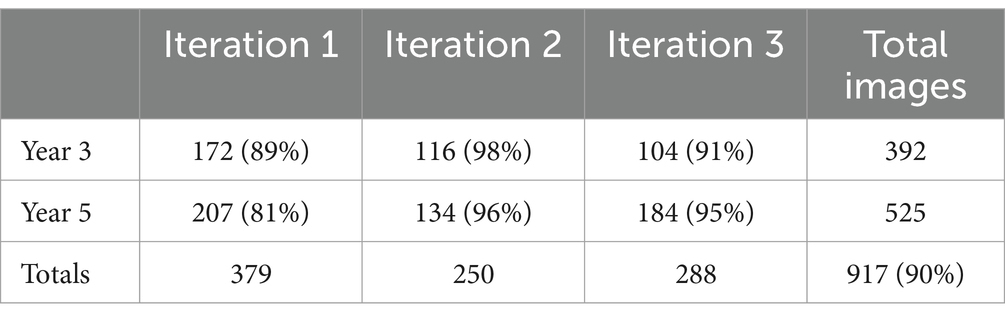
Table 1. Details of sample across the three iterations.
The section of the survey being reported in this paper was the final question on the last page. The direction in this section of the survey was the broad prompt: “In the box below please write or draw anything you think about NAPLAN,” and there was a box that filled the last half of an A4 page. The broad prompt was included to keep the option as open as possible so that the students could express whatever they wanted without any suggested ideas. The students were not given additional tools or materials to complete this element of the survey, so the drawings were completed with whatever writing implement had been used for the rest of the survey. The researchers administering the survey reinforced to the students that they did not have to complete this question but if they did, it was not the quality of the drawing being examined; rather, it was the content of the image that was of interest.
Analysis
For this project, the images were initially independently reviewed by two members of the research team—the first author and a research assistant (Stage 1) and coded as positive, negative, or neutral from the overall first impression of the whole picture provided by the students (Farokhi and Hashemi, 2011). Following this, a protocol was developed, trialed, and implemented (Stage 2) to examine the image for the actors, the location/setting, the context, and the actions/behaviors displayed. This additional detail amplified students’ voices to describe more nuanced intent in the drawn images. These stages are described in more detail below.
Stage 1
The paper-based surveys were collected, and two members of the research team independently reviewed each batch of surveys. In this initial stage, the focus of the descriptive analysis was the initial impression of the complete image (Maxwell, 2015). The independent members of the research team briefly examined each image—drawing and text, for the overall general sense of the image to categorize it as positive, negative, or neutral/unsure. Positive images included smiling faces, hearts, stars, and affirming words, while negative images included sad faces, anger, worry, and nerves. Those coded as neutral generally did not demonstrate a particular positive or negative viewpoint, while unsure often had a mix of negative emotions such as worry, or nerves teamed with positive responses once the tests were finished. These were coded together as they did not demonstrate either definitively positive or negative impacts. This initial coding was designed to avoid the temptation to interpret the images in too much depth (Maxwell, 2015) and provide a snapshot of the student’s perspectives of NAPLAN from their open-ended responses. This analysis allowed for an overall emotional impression of the image to be determined, and there was no comparison of the image to any other survey responses within this analysis.
After each researcher coded the images, the tallies were combined in an Excel spreadsheet and an average was taken for each category (positive, negative, unsure) for each school setting and each year group (Year 3 or 5). While statistical analysis is not usually a part of phenomenology, the sample size in this research and the focus on levels of distress among cohorts meant that it was important to calculate the numerical data based on this initial coding. In interpreting the numerical data, it was decided to combine these data across the school sites in each iteration because the individual school-level responses were not required in developing a broad picture of student wellbeing.
Stage 2
The second stage of the analysis was systematic and based on the development of a protocol to inform the review process. Using the premise of content analysis (Cohen and Manion, 1994), the analysis of the visual data explored traditional approaches but with “an important contribution to make to the analysis of drawing” (Merriman and Guerin, 2006, p. 50). Using strategies as outlined by Maxwell (2015), the research team—in this case the two authors—explored focal points within the drawings to develop a protocol to utilize in the descriptive analysis. The development of the protocol was informed by the research activity—for example, that colors and materials were not relevant due to the collection method; and the focus of the research being wellbeing around a school-based process. The focus of this systematic review was the content of the drawing itself, not the interpretation of the methodology of the image, to identify recurring themes (Merriman and Guerin, 2006).
Based on the study by Maxwell (2015), a protocol was developed to allow each drawing to be examined for the following aspects: (1) the actors (who were present), (2) the location, (3) the setting (a learning or social setting), and (4) what behaviors or actions were shown. This final criterion examined items like facial expressions as a critical factor in portraying emotion (Triplett and Barksdale, 2005). For this stage of the analysis any responses that were only text based were removed from the sample as they did not relate to the categorizations of the drawn focal points. The protocol was designed and independently piloted by two members of the research team on drawings from one school, in one iteration but across 2-year levels. The researchers then met and compared the results with an initial 70% match across the samples reviewed. Any discrepancies were then discussed with a review of the image until a consensus was reached about where to position the aspect of the image in question on the tabulated protocol. The trialing process also resulted in minor changes being made to the protocol before it was applied by these same two researchers across the analysis of the full data set.
Results
The results of this research will be reported in two separate sections. The first provides the broad numerical data based on the allocation of the images by the research team to categories of positive, negative, and neutral—Stage 1. The second section of the results provides a discussion of the Stage 2 analysis and includes specific examples of images from students for each category. The numerical data have been combined across the school cohorts for each year level to provide a broad picture of the students’ indicated perception of NAPLAN. The reason the broad approach was taken was that the statistics here were not the focus of the paper. The goal of the paper was not to provide statistically relevant numerical data nor to argue that the levels of negative images were in the majority. The graphs provide an overview only.
Stage 1
Figures 1A,B provide the percentages of drawn responses that were analyzed as positive (blue—1), negative (orange—2), or unsure/neutral (gray—3) across the three iterations of the data collection. Percentages and pie charts were chosen as this sectional representation allows clear comparison despite the numbers of responses differing within each iteration and year group.
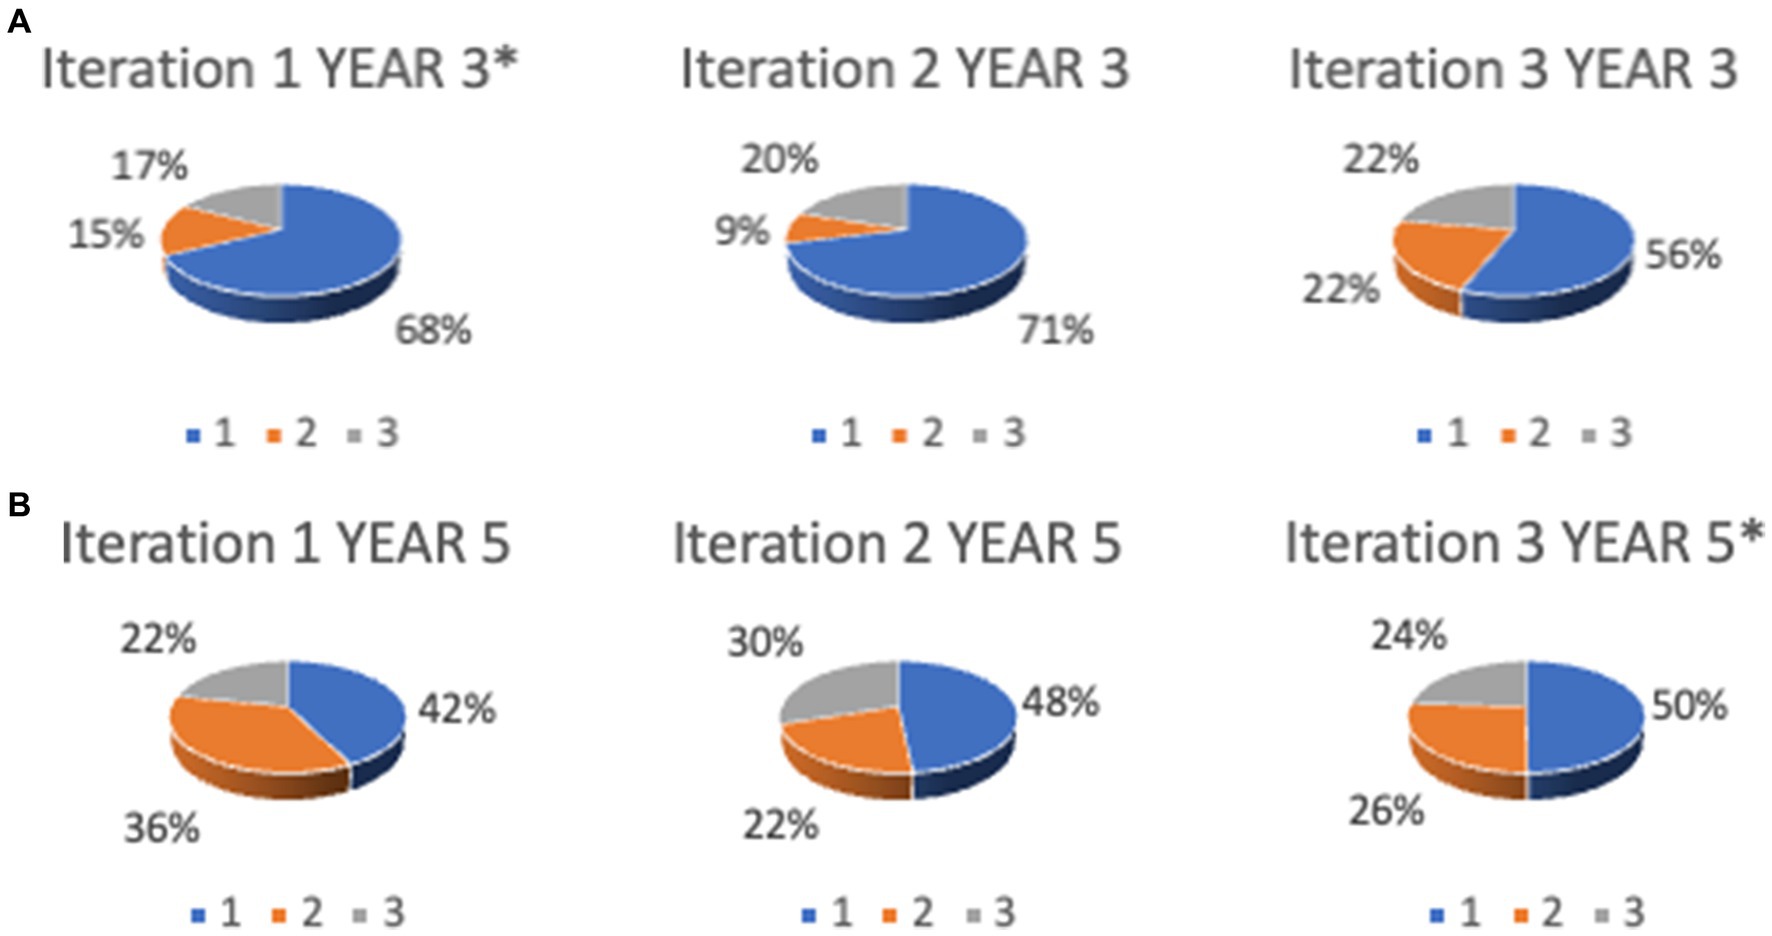
Figure 1. (A) Results from iterations across 3 years for Year 3 students. (B) Results from iterations across 3 years for Year 5 students. *Some of the students in iteration 1 Year 3 group are also members of the iteration 3 Year 5 group although this correlation was not specifically mapped here.
The Year 3 students (Figure 1A) demonstrated more positive attitudes to the NAPLAN tests with over 50% of images coded positively for each iteration. There was a decrease in this across the progress of the data collection, however, from a high of 68% in iteration 1 to a low of 56% in iteration 3. The second iteration had the lowest percentage of negative responses (9%), but there was an increase in those who were unsure (17, 20, and 22%) and from the first to the third iteration of those who had negative responses (15–22%).
For the students in Year 5 (Figure 1B), the overall perception of NAPLAN was more negative than for the Year 3 cohorts. While the positive images recorded increased across the 3 years of the study from 42 to 48 to 50%, they were still lower than for the Year 3 groups (68, 71, and 56%). The percentage of negative responses was also higher for these groups with an average of 28% across the three iterations. This indicates that more than a quarter of the Year 5 students viewed NAPLAN from a negatively coded viewpoint.
Positive images (Figures 2A,B) show thumbs up and smiling faces and use terms such as great, awesome, and fun. These images were large within the box provided and drawn with clear lines and confidence.
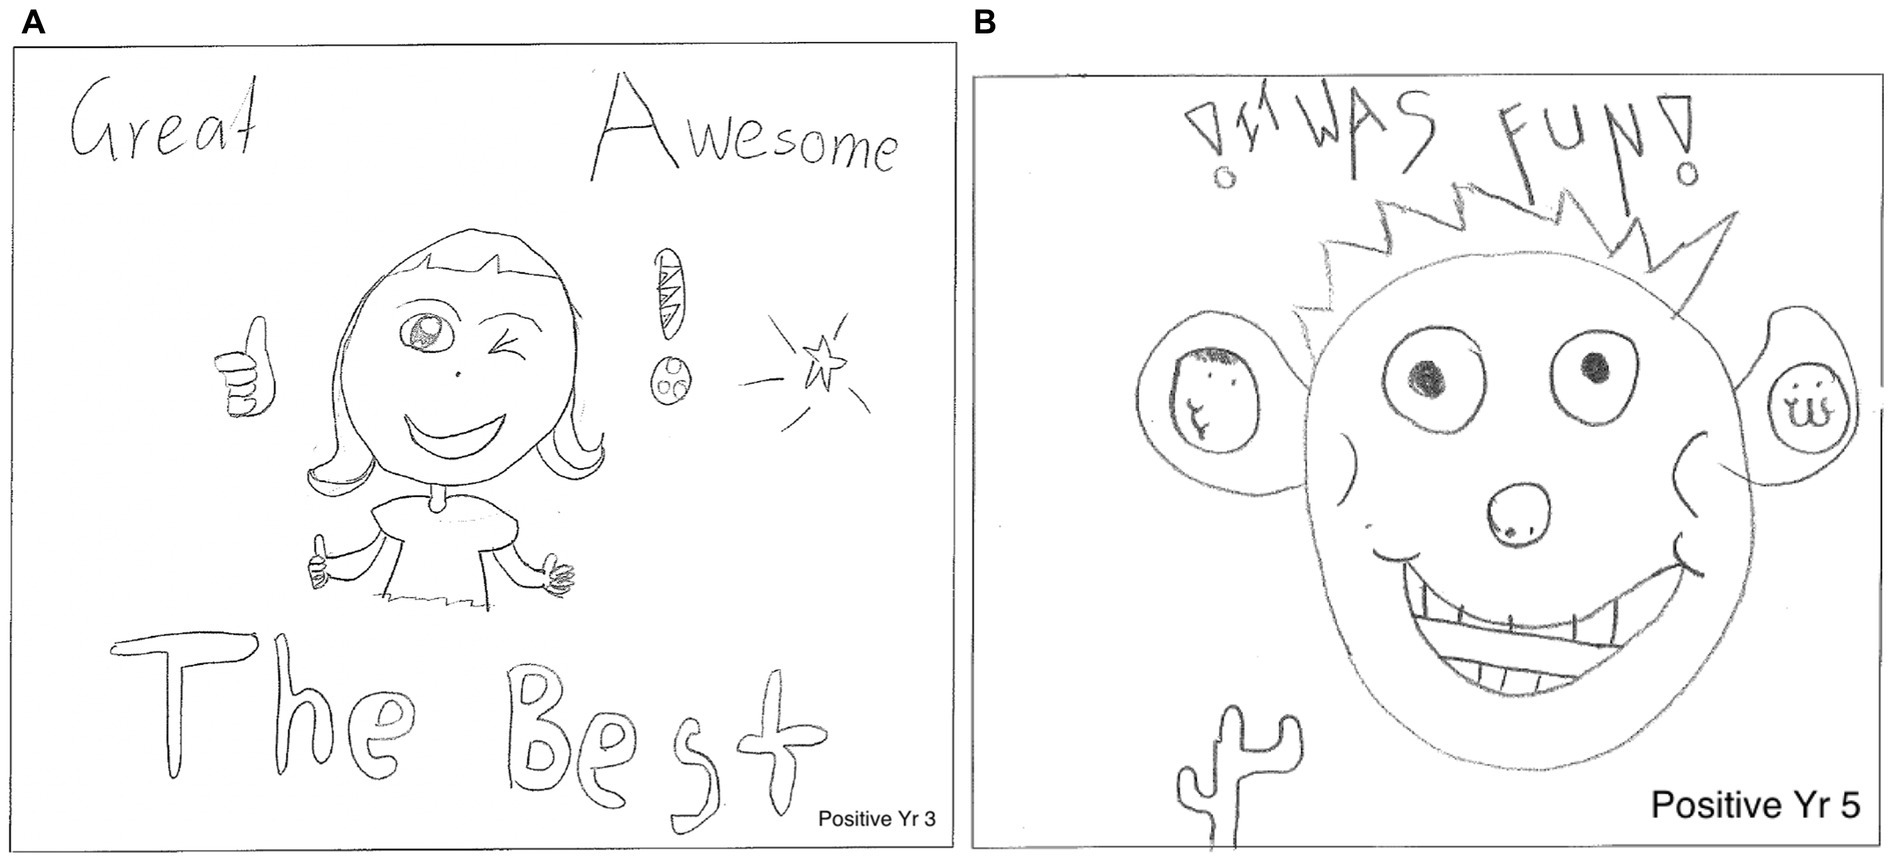
Figure 2. (A) Positive example Year 3. (B) Positive example Year 5.
Figures 3A,B represent neutral images that show concern through sweating brows and words such as hard but also easy or straight mouths and throwing the test in the bin while still claiming to like math. The use of different adjectives—both positive and negative to describe the tests—was common in the neutral images and often comparisons to the type of test, the views of others, and the feelings of relief once tests were complete were common here.
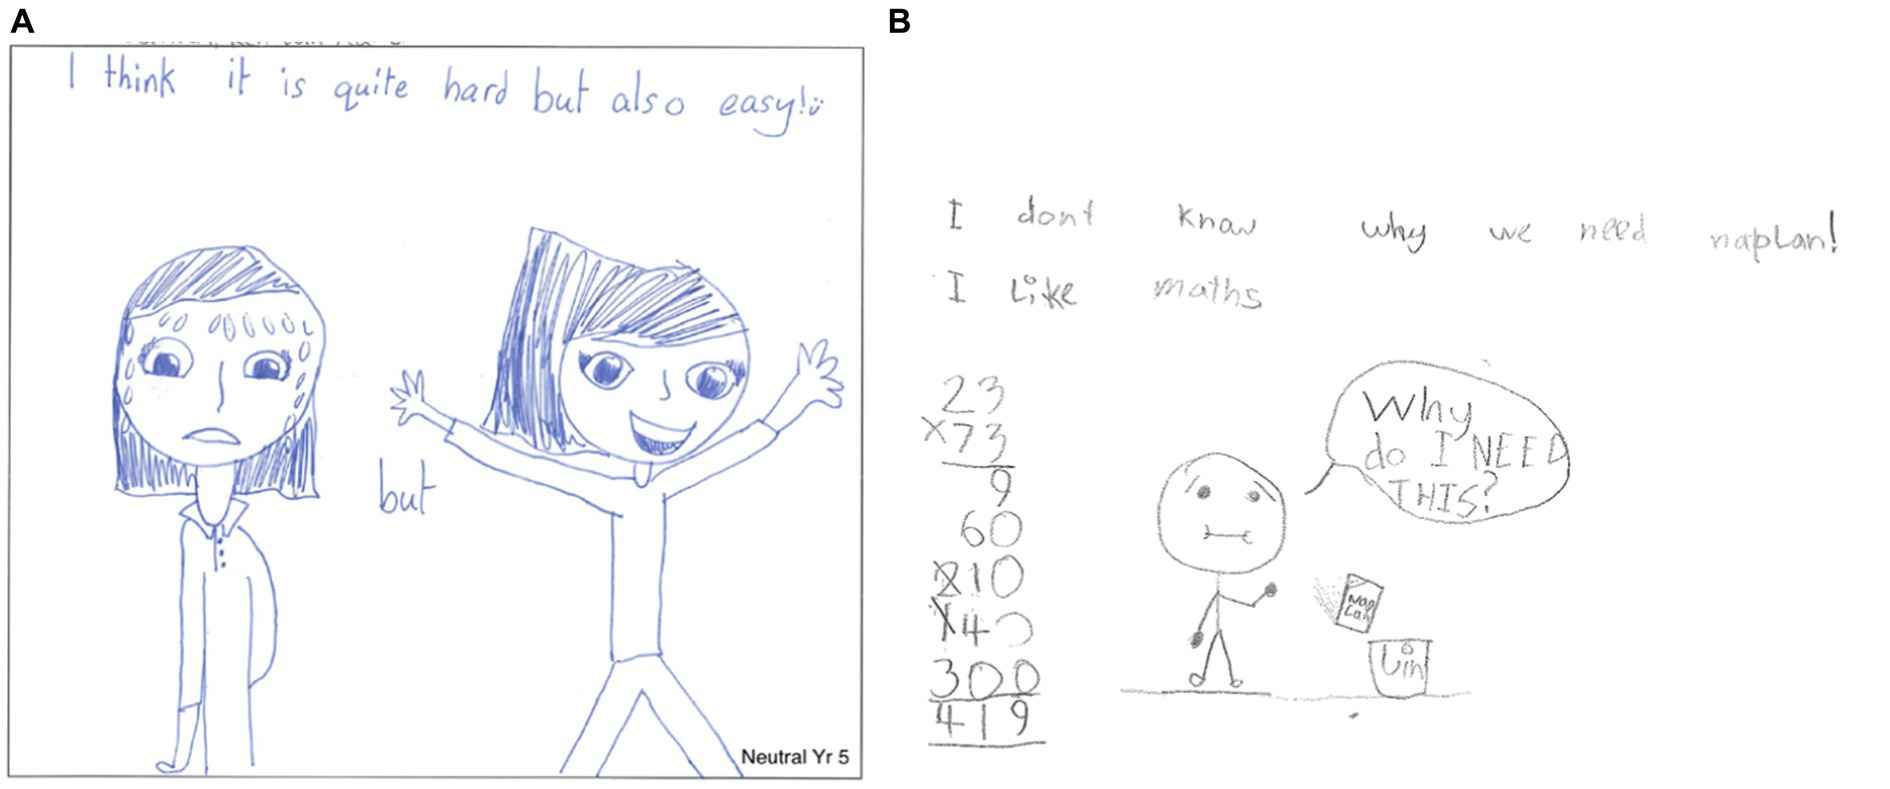
Figure 3. (A) Neutral example Year 5. (B) Neutral example Year 5.
The negatively coded images such as the examples in Figures 4A–C show sadness through tears, include words such as stress, anger, and worry, or illustrate failing grades and phrases relating to hating NAPLAN and it being a waste of time and boring.

Figure 4. (A) Sadness Year 3. (B) Stress Year 5. (C) Negative/concern Year 5.
Stage 2
The more detailed analysis of the student’s drawn responses using the designed protocol examined a total of 574 drawings. This is less than those in the overall impression sample as any that only had words were removed. When examining the images for the actors (who was portrayed), many students drew themselves alone (Figure 5A). Of the 574 drawings, there were 110 (19%) that did not include people at all (Figures 5B,C); only 37 (6%) that included peers (Figure 6A) and 14 (2%) that included a teacher (Figure 6B). Those with no people included drawings of notebooks, textbooks, test papers, and other testing tools. This suggests that many students view NAPLAN as an individual task where the study must be done by them at the time of the test.
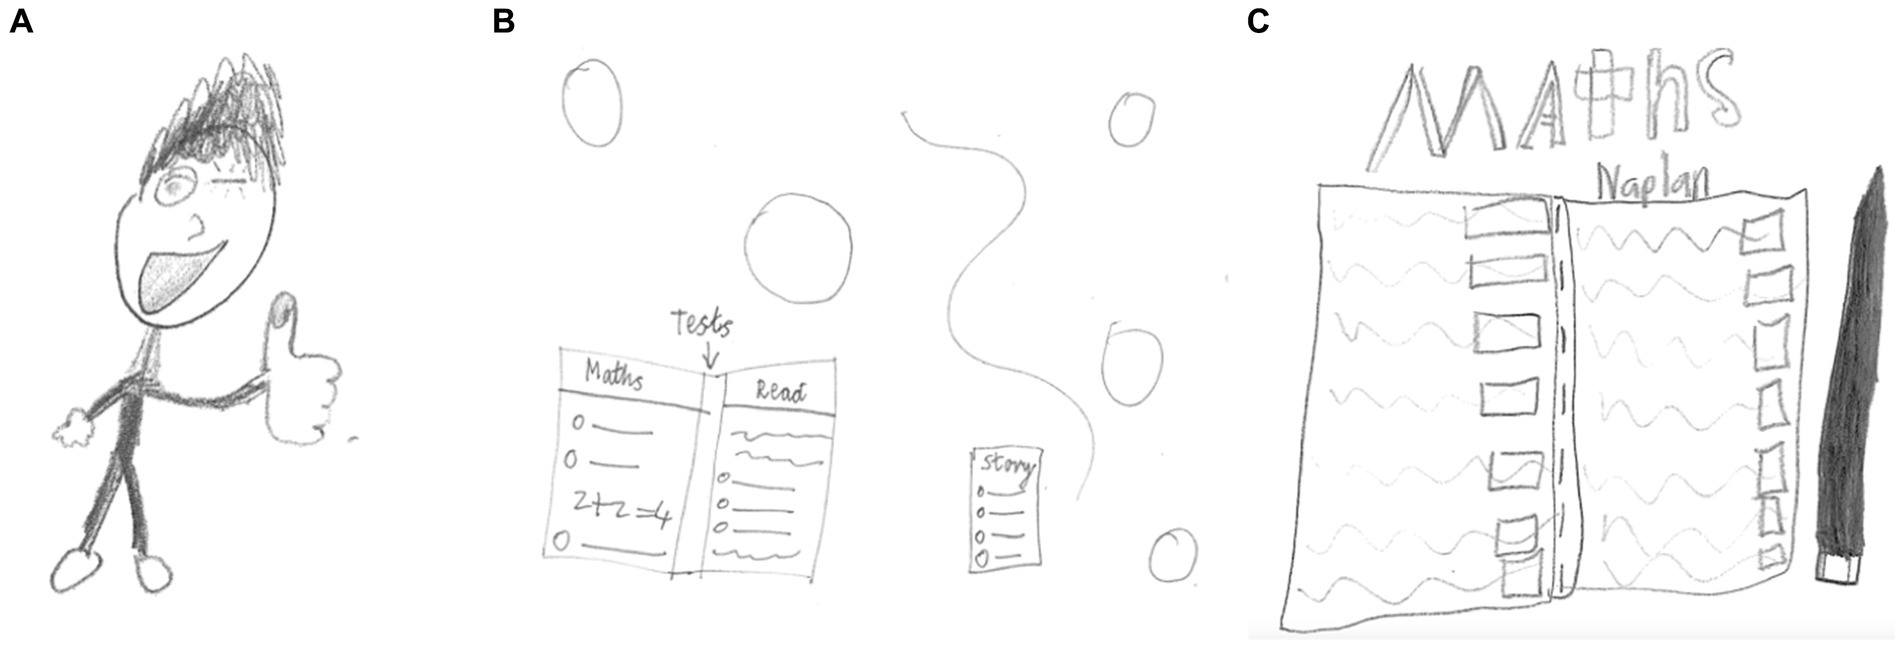
Figure 5. (A) Alone. (B) No people. (C) Taking test.
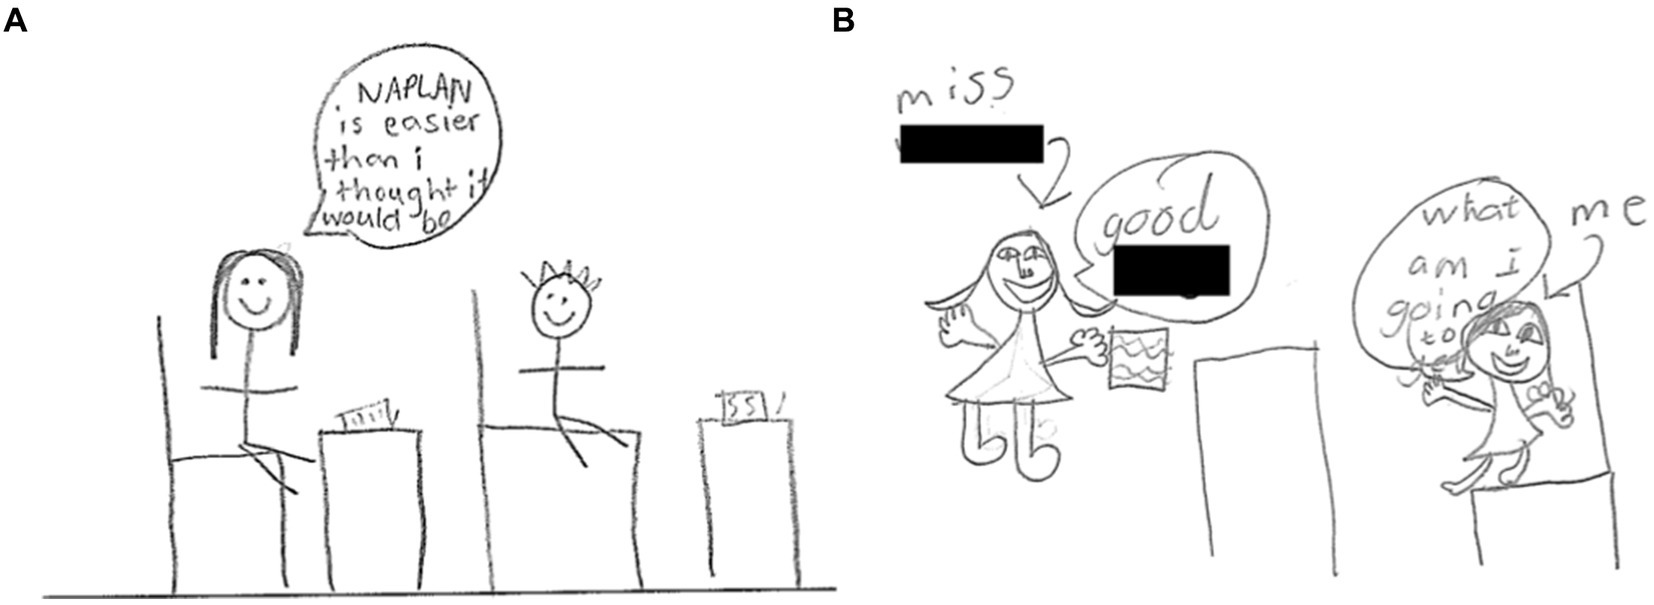
Figure 6. (A) Peers. (B) Teacher.
In terms of the location or setting of the drawing, the main site depicted was that of being at school with 191 (33%) drawings depicting the student at school and mostly sitting at their desks completing the test (177; 30%) (Figures 7A–C). There was only one image that was analyzed as being a celebration. Many drawings were of the students on their own with no other surrounding features, background, or interactions depicted to determine a specific location to nominate the context as learning or social.
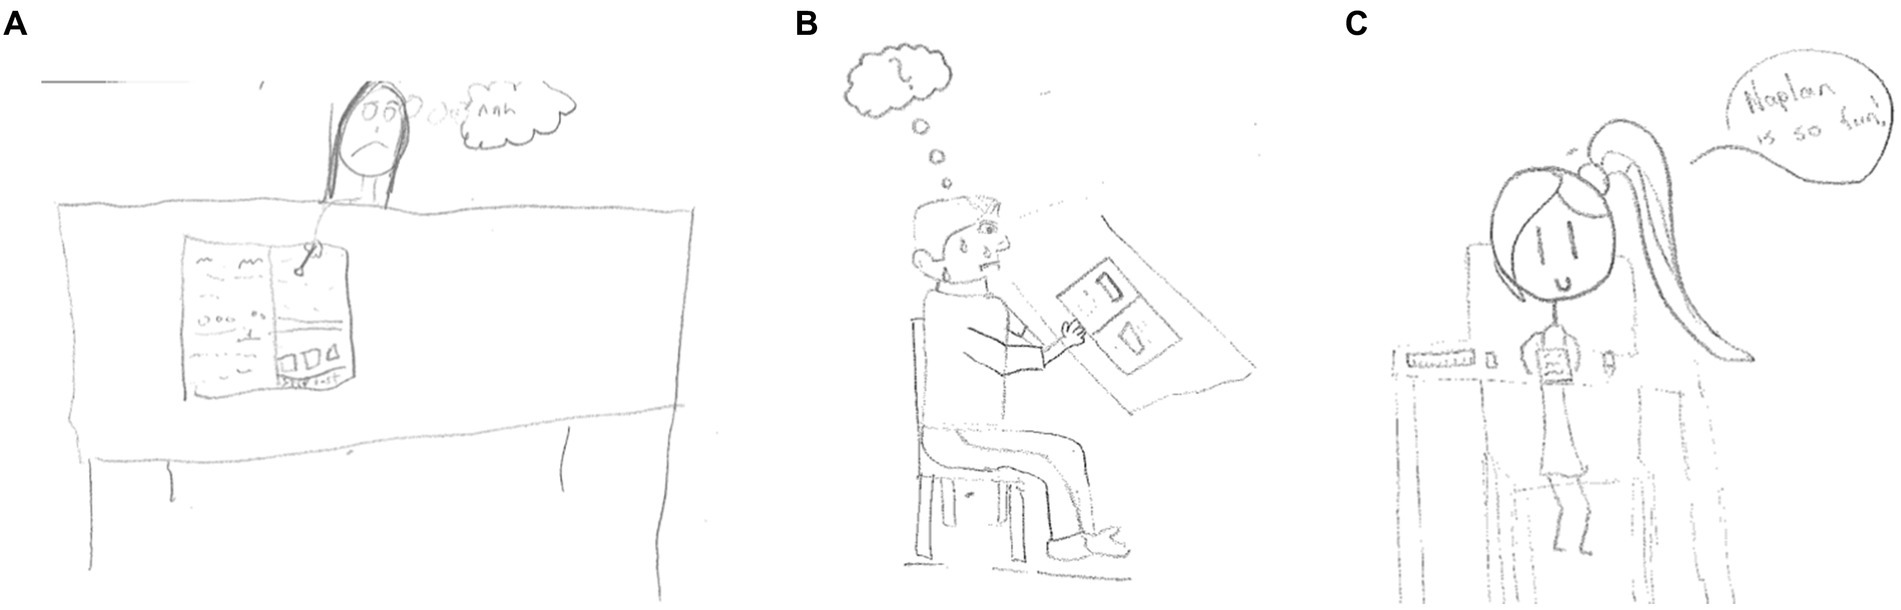
Figure 7. (A-C) Drawn locations predominantly at school doing the test.
The final group of categories examined outside of the direct test-taking behaviors were the actions that were often accompanied by some sort of emotion depicted in the drawing. Of the 574 drawings, the majority were positive which supports the findings from the initial impression analysis in Stage 1. There were, however, 108 (18%) drawings that depicted a negative emotional reaction to the tests, and 209 (36%) that were a mix of positive and negative emotions. A small number of drawings—16 (3%) referred in the illustration to the concern about the results of the test and others judging them on the result (Figures 8A,B).
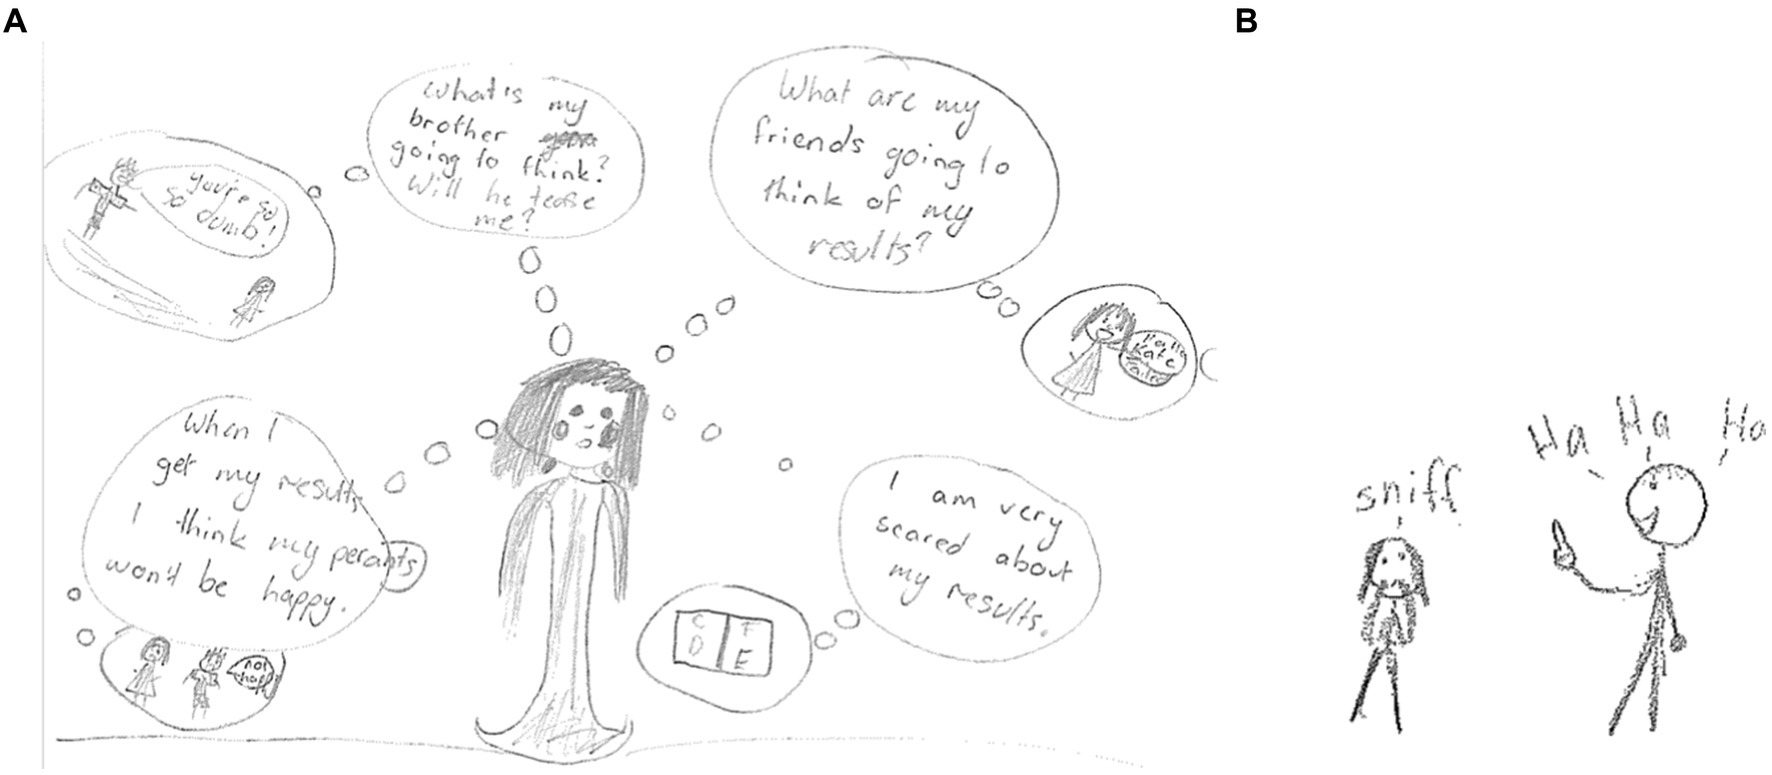
Figure 8. (A) and (B) Drawn concerns of what others will think of results.
There were six drawings that were identified in the self-harm column4 with one being an illustration depicting what can only be described as a very angry student with heavy lines and angry facial expressions (Figure 9A) and another showing the student using a knife as a pencil (Figure 9B). There was one drawing showing extreme worry about the view of others on their results (Figure 9C), two illustrating graves with their names on them (Figures 10A,B), and another illustrating warning against NAPLAN (Figure 11).

Figure 9. (A) Anger. (B) Knife as a pencil. (C) Worry for results.
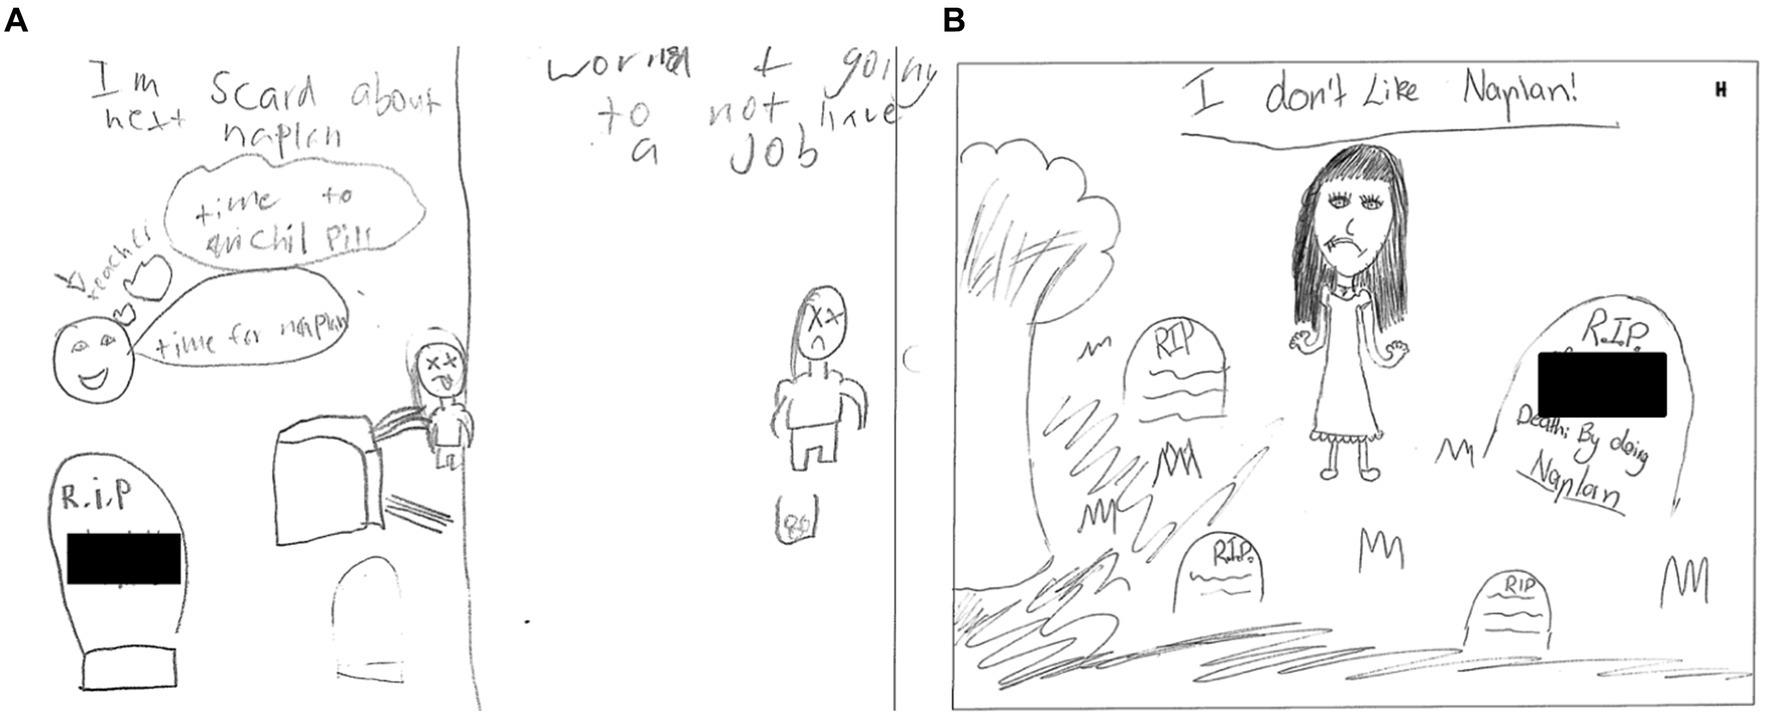
Figure 10. (A) and (B) Children drawing gravestones with their names on them.
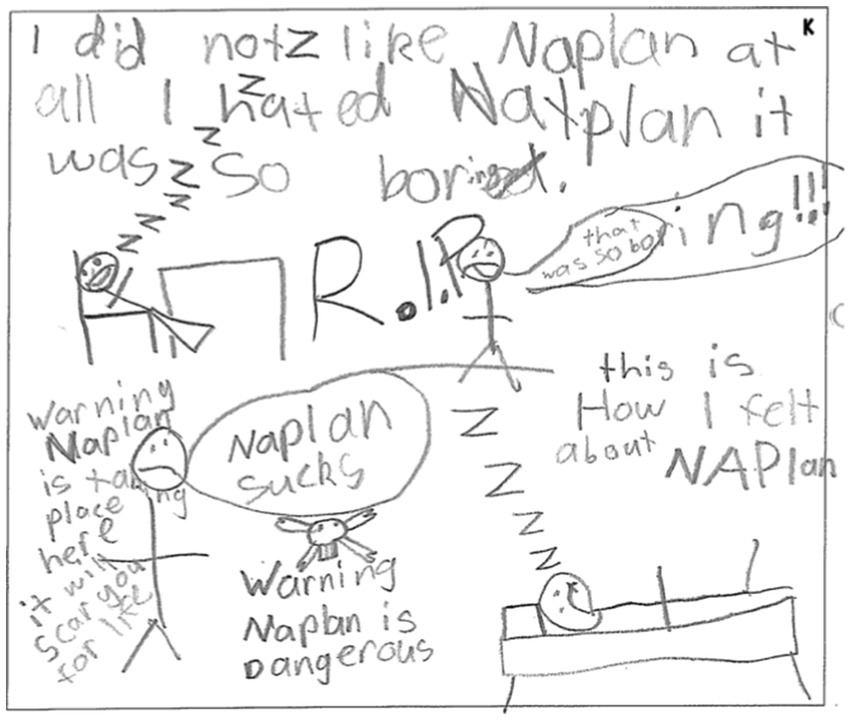
Figure 11. Warning that NAPLAN is dangerous.
As can be seen from the graphical representation of the more concerning drawings, there are reasons to show concern about the impact of NAPLAN testing on student wellbeing. The closer examination of drawings supports the initial numerical findings that across the 3 years the study was undertaken, an average of 19.6% of the Year 3s (439) and 25.3% of Year 5s (542) drawings examined depicted negatively coded images. When using the protocol, 18% of drawings were considered negative and 36% had mixed emotions. The depiction of students doing the test alone reflects that it is a solo activity, only relevant within the school; however, this is not a common trait across all the images. A closer examination of some of the negative images, however, provides a reason to delve further into this aspect and the impact of the tests. The drawings, indicating low feelings of self-worth, concerns about what others will think, and particularly thoughts of self-harm, highlight that NAPLAN is not a positive or neutral experience for some students, and this needs attention. This level of stress is not something children should be experiencing and, as such, should be the reason for policymakers and school administrations to rethink the process and the use of the results that are making NAPLAN high-stakes for students.
In addition to the examination of emotional responses that were the focus of this paper, other images support the political nature of NAPLAN testing in terms of referencing the results for Australia (Figure 12A) and Tony Abbott, the Australian Prime Minister at the time of data collection, reviewing test results (Figure 12B), the purpose of the tests (Figure 13A), and the need for the tests for schools (Figure 13B). Additional images indicating the influence of specific commercial programs/tools used within schools were also evidenced such as the WALT (What Are We Learning) and WILF (What I’m Looking For) to scaffold success criteria (Figure 14A) and the completion of practice tests in preparation for NAPLAN (Figure 14B). While these were not the specific focus of this paper, they do support the wider concerns around NAPLAN testing as a political measure that were raised in the literature review, as well as questions being raised about the increase in commercial programs being used within schools.
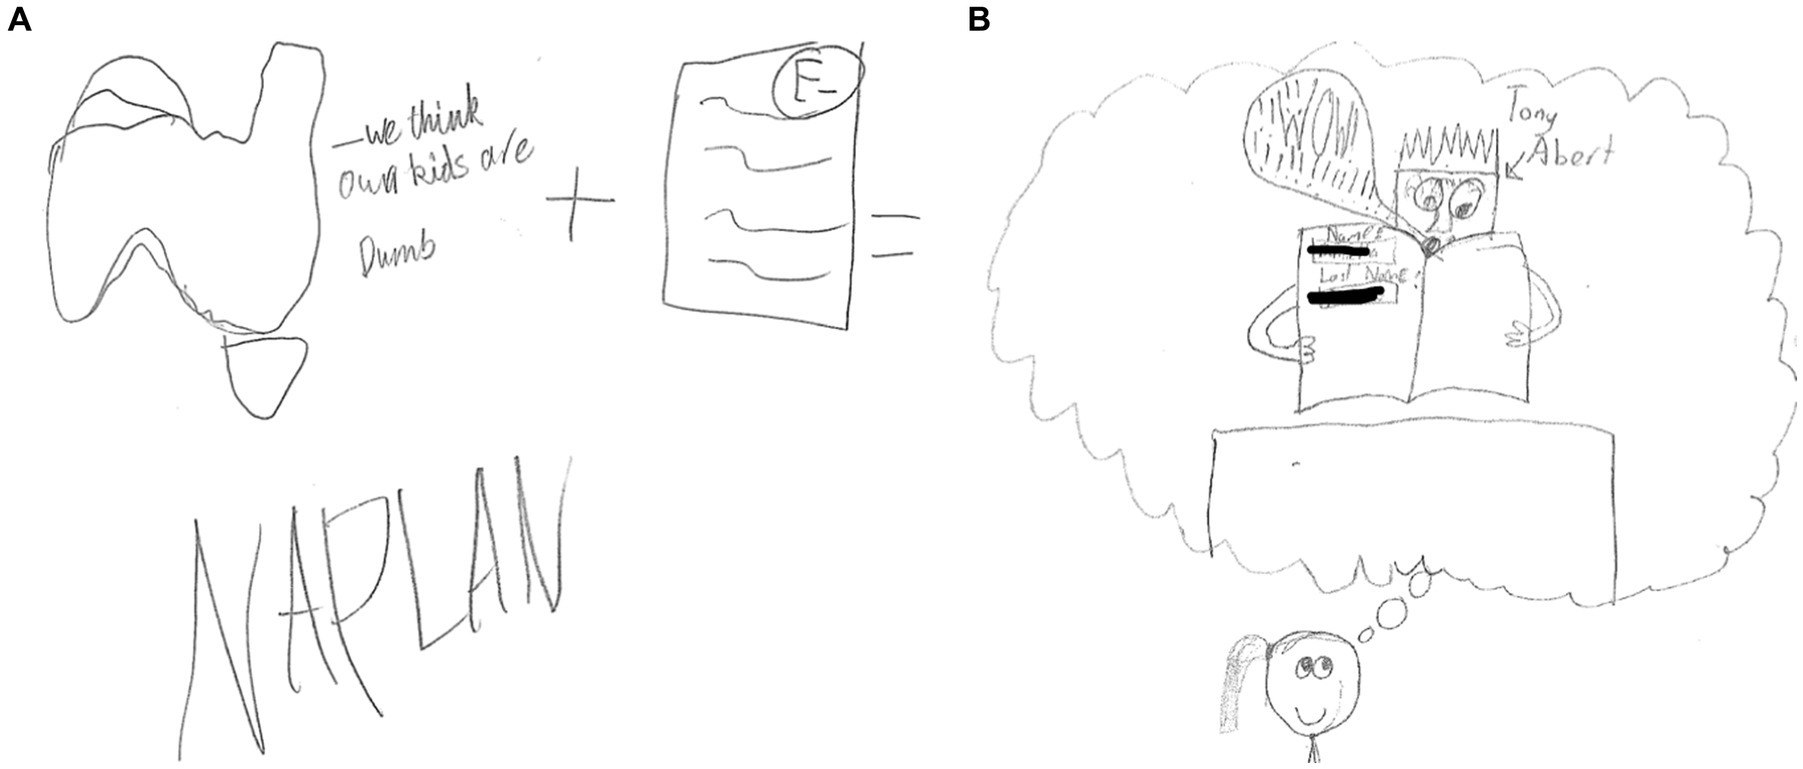
Figure 12. (A) Aussie kids are dumb. (B) Tony Abbott reading the test.

Figure 13. (A) Test to compare schools. (B) Important for the school.
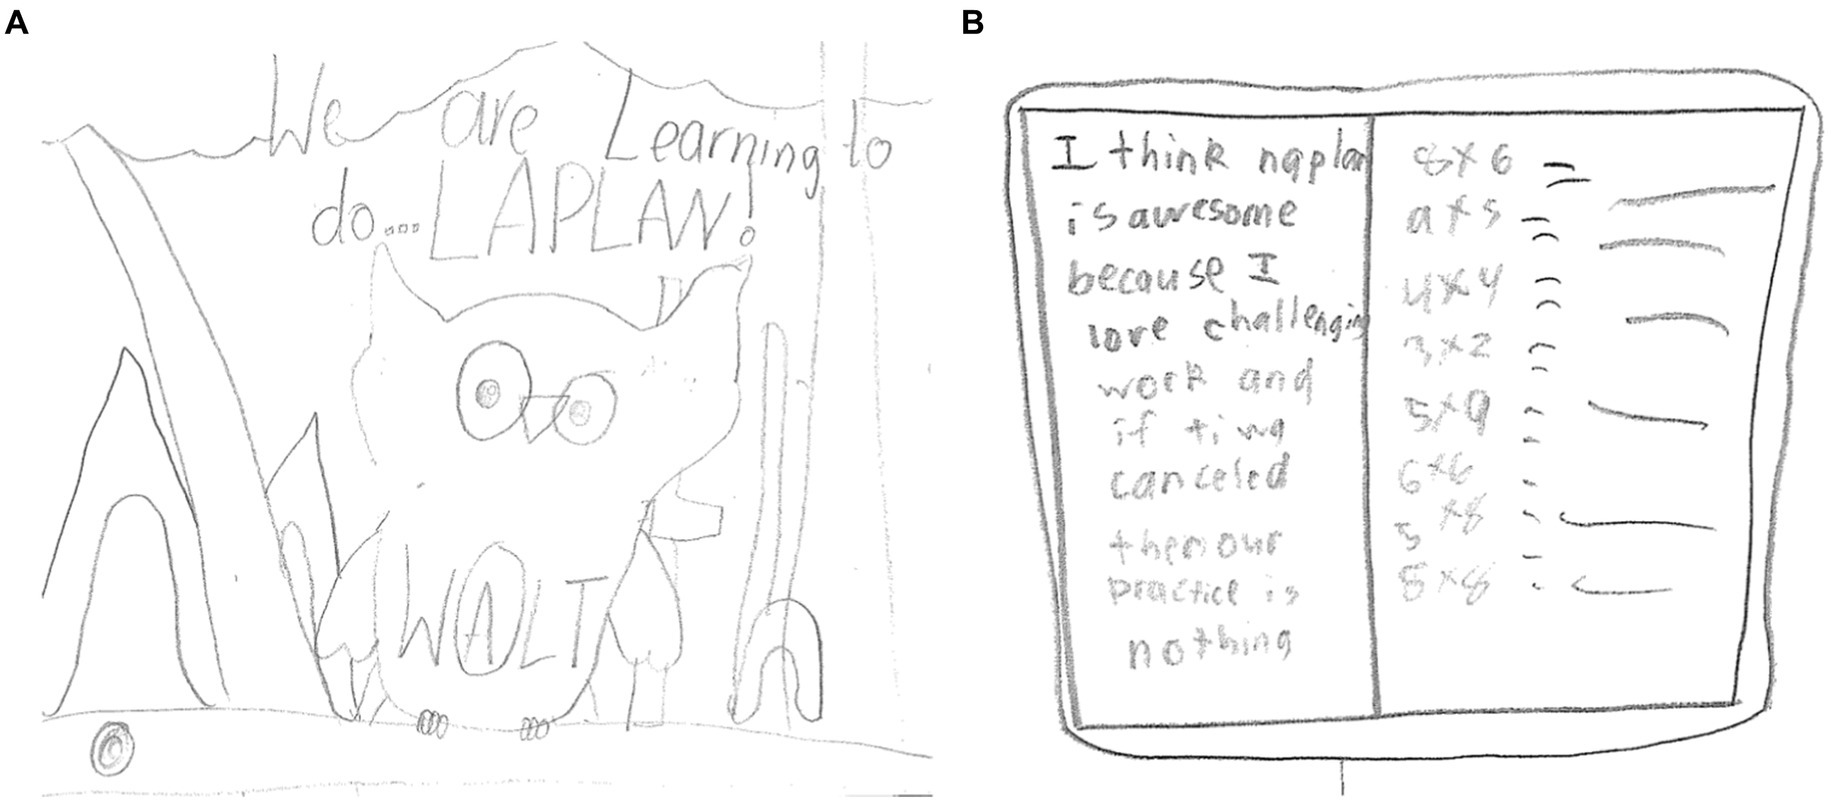
Figure 14. (A) Programs for test taking. (B) Practicing for the tests.
Discussion
This paper reports on the use of drawing analysis to explore the impact of NAPLAN testing on the wellbeing of children who have completed the tests. It builds on the results of the full study from which these data were drawn that found while increased NAPLAN pressure is perceived as having a negative impact on the wellbeing of staff, parents, and the students involved, “the experience of NAPLAN was not overly stressful for most parents and teachers.” The authors, however, did note that “there was still a substantial proportion” (approximately 25%) holding the belief that NAPLAN had a negative impact (Rogers et al., 2016, p. 10), and this concern has been raised in other research (Aybüke Sari et al., 2018; Carey et al., 2017; Jerrim, 2021; Howell, 2017).
These figures remain consistent when focusing solely on the initial analysis of the students’ drawn responses with an average of 15% of Year 3 and 28% of Year 5 students demonstrating negative perceptions of NAPLAN in their images. These results are lower than similar drawing-based studies such as Howell (2012) who had more than 50% of students providing entirely negative views on NAPLAN and Triplett and Barksdale (2005) who identified predominantly negative emotions in 32% of drawings and an additional 6% specifically focused on fire, flames, or burning. Given that the schools involved with the research came from higher socioeconomic areas that usually perform better in the tests, and the staff within the schools had reported making a conscious effort to reduce the focus and stress on NAPLAN, these images are of concern. While small in number, some of the images show a significant impact, and as such, the impact of NAPLAN on students needs to be considered (Howell, 2012). If the stress levels reported by the AEU are also considered within this debate, the concern should be more immediate. It has been identified that disadvantaged students fall further behind as they progress through school (Goss et al., 2016) and that there are equity issues with the testing process and content (Klenowski, 2011). With this clarification, the examination of students’ drawn responses to a question about their feelings in relation to NAPLAN showed that while not all students are negatively impacted by the tests and results, some students are, and this should be a concern for those involved in its implementation. Mayes and Howell (2018) further reinforce that these results are significant and something to pay attention to because the impact on smaller groups should not be dismissed, as any impact is important to note.
The results of this examination of students’ drawn responses provide at-scale data across several cohorts and build on some of the studies undertaken in Queensland. Howell (2012) questioned the assumption of NAPLAN being low stakes after examining 100 children’s drawings, and Swain et al. (2018) examined students’ perceptions and emotional reactions with a small cohort across three school sites. This large-scale examination of students’ perceptions through an open-ended mode identified that approximately one-fifth to one-quarter of the students in Years 3 and 5 whose images were examined have negative feelings toward NAPLAN. The use of images across these studies from Australia and the UK highlights the effectiveness of the method for examining children’s perspectives, especially when exploring complex constructs such as wellbeing.
When examined in further depth, these negative images included the students being upset about the tests, being concerned about the results and what others would think of them and some students who represented elements of self-harm within their images. These concerns should cause policymakers to pause and consider the impact of the testing on young students. While these responses are the minority for the cohort studied, the level is concerning. These results also amplify the need to conduct further research to explore these questions with a more diverse cohort of students including schools in socially and culturally diverse contexts and those without a specific focus on downplaying the tests to see whether the results are more pronounced among these cohorts.
The results highlight the high-stakes nature of the tests and that students feel pressure to perform when they are being compared to others for political reasons to justify school investment (Blaise, 2018) in an accountability regime (Lingard and Sellar, 2013). Given the results of this and other studies into these unintended consequences, it is important for changes to be considered for how the tests are done and for what purposes the results are being used. If the goals of the Alice springs Mparntwe Education Declaration are to be met (Education Council, 2019), then students need to feel safe at school and develop skills to enhance their own wellbeing which is difficult if external pressures such as NAPLAN tests are continuing to be implemented. Although the sample of concerning images in this study was small, they are there and as such should be considered in the context of student wellbeing while at school. If the results were not required in 2020, and 85% of teachers and 75% of principals believe that NAPLAN does not improve student outcomes (AEU Media Release, May 2019), then perhaps changes need to be made to reduce the additional, often political, use of the scores within broader education discourse (Klenowski, 2011; Lingard, 2010; Lingard and Sellar, 2013; Hardy, 2015).
Limitations
While drawings and images are appropriate to this research, there are some considerations that must be made that could be identified as limitations of their use in this project. These include that the drawings were used in isolation (Looman, 2006; Salmi and Kumpulainen, 2017; Yuen, 2004), and so there is a risk of “adultist” interpretations being placed on images (Bland, 2012, p. 240). Barraza (1999, p. 50) noted, however, that children by the age of 8 years draw with “visual realism” using proportions and relationships that speak a graphic language that increases the ease of interpretation by others. Given the student in this study were 7–8 years of age at their youngest, it is believed this limitation was somewhat mitigated although is still a consideration.
The students were additionally restricted to a half A4 page for their image and were not supplied with a range of materials with which to draw and so this may have prevented some from fully expressing their ideas as they would have liked. It was not that additional tools were not allowed by the researchers, more that the students generally came to complete the survey with one writing tool only.
An additional limitation of the study is that the sample was drawn from independent schools that had above-average ICSA scores. The use of these settings was related to the funding of the research coming from the Independent School sector in WA and that the schools self-selected to be engaged with the study because of an existing focus on student wellbeing. The students in these contexts traditionally achieve higher results in NAPLAN tests, as supported by research such as Getenet and Berswick (2021), and the schools reported implementation of programs to specifically target reducing anxiety around the NAPLAN testing process. Results from a more diverse cohort of schools from broader ICSEA areas may elicit different findings.
Conclusion
Stress and anxiety can impact students and Australian schools are increasingly focused on the wellbeing of students. Given this focus, it is important to identify additional stresses being placed on students and the results of this research show that NAPLAN may be one of these. While this study points to approximately 20–25% of students being impacted, other studies report a higher rate of stress from the teacher and principal perspective. It can be argued that 20–25% is a small population of the students involved; however, this sample came from high ICSEA independent schools that advertise student wellbeing programs and who joined the study because of this focus. The degree of distress demonstrated through the images of some students identifies that this is something that policymakers need to pay attention to. This is particularly important when the students involved in this research attend schools that traditionally perform well on NAPLAN tests and had programs in place to specifically target reducing stress around the NAPLAN testing processes.
Given research from 2020 shows that teachers and schools do not find the results of NAPLAN helpful and do not consider the tests useful, it may be the opportune time to investigate alternate options that are more suitable to the initial intended purposes of NAPLAN and that reduce the stress being placed on students. That is currently the challenge being laid at the feet of those who make decisions regarding these implementations—look at the goals of school from the Alice springs Mparntwe Education Declaration (Education Council, 2019) and the original purposes of NAPLAN (ACARA, 2016a, 2016b) and realistically explore whether (a) these goals are currently being effectively met and (b) whether there is a better way to achieve these goals with less impact on student wellbeing.
Data availability statement
The original contributions presented in the study are included in the article/supplementary material, further inquiries can be directed to the corresponding author.
Ethics statement
The studies involving humans were approved by Edith Cowan University Ethics Committee. The studies were conducted in accordance with the local legislation and institutional requirements. Written informed consent for participation in this study was provided by the participants’ legal guardians/next of kin and the children gave their assent to complete the drawing.
Author contributions
PR: Conceptualization, Data curation, Formal analysis, Investigation, Methodology, Project administration, Visualization, Writing – original draft, Writing – review & editing. LB: Conceptualization, Data curation, Formal analysis, Funding acquisition, Investigation, Methodology, Project administration, Supervision, Validation, Visualization, Writing – original draft, Writing – review & editing.
Funding
The author(s) declare that financial support was received for the research, authorship, and/or publication of this article. This project was supported with funding from the Association of Independent Schools, Western Australia (AISWA).
Acknowledgments
The authors would like to thank the children for their honesty and courage in sharing their beliefs with us.
Conflict of interest
The authors declare that the research was conducted in the absence of any commercial or financial relationships that could be construed as a potential conflict of interest.
Publisher’s note
All claims expressed in this article are solely those of the authors and do not necessarily represent those of their affiliated organizations, or those of the publisher, the editors and the reviewers. Any product that may be evaluated in this article, or claim that may be made by its manufacturer, is not guaranteed or endorsed by the publisher.
Footnotes
1. ^Since the completion of this research, NAPLAN has been moved to earlier in the school year—now takes place in March.
2. ^In this paper, an image is used to describe student’s samples that include both drawn and written modes.
3. ^Drawings refer to the samples that are drawn only—the samples that included writing were excluded in the second stage of the analysis.
4. ^Any student who drew a concerning image was highlighted to the teacher so that the school could follow up with appropriate interventions to assist the child. This was an important process within the research to ensure student wellbeing was not impacted by engaging in the research.
References
Abdul Latif, S. N. (2021). “Standardised testing and students’ wellbeing: a global or local problem?” in Globalisation, education, and reform in Brunei Darussalam. eds. P. Le Ha, A. Kumpoh, K. Wood, R. Jawawi, and H. Said (New York, NY: Palgrave MacMillan).
ACARA. (2016a). NAPLAN. Available at: https://www.nap.edu.au/naplan (Accessed September 8, 2022).
ACARA. (2016b). ICSEA infographic. Available at: https://docs.acara.edu.au/resources/20160418_ACARA_ICSEA.pdf (Accessed September 8, 2022).
Australian Education Union-Federal Office. (2021). Time for NAPLAN to go: ANU. Media release: 10th May 2021.
Aybüke Sari, S., Bilek, G., and Celik, E. (2018). Test anxiety and self-esteem in senior high school students: a cross-sectional study. Nord. J. Psychiatry 72, 84–88. doi: 10.1080/08039488.2017.1389986
Barraza, L. (1999). Children's drawings about the environment. Environ. Educ. Res. 5, 49–66. doi: 10.1080/1350462990050103
Berblett, L., Bobongie-Harris, F., Cartmel, J., Hadley, F., Harrison, L., Irvine, S., et al. (2022). \u0027Were not useless, we know stuff!\u0027 Gathering children\u0027s voices to inform policy. Australas. J. Early Child. 48. doi: 10.1177/18369391221139912
Beyond Blue. (2024). Wellbeing. Factsheet. Available at: https://beyou.edu.au/fact-sheets/wellbeing (Accessed July 31, 2022).
Blaise, J. (2018). Why we need NAPLAN. Research Report. The Centre for Independent Studies. Available at: https://www.cis.org.au/product/why-we-need-naplan/ (Accessed May 20, 2022).
Bland, D. (2012). Analysing children’s drawings: applied imagination. Int. J. Res. Method Educ. 35, 235–242. doi: 10.1080/1743727X.2012.717432
Bland, D. (2018). Using drawing in research with children: lessons from practice. Int. J. Res. Method Educ. 41, 342–352. doi: 10.1080/1743727X.2017.1307957
Carey, E., Hill, F., Devine, A., and Szűcs, D. (2017). The modified abbreviated math anxiety scale: a valid and reliable instrument for use with children. Front. Psychol. 8, 1–13. doi: 10.3389/fpsyg.2017.00011
Clark, A. (2011). Breaking methodological boundaries? Exploring visual, participatory methods with adults and young children. Eur. Early Child. Educ. Res. J. 19, 321–330. doi: 10.1080/1350293x.2011.597964
Clark, A., and Flewitt, R. (2020). The competent child: valuing all young children as knowledgeable commentators on their lives. Rev. Sci. Math. ICT Educ. 14, 9–24. doi: 10.26220/rev.3369
Cohen, L., and Manion, L. (1994). Research methods in education. 4th Edn. Oxfordshire, England, UK: Routledge.
Comber, B. (2012). Mandated literacy assessment and the reorganisation of teachers’ work: federal policy, local effects. Crit. Stud. Educ. 53, 119–136. doi: 10.1080/17508487.2012.672331
Creswell, J. W. (2013). Research design: Qualitative, quantitative, and mixed methods approaches. 4th Edn. Thousand Oaks, California: SAGE Publications, Inc.
Cumming, J., Goldstein, H., and Hand, K. (2019). Enhanced use of educational accountability data to monitor educational progress of Australian students with focus on indigenous students. Educ. Assess. Eval. Account. 32, 29–51. doi: 10.1007/s11092-019-09310-x
Daly, K. J. (2007). Qualitative methods for family studies and human development. Thousand Oaks, California: SAGE.
Deguara, J. (2019). Young children’s drawings: a methodological tool for data analysis. J. Early Child. Res. 17, 157–174. doi: 10.1177/1476718X18818203
Department of Education. (2018). Department of Education Annual Report 2017–2018. Government of Western Australia. Available at: http://www.parliament.wa.gov.au/publications/tabledpapers.nsf/displaypaper/4011714aaf40d08acb4db12e4825830d00163d74/$file/1714.pdf (Accessed September 30, 2022).
Dulfer, N., Polesel, J., and Rice, S. (2012). The experience of education: The impacts of high stakes testing on school students and their families. An Educator’s Perspective. Rydalmere NSW, Australia: The Whitlam Institute.
Education Council. (2019) Alice Springs (Mparntwe) education declaration. Council of Australian Governments. Available at: https://www.education.gov.au/download/4816/alice-springs-mparntwe-education-declaration/7180/alice-springs-mparntwe-education-declaration/pdf (Accessed December 16, 2022).
Farokhi, M., and Hashemi, M. (2011). The analysis of children’s drawings: social, emotional, physical and psychological aspects. Procedia Soc. Behav. Sci. 30, 2219–2224. doi: 10.1016/j.sbspro.2011.10.433
Getenet, S., and Berswick, K. (2021). Predictors of children’s achievement: analysis of the Australian national numeracy assessment program. Educ. Assess. Eval. Account. 33, 591–620. doi: 10.1007/s11092-021-09364-w
Goss, P., Sonnemann, J., Chisholm, C., and Nelson, L. (2016). Widening gaps: What NAPLAN tells us about student progress. Carlton, Victoria, Australia: Grattan Institute.
Gross, J., and Hayne, H. (1998). Drawing facilitates children’s verbal reports of emotionally laden events. J. Exp. Psychol. Appl. 4, 163–179. doi: 10.1037/1076-898X.4.2.163
Hadley, F., Harrison, L., Irvine, S., Barblett, L., Cartmel, J., and Bobongie-Harris, F. (2021). Discussion paper: 2021 National Quality Framework Approved Learning Frameworks Update. Macquarie University. Available at: https://www.mq.edu.au/faculty-of-arts/departments-and-schools/macquarie-school-of-education/our-research/research-groups/approved-learning-frameworks-update/stage-2 (Accessed September 1, 2022).
Halpenny, A. (2021). Capturing children’s meanings in early childhood research and practice. Oxfordshire, England, UK: Routledge.
Hamama, L., and Ronen, T. (2009). Children’s drawings as a self-report measurement. Child Fam. Soc. Work 14, 90–102. doi: 10.1111/j.1365-2206.2008.00585.x
Hardy, I. (2015). A logic of enumeration: the nature and effects of national literacy and numeracy testing in Australia. J. Educ. Policy 30, 335–362. doi: 10.1080/02680939.2014.945964
Harmon, F., and Viruru, R. (2018). Debunking the myth of the efficacy of “push-down academics”. How rigid, teacher, centred, academic early learning environments disempower young children. J. Fam. Strengths 18, 1–11. doi: 10.58464/2168-670X.1390
Howell, A. (2012). The silent voice in the NAPLAN debate: exploring children’s lived experiences of the tests. Joint AARE APERA International Conference, Sydney 2012, pp. 1–19.
Howell, A. (2017). ‘Because then you could never ever get a job!’: children’s constructions of NAPLAN as high-stakes. J. Educ. Policy 32, 564–587. doi: 10.1080/02680939.2017.1305451
Jay, J. A., and Knaus, M. (2018). Embedding play-based learning into junior primary (Year 1 and 2) curriculum in WA. Aust. J. Teach. Educ. 43, 112–126. doi: 10.14221/ajte.2018v43n1.7
Jerrim, J. (2021). National tests and the wellbeing of primary school pupils: new evidence from the UK. Assess. Educ. Princ. Policy Pract. 28, 507–544. doi: 10.1080/0969594X.2021.1929829
Klenowski, V. (2011). Assessment for learning in the accountability era: Queensland, Australia. Stud. Educ. Eval. 37, 78–83. doi: 10.1016/j.stueduc.2011.03.003
Klenowski, V., and Wyatt-Smith, C. (2012). The impact of high stakes testing: the Australian story. Assess. Educ. Princ. Policy Pract. 19, 65–79. doi: 10.1080/0969594x.2011.592972
Kress, G. (1997). Before writing: Rethinking the paths to literacy. Oxfordshire, England, UK: Routledge.
Lee, J., Lee, J.-S., and Lawton, J. (2022). Cognitive mechanisms for the formation of public perception about national testing: a case of NAPLAN in Australia. Educ. Assess. Eval. Account. 34, 427–457. doi: 10.1007/s11092-022-09398-8
Lingard, B. (2010). Policy borrowing, policy learning: testing times in Australian schooling. Crit. Stud. Educ. 51, 129–147. doi: 10.1080/17508481003731026
Lingard, B., and Sellar, S. (2013). ‘Catalyst data’: perverse systemic effects of audit and accountability in Australian schooling. J. Educ. Policy 28, 634–656. doi: 10.1080/02680939.2012.758815
Looman, W. S. (2006). A developmental approach to understanding drawings and narratives from children displaced by Hurricane Katrina. J. Pediatr. Nurs. Pract. 20, 158–166. doi: 10.1016/j.pedhc.2006.01.008
Luke, A. (2010). Will the Australian curriculum up the intellectual ante in primary classrooms? Curric. Perspect. 30, 59–65.
Maxwell, T. (2015). What can year-5 children’s drawings tell us about their primary school experiences? Pastoral Care Educ. 33, 83–95. doi: 10.1080/02643944.2015.1034758
Mayaba, N. N., and Wood, L. (2015). Using drawings and collages as data generation methods with children: definitely not child’s play. Int. J. Qual. Methods 14:160940691562140. doi: 10.1177/1609406915621407
Mayes, E., and Howell, A. (2018). The (hidden) injuries of NAPLAN: two standardised test events and the making of ‘at risk student subjects. Int. J. Incl. Educ. 22, 1108–1123. doi: 10.1080/13603116.2017.1415383
Mayne, F., Howitt, C., and Rennie, L. J. (2018). A hierarchical model of children’s research participation rights based on information, understanding, voice, and influence. Eur. Early Child. Educ. Res. J. 26, 644–656. doi: 10.1080/1350293X.2018.1522480
Merriman, B., and Guerin, S. (2006). Using children's drawings as data in child-centred research. Ir. J. Psychol. 27, 48–57. doi: 10.1080/03033910.2006.10446227
Mulheron, M. (2017). NAPLAN online testing cannot proceed: teachers. Education. Available at: https://www.proquest.com/scholarly-journals/yes-equality-naplan-online-testing-cannot-proceed/docview/1952379845/se-2
OECD (n.d.). Office of Economic and Cultural Development. Available at: https://www.oecd.org/pisa/
Papandreou, M. (2014). Communicating and thinking through drawing activity in early childhood. J. Res. Child. Educ. 28, 85–100. doi: 10.1080/02568543.2013.851131
Polesel, J., Rice, S., and Dulfer, N. (2014). The impact of high-stakes testing on curriculum and pedagogy: a teacher perspective from Australia. J. Educ. Policy 29, 640–657. doi: 10.1080/02680939.2013.865082
Powell, M. A., and Graham, A. (2017). Wellbeing in schools. Examining the policy-practice nexus. Aust. Educ. Res. 44, 213–231. doi: 10.1007/s13384-016-0222-7
Roberts, P., Barblett, L., and Robinson, K. (2019). Early years teachers’ perspectives on the effects of NAPLAN on stakeholder wellbeing and the impact on early years pedagogy and curriculum. Australas. J. Early Child. 44, 309–320. doi: 10.1177/1836939119855562
Rodriguez, S., Regueiro, B., Piñeiro, I., Valle, A., Sánchez, B., Vieites, T., et al. (2020). Success in mathematics and academic wellbeing in primary-school students. Sustain. For. 12:3796. doi: 10.3390/su12093796
Rogers, S. L., Barblett, L., and Robinson, K. (2016). Investigating the impact of NAPLAN on student, parent and teacher emotional distress in independent schools. Aust. Educ. Res. 43, 327–343. doi: 10.1007/s13384-016-0203-x
Salaky, K. (2018). What standardizes tests look like in 10 places around the world. Insider. Available at: https://www.thisisinsider.com/standardized-tests-around-the-world-2018-9 (Accessed September 6, 2022).
Salmi, S., and Kumpulainen, K. (2017). Children’s experiencing of their transition from preschool to first grade: a visual narrative study. Learn. Cult. Soc. Interact. 20, 58–67. doi: 10.1016/j.lcsi.2017.10.007
School Curriculum and Standards Authority (SCSA). (2014). OLNA. Available at: https://k10outline.scsa.wa.edu.au/home/assessment/testing/olna (Accessed September 8, 2022).
Shier, H. (2019). “Student voice and children’s rights: participation, empowerment and “protagonismo”” in Encyclopedia of teacher education. ed. M. A. Peters (Singapore: Springer).
Smith, W. C., and Holloway, J. (2020). School testing culture and teacher satisfaction. Educ. Assess. Eval. Account. 32, 461–479. doi: 10.1007/s11092-020-09342-8
Swain, K., Pendergast, D., and Cumming, J. (2018). Student experiences of NAPLAN: sharing insights from two school sites. Aust. Educ. Res. 45, 315–342. doi: 10.1007/s13384-017-0256-5
Tay-Lim, J., and Lim, S. (2013). Privileging younger children’s voices in research: use of drawings and a co-construction process. Int. J. Qual. Methods 12, 65–83. doi: 10.1177/160940691301200135
Thompson, G. (2013). NAPLAN, MySchool and accountability: teacher perceptions of the effects of testing. Int. Educ. J. 12, 62–84.
Thompson, G. (2015). “Local experiences, global similarities: teacher perceptions of the impacts of national testing” in National testing in schools. eds. B. Lingard, G. Thomspon, and S. Sellar (Melbourne, Australia: Routledge), 75–89.
Thompson, G., and Harbaugh, A. G. (2013). A preliminary analysis of teacher perceptions of the effects of NAPLAN on pedagogy and curriculum. Aust. Educ. Res. 40, 299–314. doi: 10.1007/s13384-013-0093-0
Triplett, C. F., and Barksdale, M. A. (2005). Third through sixth graders’ perceptions of high-stakes testing. J. Lit. Res. 37, 237–260. doi: 10.1207/s15548430jlr3702_5
Van Manen, M. (1990). Researching lived experience. Human science for an action sensitive pedagogy. London: Routledge.
Ward, D. M. (2012). The effects of standardised assessment (NAPLAN) on teacher pedagogy at two Queensland schools [Doctoral dissertation]. Available at: https://eprints.qut.edu.au/63662/ (Accessed September 22, 2022).
Wright, S. (2003). “Ways of knowing in the arts” in Children, meaning-making and the arts. ed. S. Wright (Brisbane, Queensland, Australia: Pearson Education), 1–31.
Keywords: wellbeing, standardized testing, NAPLAN, children’s drawing, children’s voice
Citation: Roberts P and Barblett L (2024) Young student’s views of NAPLAN: impact on wellbeing through drawn responses. Front. Educ. 9:1443563. doi: 10.3389/feduc.2024.1443563
Edited by:
Darren Moore, University of Exeter, United KingdomReviewed by:
Louise Connolly, Bishop Grosseteste University, United KingdomMark Vicars, Victoria University, Australia
Copyright © 2024 Roberts and Barblett. This is an open-access article distributed under the terms of the Creative Commons Attribution License (CC BY). The use, distribution or reproduction in other forums is permitted, provided the original author(s) and the copyright owner(s) are credited and that the original publication in this journal is cited, in accordance with accepted academic practice. No use, distribution or reproduction is permitted which does not comply with these terms.
*Correspondence: Pauline Roberts, cGF1bGluZS5yb2JlcnRzQGVjdS5lZHUuYXU=