 Marcelo Coppi
 Isabel Fialho
 Marília Cid
- Center for Research in Education and Psychology of the University of Évora (CIEP-UE), University of Évora, Évora, Portugal
Aiming to assess the scientific literacy level of Portuguese 9th grade students and analyse whether the variables sex, liking for the subjects of Natural Sciences and Physical-Chemistry, failure in these subjects, school socio-economic context and course option were associated to the students’ scientific literacy levels, we applied the Avaliação da Literacia Científica Essencial (ALCE) instrument to 516 students. Overall, the results showed that the majority of students were at the moderate level and that 64.1% were scientifically literate. Analysing by subtest, we found that in the Nature of Science (NOS) and Impact of Science and Technology on Society (ISTS) subtests, the majority of students were at the moderate level and in the Content of Science (CS) subtest, the majority were at the low level of scientific literacy; whereas 70.0, 72.9, and 39.9% of students were classified as scientifically literate in the NOS, ISTS and CS subtests, respectively. The greatest difficulties were concentrated in the CS subtest, particularly in Biology, Physics and Chemistry. The analysis according to the independent variables shows that the students’ scientific literacy level might be associated with their liking for the subjects of Natural Sciences and Physical-Chemistry and their expectations regarding the profession they wish to pursue in the future.
1 Introduction
Scientific literacy is a term that emerged in 1945 and covers knowledge about science and, above all, its application in real-life and everyday contexts. Defined by the Organisation for Economic Co-operation and Development (OECD) as “the ability of an individual to engage in science-related issues and to understand scientific ideas as a reflective citizen being able to explain phenomena scientifically, evaluate and design scientific investigations, interpret data and evidence scientifically” (Duarte et al., 2023, p. 25), scientific literacy gained momentum after the 1980s, when changes in science curricula in various countries began to take place in order to correspond to its assumptions (Coppi et al., 2023c).
Portugal belonged to this group of countries and began a process of curriculum reorganisation in the 2001/2002 school year, adopting the concept of Flexible Curriculum Management, with emphasis on replacing learning objectives with competences and creating the subject area of Physical and Natural Sciences, organised around four themes (Earth in Space, Earth in Transformation, Sustainability on Earth and Living Better on Earth). Between some advances and setbacks, this process culminated in two curriculum documents: the Students’ Profile by the End of Compulsory Schooling and the Essential Learnings of the various subjects that make up the Portuguese curriculum. In the area of Physical and Natural Sciences, represented in the 3rd cycle of basic education by the subjects of Natural Sciences and Physical-Chemistry, this set of curricular reforms established new organisational guidelines and curricular designs for science teaching (Coppi et al., 2023c).
The Students’ Profile by the End of Compulsory Schooling is made up of a “common matrix for all schools and educational offers within the scope of compulsory education, namely at the curricular level, in the planning, implementation and internal and external evaluation of teaching and learning,” establishing itself as a benchmark for decision-making by educational stakeholders in Portuguese educational establishments (Martins et al., 2017, p. 1). Although it is a general document, it refers to aspects that encompass the subjects of Natural Sciences and Physical-Chemistry, such as the association between scientific and technological knowledge with safety and the sustainability of society.
Even though the Students’ Profile by the End of Compulsory Schooling does not specify the term scientific literacy, the document indicates that school should be the place where students acquire multiple literacies and must be reconfigured in order to respond to current demands and requirements. In this sense, albeit indirectly, the development of scientific literacy is included in the Students’ Profile by the End of Compulsory Schooling, since it specifies that school education should enable students to intervene in society and participate in current debates on environmental, social and ethical issues in an active, conscious and responsible way (Martins et al., 2017).
The Essential Learnings for Natural Sciences, as in the Students’ Profile by the End of Compulsory Schooling, does not explicitly mention the term scientific literacy. However, they do include the development of scientific literacy skills, since they clarify that the subject of Natural Sciences aims to develop
a general and comprehensive understanding of the main ideas and explanatory structures of Earth and Life Sciences, aspects of the History and Nature of Science, scientific research procedures, as well as questioning human behaviour towards the world and the impact of science and technology on the environment and living beings (DGE, 2018a, p. 1; DGE, 2018b, p. 1; DGE, 2018c, p. 1).
As for the Essential Learnings for Physical-Chemistry it categorically states that “the subject of Physical-Chemistry in basic education aims to contribute to the development of students’ scientific literacy” (DGE, 2018d, p. 1; DGE, 2018e, p. 1; DGE, 2018f, p. 1). According to these documents, by the end of the 3rd cycle of basic education, students should have acquired competences that allow them to understand scientific processes and phenomena that enable them to make informed decisions in order to exercise active and participatory citizenship (DGE, 2018d,e,f).
It is evident that the two curricular documents in force in Portugal for science teaching in the 3rd cycle of basic education aim to develop students’ scientific literacy by the end of the cycle. According to Duarte et al. (2023), a scientifically literate individual has a diverse set of competences that allow them to explain phenomena and interpret data and evidence scientifically, to evaluate and design scientific investigations and, consequently, to participate in an informed discussion about science and technology. Furthermore, the OECD recognises an affective element in these competences, in which the individual’s attitudes and predispositions towards science are capable of influencing their level of interest, sustaining their involvement and motivating them to act (OECD, 2019).
Regarding the assessment of students’ scientific literacy levels, there are two major international studies that include this assessment: the Programme for International Student Assessment (PISA) and the Trends in International Mathematics and Science Study (TIMSS). PISA, developed and coordinated by the OECD since 2000, is a triennial study that assesses the knowledge and skills of 15-year-old students in Science, Mathematics and Reading. The Science test assesses the literacy skills of students in this age group (Duarte et al., 2023).
In the last edition, 78.2% of Portuguese students achieved level 2 proficiency in scientific literacy, which is higher than the OECD mean of 75.5% (Duarte et al., 2023). This means that, “at the very least, these students are able to recognise the correct explanation for familiar scientific phenomena and are able to use this knowledge to identify, in simple cases, whether a conclusion is valid on the basis of the data provided” (Duarte et al., 2023, p. VII).
Meanwhile, TIMSS, promoted by the International Association for the Evaluation of Educational Achievement (IEA) since 1995, is a quadrennial study that assesses the Science and Mathematics literacy of 4th and 8th grade students (IEA, 2017). In its latest edition, regarding to the results of the 8th grade assessment, 73% of Portuguese students reached the intermediate performance level on the TIMSS scale (Duarte et al., 2020), therefore being able to interpret “information from tables, graphs and pictorial diagrams to formulate conclusions; apply knowledge to practical situations and express what they have understood through brief descriptive answers” (IAVE, 2019, p. 13).
Due to the rigorous technical procedures implemented in the definition of the benchmarks, the sampling processes, the selection of the schools and students involved and the development and validation of the items, the quality of both studies is recognised worldwide and their results are of great value to the participating countries. The national reports reveal indicators that make it possible to contextualise, explain and compare the results achieved and identify variables that contribute positively or negatively to student success. These indicators might be used to provide a diagnosis and evaluate the respective education systems and contribute to the discussion on the quality of education in these countries, as is the case in Portugal (Marôco et al., 2016).
At national level, there are few instruments and studies that assess students’ level of scientific literacy. One of the few studies carried out in Portugal, Coppi et al. (2023b) developed and validated the Avaliação da Literacia Científica Essencial (ALCE) instrument, designed to assess the scientific literacy level of students at the end of the 3rd cycle of basic education. After applying the instrument to 9th grade students, the Coppi et al. (2023a) observed that 64.1% of the students were classified as scientifically literate. It is worth noting that the ALCE is capable of assessing the overall scientific literacy level and for each subtest that composes it, Nature of Science (NOS), Impact of Science and Technology on Society (ISTS) and Content of Science (CS), although the study only reveals the overall results.
Within this context, this study aimed to assess the scientific literacy level of students at the end of the 3rd cycle of Portuguese basic education. To this end, we formulated the following research questions: (1) What is the students’ scientific literacy level, overall and by subtest? (2) How many students can be considered scientifically literate, overall and by subtest? (3) Are there statistical differences between the means of the students’ scientific literacy level per subtest when compared according to the independent variables sex, liking for the subject of Natural Sciences, and liking for the subject of Physical-Chemistry, failure in the subject of Natural Sciences and failure in the subject of Physical-Chemistry, course option in secondary education and school socio-economic context? (4) Which subtests do students have the greatest ease and difficulty doing?
In order to answer these research questions, the study used a questionnaire survey administered to students at the end of the 9th year of basic education at the end of the 2021/2022 school year, between April and June 2022, and subsequent statistical analyses, as described in detail in the following section. We then present the results and discussion, according to the order established for the research questions, and finally provide the conclusions of the study.
2 Methodology
2.1 Instrument
The instrument employed was the ALCE, developed and validated by Coppi et al. (2023b). The ALCE is an instrument made up of 34 interpretative items, in the true-false-don’t know format, which cover competences in the area of Physical and Natural Sciences in the 3rd cycle of Portuguese basic education. The items are grouped into three subtests, as follows: six items composing the NOS subtest; six items constituting the ISTS subtest; and 22 items forming the CC subtest.
Besides the three subtests that make up the ALCE, this study included two groups of items, one related to the sociodemographic characteristics of the sample, in order to describe it, and the other with covariates, in order to contextualise and compare the students’ performance results on the ALCE.
The first group contains four items: (1) sex; (2) age; (3) school year, and (4) school attended. For item 1, there are two answer options, male and female, and for items 2 and 3 and item 4, the students had to enter a numerical value and the name of the school, respectively.
Meanwhile, the second group includes five items: (1) Do you like the subject of Natural Sciences? (2) Have you ever failed the subject of Natural Sciences? (3) Do you like the subject of Physical-Chemistry? (4) Have you ever failed Physical-Chemistry? (5) Which course do you intend to choose in secondary education? Items 1 and 3 used a five-point Likert scale, with one being “I do not like it” and five being “I adore it.” Items 2 and 4 were dichotomous, with the answer options “yes” and “no.” Finally, item five was multiple choice, with the answer options being “Science and Technology course,” “Socio-economic Sciences course,” “Languages and Humanities course,” “Visual Arts course” and “Vocational courses.” We emphasise that the information regarding the school’s socio-economic context was obtained from the Portal Infoescolas, of the Portuguese Ministry of Education and Science, based on the answer to item 4 of the group of sociodemographic questions. According to the Ministry of Education and Science, schools are divided into three socio-economic contexts: unfavourable, schools in which more than 50% of students are included in the School Social Action programme; intermediate, schools in which 25 to 50% of students are covered by the programme; and favourable, schools in which less than 25% of students are covered by the School Social Action programme (DGEEC, 2023).
2.2 Avaliação da Literacia Científica Essencial (ALCE) scoring and ranking criteria
The ALCE is scored dichotomously. Therefore, one point is awarded for items answered correctly and zero points for items answered incorrectly or marked as don’t know.
Regarding the scientific literacy level classification by ALCE subtest, it is based on the percentage and number of correct answers and is divided into five levels: very low, low, moderate, high and very high (Table 1).
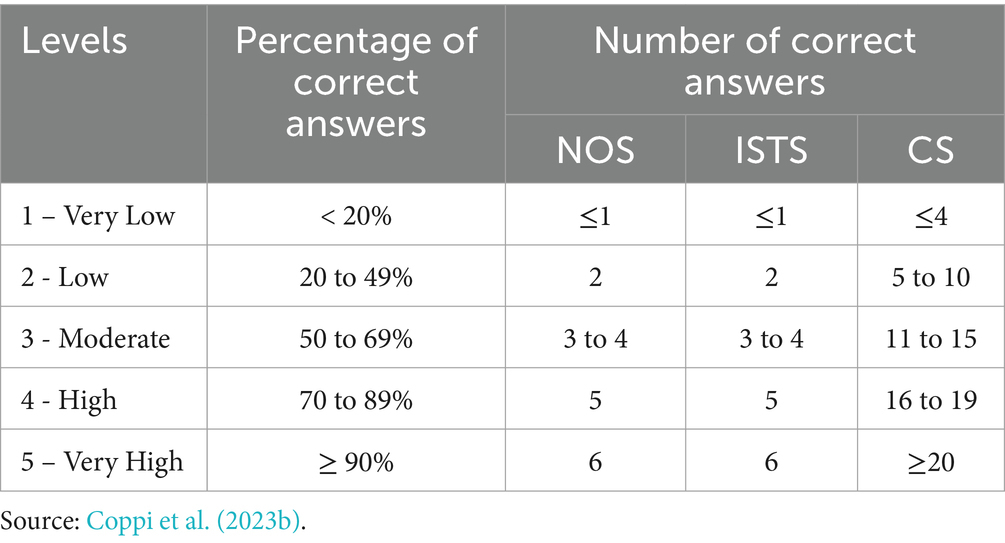
Table 1. Classification levels of scientific literacy by subtest according to the percentage and number of correct answers per subtest.
Meanwhile, the classification of the students’ overall scientific literacy level, although using the same classification levels as above, is obtained by determining the average of the scientific literacy levels of the three subtests (Table 2).
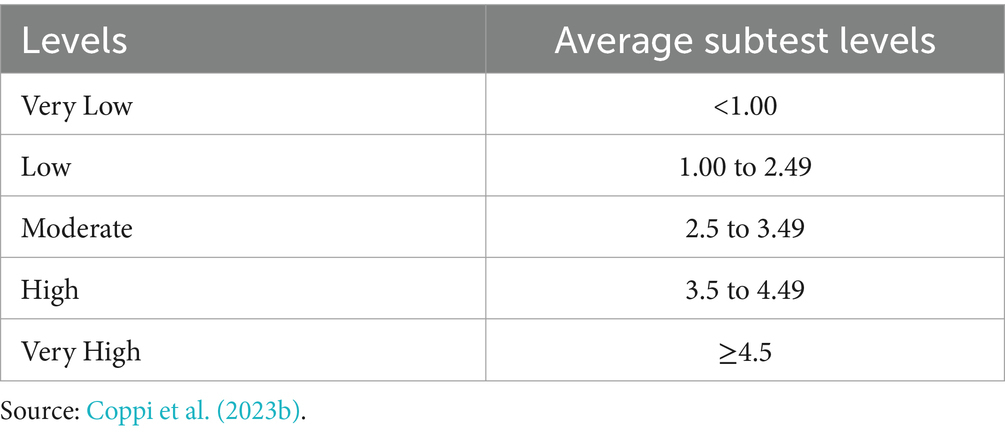
Table 2. Overall scientific literacy classification levels according to the average of the subtest levels.
According to the ALCE classification criteria, students who reach at least a moderate level of scientific literacy are considered scientifically literate in the subtests and overall.
2.3 Participants
A total of 516 9th grade students from 20 public schools in mainland Portugal answered the ALCE. The average age of the students was 14.69 years (SD = 0.88), 257 (49.8%) were female and 259 (50.2%) were male.
2.4 Instrument application procedure
The ALCE was administered digitally using the LimeSurvey software. The students answered the questionnaire in class and in the presence of their teachers. The average response time was 30 min.
Its application was authorised by the Directorate General for Innovation and Curriculum Development, through the School Survey Monitoring System, under registration no. 0740900001.
2.5 Data analysis procedure
The data was analysed using software SPSS, v. 27, and included descriptive analyses, using measures of central tendency and dispersion, and inferential analyses, using Student’s t-test for independent samples and analysis of variance (ANOVA). The descriptive analyses were carried out to characterise the sample, to identify the percentage of correct answers, errors and don’t know option marked on each item that makes up the ALCE and to determine the students’ scientific literacy level.
Meanwhile, Student’s t-test was used to analyse the comparison of the means of the students’ scientific literacy levels according to the independent variables sex, failure in the subject of Natural Sciences, failure in the subject of Physical-Chemistry and course option in secondary education.
Finally, ANOVA, which used Tukey’s post hoc test, was carried out to compare the means of the students’ scientific literacy levels according to the independent variables liking for the subject of Natural Sciences, liking for the subject of Physical-Chemistry, and school socio-economic context. We emphasise that all the prerequisites of the statistical analyses used were met.
3 Results
In order to respond to the objectives of the study, the results are presented in four topics: overall results of the ALCE application; Nature of Science (NOS) subtest results; Impact of Science and Technology on Society (ISTS) subtest results; and Content of Science (CS) subtest results. The subtests results include: the results of the students’ scientific literacy level; the results of the scientific literacy level according to the independent variables; and the results of the number of correct answers, errors and don’t know option marked.
We would like to highlight, however, that since the results of the overall analysis of the application of the ALCE, i.e., the analysis of the students’ scientific literacy level, have already been published by Coppi et al. (2023a), in this article we will only briefly mention these results and then describe the results regarding the analysis of the application of the ALCE by subtest.
3.1 Overall results of the Avaliação da Literacia Científica Essencial (ALCE) application
The overall results of the ALCE application show that 64.1% of the students were classified as scientifically literate, as they achieved moderate (49.4%), high (14.3%) and very high (0.6%) levels of scientific literacy on the ALCE. On the other hand, 35.7% students were considered scientifically illiterate, as they were classified as having a low level of scientific literacy. We would emphasise, however, that no student was classified at the very low level (Figure 1).
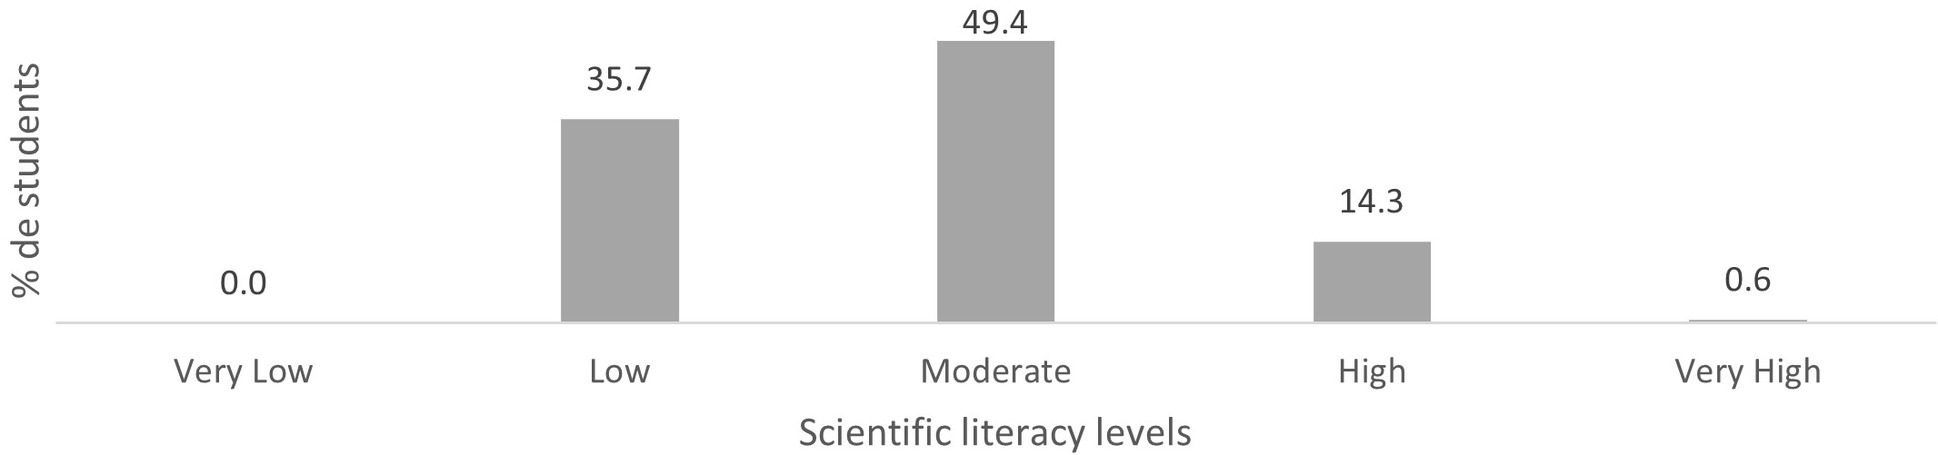
Figure 1. Distribution of students’ scientific literacy level in ALCE.
3.2 Nature of Science (NOS) subtest results
The results regarding the students’ scientific literacy level in the NOS subtest show that, according to the classification criteria adopted, 70.0% were classified as scientifically literate in this subtest. Similar to the overall results, the majority of these students were at the moderate level of scientific literacy (44.8%) and a few reached the high (15.5%) and very high (9.7%) levels. The results also reveal that 30.0% of the students were not classified as scientifically literate, and that this percentage was higher than the sum of the percentages of students who reached the high and very high levels (25.2%) on the classification scale (Figure 2).
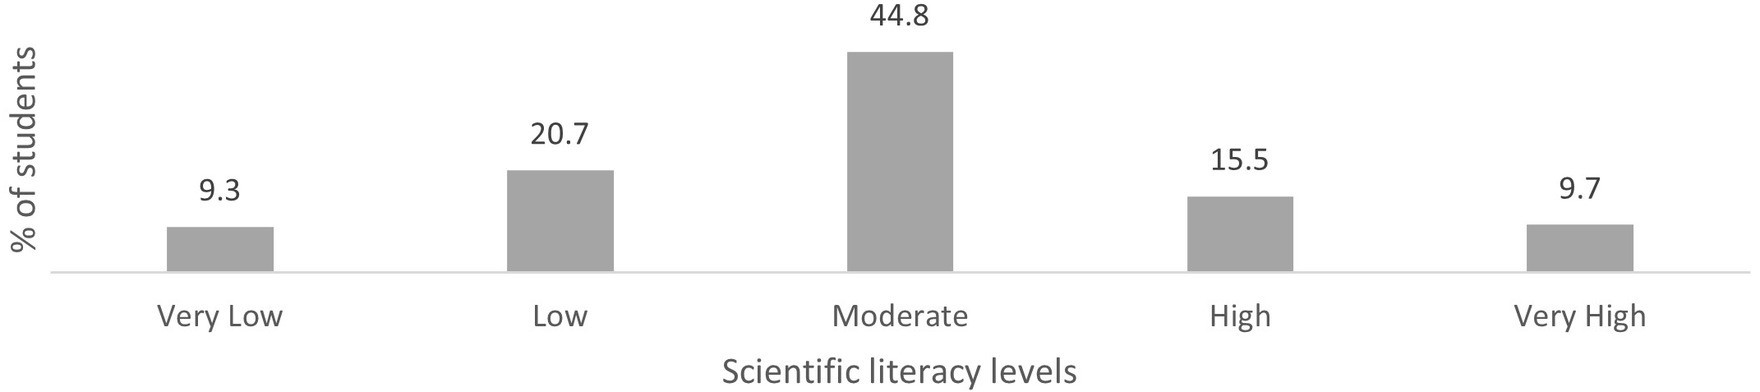
Figure 2. Distribution of students’ scientific literacy level in the Nature of Science (NOS) subtest.
Considering the characteristics of the scientifically literate students in the NOS subtest, we observed that: approximately one third are male (35.7%) and female (34.3%); around one third like the subjects of Natural Sciences (34.1%) and Physical-Chemistry (31.8%); around two thirds have never failed the subjects of Natural Sciences (66.7%) and Physical-Chemistry (64.9%); the majority chose the Science and Technology course in secondary education; and more than a third study in schools with an intermediate socio-economic context (36.8%; Table 3).
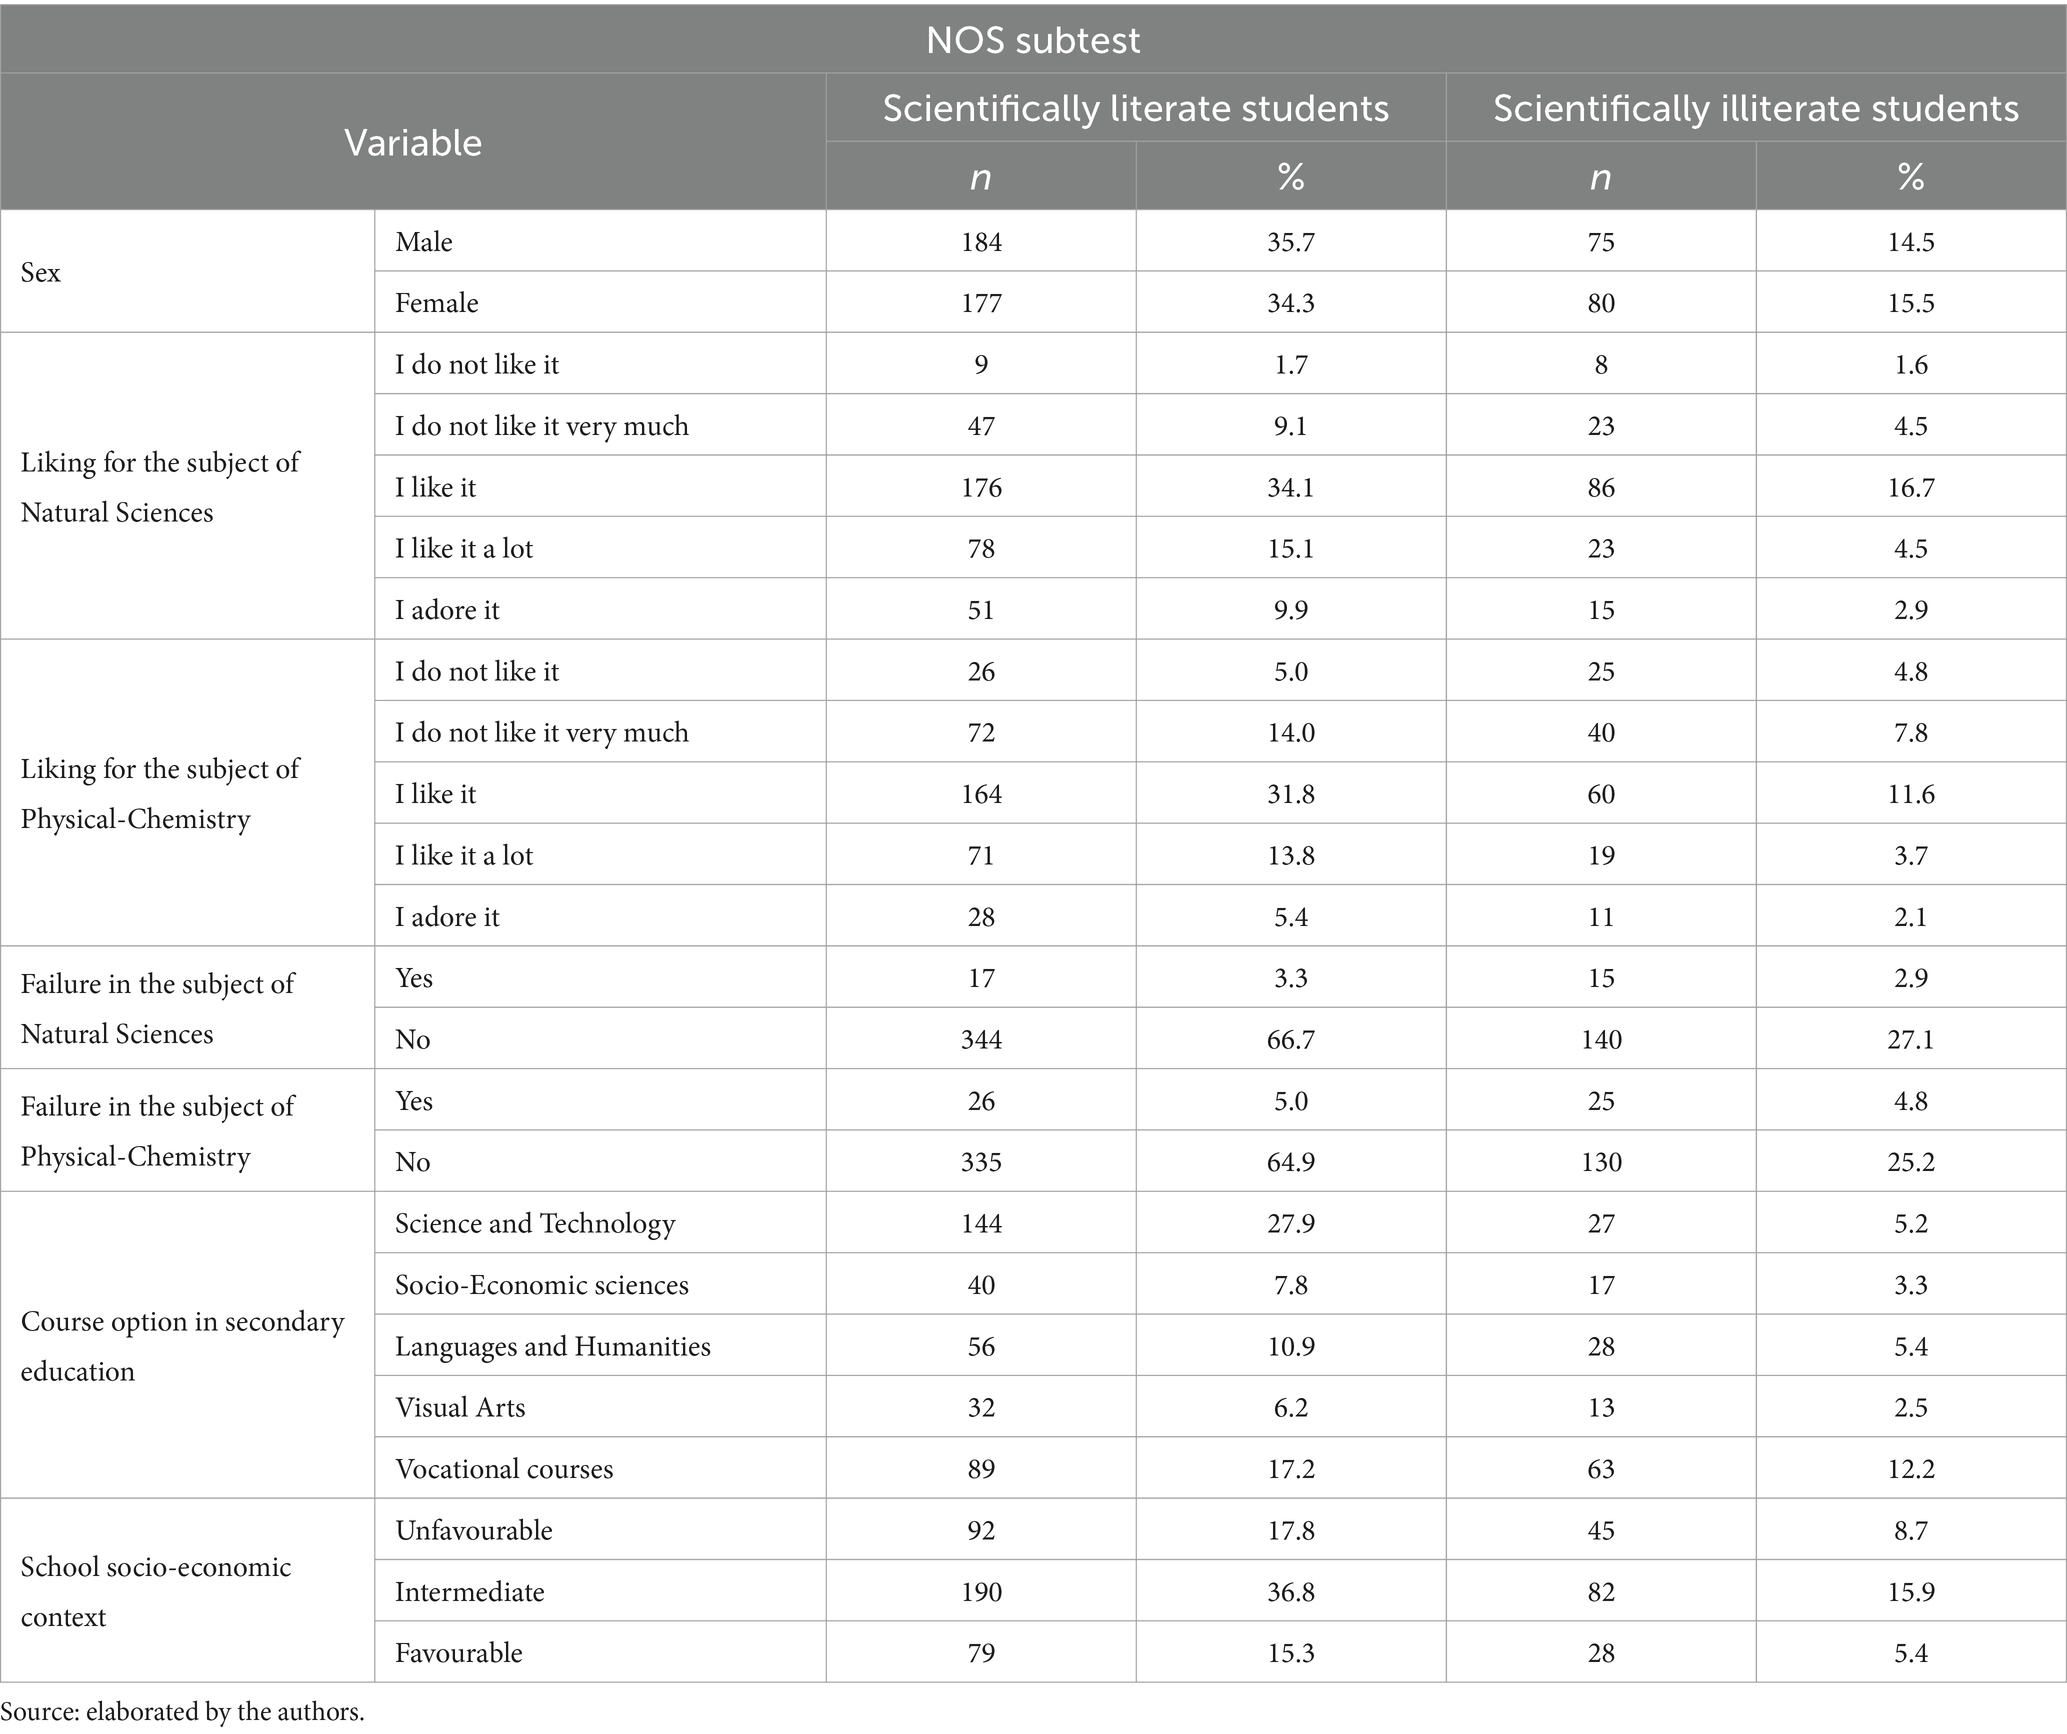
Table 3. Characteristics of scientifically literate students in the Nature of Science (NOS) subtest.
When analyzing the possible differences between the means of the students’ scientific literacy level in the NOS subtest, according to the stipulated independent variables, we observed significant differences (p < 0.05) between the means of the groups in the following variables: liking for the subject of Natural Sciences [F(4,511) = 2.79, p < 0.05, d = 0. 29]; liking for the subject of Physical-Chemistry [F(4,511) = 5.47, p < 0.001, d = 0.42]; failure in the subject of Natural Sciences [t(514) = −2.00, p < 0.001, d = −0.36]; opting for a Science and Technology course in secondary education [t(514) = 5.22, p < 0.001, d = 0.49]; and opting for Vocational courses in secondary education [t(514) = −3.81, p < 0.001, d = −0.37]. No significant differences were found (p > 0.05) in the variables sex, failure in the subject of Physical-Chemistry and school socio-economic context.
For the variable liking for the subject of Natural Sciences, the mean level of scientific literacy of students who like it a lot (M = 3.13, SE = 0.09) and adore it (M = 3.15, SE = 0.13) was statistically higher than that of students who do not like the subject (M = 2.41, SE = 0.21).
Regarding the variable of liking for the subject of Physical-Chemistry, the mean level of scientific literacy of the students who do not like it very much (M = 2.78, SE = 0.09), like it (M = 3.04, SE = 0.07), like it a lot (M = 3.16, SE = 0.11) and adore it (M = 3.18, SE = 0.18) was statistically higher than that of the students who do not like the subject (M = 2.45, SE = 0.15).
Concerning the variable failure in the subject of Natural Sciences, on average, students who had never failed (M = 2.98, SE = 0.05) had a statistically higher level of scientific literacy than those who had already failed this subject (M = 2.59, SE = 0.17).
For the variable opting for a Science and Technology course in secondary education, on average, students who opted for the course (M = 3.29, SE = 0.08) had a statistically higher level of scientific literacy than those who did not opt for this course (M = 2.79, SE = 0.06).
As for the variable opting for Vocational courses in secondary education, on average, students who opted for the course (M = 2.68, SE = 0.08) had a statistically lower level of scientific literacy than those who did not (M = 3.07, SE = 0.06).
Finally, regarding the percentage of correct answers, errors and don’t know option marked on the items corresponding to the NOS subtest, we observed that the average percentages were 56.9, 27.6 and 15.5%, respectively (Table 4).
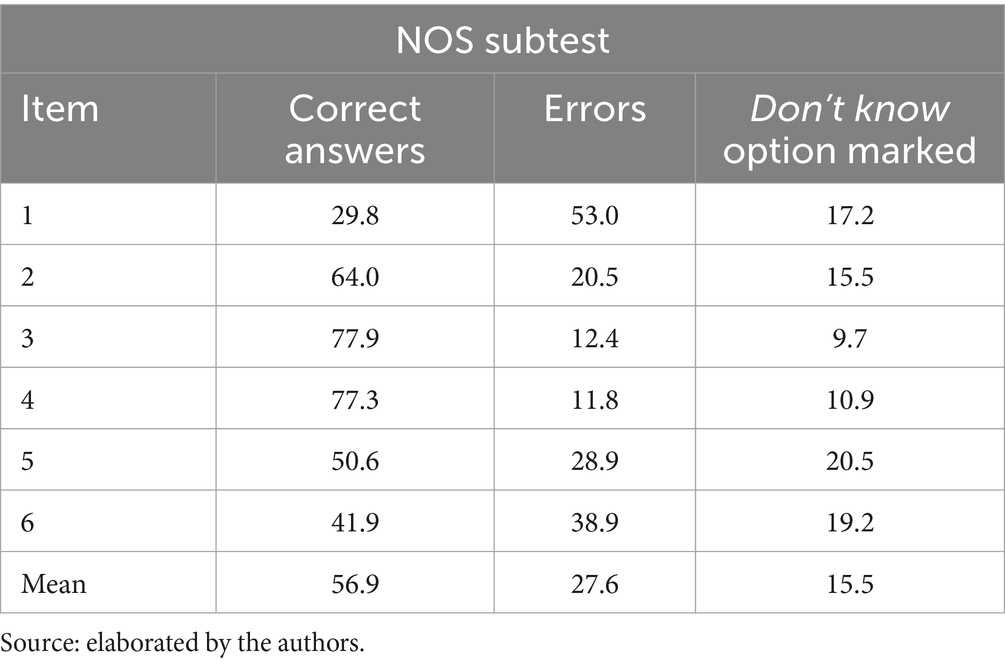
Table 4. Percentage of correct answers, errors and don’t know option marked on the items corresponding to the Nature of Science (NOS) subtest.
We noticed that the items with the highest percentage of correct answers were items 3 and 4, while the items with the lowest percentage of correct answers were items 1 and 6. Regarding the don’t know option, items 5, 6 and 1 had the highest percentage of marks.
3.3 Impact of Science and Technology on Society (ISTS) subtest results
The students’ results on the ISTS subtest indicate that, likewise the NOS subtest, 72.9% were classified as scientifically literate. Similarly, the largest number of students were at the moderate level of scientific literacy (49.2%) and only a few reached the high (16.3%) and very high (7.4%) levels. We also noticed that 27.1% did not get enough correct answers to be classified as scientifically literate and that this percentage is higher than the sum of the percentages of students who reached the high and very high levels (23.6%) of the classification scale (Figure 3).
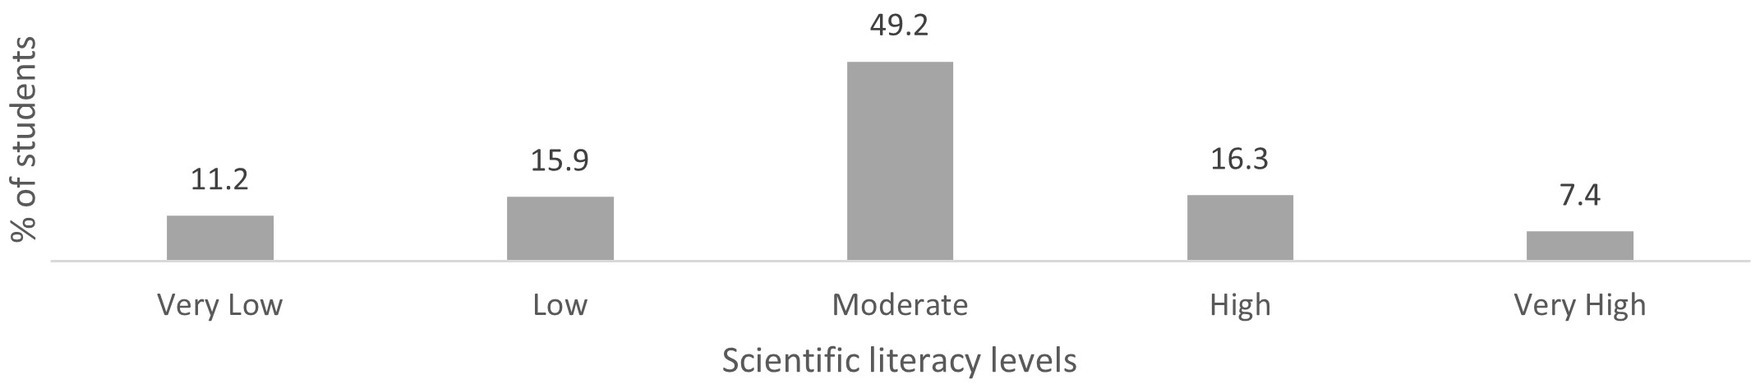
Figure 3. Distribution of students’ scientific literacy level in the Impact of Science and Technology on Society (ISTS) subtest.
As for the characteristics of the scientifically literate students in the ISTS subtest, we observed that: approximately one third are male (36.6%) and female (36.2%); around one third like the subjects of Natural Sciences (35.3%) and Physical-Chemistry (31. 2%); around two thirds have never failed the subjects of Natural Sciences (68.6%) and Physical-Chemistry (67.1%); the majority chose the Science and Technology course in secondary education; and more than a third study in schools with an intermediate socio-economic context (37.2%; Table 5).
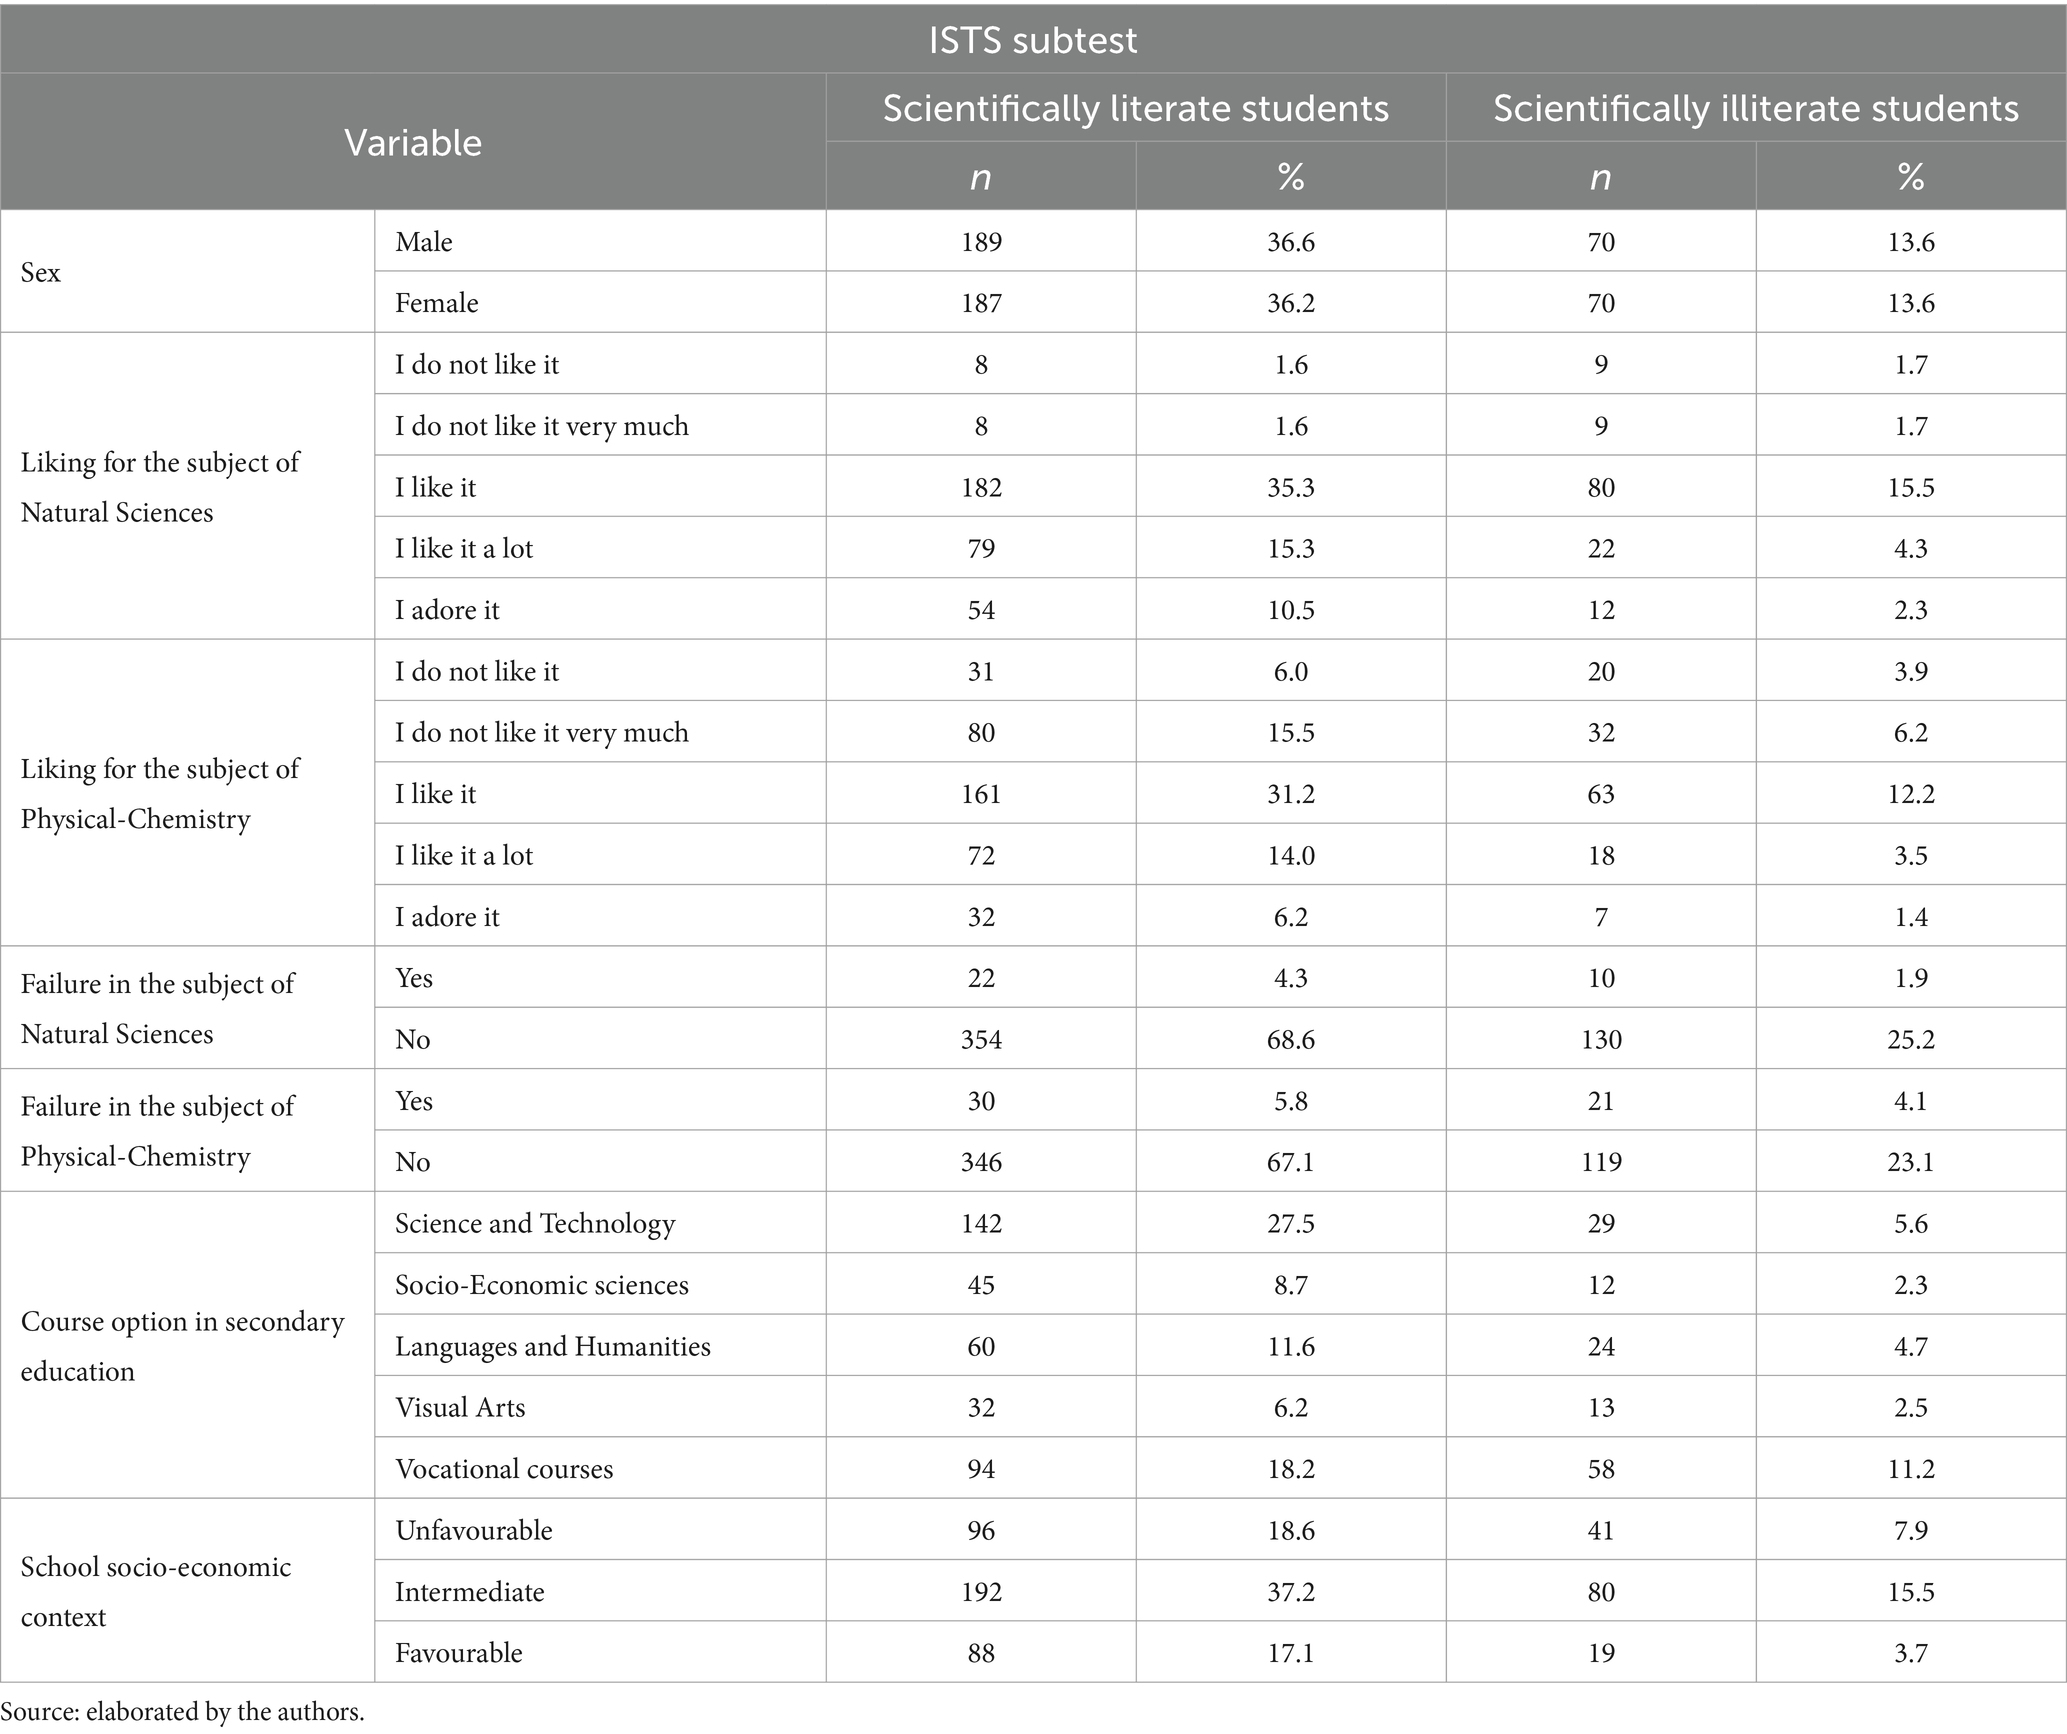
Table 5. Characteristics of scientifically literate students in the Impact of Science and Technology on Society (ISTS) subtest.
Concerning the analysis of the differences among the means of the students’ scientific literacy level in the ISTS subtest, according to the stipulated independent variables, the results revealed significant differences (p < 0.05) between the means of the groups in the following variables: liking for the subject of Natural Sciences [F(4,511) = 4.02, p < 0.01, d = 0.35]; liking for the subject of Physical-Chemistry [F(4,511) = 6.80, p < 0.001, d = 0.46]; failure in the subject of Physical-Chemistry [t(514) = −2.48, p < 0.05, d = −0.37]; opting for a Science and Technology course in secondary education [t(514) = 5. 56, p < 0.001, d = 0.52]; opting for Vocational courses in secondary education [t(514) = −4.96, p < 0.001, d = −0.48]; and school socio-economic context [F(2,513) = 3.70, p < 0.05, d = 0.24]. No significant differences were found (p > 0.05) in the variables sex and failure in the subject of Natural Sciences.
In the variable liking for the subject of Natural Sciences, the mean level of scientific literacy of students who adore it (M = 3.26, SE = 0.13) was statistically higher than that of students who do not like it (M = 2.35, SE = 0.26) and like the subject (M = 2.84, SE = 0.06).
Regarding the variable of liking for the subject of Physical-Chemistry, the mean level of scientific literacy of students who adore it (M = 3.31, SE = 0.17) was statistically higher than that of students who do not like it very much (M = 2.76, SE = 0.09) and do not like it (M = 2. 57, SE = 0.15); and the average level of scientific literacy of students who like the subject a lot (M = 3.29, SE = 0.11) was statistically higher than that of students who like it (M = 2.88, SE = 0.07), do not like it very much and do not like the subject.
On the variable of failure in the subject of Physical-Chemistry, on average, students who had never failed (M = 2.96, SE = 0.05) had a statistically higher level of scientific literacy than those who had already failed this subject (M = 2.59, SE = 0.15).
Regarding the variable opting for a Science and Technology course in secondary education, on average, students who opted for this course (M = 3.27, SE = 0.08) had a statistically higher level of scientific literacy than those who did not opt for this course (M = 2.75, SE = 0.05).
For the variable opting for Vocational courses in secondary education, on average, students who opted for the course (M = 2.59, SE = 0.07) had a statistically lower level of scientific literacy than those who did not (M = 3.07, SE = 0.05).
With regard to the school socio-economic context variable, the mean level of scientific literacy of students from schools with a favorable context (M = 3.16, SE = 0.10) was statistically higher than that of students from schools with an unfavorable context (M = 2.82, SE = 0.08).
Finally, regarding the percentage of correct answers, errors and don’t know option marked on the items corresponding to the ISTS subtest, the average percentages were 56.3, 28.4 and 15.3%, respectively (Table 6).
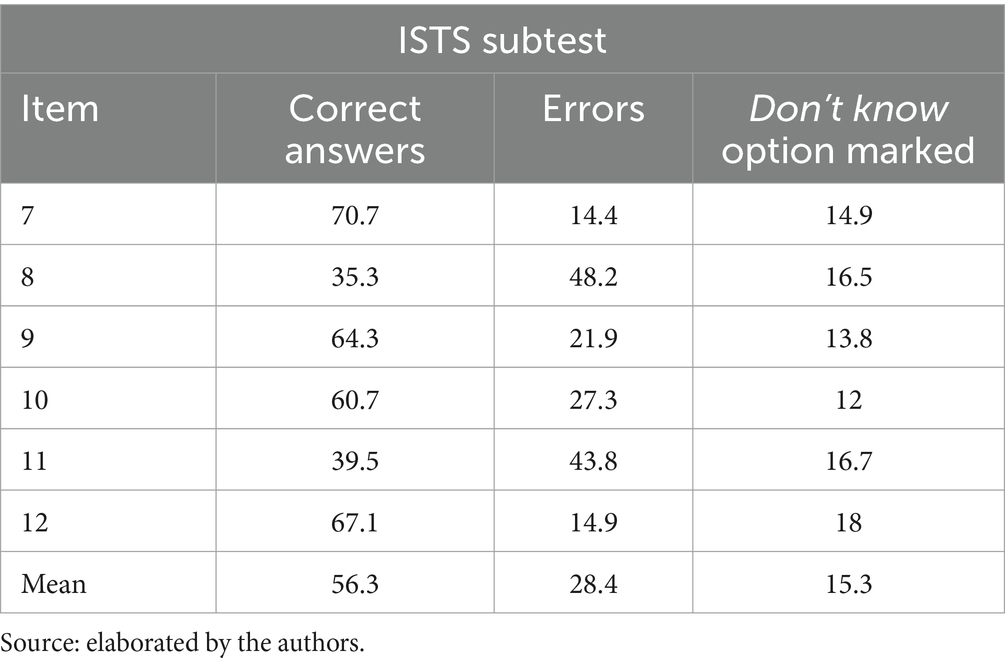
Table 6. Percentage of correct answers, errors and don’t know option marked on the items corresponding to the Impact of Science and Technology on Society (ISTS) subtest.
We noticed that the highest percentage of correct answers was in items 7 and 12, while the lowest percentage of correct answers was in items 8 and 11. As for the option don’t know, items 12, 11 and 8 had the highest percentage of marks.
3.4 Content of Science (CS) subtest results
Regarding the CS subtest, the students’ results indicate that only 39.9% were classified as scientifically literate. In this subtest, the majority of students were classified at the low level of scientific literacy (55.6%) and a small number reached the high (4.4%) and very high (0.2%) levels. We found that 60.1% were classified as scientifically illiterate, which is approximately 13 times higher than the sum of the percentages of students who reached the high and very high levels (4.6%) of the classification scale (Figure 4).
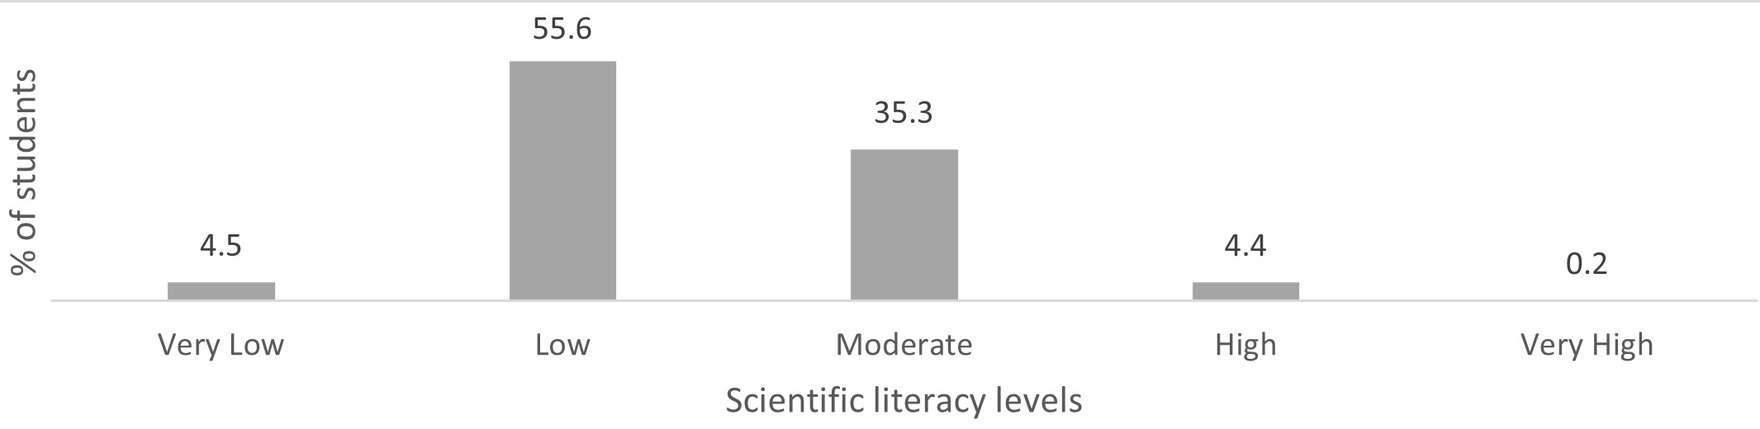
Figure 4. Distribution of students’ scientific literacy level in the Content of Science (CS) subtest.
Concerning the characteristics of scientifically literate students in the CS subtest, we observed that: less than a third are male (20.9%) and female (19.0%); less than a third like the subjects of Natural Sciences (18.6%) and Physical-Chemistry (17.4%); a slightly more than a third have never failed the subjects of Natural Sciences (38.0%) and Physical-Chemistry (38.2%); the majority chose the Science and Technology course in secondary education (19.6%); and less than a third study in schools with an intermediate socio-economic context (21.7%) (Table 7).
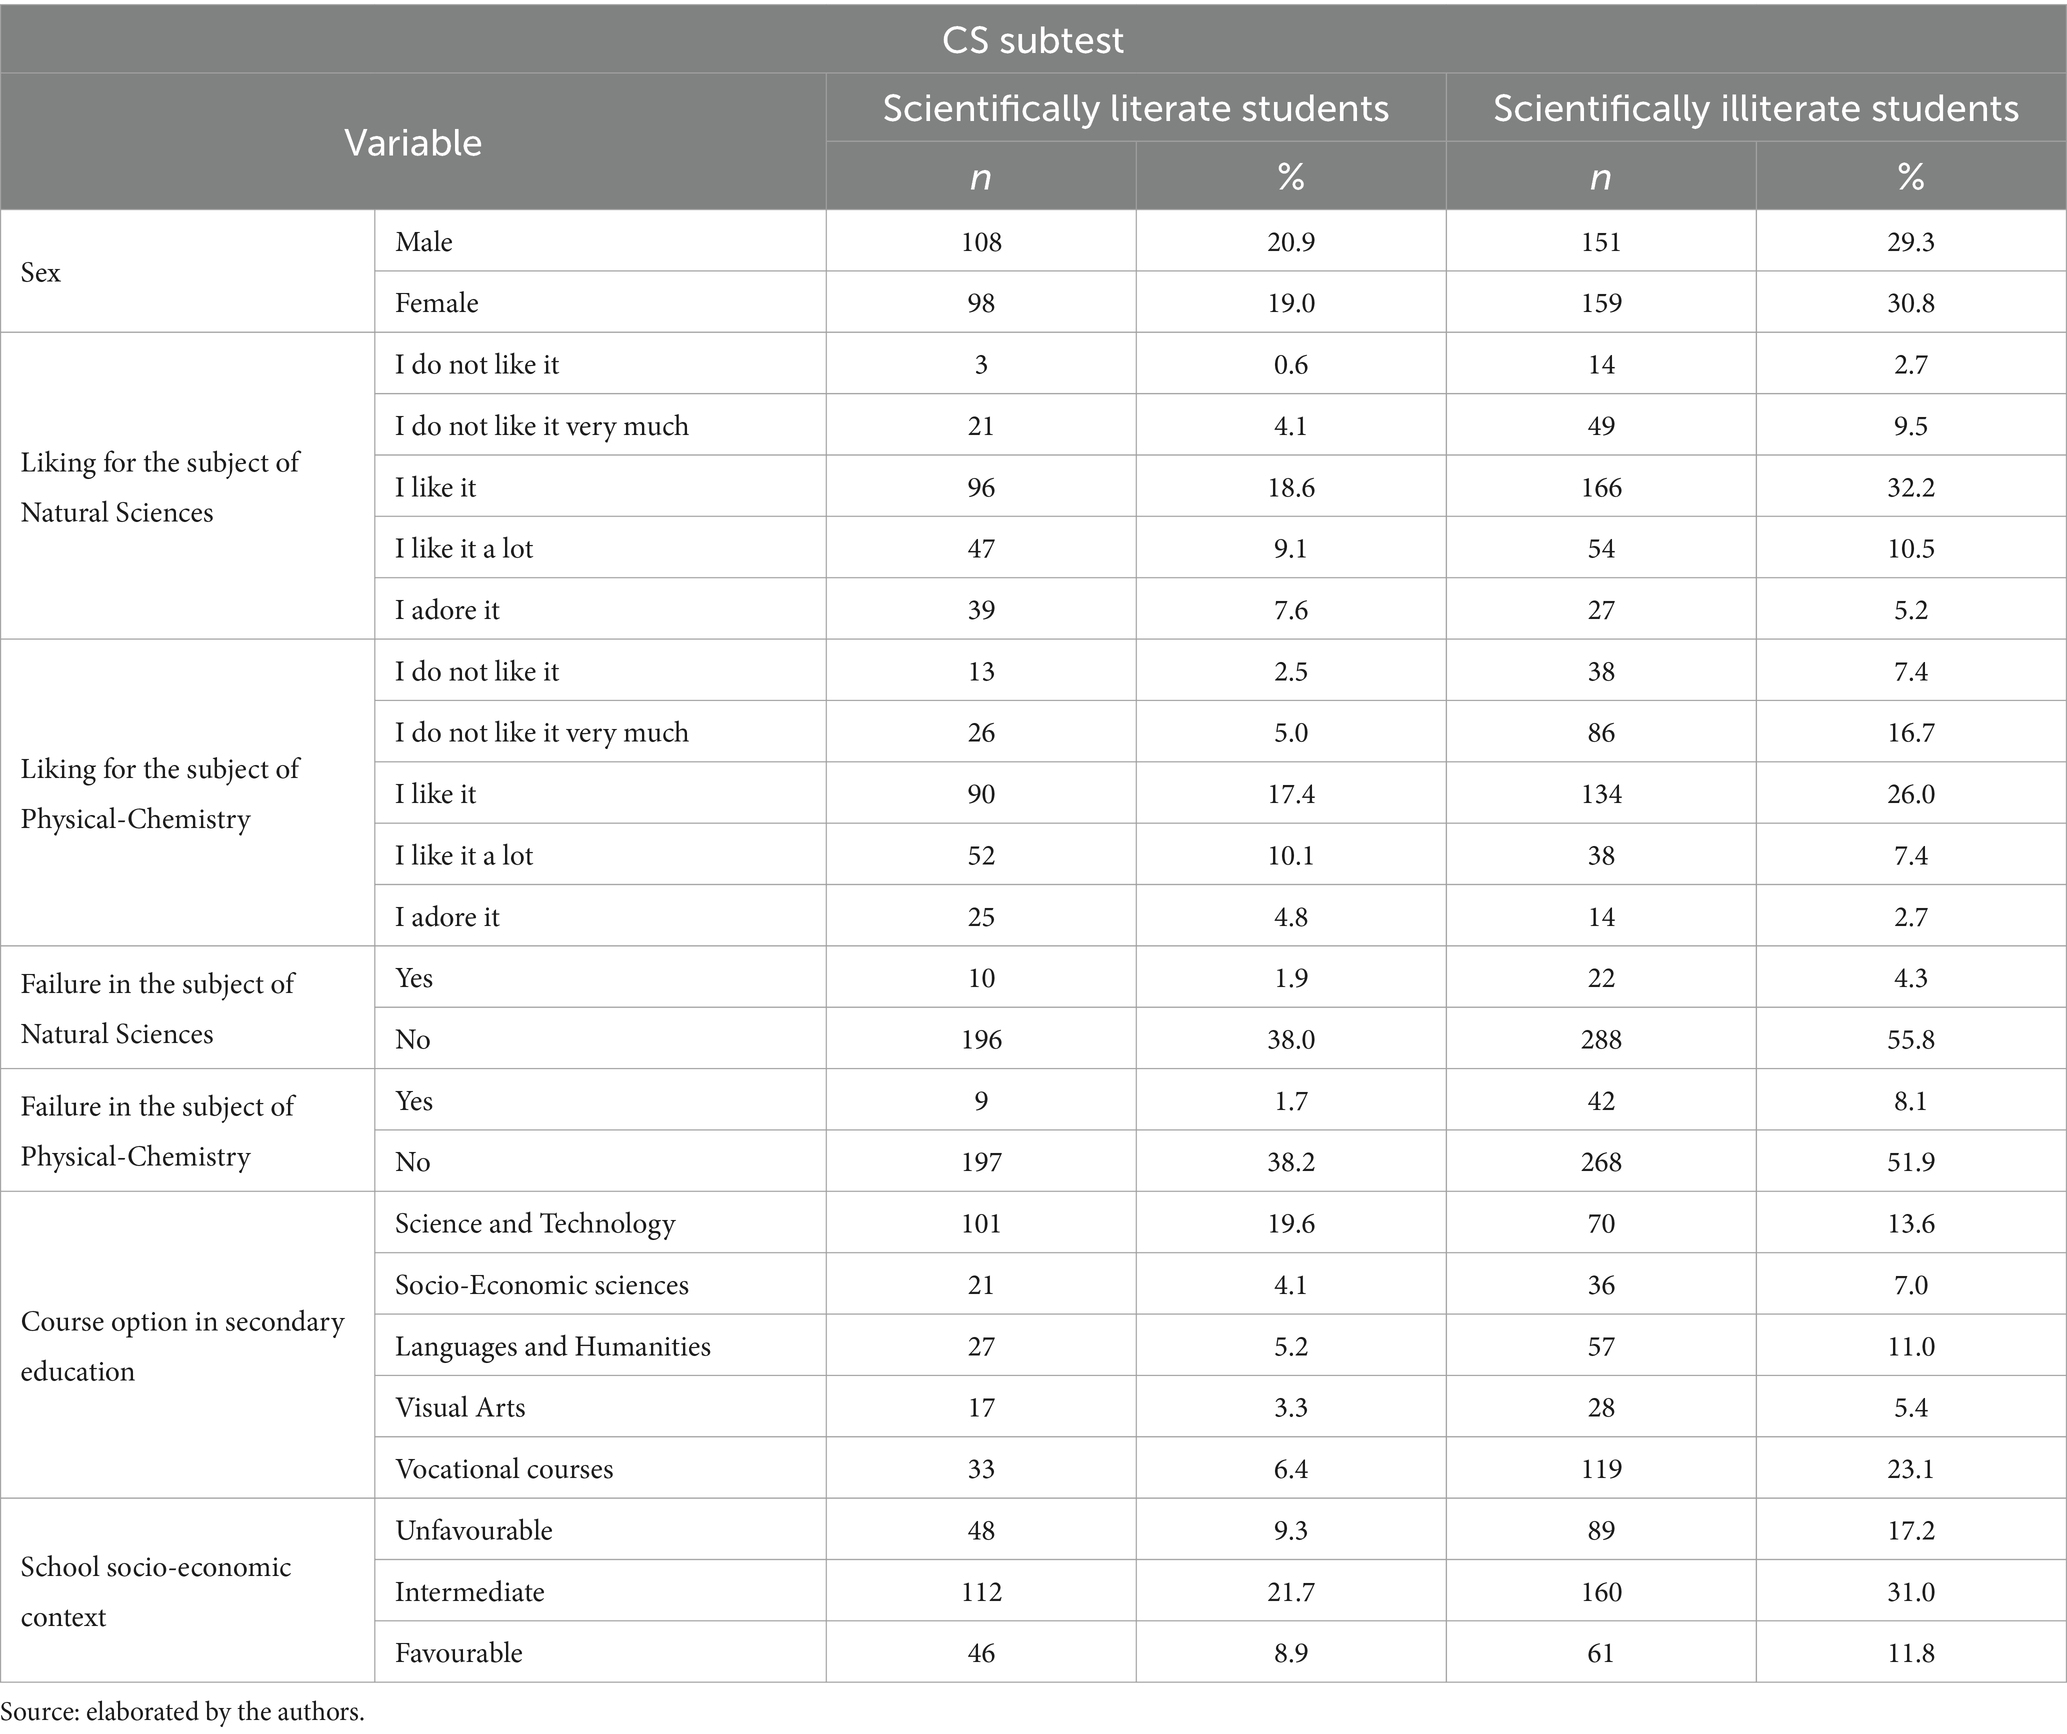
Table 7. Characteristics of scientifically literate students in the Content of Science (CS) subtest.
As for the analysis of the differences between the means of the students’ scientific literacy level in the CS subtest, according to the stipulated independent variables, the results revealed significant differences (p < 0.05) between the means of the groups in the following variables: liking for the subject of Natural Sciences [F(4,511) = 5.76, p < 0.001, d = 0.42]; liking for the subject of Physical-Chemistry [F(4,511) = 9.88, p < 0.001, d = 0.56]; failure in the subject of Physical-Chemistry [t(67.307) = −3.13, p < 0.001, d = −0.24]; opting for a Science and Technology course in secondary education [t(334.123) = 6;27, p < 0.001, d = 0.59]; and opting for Vocational courses in secondary education [t(310.350) = −6.01, p < 0.001, d = −0.56]. No significant differences were found (p > 0.05) in the variables sex, failure in the subject of Natural Sciences and school socio-economic context.
In terms of the variable liking for the subject of Natural Sciences, the mean level of scientific literacy of the students who adore it (M = 2.62, SE = 0.08) was statistically higher than that of the students who do not like it (M = 2.00, SE = 0.15), do not like it very much (M = 2.20, SE = 0.08) and like the subject (M = 2.29, SE = 0.04).
Regarding the variable liking for the subject Physical-Chemistry, the mean scientific literacy level of students who adore it (M = 2.69, SE = 0.11) was statistically higher than that of students who like it (M = 2.32, SE = 0.04), do not like it very much (M = 2.13, SE = 0. 06) and do not like the subject (M = 2.14, SE = 0.08); and the average level of scientific literacy of the students who like it a lot (M = 2.56, SE = 0.07) was statistically higher than that of the students who like it, do not like it very much and do not like the subject.
On the variable of failure in the subject of Physical-Chemistry, on average, students who had never failed (M = 2.36, SE = 0.03) had a statistically higher level of scientific literacy than students who had already failed this subject (M = 2.06, SE = 0.08).
Regarding the variable opting for a Science and Technology course in secondary education, on average, students who opted for this course (M = 2.58, SE = 0.05) had a statistically higher level of scientific literacy than those who did not opt for this course (M = 2.21, SE = 0.03).
With regard to the variable opting for Vocational courses in secondary education, on average, students who did not opt for the course (M = 2.43, SE = 0.03) had a statistically higher level of scientific literacy than those who did (M = 2.08, SE = 0.05).
Finally, regarding the percentage of correct answers, errors and don’t know option marked in the CS subtest items, the average percentages were 44.4, 36.2 and 19.4%, respectively (Table 8).
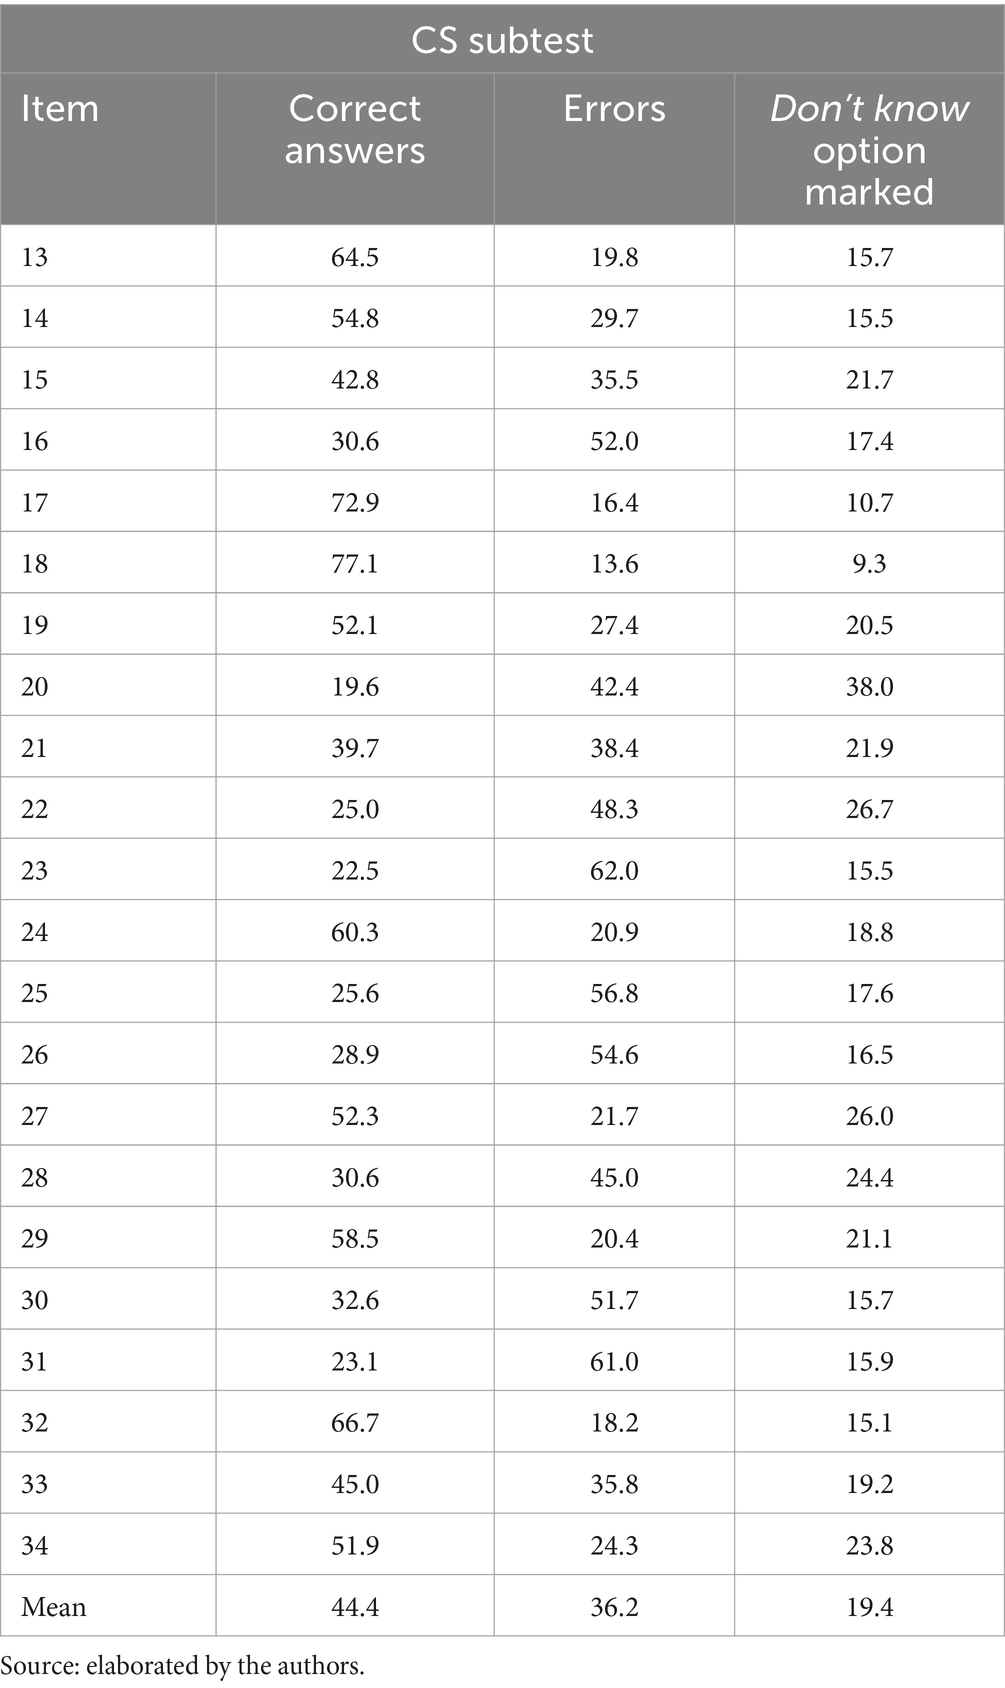
Table 8. Percentage of correct answers, errors and don’t know option marked on the items corresponding to the Content of Science (CS) subtest.
We noticed that the items with the highest percentage of correct answers were items 17 and 18, while the items with the lowest percentage of correct answers were items 20 and 31. Regarding the don’t know option, we noticed that items 20, 22, and 27 had the highest percentage of marks.
4 Discussion
In this section we will discuss the analysis of the results obtained in the study, emphasizing their possible meanings, the comparison with the results of other publications and our position, as authors, on the matter. Accordingly, we have organized the discussion into the following topics: analysis of the overall results of the ALCE application; analysis of the students’ scientific literacy levels in the NOS, ISTS and CS subtests; analysis of the scientific literacy level according to the independent variables; and analysis of the number of correct answers, errors and don’t know option marked.
As with the presentation of the results, we will only briefly discuss the first topic.
4.1 Analysis of the overall results of the Avaliação da Literacia Científica Essencial (ALCE) application
Exploring the results of the ALCE, we found that approximately two thirds of the students were classified as scientifically literate. Although the result is positive, we can see that a considerable number of students were considered scientifically illiterate and that only around 15% of students reached the upper levels, high and very high, of the ALCE scientific literacy scale. Considering that, in Portugal, the 9th grade may represent the last stage in which some students will have contact with subjects that formally promote scientific literacy, this result reveals the need for improvements in the teaching of Natural Sciences and Physical-Chemistry, in order to form scientifically literate citizens at the end of the 3rd cycle of basic education (Coppi et al., 2023c).
Nevertheless, overall, when compared to the results of Portuguese students in the last edition of TIMSS and PISA, although lower percentage-wise, the results of students in ALCE are similar to those published in the latest performance reports of the science tests of the respective international assessments. In TIMSS 2019, while 73% of students reached the intermediate level of performance on the Science test assessment scale, 34% were classified at the high level and only 7% at the advanced level on the scale (Duarte et al., 2020). In PISA 2022, 78.2% of students reached proficiency level 2 in the Science test, with only 4.9% of them reaching levels 5 (4.4%) and 6 (0.5%), being considered top performers (Duarte et al., 2023).
Likewise, comparing the results with studies that aimed to assess the level of scientific literacy of students at the end of the 3rd cycle of basic education, using instruments similar to the ALCE, we note that the results of this study show higher percentages of scientifically literate students (Coppi et al., 2023a).
4.2 Analysis of students’ scientific literacy levels in the Nature of Science (NOS), Impact of Science and Technology on Society (ISTS), and Content of Ccience (CS) subtests
The analysis of the scientific literacy level of Portuguese students by subtest revealed that, while in the NOS and ISTS subtests the majority of students are at the moderate level (44.8 and 49.2%, respectively), in the CS subtest most of them are at the low level of scientific literacy, representing more than half of the students (55.63%). Furthermore, the results show that, according to the instrument’s classification rationale, 70% of the students can be considered scientifically literate in the NOS subtest, 72.9% in the ISTS subtest and only 39.9% in the CS subtest, as they reached at least the moderate level in the respective subtests.
We noticed that, as shown in the overall result, only a minority of students reached the highest levels of the ALCE scientific literacy scale in all three subtests: in the NOS subtest, only 15.5 and 9.7% reached the high and very high levels, respectively; in the ISTS subtest, only 16.3 and 7.4%, respectively; and in the CS subtest, only 4.5 and 0.2%, respectively.
Although Soobard and Rannikmäe (2011) argue that it is normal to expect a low number of students occupying higher levels of scientific literacy in assessments that address all levels, the results found in the CS subtest were somewhat unexpected. Not only because they were very low, but also because the percentage of students who reached the high level was around three times lower than in the other subtests and, in the case of the very high level, approximately 40 times lower.
As shown, the students’ performance was better in the ISTS subtest and worse in the CS subtest. When compared with the results of studies that used the Test of Basic Scientific Literacy, an assessment instrument similar to the ALCE in terms of the format of the items and the types and number of subtests, there is a notable discrepancy. The systematic review of scientific literacy assessment tools carried out by Coppi et al. (2023d) found that all the studies analyzed that used the Test of Basic Scientific Literacy, or adapted and/or simplified versions of this test, identified better student performance in the CS subtest. Similarly, regarding students’ lower performance, the authors identified that some studies pointed to the NOS subtest (Nascimento-Schulze, 2006; Özdem et al., 2010; Rivas et al., 2017; Vizzotto and Mackedanz, 2018; Coppi and Sousa, 2019b) and others to the ISTS subtest (Lima and Garcia, 2015; Coppi and Sousa, 2019a; Vizzotto and Del Pino, 2020).
The difference in performance between the subtests observed in this study indicates that the students’ skills related to the basic fundamentals of science, which consist of the scientific view of the world, research methods and the scientific enterprise, i.e., the nature of science, and understanding the impact of science and technology on society stand out more when compared to those related to the content of science, i.e., using knowledge of the contents of Natural Sciences and Physical-Chemistry to solve problems or explain everyday phenomena.
4.3 Analysis of the scientific literacy level according to the independent variables
The analyses of the students’ scientific literacy levels between the groups, according to the independent variables, revealed statistical differences for several variables in the three subtests. However, we observed that, in most cases, although significant, these differences were not sufficient to classify the groups into different levels of scientific literacy.
In the NOS subtest, for example, the results showed statistical differences between the scientific literacy mean of the groups for the variables liking for the subject of Natural Sciences and liking for the subject of Physical-Chemistry, failure in the subject of Natural Sciences and opting for Vocational courses in secondary education and opting for a Science and Technology course in secondary education. However, only in the variable of liking for the subject of Physical-Chemistry does the difference in the average of the groups reflect a difference in the level of scientific literacy.
Similarly, in the ISTS subtest, the results revealed significant differences between the means of the groups for the variables liking for the subject of Natural Sciences and Physical-Chemistry, failure in the subject of Physical-Chemistry, opting for a Science and Technology course in secondary education, opting for Vocational courses in secondary education and school socio-economic context. However, only in the variable of liking for the subject of Natural Sciences did the significant difference in the average of the groups reproduce a difference in the level of scientific literacy.
In the CS subtest, significant differences were found for the variables liking for the subject of Natural Sciences and liking for the subject of Physical-Chemistry, failure in the subject of Physical-Chemistry, opting for a Science and Technology course in secondary education and opting for Vocational courses in secondary education. However, the statistical differences only reflected a difference in the level of scientific literacy for the variables liking for the subject of Natural Sciences, liking for the subject of Physical-Chemistry and opting for a Science and Technology course in secondary education.
Therefore, regarding the variable of liking for the subject of Natural Sciences, there were statistical differences in the averages of scientific literacy between the groups in the subtests of the ISTS and the CS. In the ISTS subtest, the average of the group of students who do not like the subject is at the low level and that of the other groups is at the moderate level. On the CS subtest, while the mean of the group of students who love the subject was at the moderate level, the mean of the other groups was at the low level of scientific literacy.
As for the variable liking for the subject of Physical-Chemistry, there were significant differences in the NOS and CS subtests. In the NOS subtest, the mean of the group of students who do not like the subject was at the low level and the other groups at the moderate level of scientific literacy. On the other hand, in the CS subtest, the mean of the groups of students who like and adore the subject of Physical-Chemistry was at the moderate level of scientific literacy, while the mean of the other groups was at the low level.
These results are consistent with those published by Pereira (2019), who analyzed, among other factors, the relationship between students’ enjoyment of science and their performance in science subjects, depending on the variables interest and enjoyment in learning and carrying out subject tasks and the enjoyment of reading scientific texts and content. The author found that students’ performance in science subjects improved in proportion to the extent to which they demonstrated these behaviors.
The study by Silva et al. (2018) supports the same idea. Analyzing the relationship between the variables liking for the subject of Chemistry and students’ difficulty with the subject, the authors showed that both students’ positive and negative relationship with the subject are related to their learning. This means that liking for the subject of Chemistry facilitates the learning process, while disliking the subject makes it difficult to understand.
Considering that student interest is directly related to the involvement and time spent studying a subject and the positive impact of student motivation on their performance (Cavalcanti, 2009; Kpolovie et al., 2014; Oliveira, 2021), students who like, like a lot and adore the subjects of Natural Sciences and Physical-Chemistry are expected to be more dedicated and put more effort into studying these subjects and, consequently, have higher levels of scientific literacy than students who do not like or like these subjects very little.
Finally, in the variable of opting for a Science and Technology course in secondary education, a statistical difference was identified only for the CS subtest. While the mean level of scientific literacy of the group of students who opted for this course was at the moderate level, the mean of the group who did not opt for this course was at the low level of scientific literacy.
Considering that the statistical differences that distinguished the students’ scientific literacy levels in the variable opting for a Science and Technology course in secondary education were only observed in the CS subtest and that this subtest also showed statistical and scientific literacy level differences for the variables liking for the subject of Natural Sciences and liking for the subject of Physical-Chemistry, it can be inferred that students who are thinking of choosing to study Science and Technology in secondary education are more interested in the subjects that make up this area and perform better in this subtest and also in the ALCE overall.
These results reinforce those previously discussed regarding the variables liking for the subject of Natural Sciences and liking for the subject of Physical-Chemistry, and also those published by Noronha and Ambiel (2009), which showed a relationship between the variables school performance and professional interests in the sample studied.
They are also consistent with the results of Portuguese students in the PISA 2018 and 2022 assessments. In PISA 2018, the Portuguese report revealed that 48% of boys and 15% of girls with high performance in Science intend to pursue a profession in Science and Engineering (Lourenço et al., 2019). In PISA 2022, the results by type of course revealed that students who attended Scientific-Humanistic courses obtained better results when compared to those who attended other courses (Duarte et al., 2023).
When compared with the studies by Nascimento-Schulze et al. (2006), De Camargo et al. (2011), and Vizzotto and Del Pino (2020), the results of the present study reinforce those identified by the authors, that interest in the scientific-technological context is one of the factors that best explains the difference in student performance in scientific literacy assessments.
4.4 Analysis of the number of correct answers, errors and don’t know option marked
Regarding the number of correct answers per item, we found that the NOS and ISTS subtests had the highest percentage of items with a number of correct answers above 50%, surpassing the sum of errors and the don’t know option marked, both with four of the six items that make up the subtests (66.7%), although the percentage of correct answers in the ISTS subtest items was higher. In the CS subtest, only 10 of the 34 items (29.4%) achieved this rate.
We also noticed that in the ALCE, only five items had an accuracy rate greater than 70% (items 3, 4, 7, 17 and 18) and six had a rate of less than 30% (items 20, 22, 23, 25, 26 and 31). Of the items with accuracy rate above 70%, items 3 and 4 are part of the NOS subtest and are related to the stages of scientific research, item 7 belongs to the ISTS subtest and is associated with the technical-scientific revolution and items 17 and 18, from the CS subtest, refer to the area of Geology (external geodynamics) and Chemistry (changes in the physical state of matter), respectively.
As for the items that obtained correct answers below 30%, we can see that they all belong to the CS subtest. Items 20 and 22 belong to Chemistry (substances and mixtures and chemical reactions, respectively), items 23, 25, and 26 to Physics (energy, force and gravitational force, respectively) and item 31 to Biology (human physiology).
Considering that the CS subtest is made up of three items from the Natural Sciences area (items 13, 14 and 15), two from Geology (items 16 and 17), five from Chemistry (items 18 to 22), four from Physics (items 23 to 26) and six from Biology (items 27 to 34), it is clear that the greatest difficulties are associated with items from the Physics area, followed by items from the Chemistry area. These results reinforce those presented by the Portuguese TIMSS 2019 report, which revealed that the Physics and Chemistry content areas had the lowest results, significantly below the overall average on the TIMSS science scale (Duarte et al., 2020).
These findings also corroborate the results of the studies by Rivas et al. (2017) and Vizzotto et al. (2020) which, applying a translated and simplified version of the Test of Basic Scientific Literacy, respectively, in the Brazilian context, showed that Physics was the area that obtained the lowest performance from the student respondents. According to Vizzotto et al. (2020), one of the hypotheses to explain these results is the possibility that science teaching has had a prevalent focus on Biology and Chemistry topics. The authors also claim that, in Brazil, Physics content is the least present in the Science curriculum in basic education and that this may be associated with the historical evolution of the subject, in which Biology content predominated due to the training of teachers to work at this level of education. Rivas et al. (2017) state that the main misconceptions in the area of Physics show that the majority of students did not obtain significant learning of this content in basic education, exemplifying that “more than half of the respondents do not understand Newton’s 1st Law, the fundamental interactions of nature and that we are exposed by environmental radiation” (p. 64).
Regarding the results for the percentage of don’t know answers per subtest, we observed that, on average, the CS subtest had the highest percentage (M = 19.4%, SD = 6.1), followed by the NOS subtest (M = 15.5%, SD = 4.4) and the ISTS subtest (M = 15.3%, SD = 2.2). When analyzed individually, 10 items had a percentage of more than 20% of the don’t know option marked (items 5, 15, 19, 20, 22, 27, 28, and 29), with item 20 having the highest percentage (38.0%) and item 18 the lowest (9.3%).
A qualitative analysis of this set of items (Table 9) reveals that item 5 addresses the topic of scientific laws and theories and is the only representative of the NOS subtest, while the other seven make up the CS subtest and correspond to the following topics: universe and solar system; atoms and chemical elements; substances and mixtures; chemical reactions; ecology; evolution; and cytology. It can therefore be seen that the items with the highest percentage of don’t know option marked belong to the areas of Chemistry (items 19, 20, and 22) and Biology (items 27, 28, and 29).
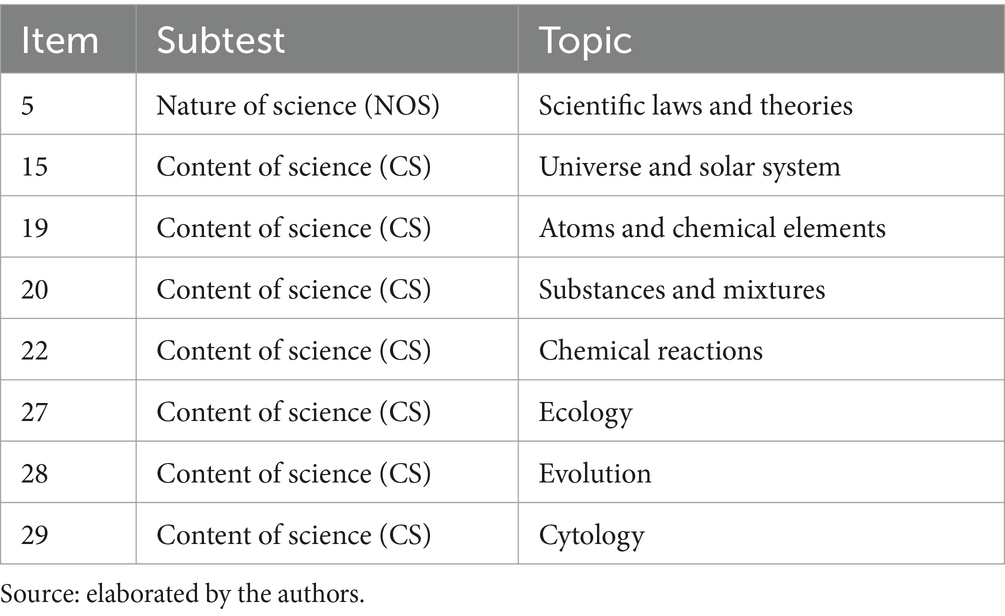
Table 9. Subtest and topic to which the items that obtained a percentage higher than 20% of the don’t know option marked belong.
These results reinforce those presented by Vizzotto and Mackedanz (2018). The authors applied the simplified version of the Test of Basic Scientific Literacy to students in the 9th grade of Brazilian basic school and found that, of the 45 items that make up the instrument, six had more than a third of the answers marked as don’t know. Of these, three items belong to the CS subtest and assess skills in the area of Physics, two relate to the ISTS subtest and deal with the consequences of the use of individual technological equipment and government decisions related to science and technology, and one item is part of the NOS subtest and deals with ethics in scientific research.
Nevertheless, they differ from those presented by Rivas et al. (2017), who applied the Test of Basic Scientific Literacy to beginners and graduates of a higher education Biology course and found that the subtest with the highest number of don’t know answers was the ISTS, followed by the NOS and CS subtests. This difference may be associated with the fact that the students probably have greater skills related to content of science, since they have finished secondary school and, some of them, higher education.
When we analyse the items where the sum of incorrect answers and don’t know option marked, accounting for zero points in the assessment, exceeds the percentage of correct answers, we find that approximately one third of the items in each subtest fall into this situation, namely: items 1 (70. 2%) and 6 (58. 1%) of the NOS subtest; items 8 (64. 7%) and 11 (60. 1%) of the ISTS subtest; and items 15 (57.2%), 16 (69.4%), 20 (80.4%), 21 (60.3%), 22 (75.0%), 23 (77.5%), 25 (74.4%), 26 (71.1%), 28 (69.4%), 30 (67.4%), 31 (76.9%), and 33 (55.0%) of the CS subtest. As items 15, 20, 22, 23, 25, 26, 28, and 31 have already been discussed, we will only deal with the remaining items below.
Items 1 and 6 relate, respectively, to the stages of the scientific method and the credibility of scientific research. Items 8 and 11 are associated with the potential and limits of science and its technological applications in society. In the case of the items in the CS subtest, item 16 belongs to the area of Geology (internal geodynamics), and is related to the theory of continental drift; item 21 is from the area of Physical-Chemistry, dealing with the physical states of matter; and items 30 and 33, both from the area of Biology, are related to human reproduction.
These results support the fact that the students’ lowest performance in the ALCE was in the CS subtest. We found that the students’ greatest difficulties are related to the subject of Physical-Chemistry, given that more than a third of the items (37.5%) in the above-mentioned situation refer to subjects from this subject, half of them from Physics and half from Chemistry. We also point out the low performance of items from the Natural Sciences subject, represented by items from the Biology and Geology areas, as a result of the fact that almost a third (31.3%) of the CS items from these areas fall into the same situation.
The results also corroborate those published in the last two PISA reports available, 2018 and 2022, regarding the Science test. According to the reports, the majority of students have intermediate-level skills and a minority have skills in applying knowledge of Biology, Chemistry, Physics and Earth Sciences and characterizing the concepts of these areas in a plurality of contexts (Lourenço et al., 2019; Duarte et al., 2023).
5 Conclusion
According to the objective that guided the study presented in this article, the data gathered allows us to answer the following questions: (1) What is the students’ scientific literacy level, overall and by subtest? (2) How many students can be considered scientifically literate, overall and by subtest? (3) Are there statistical differences between the means of the students’ scientific literacy level per subtest when compared according to the independent variables sex, liking for the subject of Natural Sciences and liking for the subject of Physical-Chemistry, failure in the subject of Natural Sciences and failure in the subject of Physical-Chemistry, course option in secondary education and school socio-economic context? (4) Which subtests do students have the greatest ease and difficulty doing?
The results revealed that, in the overall analysis, the majority of students are at the moderate level of scientific literacy (49.4%). According to the ALCE classification criteria, 64.1% of the students were considered scientifically literate, as they reached at least the moderate level of scientific literacy in each of the three subtests. Although the results are positive, the study shows that more than a third of the students (35.9%) were not classified as scientifically literate and that only 14.4% of the students reached the upper levels of the scale, high and very high.
When analysed by subtest, it was evident that while in the NOS and ISTS subtests the majority of students were at the moderate level (44.8 and 49.2% respectively), in the CS subtest the majority (55.6%) were at the low level of scientific literacy. According to the classification criteria, 70.0, 72.9 and 39.9% of the students were classified as scientifically literate in the NOS, ISTS and CS subtests, respectively. It is noticeable that the greatest difficulties encountered by the students relate to the CS subtest, specifically in the areas of Biology, Physics and Chemistry.
These results indicate that the students who answered the ALCE have more skills related to understanding the scientific enterprise and the consequences of using scientific-technological knowledge in society than to using the specific skills of the Natural Sciences and Physical-Chemistry subjects, or to solving problems and explaining everyday phenomena.
Regarding the analysis of the level of scientific literacy by subtest, according to the independent variables under consideration, statistical differences were observed reflecting different levels of classification of students’ scientific literacy in the variable liking for the subject of Physical-Chemistry, for the NOS subtest; in the variable liking for the subject of Natural Sciences, for the ISTS subtest; and in the variables liking for the subjects of Natural Sciences and liking for the subject of Physical-Chemistry and opting for a Science and Technology course in secondary education, for the CS subtest. The findings reinforce the idea that students’ scientific literacy might in some way be associated with their liking for the subjects of Natural Sciences and Physical-Chemistry and their expectations of the profession they wish to pursue in the future, in this case based on their choice of Science and Technology course in secondary education.
We highlight, however, that the results of the inferential analyses also show evidence of a possible influence of the variables failure in the subject of Natural Sciences and failure in the subject of Physical-Chemistry, opting for Vocational courses in secondary education and school socio-economic context on the students’ scientific literacy level, expressed in the statistical differences observed in the average scientific literacy level of the students in the different groups. Although the differences did not place the students in different classification levels, they were significant. Therefore, we suggest that future studies consider these variables in the analysis.
Furthermore, we would like to emphasise that the study carried out gathered information exclusively from students in schools in mainland Portugal, and did not take into account the administrative regions of the Madeira Archipelago and the Azores Archipelago. We recommend that future research use the ALCE to assess the scientific literacy level of students at the end of the 3rd cycle of basic education in different contexts and regions, so that the results can be compared and new data can be used to improve science education in Portugal.
Finally, we point out that the results of this study cannot be generalised to the Portuguese population, as it is not a representative sample. Nevertheless, we believe that the data presented here contributes to reflection on the development of scientific literacy among students in this cycle of education and to the production of information that makes it possible to establish comparisons and correspondences between different studies, offering opportunities for further studies and, consequently, fostering the advancement of science in this area of research.
Data availability statement
The raw data supporting the conclusions of this article will be made available by the authors, without undue reservation.
Ethics statement
The studies involving humans were approved by Directorate General for Innovation and Curriculum Development (DGICD), through the School Survey Monitoring System (MIME), under registration no. 0740900001. The studies were conducted in accordance with the local legislation and institutional requirements. Written informed consent for participation in this study was provided by the participants’ legal guardians/next of kin.
Author contributions
MCo: Conceptualization, Data curation, Formal analysis, Funding acquisition, Investigation, Methodology, Project administration, Resources, Software, Validation, Writing – original draft, Writing – review & editing. IF: Conceptualization, Funding acquisition, Methodology, Project administration, Resources, Software, Supervision, Visualization, Writing – original draft, Writing – review & editing. MCi: Conceptualization, Funding acquisition, Methodology, Project administration, Resources, Software, Supervision, Visualization, Writing – original draft, Writing – review & editing.
Funding
The author(s) declare that financial support was received for the research, authorship, and/or publication of this article. This work was funded by national funds through the FCT – Foundation for Science and Technology – IP, within the scope of the Research Grant with reference UI/BD/151034/2021 and DOI 10.54499/UI/BD/151034/2021 and the project UIDB/04312/2020.
Conflict of interest
The authors declare that the research was conducted in the absence of any commercial or financial relationships that could be construed as a potential conflict of interest.
Publisher’s note
All claims expressed in this article are solely those of the authors and do not necessarily represent those of their affiliated organizations, or those of the publisher, the editors and the reviewers. Any product that may be evaluated in this article, or claim that may be made by its manufacturer, is not guaranteed or endorsed by the publisher.
Abbreviations
ALCE, Avaliação da Literacia Científica Essencial; ANOVA, Analysis of variance; CS, Content of Science; ISTS, Impact of science and technology on society; NOS, Nature of science; OECD, Organisation for economic co-operation and development; PISA, Programme for international student assessment; TIMSS, Trends in international mathematics and science study.
References
Cavalcanti, M. M. P. (2009). A relação entre motivação para aprender, percepção do clima de sala de aula para criatividade e desempenho escolar de alunos do 5° ano do ensino fundamental [Dissertação de Mestrado, Universidade de Brasília]. Available at: https://repositorio.unb.br/handle/10482/4399 (Accessed May 02, 2024).
Coppi, M., Fialho, I., and Cid, M. (2023a). Assessing portuguese elementary school students’ scientific literacy: application of the ALCE instrument. Social Sciences, 12: 374. doi: 10.3390/socsci12070374
Coppi, M., Fialho, I., and Cid, M. (2023b). Developing a scientific literacy assessment instrument for Portuguese 3rd cycle students. Education Sciences. 13:941. doi: 10.3390/educsci13090941
Coppi, M., Fialho, I., and Cid, M. (2023c). Scientific literacy and the science curriculum reorganisation in Portugal. Educ. Realidade 48, 1–18. doi: 10.1590/2175-6236129450vs02
Coppi, M., Fialho, I., and Cid, M. (2023d). Scientific literacy assessment instruments: a systematic literature review. Educ. Rev. 39:e37523. doi: 10.1590/0102-4698237523-T
Coppi, M., and Sousa, C. P. (2019a). Estudo da alfabetização científica de alunos do ensino médio de um colégio de São Paulo. Rev. Eletrôn. Científica Ensino Interdis. 5, 537–544. doi: 10.21920/recei72019515537544
Coppi, M., and Sousa, C. P. (2019b). Estudo da alfabetização científica dos alunos do 9° ano do ensino fundamental de um Colégio Particular se São Paulo. Debates Em Educ. 11, 169–185. doi: 10.28998/2175-6600.2019v11n23p169-185
Camargo, A. N. B.De, Pilar, F. D., Ribeiro, M. E. M., Fantinel, M., and Ramos, M. G. (2011). Alfabetização científica: a evolução ao longo da formação de licenciandos ingressantes, concluintes e de professores de química. Momento - Diálogos Em Educ., 20, 19–29.
DGE (2018a). Aprendizagens essenciais, articulação com o perfil dos alunos - Ciências Naturais - 7.o ano - 3.o ciclo do Ensino Básico. Available at: http://www.dge.mec.pt/sites/default/files/Curriculo/Aprendizagens_Essenciais/3_ciclo/ciencias_naturais_3c_7a_ff.pdf (Accessed March 07, 2024).
DGE (2018b). Aprendizagens essenciais, articulação com o perfil dos alunos - Ciências Naturais - 8.o ano - 3.o ciclo do Ensino Básico. Available at: http://www.dge.mec.pt/sites/default/files/Curriculo/Aprendizagens_Essenciais/3_ciclo/ciencias_naturais_3c_8a_ff.pdf (Accessed March 07, 2024).
DGE (2018c). Aprendizagens essenciais, articulação com o perfil dos alunos - Ciências Naturais - 9.o ano - 3.o ciclo do Ensino Básico. Available at: http://www.dge.mec.pt/sites/default/files/Curriculo/Aprendizagens_Essenciais/3_ciclo/ciencias_naturais_3c_9a_ff.pdf (Accessed March 07, 2024).
DGE (2018d). Aprendizagens essenciais, articulação com o perfil dos alunos - Físico-química - 7.o ano - 3.o ciclo do Ensino Básico. Available at: http://www.dge.mec.pt/sites/default/files/Curriculo/Aprendizagens_Essenciais/3_ciclo/fisico-quimica_3c_7a_ff.pdf (Accessed March 07, 2024).
DGE (2018e). Aprendizagens essenciais, articulação com o perfil dos alunos - Físico-química - 8.o ano - 3.o ciclo do Ensino Básico. Available at: http://www.dge.mec.pt/sites/default/files/Curriculo/Aprendizagens_Essenciais/3_ciclo/fisico-quimica_3c_8a_ff.pdf (Accessed March 07, 2024).
DGE (2018f). Aprendizagens essenciais, articulação com o perfil dos alunos - Físico-química - 9.o ano - 3.o ciclo do Ensino Básico. Available at: http://www.dge.mec.pt/sites/default/files/Curriculo/Aprendizagens_Essenciais/3_ciclo/fisico-quimica_3c_9a.pdf (Accessed March 07, 2024).
Duarte, A., Nunes, A., Tavares, J., Mota, M., and Venâncio, T. (2020). TIMSS 2019 - Portugal. Resultados a matemática e a ciências - 8.o ano - Volume 2. IAVE.
Duarte, A., Nunes, A., Vasconcelos, A., Mota, M., Cabral, M., and Rodrigues, M. (2023). Pisa 2022 - Portugal. Relatório Nacional. IAVE.
Kpolovie, P. J., Joe, A. I., and Okoto, T. (2014). Academic achievement prediction: role of interest in learning and attitude towards school. Int. J. Human. Soc. Sci. Educ. 1, 73–100.
Lima, A. M. D. L., and Garcia, R. N. (2015). A alfabetização científica de estudantes de licenciatura em ciências biológicas: um estudo de caso no contexto da formação inicial de professores. Atas do X ENPEC, 1–8. Universidade Federal de Santa Catarina. https://www.abrapec.com/enpec/x-enpec/anais2015/listaresumos.htm
Lourenço, V., Duarte, A., Nunes, A., Amaral, A., Gonçalves, C., Mota, M., et al. (2019). PISA 2018 – Portugal. Relatório nacional. IAVE. Available at: http://www.pnl2027.gov.pt/np4/file/1205/RELATORIO_NACIONAL_PISA2018_IAVE.pdf (Accessed May 05, 2024).
Marôco, J., Gonçalves, C., Lourenço, V., and Mendes, R. (2016). TIMSS 2015 - Portugal. Volume I: desempenhos em matemática e em ciências. IAVE.
Martins, G. O., Gomes, C. A. S., Brocardo, J. M. L., Pedroso, J. V., Carrillo, J. L. A., Silva, L. M. U., et al. (2017). Perfil dos alunos à saída da escolaridade obrigatória. Ministério da Educação e Ciência - DGE.
Nascimento-Schulze, C. M. (2006). Um estudo sobre alfabetização científica com jovens catarinenses. Psicol. Teoria Prática 8, 95–106.
Nascimento-Schulze, C. M., Camargo, B., and Wachelke, J. (2006). Alfabetização científica e representações sociais de estudantes de ensino médio sobre ciência e tecnologia. Arquivos Brasileiros Psicol. 58, 24–37.
Noronha, A. P. P., and Ambiel, R. A. M. (2009). Relações entre desempenho escolar e interesses profissionais de estudantes do ensino médio - Desempenho escolar e interesses profissionais. Psychologica 50, 277–294. doi: 10.14195/1647-8606_50_14
Oliveira, C. F. (2021). Práticas pedagógicas e desempenho escolar no Brasil [Dissertação de Mestrado. Universidade Federal de Viçosa]. Available at: https://poseconomia.ufv.br/wp-content/uploads/2022/02/texto-completo-Carmem.pdf (Accessed May 13, 2024).
Özdem, Y., Çavaş, P., Çavaş, B., Çakıroğlu, J., and Ertepınar, H. (2010). An investigation of elementary students’ scientific literacy levels. J. Balt. Sci. Educ. 9, 6–19.
Pereira, L. R. (2019). Instrução, empenho e desempenho dos alunos em ciências. Dissertação de Mestrado, Universidade do Minho, Braga, Portugal.
Rivas, M. I. E., Moço, M. C. D. Q., and Junqueira, H. (2017). Avaliação do nível de alfabetização científica assessment of the level of scientific literacy. Rev. Acad. Licencia Acturas 5, 58–65. doi: 10.55602/rlic.v5i2.158
Silva, R. B., Mendes, J. F., Carvalho, T. M. Da S., and Malta, S. H. Da S. (2018). O gostar do aluno e sua dificuldade em química. Anais Do Anais Do V Congresso Nacional de Educação - CONEDU.
Soobard, R., and Rannikmäe, M. (2011). Assessing student’s level of scientific literacy using interdisciplinary scenarios. Sci. Educ. Int. 22, 133–144.
Vizzotto, P. A., and Del Pino, J. C. (2020). Avaliação do nível de alfabetização científica de acadêmicos ingressantes e concluintes de cursos de licenciatura. Res. Soc. Dev. 9:e140953349. doi: 10.33448/rsd-v9i5.3349
Vizzotto, P. A., and Mackedanz, L. F. (2018). Teste de alfabetização científica básica: processo de redução e validação do instrumento na língua portuguesa. Rev. Prática Docente 3, 575–594. doi: 10.23926/rpd.2526-2149.2018.v3.n2.p575-594.id251
Keywords: ALCE, basic education, content of science, impact of science and technology on society, nature of science, science education, scientific literacy assessment
Citation: Coppi M, Fialho I and Cid M (2024) Assessing scientific literacy: a study with 9th grade students in Portugal. Front. Educ. 9:1433919. doi: 10.3389/feduc.2024.1433919
Edited by:
Iztok Devetak, University of Ljubljana, SloveniaReviewed by:
Rachel Mamlok-Naaman, Weizmann Institute of Science, IsraelMiha Slapničar, University of Ljubljana, Slovenia
Copyright © 2024 Coppi, Fialho and Cid. This is an open-access article distributed under the terms of the Creative Commons Attribution License (CC BY). The use, distribution or reproduction in other forums is permitted, provided the original author(s) and the copyright owner(s) are credited and that the original publication in this journal is cited, in accordance with accepted academic practice. No use, distribution or reproduction is permitted which does not comply with these terms.
*Correspondence: Marcelo Coppi, bWNvcHBpQHVldm9yYS5wdA==