 Cloneria Nyambali Jatileni
 Sari Havu-Nuutinen
 Susanna Pöntinen
 Jari Kukkonen
94% of researchers rate our articles as excellent or good
Learn more about the work of our research integrity team to safeguard the quality of each article we publish.
Find out more
ORIGINAL RESEARCH article
Front. Educ., 03 July 2024
Sec. Digital Education
Volume 9 - 2024 | https://doi.org/10.3389/feduc.2024.1425779
Students’ use of personal mobile devices (PMDs), including smartphones, tablets, and laptops, in mathematics classrooms globally has become feasible due to the implementation of the bring your own device (BYOD) initiatives and policies in schools. Students’ academic use of PMDs in mathematics learning has been associated with increased motivation, enjoyment, and enhanced performance. While debates continue worldwide on the bans of PMDs in schools, it is noteworthy that students in Namibian basic education are not permitted to use PMDs in schools. This study employed a comparative nonexperimental quantitative research design to assess the perceived usefulness (PU) and behavioural intention (BI) to use PMDs in mathematics classrooms among 500 Namibian students and 209 teachers. The study employed a volunteer purposeful sampling method to select participating students and teachers from government schools in the Omusati and Khomas regions. Student selection was based on self-selection from full-class mathematics groups. Similarly, the study utilised volunteer purposeful sampling to recruit grades 4–12 mathematics teachers. Utilising structural equation modelling, the findings revealed that students expressed more positive ratings for PMD usefulness and intention than did teachers. Furthermore, PU significantly predicted students’ BI to learn mathematics with PMDs in school. Multigroup confirmatory factor analysis supported configural, metric, and scalar invariance in PU and BI factor structures across both participant groups. However, when students’ latent means of PU and BI are set to 0, the teachers’ latent mean parameter estimates are negative, suggesting potential disparities. Teachers should recognise and leverage students’ positive perceptions of PMDs to enhance motivation and engagement in mathematics learning. Simultaneously, ensuring consistent assessment across participant groups is essential, while addressing teachers’ PMDs reservations through professional development and support remains crucial.
The integration of students’ personal mobile devices (PMDs) in education, specifically through bring your own device (BYOD) policies, has received significant attention in recent literature. PMDs, such as smartphones, tablets, and laptops, are incorporated into school systems through mobile learning and BYOD initiatives (Musarurwa et al., 2019; Supriyadi and Kuncoro, 2023). BYOD policies regulate the use of PMDs for mathematics learning in schools (Arifjanova, 2022; Jatileni et al., 2023), encouraging students to bring their devices to class for seamless integration into daily mathematics instruction (Supriyadi and Kuncoro, 2023). These policies also enhance safety by teaching students how to protect the BYOD environment from risks (Halim et al., 2023). This advancement is crucial, as mobile learning and BYOD are already shaping the future of mathematics education (Supriyadi and Kuncoro, 2023).
The emergence of students’ PMDs in schools has created both educational opportunities and challenges (Dias and Victor, 2022). Scholars have highlighted the benefits of PMDs, such as personalised and ubiquitous access to educational resources (Cóndor-Herrera and Ramos-Galarza, 2021; Zogheib and Daniela, 2021; Budiarto et al., 2024). PMDs significantly enhance mathematics teaching and learning, allowing students to access various mathematics applications, interactive eBooks, and online resources (Curto Prieto et al., 2019; Umboh et al., 2021; Supriyadi and Kuncoro, 2023; Yanuarto et al., 2023). However, concerns about equity, security, and pedagogical integration have also arisen (Kaliisa and Michelle, 2019; Musarurwa et al., 2019; Nikolopoulou, 2020). This has led researchers to explore the complexities of PMD use in mathematics education and the implementation of BYOD policies (Attard and Holmes, 2019; Murray et al., 2019). Arifjanova (2022) and Musarurwa et al. (2019) argue that BYOD policies should be mandatory in schools allowing PMDs, to regulate their use. This study critically assesses the integration of PMDs in mathematics classrooms and the implementation of BYOD policies in schools.
Over the past years, Namibia has been reporting difficulties in students’ learning of mathematics and poor performance (Chirimbana et al., 2022; Hamukwaya and Ruttenberg-Rozen, 2022). The poor performance in mathematics has been associated with lower matriculation levels (Mutambara and Bayaga, 2020). Nonetheless, PMDs use in mathematics learning has been shown to make students more enthusiastic and active in the learning process, leading to improved learning outcomes among South African and Indonesian students (Mutambara and Bayaga, 2020, 2021; Umboh et al., 2021). However, the Ministry of Education Arts and Culture in Namibia has not been able to provide mobile devices to K-12 students to support the integration of technology in mathematics teaching and learning (Jatileni et al., 2023). Yet, the Ministry of Education Arts and Culture in Namibia disallows PMDs use in schools despite students and teachers being ready for their integration (Osakwe et al., 2017; Jatileni et al., 2023). The PMDs are banned in schools due to negative perceptions, even though they are used in higher education without formal BYOD policies (Musarurwa et al., 2019). There is possibly an unwarranted tendency to ban students use of PMDs in schools worldwide over negative perceptions. For example, the England’s Department for Education (DfE) has prohibited mobile phone use during the school day, citing minimising disruption and improving behaviour, sparking debates on PMDs’ effectiveness (Department for Education [DfE], 2023; Kemp et al., 2024). Conversely, Kenya has issued over one million Windows mobile devices to students and teachers in public primary schools to boost learning motivation through technology integration, serving as a good example in Africa (Fundi et al., 2024).
Earlier studies on PMD use in schools’ subjects such as science, technology, engineering, and mathematics (STEM) within the African context reported a lack of research. Mutambara and Bayaga (2021) asserted that there is limited knowledge about the perceptions and intentions of high school STEM students, their teachers and parents concerning the use of PMDs, especially in rural school settings. Prior research on PMDs use in education predominantly focused on the opinions of tertiary institutions’ students and lecturers in developed countries, providing scant information about school STEM students’ and teachers’ opinions (Mutambara and Bayaga, 2020). The integration of students’ PMDs in Namibian education is least assessed and even the previous studies on this topic carried a general assessment without focusing on mathematics teaching and learning. While Supriyadi and Kuncoro (2023) advise teachers and students to keep abreast of the latest developments in the teaching and learning of mathematics, no study in Namibia assessed the variation between teachers’ and students’ perceptions and intentions on PMDs use in mathematics.
To contribute to research in this area, this study compares Namibian students’ and teachers’ perceptions and intentions regarding PMDs’ use in learning mathematics through a BYOD policy implementation in schools. We compared students’ and teachers’ perceived usefulness (PU) and behavioural intentions (BI) regarding PMDs use in mathematics classrooms. The relationship between PU and BI variables in the context of students’ PMDs use for mathematics learning has been explored in research. Previous studies (Camilleri and Camilleri, 2017; Dubey and Sahu, 2021; Ortiz-López et al., 2024) have found that students’ and teachers’ PU significantly influence their adoption intention for technology-based education. PU plays a crucial role in shaping students’ and teachers’ BI to use PMDs for mathematics learning. Generally, there is a direct proportional relationship between PU and BI in the context of technology adoption (Wu and Du, 2012; Al-Adwan et al., 2023). Thus, when students and teachers perceive that PMDs are useful for mathematics learning and pedagogical needs, they are more likely to express a positive intention to use them. Conversely, if students and teachers perceive PMDs as less useful (low PU), their intention to use them (BI) may decrease. Moreover, PU is generally a stronger predictor of BI than perceived ease of use (PEOU) in the technology acceptance model (TAM) (Davis, 1989; Al-Adwan et al., 2023). This comparative study is vital for understanding students’ and teachers’ PU and BI on PMD use in classrooms, offering valuable insights into technology integration dynamics in mathematics teaching and learning. The first objective of this study was to assess how participants rated the PU and BI scales regarding the use of PMDs for mathematics learning in school. The second objective was to assess the direct effects of students’ PU on their BI towards learning mathematics with PMDs in school. The third objective was to test the measurement invariances for PU and BI factors between students and teachers. The final objective was to compare the latent mean differences between the students’ and teachers’ PU and BI factors regarding students’ mathematics learning with PMDs in school. This comparative analysis not only enhances the comprehension of how PMDs are perceived by the key educational stakeholders but also highlights the potential disparities in their intentions to use and allow these devices in mathematics classrooms.
Researchers studying the impact of students’ PMDs on educational performance have explored factors like attitudes, perceived usefulness, and perceived ease of use that influence educational stakeholders’ (students, teachers, parents and policymakers) perceptions, intentions and actual usage of PMDs in schools worldwide. Studies such as (Chatterjee et al., 2020; Cóndor-Herrera and Ramos-Galarza, 2021; Umboh et al., 2021; Zogheib and Daniela, 2021; Yanuarto et al., 2023; Oyedoyin et al., 2024) investigated these factors solely on students’ perceptions of learning mathematics and other subjects at school with PMDs. In addition, several researchers (Curto Prieto et al., 2019; Adov et al., 2020; Xu and Zhu, 2020; Yaniawati et al., 2022; Jatileni et al., 2023; Zakaria et al., 2023; Al-alami and Alhamami, 2024) studied these factors exclusively on teachers’ perceptions of integrating PMDs in the teaching of various subjects, including mathematics. In addition, a few recent studies, such as Mkude et al. (2023) and Mutambara and Bayaga (2020, 2021), have assessed students’ PMD use and BYOD policy implementation in schools from a multiple educational stakeholder perceptive. Such a focus in the literature has created a research gap in the alignment or misalignment between the educational stakeholders’ perceptions on PMD use in schools, since each group of stakeholders’ perspectives are assessed either differently or separately. This research focus has prompted the necessity for comprehensive analyses of these factors among groups of educational stakeholders regarding the use of PMDs in specific subjects and the implementation of BYOD policies in schools. Such scrutiny can contribute to a better understanding of these factors and the dynamics of technology adoption in educational settings and in mathematics learning (Attard and Holmes, 2019; Mkude et al., 2023). Moreover, such research informs the development of effective BYOD policies and enhances the understanding of the evolving role of PMDs in shaping contemporary education worldwide. Mkude et al. (2023) found that diverse modern technologies are commonly incorporated into school teaching and learning when there is a shared positive relationship between stakeholders’ perceptions and the use of technology. However, researchers such as Mkude et al. (2023) evaluated the perceptions of educational stakeholders as a collective group regarding modern technology usage in schools without examining the perspectives of individual stakeholder groups. This suggests a need for further research to enable meaningful comparisons between different groups of educational stakeholders concerning students’ learning subjects, such as mathematics, with PMDs in school.
Integrating students’ PMDs in mathematics classrooms can serve various purposes such as enhancing learning experiences, promoting collaboration, and providing access to a wide range of mathematical tools and resources (Fabian et al., 2018). Namibian students could use their PMDs to access mathematical tools and applications. Students in other countries commonly use applications like GeoGebra and Desmos for graphing, geometry, algebraic manipulations and learning functions (Chechan et al., 2023; Diharto et al., 2024). Diharto et al. (2024) reviewed the literature on a total of 23 applications that are mostly used in mathematics classrooms in schools. Applications including Geogebra, Linear Equation Aid, Construct, Hawgent dynamic mathematics software, Quizizz, Game Education, Maple, Cabri, Mathematic Equation Editor and Software Derive have been used in mathematics classrooms and reported to have helped improve students’ performance (Diharto et al., 2024). Such applications are used in teaching and learning topics such as geometry, mathematical modelling, algebra, arithmetic operations, fractions, and matrices among others. These topics are part of the Namibian grades 4–7, 8–9, 10–11 and grade 12 mathematics syllabi. Therefore, Namibian students could also utilise any of the 23 applications and more on their PMDs to enjoy learning mathematics in school if they are permitted. Most of the mathematical applications are developed by teachers and researchers and have helped students develop critical thinking and problem-solving skills and gain mathematical conceptual understanding (Diharto et al., 2024). Applications such as Google Classroom are used to facilitate mathematics learning. Abidin and Saputro (2020) described Google Classroom as a user-friendly educational platform that provides a seamless experience for both teachers and students, while also allowing teachers to enhance student learning through online tools. They found that Google Classroom effectively supports students’ mathematics learning by providing flexible access to resources and enabling knowledge construction through active participation in online forums, thus allowing efficient instructional practices (Abidin and Saputro, 2020). Students can also use their PMDs to access and store online mathematics resources, textbooks, videos, and tutorials. Additionally, Namibian students could use their PMDs to access different mathematics teaching websites, such as the commonly used Khan Academy, IXL Math, Desmos, Art of Problem Solving and Mathway.
Although there is an increase in the literature examining the benefits and challenges of PMDs in schools, there remains a need for further research to address the evolving technologies and their perceived impact on teaching and learning, particularly in specific subjects such as mathematics, where technological support may significantly impact performance. Ongoing research should explore the nuanced interactions between the key educational stakeholders’ perceptions to provide insights into the factors influencing the utilisation of students’ PMDs in diverse school subjects and the successful implementation of BYOD policies in schools. This study serves as a foundation for students, teachers, parents and educational policymakers to make informed decisions about the integration of PMDs in mathematics teaching and learning and the implementation of BYOD policies in the shifting modern education systems.
The TAM framework accommodates the evolving use of PMDs in schools globally, given the dynamic nature of technology in education. The TAM has a developmental history that keeps advancing over time with continuous extensions emerging to incorporate additional variables (Davis et al., 2023). TAM was developed by Davis (1989) and Davis et al. (1989) as a revision of the Theory of Reasoned Action in Information Systems (Naeini and Krishnam, 2012). TAM has been a theoretical foundation, providing an understanding of individuals’ acceptance and usage of technologies in diverse sectors, including education (Granić and Marangunić, 2019).
The original also called the basic TAM has three factors: PU, PEOU and BI. Both PU and PEOU can directly affect participants’ BI towards using technology (Davis, 1989). The basic TAM model has been firstly expanded to include other external variables, attitude, and actual use factors (Davis et al., 1989). The expanded TAM model explains that PEOU and PU can be correlated, and they can both significantly impact users’ attitudes towards technology use (Davis et al., 1989). It further suggests that users’ attitudes influence their intention and, in turn, their actual behaviour to use technology (Davis et al., 1989). Thus, through attitude as a mediator, both PEOU and PU can influence the participants’ intention and behaviour to use technology (Davis et al., 1989). Nonetheless, PU and PEOU can be significantly influenced by external variables that chronologically determine the user’s intentions and actual use of technological devices (Venkatesh and Davis, 2000). The framework further depicts that PU can have both a direct and an indirect significant influence on users’ intentions to use technology (Davis, 1989; Zaied, 2012). Later, the original TAM was extended into TAM 2, which incorporates additional theoretical constructs such as social influence and cognitive instrumental processes. Thereafter, TAM 3 was developed to include factors such as trust and perceived risk. The Unified Theory of Acceptance and Use of Technology is another influential model that builds upon the original TAM. These extensions and adaptations of TAM can be integrated to capture additional factors that influence the acceptance and use of PMDs (Venkatesh et al., 2012). Despite these developments, the general aim of TAM remains to provide a comprehensive understanding of technology acceptance behaviour (Davis et al., 2023).
This model has been widely applied in various education contexts to examine the acceptance, adoption and use of technology (Naeini and Krishnam, 2012). The TAM’s applicability to PMDs use in schools and mathematics classrooms is apparent in previous research that assessed either students’ or teachers’ PU and BI factors (Mutambara and Bayaga, 2020; Açıkgül and Şad, 2021; Jatileni et al., 2023). In the school’s jurisdiction, the TAM serves as a valuable theoretical framework that researchers use to explore how stakeholders of education perceive and accept PMDs use within the context of BYOD policies. The model suggests that the participants’ perceptions of PMDs’ usefulness and the ease with which these devices can be integrated into the mathematics learning process are critical factors influencing their acceptance (Jatileni et al., 2023). Furthermore, the implementation of BYOD policies in schools serves as a contextual component influencing participants’ perceptions of PMD use in mathematics classrooms. This theoretical framework guides studies in exploring the intricate interplay between students, teachers, school policies and technological advancements, contributing to a nuanced understanding that ultimately influences the successful integration of PMDs in schools.
This study mainly aims to assess the PU and BI factors of the participants regarding the acceptance to use PMDs in the context of mathematics education in schools. Within the framework of the TAM, PU is posited as a key determinant of BI than PEOU (Davis et al., 1992). This suggests that students and teachers are more likely to accept and use PMDs when they perceive them as useful, rather than focusing on the ease of using them. Generally, PU has been established and considered the strongest predictor of BI, a relationship that is well established and documented in the seminal work of Davis (1989) and Davis et al. (1989) and further supported by Davis et al. (1992). Therefore, this study builds upon two of the basic TAM constructs PU and BI, which share a proven, strong fundamental relationship when compared to the PEOU and BI relationship. Hence this study explores the TAM proposition depicted in Figure 1 that PU strongly influences both students’ and teachers’ BI to accept PMDs use in mathematics teaching and learning. While the abilities of PU and PEOU to predict BI may differ across various contexts and technologies, PU consistently emerges as a more significant factor in influencing users’ intentions towards technology usage within the basic TAM framework (Davis, 1989; Davis et al., 1989, 1992). Therefore, the assessment of PU and BI constructs in this study is grounded on the established predictive principles of the TAM framework, emphasising the critical role of PU in forecasting the potential acceptance of PMDs in mathematical pedagogy.
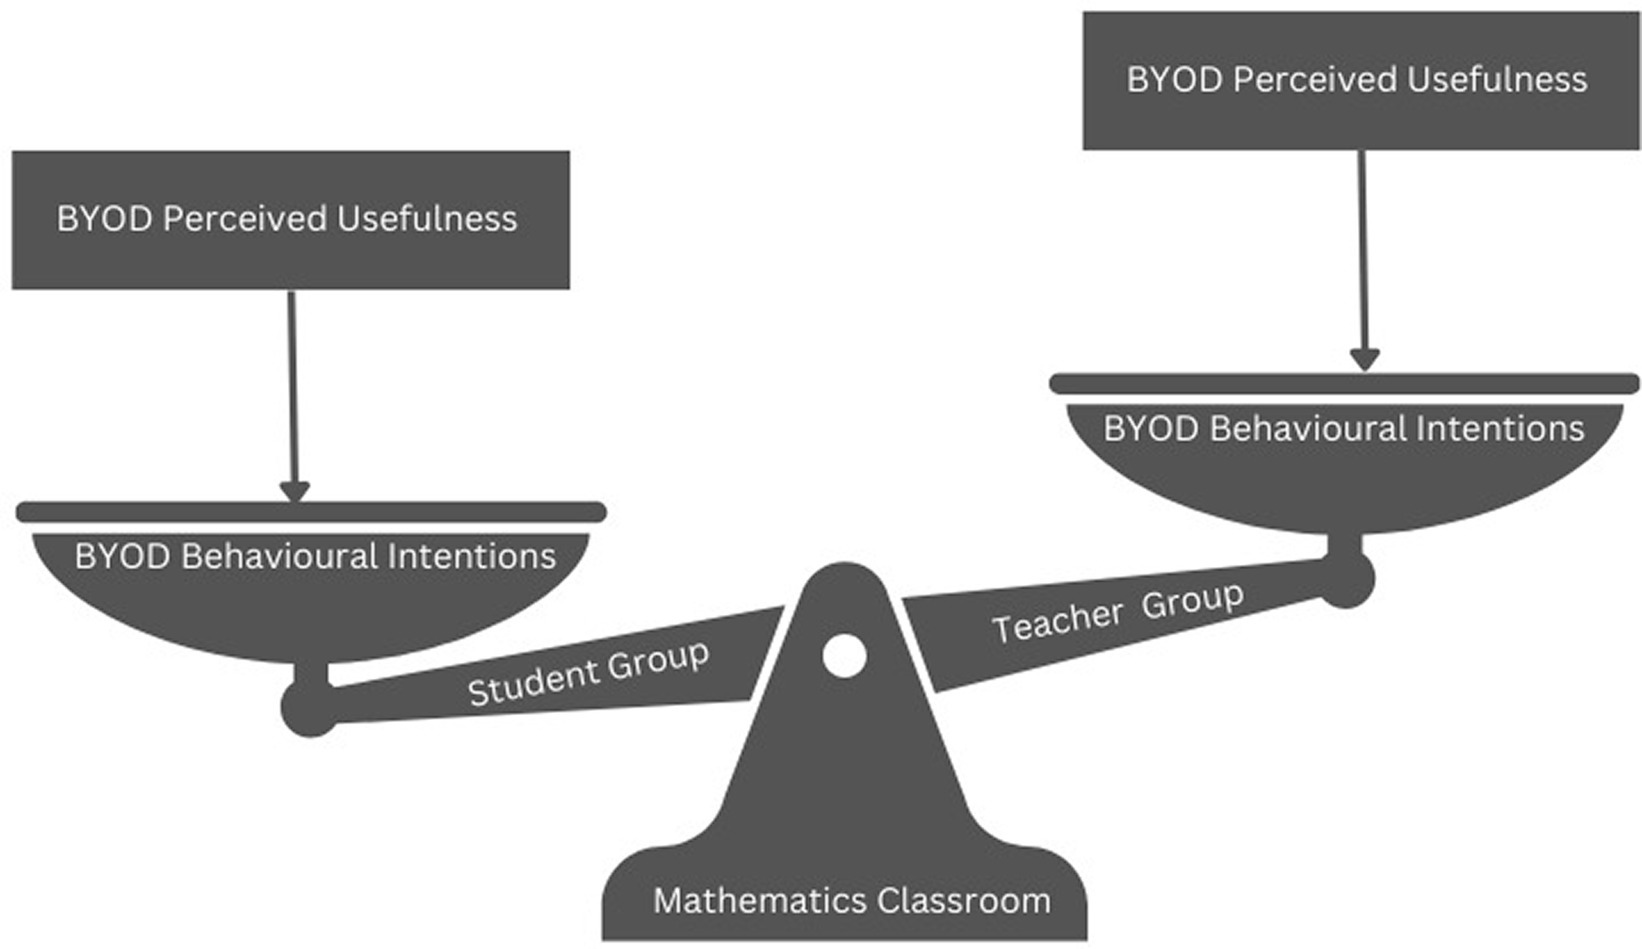
Figure 1. Conceptual hierarchies of PU and BI among students and teachers.
PU refers to the extent to which a person believes their work performance can be enhanced by using technology, such as when the technology helps them complete a task more efficiently (Davis, 1989). In the context of this study, PU refers to the perceptions that students’ PMDs use can contribute to improving mathematics education from both the students’ and teachers’ perspectives. One of the main reasons why students and teachers accept PMDs use in mathematics classrooms is their perception that it will help improve teaching and learning (Mutambara and Bayaga, 2020). While both PU and PEOU contribute to participants’ BI, research often indicates that the PU of technology has a more significant impact on shaping users’ adoption and use of the technology. Thus, if students and teachers perceive PMDs as useful for achieving their mathematics goals or improving performance, they are likely to have a positive intention to use them, even if ease of use is not perceived as extremely high.
BI refers to a person’s cognitive representation of their proximal determinant to use a given technology (Davis, 1989; Mutambara and Bayaga, 2020; Zogheib and Daniela, 2021). In the context of this study, BI pertains to both students’ willingness to learn mathematics with PMDs at school and teachers’ willingness to integrate or facilitate mathematics lessons in which students use PMDs for learning. Building on prior research (Teo, 2019; Mutambara and Bayaga, 2020, 2021), we formulated four research questions (RQs) and corresponding hypotheses (Hs) for this study.
RQ1: How did the participants rate the PU and BI scales regarding the use of PMDs for mathematics learning at school?
H1: The student group has a higher rating for both the PU and BI factors.
RQ2: How does the students’ PU directly relate to their BI towards learning mathematics with PMDs in school?
H2: Students’ PU has a statistically significant, positive and direct effect on their BI.
RQ3: Are students and teachers assessing PU and BI similarly to students’ mathematics learning with PMDs in school?
H3: Students and teachers assess the PU and BI factor structures similarly.
RQ4: Are there significant latent mean differences between students’ and teachers’ PU and BI factors on students’ mathematics learning with PMDs in school?
H4: Students have a statistically significant high PU and BI regarding their PMDs for mathematics learning.
The study employed a closed-ended survey as the research instrument to collect data from both participant groups. For validity purposes, the survey instruments for students and teachers used in this study were developed from existing survey tools. In the students’ survey, the initial four questions gathered their details, including age, gender, region and whether they owned any PMDs. In the teachers’ survey, participants’ information, such as age, gender, region, teacher qualification and years of teaching experience, formed the initial five questions. In addition, the survey tools for both groups collected data on factors other than PU and BI used in this study. The items of the PU and BI factors for the students’ survey instrument for data collection were developed from (Hopkins et al., 2016; Pramana, 2018; Hoi, 2020). The PU and BI factors for the teachers’ survey instrument were developed from (Okyere-Kwakye et al., 2016; Chatterjee et al., 2020; Xu and Zhu, 2020; Hoi and Mu, 2021). To further validate the survey instruments, we conducted separate pilot studies with 50 participants from each group to evaluate their BYOD knowledge and perceptions and to test the factors’ internal consistency. Based on the pilot results of the factor analyses, inter-item correlations, reliability tests and experts’ review, we modified the survey tools to suit the aim of our study and its target population before the final data collection. Moreover, survey items with too low and too high inter-item correlations, those with factor loadings below 0.50, and those loading on more than one factor were excluded from the finalised tool to ensure that the theoretical construct under measurement was validated. For the two factors used in this study, each survey item in both groups was rated on a five-point Likert scale, with 1 indicating strongly disagree and 5 indicating strongly agree.
Data collection was designed based on the participants’ groups and the methodological design of the study. We used confirmatory factor (CFA) multigroup analysis, a part of structural equation modelling (SEM), which has now become the popular methodology for nonexperimental research (Byrne, 2016). In both groups, the study followed a volunteer purposeful sampling using a quantitative nonexperimental research design to collect data from ninth graders and grades 4–12 mathematics teachers from the Omusati and Khomas regions. Purposeful sampling aided in selecting participants relevant to the research questions. Ninth-grade students represent the Namibian basic education students’ population, chosen for their unique position of being neither in the primary level, where comprehension might be limited, nor in the senior secondary level, where BYOD intentions for mathematics learning might be excessive in school. They bridged both levels, providing a nuanced understanding. Additionally, Grades 4–12 mathematics teachers were chosen to share diverse perspectives, including varied educational backgrounds, teaching experiences and styles based on BYOD for mathematics learning in school. Collecting data from both urban schools in Khomas and rural schools in Omusati ensures varied insights, contributing to comprehensive and targeted data collection. Regarding the students, 12 government schools, seven from the Omusati and five from the Khomas regions, participated. Students were self-selected from full-class Grade 9 groups. Mathematics teachers distributed 508 questionnaires during school hours, which students completed using paper and pencils. The teachers collected and transmitted the surveys via Zoom for the researcher’s recording. The data were then entered into the Webropol survey system, producing 500 usable surveys. On the other hand, 209 teachers from public schools in both regions completed a self-administered online survey through a shared Webropol survey link. Data for students were collected from January–March 2022, and the teachers’ data were collected from March–June 2022.
The participants in this study consisted of two groups: students (n = 500) and teachers (n = 209), totalling 709 participants. Notably, both students and teachers were from the same regions. In the paper-and-pencil survey, 500 ninth-grade students participated. Half (50%) attended seven schools in Omusati, while the remaining half (50%) were from five schools in the Khomas region. Among the students from Omusati, 52% were girls and 48% were boys. In Khomas, 60% were girls, and 40% were boys. Of the students from Omusati, 64% (159) owned PMDs, and 75% (188) of the students from the Khomas region owned PMDs, such as laptops, smartphones or tablets, that they use to access the Internet outside the school premises. Conversely, 36% (91) of the students from Omusati and 25% (62) of the students from Khomas did not own PMDs that access the Internet. Additionally, 209 mathematics teachers in Grades 4–12 from the Omusati and Khomas regions completed the online survey. Of the total teachers, 60% taught mathematics in Omusati schools and 40% taught in Khomas schools. In Omusati, 61% of teachers were female, and 39% were male, while in Khomas, 58% were female, and 42% were male. Both student and teacher participants from the Omusati region represent rural schools, while those from Khomas represent urban schools. Teachers from both regions had not experienced students learning mathematics with PMDs in school. In addition, students from both regions had not learned mathematics with PMDs in school. Table 1 presents the demographic details of the participants, categorised by gender, group and region.
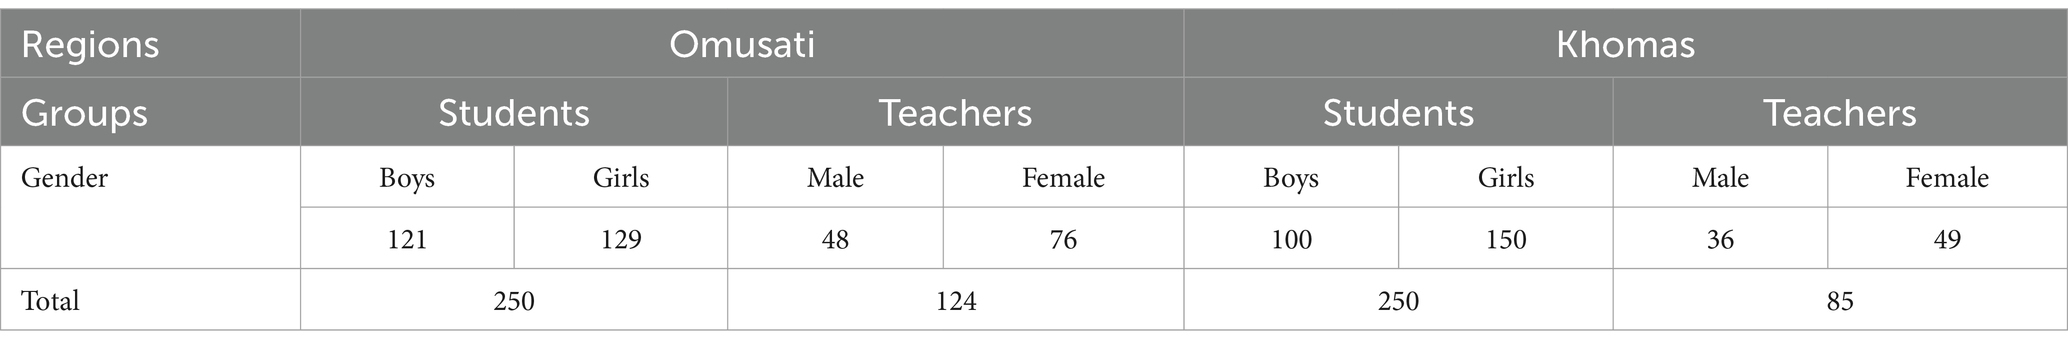
Table 1. Participants’ demographic information (N = 709).
The data were analysed in a series of steps using IBM SPSS Statistics 27 and IBM SPSS Amos 27. First, we conducted principal component analysis (PCA) for students’ and teachers’ perceived usefulness (PU) and behavioural intention (BI). This process involved merging or combining the related PU and BI items from both the students’ and teachers’ PCAs. Furthermore, we tested the interfactor correlation and conducted reliability tests for the merged PU and BI items. To ensure the validity, reliability and generalisability of the measurement model to the studied population, we conducted a SEM CFA for PU and BI factors. This CFA analysis was performed on the entire participant group. Subsequently, we conducted separate CFAs for the students’ and teachers’ groups to assess the fit of the hypothesised measurement model and factor structures to the observed data within each group. Next, we assessed the predictive power of the students’ PU on their BI towards learning mathematics with PMDs in school. Thereafter, we conducted tests for measurement model invariance (MMI) across the participants’ groups to ensure that the measurement properties remained consistent across the subgroups before comparing the latent group means. The PCA output of the student data revealed the extraction of two distinct components with eigenvalues above 1. The first component, BI, consists of seven items, while the second component, PU, comprises five items (see Table 2). The students’ PCA showed no cross-loadings.
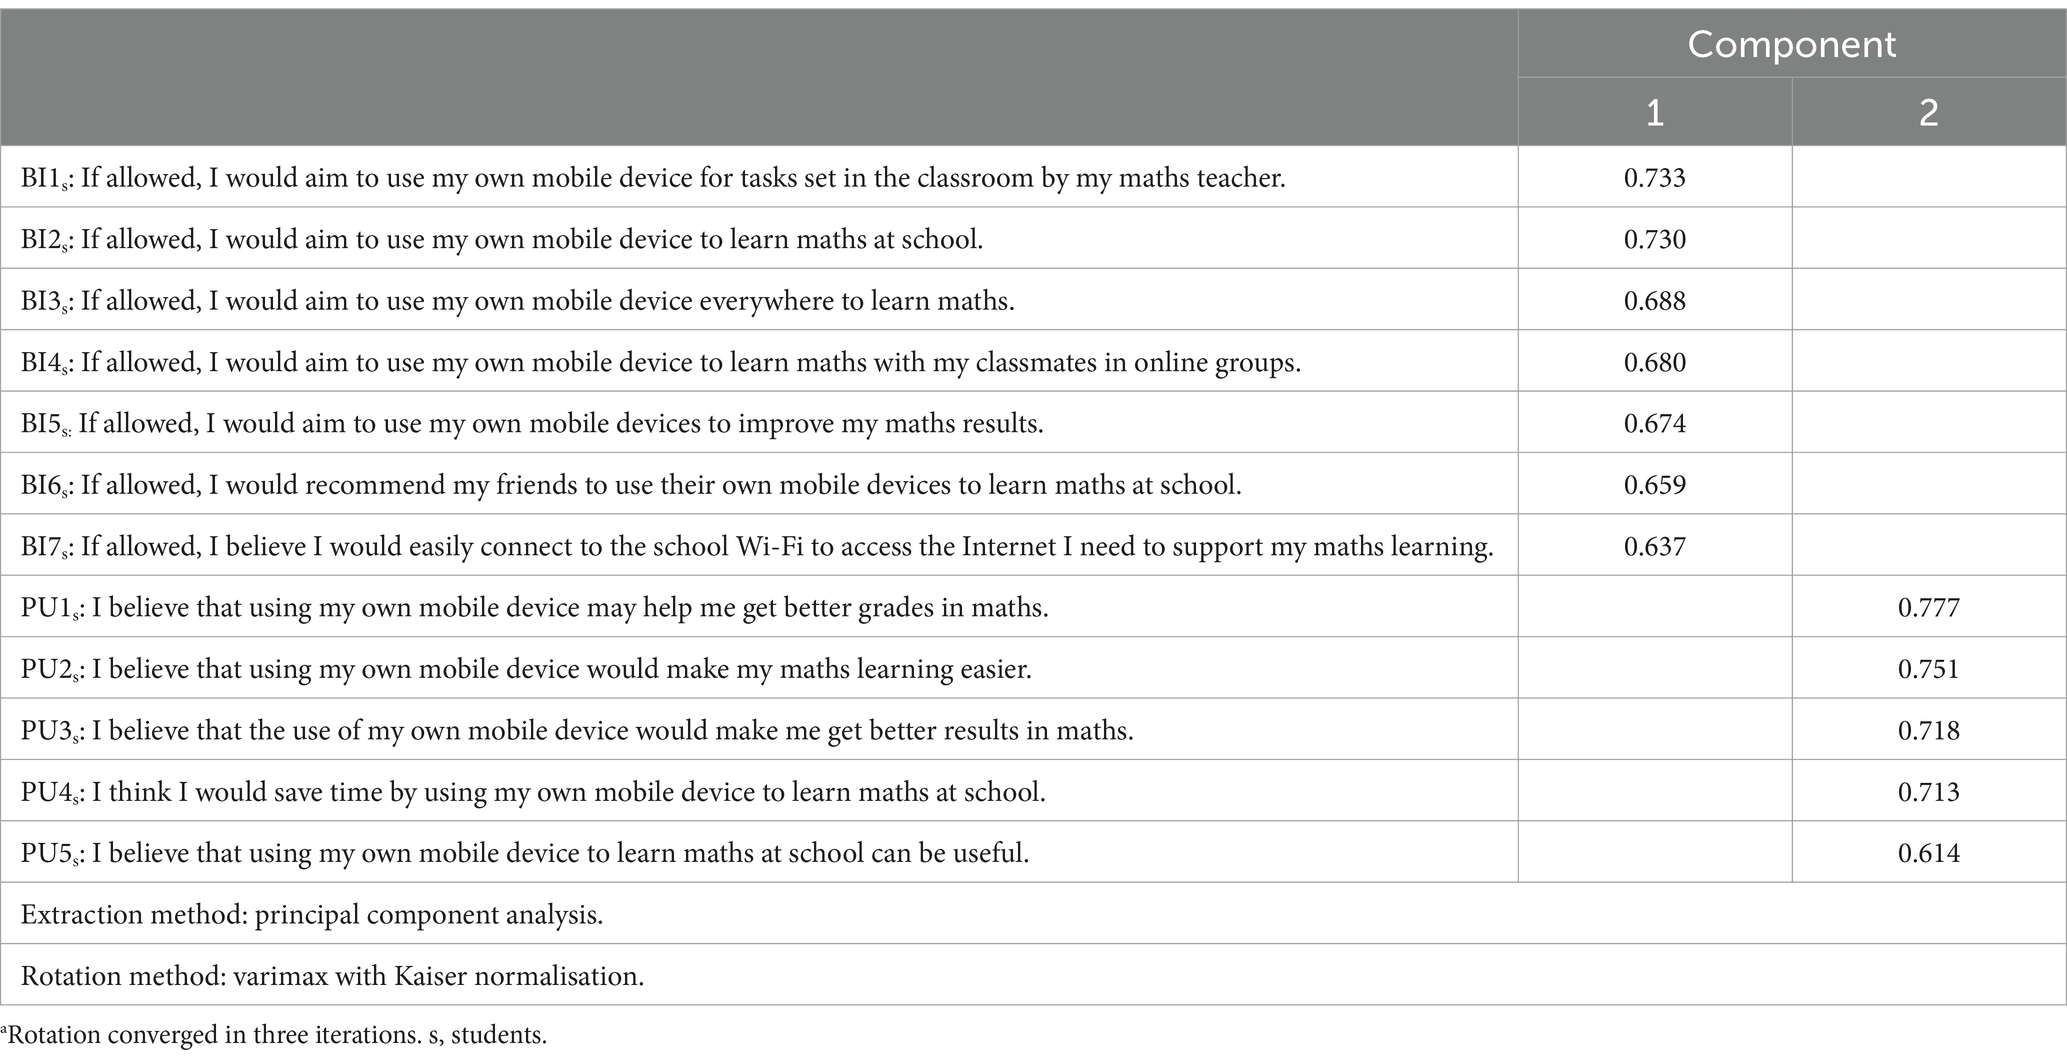
Table 2. Rotated component matrixa loadings of latent variables for students (N = 500).
The teachers’ PCA output showed cross-loadings. In the teachers’ survey tool, eight items measured the BI component, and seven items assessed the teachers’ PU component. PCA successfully extracted these two components from the teachers’ data. However, two items from the BI component exhibited cross-loadings on both the BI and PU components. Despite strong loading on their primary construct, BI, compared to PU, we removed these two items, as they appeared to be weak measures of either BI or PU (Collier, 2020). After excluding the initial BI3 and BI8, the PCA output for teachers’ data immediately showed two components with eigenvalues above 1: BI with six items and PU with six distinct indicators (see Table 3). PU7 was not extracted from the teachers’ data. The Kaiser–Meyer–Olkin measure of sampling adequacy was very good for both students (0.929) and teachers (0.928), and Bartlett’s test of sphericity was significant for both (p = 0.000). The BI and PU factors among students explained 57% of the variance in intentions, while among teachers, these factors accounted for 78% of the variance in intentions towards BYOD for students’ mathematics learning in school.
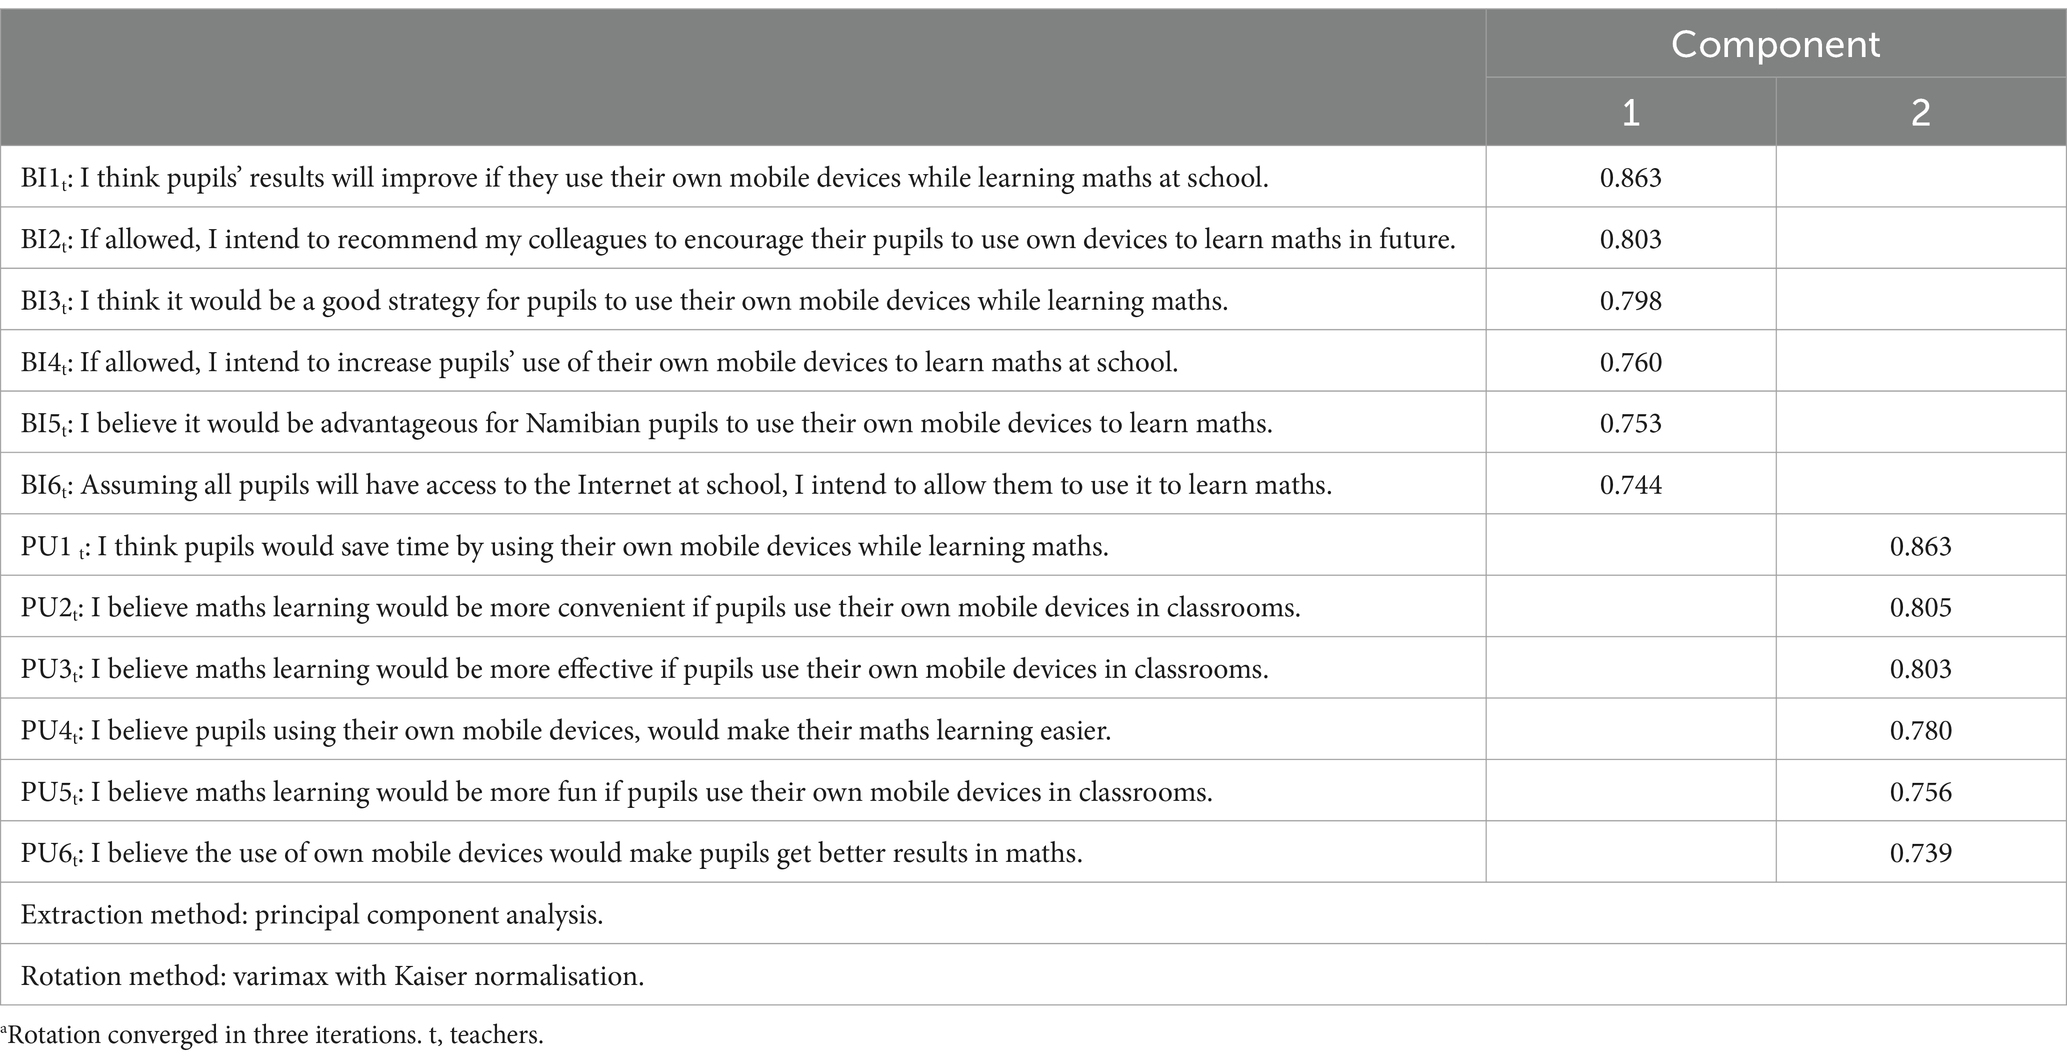
Table 3. Rotated component matrixa loadings of latent variables for teachers (N = 209).
The subsequent step involved combining the related BI and PU indicators from both students’ and teachers’ extracted components. This was achieved by merging them and adding cases to create single BI and PU items, consequently forming BI and PU factors for both participant groups. Related indicators are those that measure the same content concerning BI or PU in students as in the teachers’ surveys. They were merged to create a single large dataset that included the teacher and student groups. The following students’ BI indicators were merged with the teachers’ BI indicators: (BI5s and BI1t = BI_Comb1), (BI1s and BI4t = BI_Comb2), (BI7s and BI6t = BI_Comb3), (BI6s and BI2t = BI_Comb4), and (BI3s and BI3t = BI_Comb5). Two items from the students’ extracted indicators, BI2 and BI4, did not match any BI indicators in the teachers’ extracted indicators. Additionally, item BI5 in the teachers’ extracted items did not match any BI item in the students’ extracted items. The following students’ PU items were merged with the teachers’ PU items: (PU2 s and PU4 t = PU_Comb1), (PU4s and PU1t = PU_Comb2), (PU3s and PU6t = PU_Comb3), and (PU5s and PU2t = PU_Comb4). Item PU1 in the students’ extracted items did not match any PU item in the teachers’ extracted items. In addition, items PU3 and PU5 in the teachers’ extracted items did not match any item in the students’ extracted items. Items that did not match each other were left unmerged and are excluded from this study.
Third, we evaluated the internal consistency of the four PU and five BI merged variables. Cronbach’s alpha has faced criticism for its reliability assessment (Abubakar et al., 2016; Sijtsma and Pfadt, 2021). Consequently, we computed composite reliability alongside Cronbach’s alpha to provide an alternative measure of reliability. The BI and PU factors showed good (˃0.80) Cronbach’s alpha and composite reliability (Hair et al., 2021; Table 4).
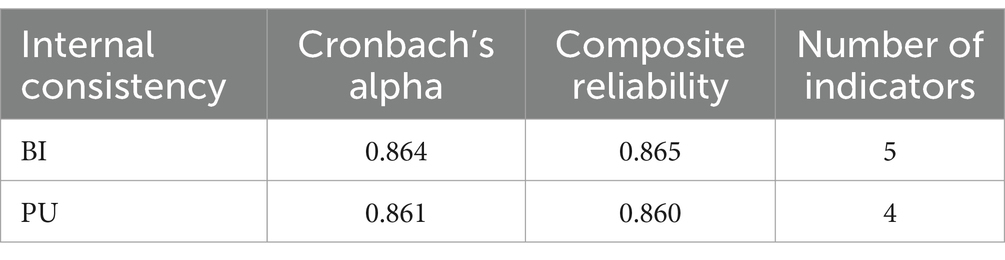
Table 4. Construct reliability tests for combined factors (N = 709).
Fourth, we computed the mean of the PU and BI merged indicators to assess the inter-factors correlation. The variables PU and BI exhibited a strong positive correlation, r = 0.721 and p < 0.001. Fifth, we conducted a preliminary CFA to test the factorial structure of the merged BI and PU factors on both participants as a whole group. Table 5 shows the estimated paths of the indicators, unstandardised regression weights, standardised regression weights, critical ratio (CR) or t-values and p-values <0.001. The fit indexes showed a good fit model, meaning that the model fits the combined data well. The χ2 = 83.699, df = 25, χ2/df = 3.348 < 5.0, p = 0.000, standardised root mean squared residual (SRMR) = 0.0241 < 0.05, root mean squared error of approximation (RMSEA) = 0.058 < 0.08, the goodness of fit index (GFI) = 0.974, Tucker–Lewis index (TLI) = 0.975 and the comparative fit index (CFI) = 0.983 all >0.90 (Byrne, 2016; Keith, 2019).
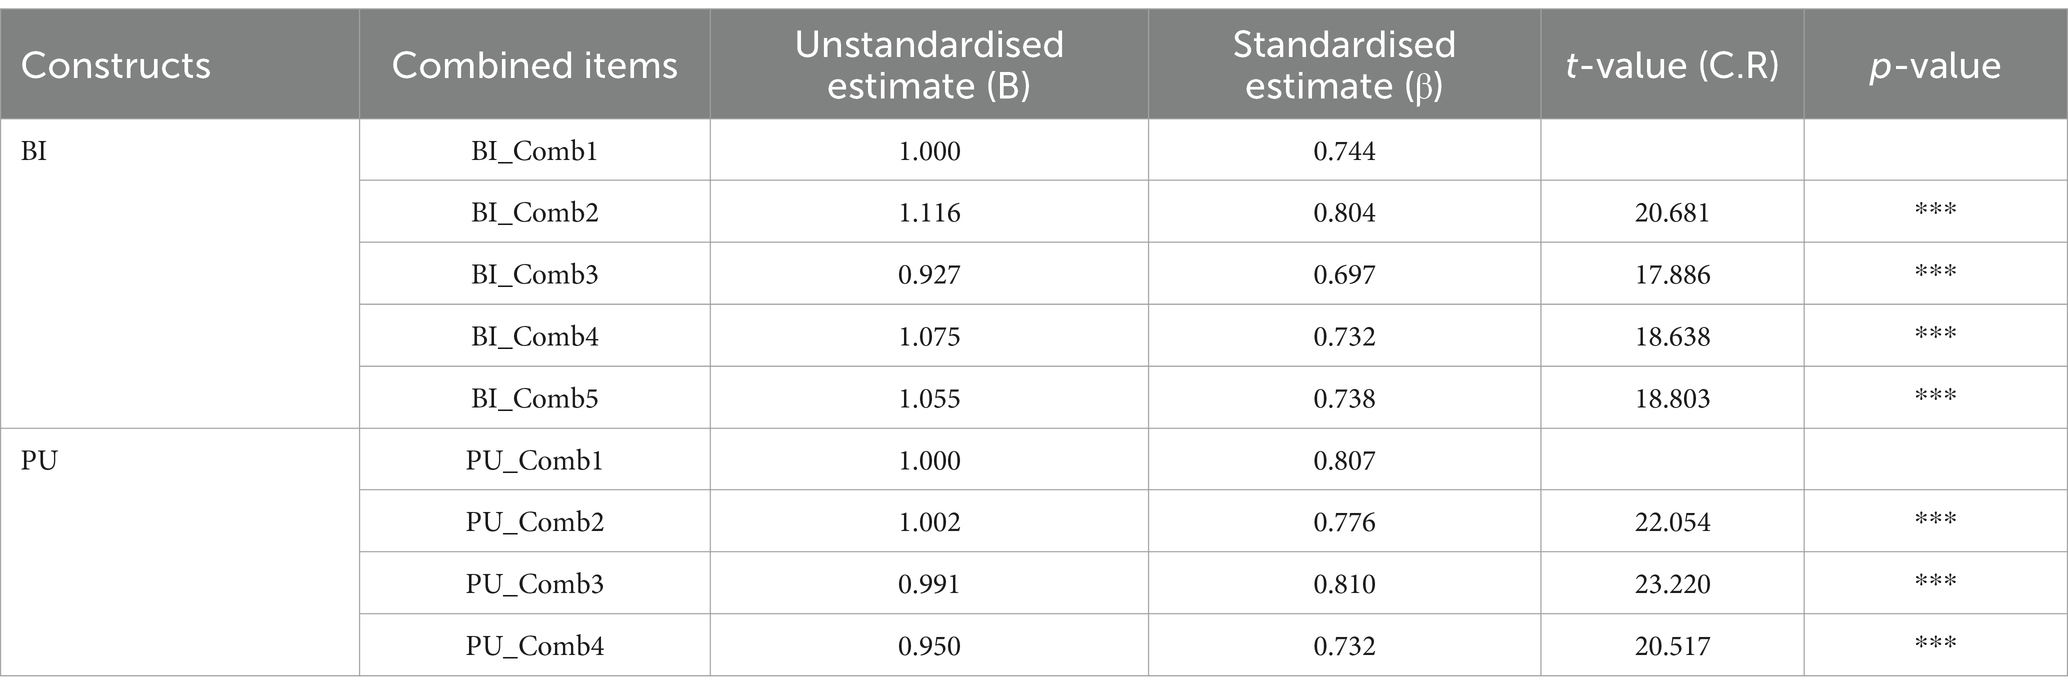
Table 5. Confirmatory factor analysis for combined variables (N = 709).
Sixth, we conducted two separate CFAs for the student and teacher samples to assess if the model fit the data of each group. The teachers’ CFA results showed stronger loadings on both factors when compared to those of students. Loadings for the PU factor ranged between 0.65–0.74 for the students and 0.78–0.92 for teachers. The loadings for BI ranged between 0.60–0.73 for students and 0.75–0.94 for teachers. Based on the CFA model fitness criteria by Byrne (2016) and Taimalu et al. (2021), our CFA models for both samples demonstrate good data fit (see Table 6).
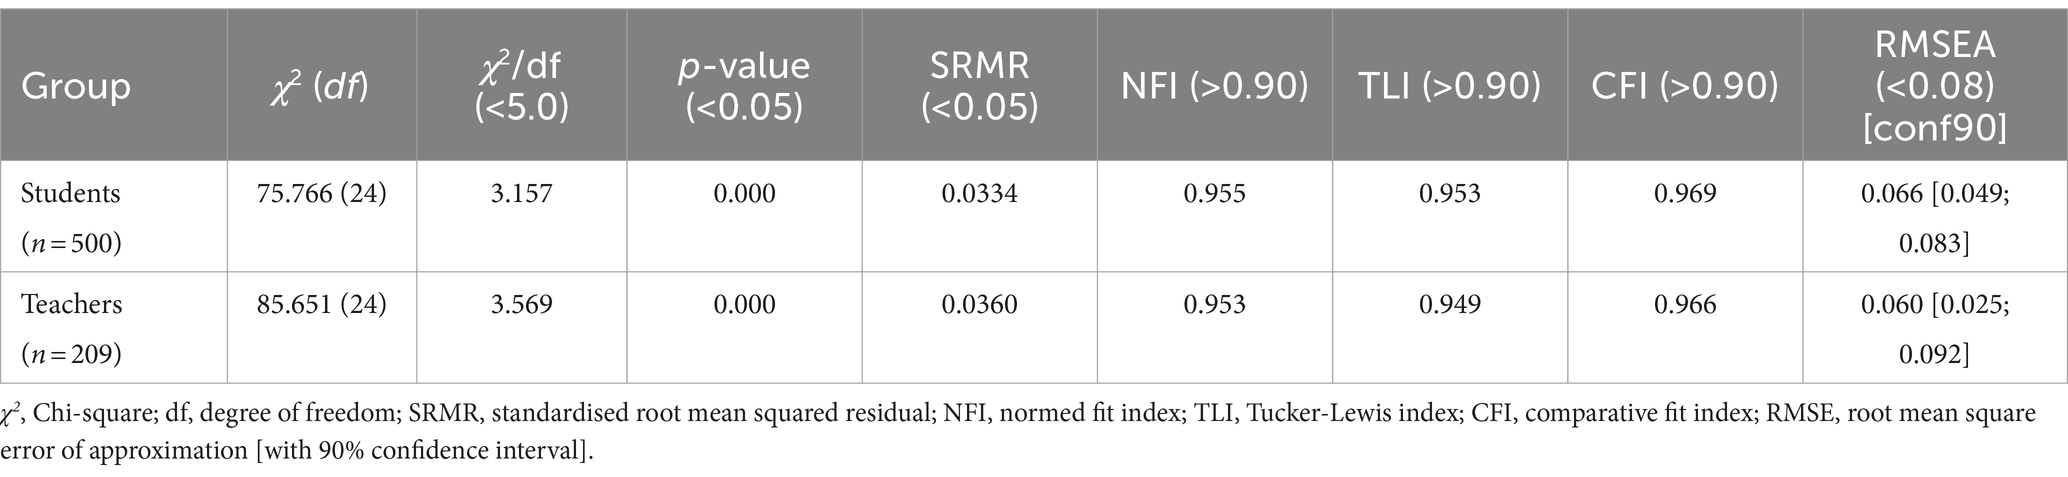
Table 6. Model fitness of the measurement models across the group samples.
This study first analysed how students assess their PU and BI levels towards learning mathematics with PMDs in school. Second, the study assessed the direct effects of students’ PU on their BI towards learning mathematics with PMDs in school. Third, the study analysed whether measurement invariance existed between the student and teacher groups in the assessment of PU and BI factors on students’ mathematics learning with PMDs in school. Finally, the study assessed whether there are significant latent mean differences in the students’ and teachers’ PU and BI factors regarding students’ mathematics learning with PMDs in school.
In response to RQ1, Table 7 presents the descriptive results of how the PU and BI scales were rated by the student and teacher groups. The student group showed higher or more favourable ratings for both the usefulness and intentions scales of PMDs, while the teacher group showed lower or less favourable ratings for the usefulness and intentions scales of PMDs. Therefore, H1 (the students’ group has a higher rating for both the PU and BI factors) is accepted.
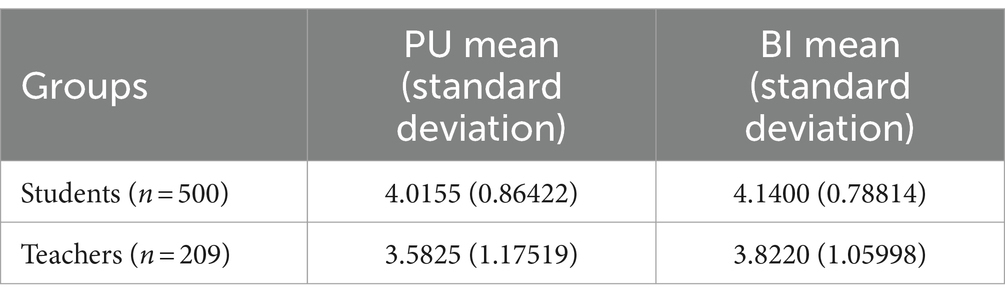
Table 7. Descriptive statistics of perceived usefulness and behavioural intention factors.
In response to RQ2, Figure 2 shows that PU directly and significantly predicted the students’ BI to learn mathematics with PMDs in school (β = 0.821, t = 10.891, p ≤ 0.001). The model depicted in Figure 2 demonstrated acceptable fitness (χ2 = 244.039; df = 52; χ2/df = 4.693 < (5.0); p = 0.000 < (0.001); SRMR = 0.0326 (<0.05); RMSEA = 0.072 (<0.08); GFI = 0.932 (>0.90); TLI = 0.923 (>0.90) and CFI = 0.945 (>0.90) (Byrne, 2016). Therefore, H2 (students’ PU has a statistically significant, positive and direct effect on their BI) is accepted. PU accounts for 67% of the variance in students’ intentions to learn mathematics with PMDs in school. In a previous study concerning these teachers, it was found that PU (β = 0.715, t = 8.972, p < 0.001) was the highest and strongest significant predictor of the teachers’ assessed BI towards students’ learning of mathematics with PMDs through BYOD in school (Jatileni et al., 2023). Yet, in this study, the teachers’ PU and BI were slightly weaker than those of the students. In addition, the teachers’ PU predictive abilities of BI towards students learning mathematics with PMDs in school are marginally lower than that of students.
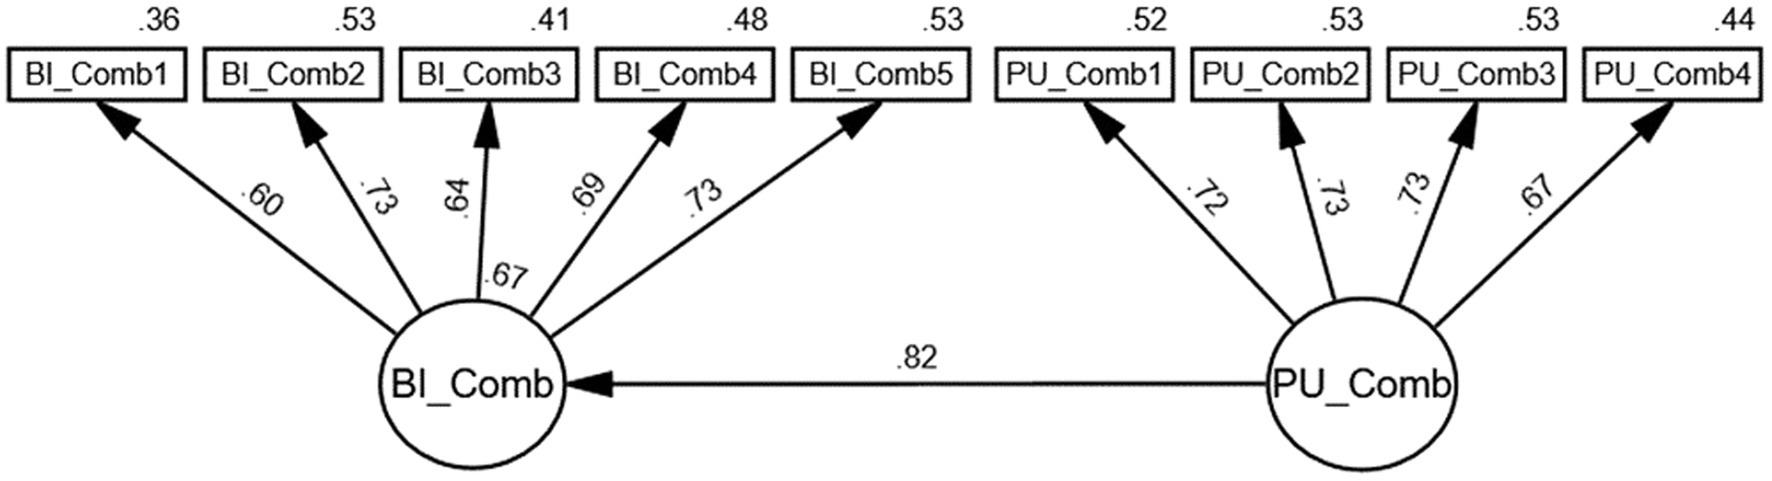
Figure 2. Path model of the direct relationship between students PU and BI.
We conducted a series of multigroup CFA models to perform measurement model invariance tests (MMITs) across the student and teacher groups in response to RQ2. The participating students and teachers in this study did not fill out the exact same survey instrument. While both groups had the PU and BI factors on their surveys, the differences were that the students responded as PMD users, while the teachers responded as PMD facilitators in a mathematics classroom. Thus, the wording of the PU and BI factor items for each group was slightly different, necessitating MMITs. Conducting the MMITs aligns with Putnick and Bornstein (2016), who emphasise the importance of first assessing construct invariance before testing mean differences across groups or measurement occasions. Moreover, when comparing groups, there is an underlying assumption that the instrument assesses the same constructs across all groups. If this assumption is met, the comparisons become valid, enabling a meaningful interpretation of the differences or similarities between the groups.
The MMITs in this study examined whether the students and teachers understood and assessed the PU and BI survey measures similarly. Moreover, the MMITs determined if the factor loadings of PU and BI indicators were equivalent and did not differ across the participants’ change of groups. Finally, the MMITs ensured that measurement properties, including factor loadings and intercepts, remained consistent across participant groups, making the scales equivalent between students and teachers. Thus, students’ and teachers’ understanding of PU and BI indicators ought not change with the change in their group. If a lack of measurement model invariance exists, it indicates that the meaning of the PU and BI constructs is shifting between the student and teacher groups (Byrne, 2016; Collier, 2020). To ensure a good fit for both groups before making comparisons, the hypothetical structure should be assessed (Milfont Taciano and Fischer, 2010). Accordingly, we assessed invariance in this study with the three most recommended MMITs, configural, metric and scalar, which are necessary for making meaningful comparisons of group latent means (Gregorich, 2006; Keith, 2019; Taimalu et al., 2021).
The configural invariance test is the initial MMIT and it tested the unconstrained model across the student and teacher groups. It assessed the extent to which the PU and BI factors best represented the data for students and teachers. This test examined whether the overall structure of the constructed measurement model was equivalent across the participant groups (Byrne, 2016; Collier, 2020; Tan and Pektaş, 2020). Since no equality constraints are imposed on the model at this stage, its judgement is based only on the adequacy of goodness-of-fit statistics. The measurement model based on the participants groups has ensured configural invariance, (χ2 = 161.524; CFI = 0.967; TLI = 0.951; RMSEA = 0.058; see Table 8).
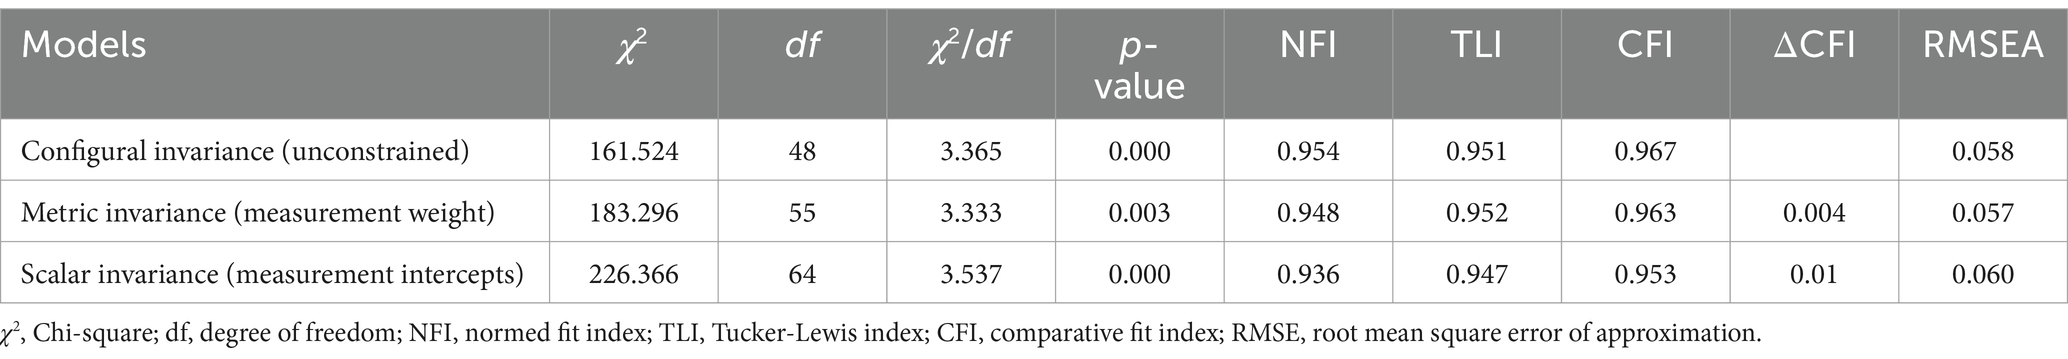
Table 8. Invariance testing with nested (increasingly constrained) models for PU and BI in factors.
If configural invariance is supported, all following MMITs require the imposition of equality constraints across groups (Byrne, 2016). Given the supported fitness of the unconstrained model, we constrained factor loadings to be equal across groups to test for invariance in metric and scalar. We used the Amos automated multi-group analysis approach with specifications for the measurement weight and measurement intercepts equality constraints. Metric invariance was used to test for the equivalence of the item loadings on the factors. This test established the equivalence of the basic meanings of the constructs via factor loadings across the student and teacher groups. Metric invariance assesses whether each indicator or item contributes to the latent construct in the same way across both participant groups (Byrne, 2016; Putnick and Bornstein, 2016; Collier, 2020; Tan and Pektaş, 2020). This MMIT supported that we achieved the matric measurement invariance of the PU and BI factors model across the student and teacher groups (χ2 = 183.296; CFI = 0.963; TLI = 0.952; RMSEA = 0.057; see Table 8). After equating factor loadings for students and teachers, we observed χ2 variations between unconstrained and constrained models using nested model comparisons.
Metric invariance examines differences in unconstrained and constrained measurement weights (Milfont Taciano and Fischer, 2010; Collier, 2020). A non-significant change in χ2 indicates an acceptable model fit (Abubakar et al., 2016). To achieve metric invariance, the χ2 change from unconstrained to constrained models should be non-significant (p > 0.05; Milfont Taciano and Fischer, 2010; Collier, 2020). Conversely, a significant change (p < 0.05) suggests varying meanings of unobservable constructs across groups (Collier, 2020). However, the χ2 test’s sensitivity to sample size affects the χ2 change difference test, leading to the potential over-rejection of invariance (Cheung and Rensvold, 2002; Byrne, 2016; Keith, 2019; Taimalu et al., 2021). Consistent with Cheung and Rensvold’s (2002) perspective, in this study, invariance decisions were based on ΔCFI values rather than χ2 values. A ΔCFI <0.01 indicates evidence of invariance (Cheung and Rensvold, 2002; Byrne, 2016; Keith, 2019; Taimalu et al., 2021). Thus, we used Cheung and Rensvold’s (2002) ΔCFI <0.01 threshold.
Having established configural and metric invariance, the next step was to assess support for scalar invariance. This involved constraining both the factor loadings and measurement intercepts to be equal across groups and comparing the changes in the models. In intercept invariance, we extended metric invariance by constraining the intercepts of measured variables to be equal across student and teacher groups. The measurement model ensured scalar invariance, suggesting that not only are the factor loadings equivalent, but the item measurement intercepts are also equivalent across groups (χ2 = 226.366; CFI = 0.953; TLI =0.947; RMSEA = 0.060; see Table 8). All our models showed ΔCFI values within the <0.01 cutoff point, indicating non-rejection of the null hypothesis of invariance. Therefore, H3 (students and teachers assess the PU and BI factor structures similarly) is accepted. Fourth, factor variance and fifth, error variance invariance MMITs are not necessary for meaningful comparisons of group means (Gregorich, 2006; Keith, 2019; Taimalu et al., 2021). Hence, they are not discussed in this study. Based on the results (see Table 8), we conclude that our CFA model had a reasonably good fit across the groups, confirming that the PU and BI factor structures for students’ mathematics learning with PMDs in school are assessed similarly by both students and teachers.
Given that measurement invariance across groups was established, we compared the groups’ latent means of the PU and BI factors for the students and teachers to find differences. We constrained the students’ latent means of PU and BI to 0, while freeing the teachers’ group means from constraints. By setting the student means to zero, we established a reference point for comparison, ensuring that the model is identifiable. Thus, we uniquely estimated the parameters based on the observed data. Consequently, the teachers’ mean was then estimated relative to this set reference. When the students’ latent means of PU and BI are set to zero, the teachers’ latent means are PU (M = −0.433, t = −4.668, p ≤ 0.001) and BI (M = −0.336, t = −3.984, p ≤ 50.001). The latent mean parameters, estimated for teachers, were negative, below the reference group mean (students = 0).
These results indicate that students’ perceptions of the usefulness of their PMDs for mathematics learning in school are significantly higher than those of teachers. Similarly, the results indicate that students expressed significantly higher intentions to learn mathematics with their PMDs in school compared to teachers’ intentions for students’ mathematics learning with PMDs. Therefore, H4 (students have a statistically significant high PU and BI regarding their PMDs for mathematics learning) is accepted. Table 9 provides a summary of these results. Practically, when we constrain the mean of the students to zero, the latent variables become standardised. The differences in mean values for the standardised variables (teachers’ mean values) are, in practice, represented by Cohen’s d effect size values. Both the effect size for PU (0.5) and BI (0.4) indicate a medium effect size (0.3–0.5), according to Cohen’s criteria. Therefore, both PU and BI have substantial effects, suggesting their importance in the context of students learning mathematics with PMDs in school. In practical terms, this means that the mean differences between these groups (PU and BI) were substantial relative to the variability observed in our data.
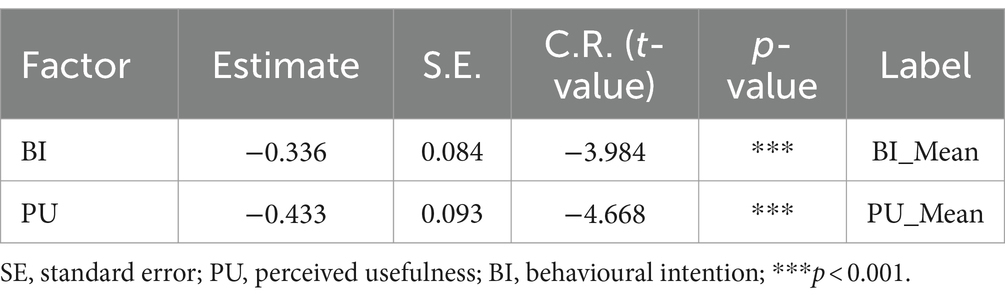
Table 9. Latent means difference of PU and BI by comparing teachers’ values against students’ values.
In a previous related study, teachers in these regions had PU as the strongest predictor of BI towards students’ learning of mathematics with PMDs in school. Grounded in that, this study’s first objective was to assess how the students and teachers rated the PU and BI scales on PMD use for mathematics learning in school. The results show that the participating students had an even more positive assessment of PU (M = 4.02, SD = 0.864) towards learning mathematics with their PMDs in school than their teachers (M = 3.58, SD = 1.175). Moreover, students showed a more positive assessment of BI (4.14, SD = 0.788) towards learning mathematics with their PMDs in school than their teachers (3.8220, SD = 1.05998). These findings suggest that, on average, students expressed a more positive perception of the usefulness of PMDs for mathematics learning in schools compared to their teachers. It further indicates a slightly higher level of agreement or positive sentiment among students towards the intention to utilise PMDs for mathematics learning in schools than among teachers. These results align with those of Mutambara and Bayaga (2021), who found that PU had the highest mean rating among students, teachers and parents regarding the usefulness of mobile learning for STEM subjects in South African rural schools. Additionally, the BI factor had the participants’ third-highest rating. Moreover, Alkindi et al. (2022) indicated that students worldwide are more likely to have higher BI towards the use of mobile learning applications than teachers in the study area.
Although this study did not explore the reasons for the students’ higher ratings of PU and BI towards learning mathematics with PMDs in school, some previous studies allow us to speculate about the reasons. Students are from a younger generation and are often more familiar and comfortable with technology, including PMDs and their applications (Adipat et al., 2021). Students generally exhibit greater interest in and enthusiasm for incorporating such technology into their school learning experiences (Kuleto et al., 2021). Nonetheless, Yeng’s (2023) study revealed that mathematics teachers’ familiarity and competency in integrating instructional technology, such as PMDs use, in mathematics teaching can be affected by their knowledge, frequency of use of PMDs and access and ownership of digital tools. Thus, mathematics teachers who are less familiar with technological tools, such as PMDs, educational software and the Internet, may struggle to facilitate instructional technology in their teaching, thereby limiting opportunities for students to interact with diverse learning tools like PMDs (Yeng, 2023). It is also noticeable that in this study, neither the students nor the teachers had previous experience with PMDs in their classrooms.
The study’s second objective was to examine whether students’ PU directly influences their BI for learning mathematics with PMDs in school. The results revealed a strong predictive relationship, with PU significantly explaining 67% of the variance in students’ intentions to learn mathematics with PMDs. This aligns with PU’s significance in predicting students’ intentions to use mobile devices for mathematics and various subjects in school (Zheng and Li, 2020; Mutambara and Bayaga, 2021). Our findings suggest that students intend to use PMDs for mathematics learning in school, believing that they will enhance their learning and save time. Their intentions are influenced not only by their belief in increasing performance but also by the perceived benefits of PMDs use in mathematics learning. Concurringly, Qi (2019) found that the academic use of PMDs by students can contribute to improved academic performance. If schools allow PMD use, students will aim to connect to the school Wi-Fi, accessing the Internet to support their mathematics learning. They also intend to use PMDs for tasks set in the classroom by their mathematics teachers, aiming to enhance their learning and improve results.
Recent studies worldwide have highlighted a positive relationship between mobile device usefulness and motivation to learn, which, in turn, positively affects students’ outcomes in STEM subjects and reading abilities. For instance, hedonic motivation, defined as the fun and pleasure from enjoying mobile technology in learning mathematics, strongly predicted Turkish high school students’ intentions and actions in learning mathematics (Açıkgül and Şad, 2021). Our results further align with Dias and Victor (2022), who showed positive learning outcomes from students’ PMDs use in classrooms. Zogheib and Daniela (2021) demonstrated a positive relationship between students’ PMD use, such as cell phones, and their perception of their impact on academic performance. Additionally, Kemp et al. (2024) analysed the relationship between the 2022 Programme for International Student Assessment (PISA) results and non-mobile phone use among students in schools. Their results revealed a negative relationship between phone bans in schools and student academic achievement in mathematics, reading and science across 81 member countries of the Organisation for Economic Cooperation and Development. Therefore, results from approximately 700,000 students worldwide showed that countries with bans on students’ use of PMDs such as mobile phones in schools, tend to have lower PISA scores (Kemp et al., 2024). Their results further demonstrated that when schools ban mobile phones on their premises, students’ average scores in mathematics, reading, and science decline by approximately 9.1 points (Kemp et al., 2024).
Some time ago, all technology was claimed to offer only a ‘glitter effect’. Yet, some researchers argue that this ‘glitter effect’ might be precisely what is needed to motivate slightly reluctant students to start studying. PMDs could serve as the starting point for them to feel motivated in their studies. In a comparable study, Curto Prieto et al. (2019) evaluated the online application Kahoot, which enables students to respond to online tasks created by the teacher through mobile devices and to check their results instantly. Their findings revealed highly positive benefits for mathematics and science learning, highlighting the potential of online learning with PMDs in classrooms. In the studies conducted by Taleb et al. (2015), students positively evaluated the effect of mobile devices on their mathematics learning. This agreement in results of various research globally suggests that students’ intentions to learn mathematics with PMDs are influenced by their positive perceptions of PMD usefulness for learning mathematics and other subjects in school. Despite the potential benefits, the use of students’ PMDs in Namibian schools has not been formally introduced. The government through the Ministry of Education Arts and Culture is expected to provide mobile devices and computers for information communication technology integration across curricular subjects, but prior research (Waiganjo, 2021; Nkengbeza et al., 2022; Ndjukuma and Haufiku, 2023) has shown shortage of these devices in schools. Though students possess their own PMDs, they are not permitted to use them within school premises (Osakwe et al., 2017; Jatileni et al., 2023). Based on the findings of this study and previous research, this research seeks to leverage student owned PMDs to supplement the limited availability of devices in government schools. If PMDs prove useful, students are more likely to advocate for BYOD in mathematics learning.
The third objective of the study was to test multigroup invariances between students and teachers regarding students’ mathematics learning with PMDs in schools, leading to the formulation of the third research question aimed at identifying invariances between student and teacher groups. We analysed whether students and teachers assessed PU and BI factors similarly, testing for measurement invariance in these factors across both groups in the context of students’ mathematics learning with PMDs in school. The goal was to identify differences in how students and teachers perceive the usefulness of PMDs for students’ mathematics learning in a BYOD school setting. Within the same research question, we also explored variances in how students intend to learn mathematics with PMDs through BYOD, compared to teachers’ intentions in facilitating this learning process. In a similar study, Teo (2019) utilised multigroup CFA to evaluate students’ and teachers’ intentions to use technology in education. Their results demonstrated the validity of six variables, including PU and BI, in explaining intentions to use technology in education for both student and teacher groups in a South-East Asian country. Correspondingly, their multigroup CFA results provided support for configural and metric invariance as well as scalar invariance in their data, mirroring our study’s outcomes.
Our results indicate that both students and teachers evaluated the PU and BI factors’ structures similarly regarding students’ mathematics learning with PMDs in school. These results indicate that both groups recognised the PMDs’ usefulness and convenience in making mathematics learning easier, saving time and contributing to achieving better results in mathematics. Similarly, Jarry (2024) observed a consistent evaluation of PU and BI in the adoption and utilisation of Google Classroom for learning among both students and teachers in an Indian private higher educational institution in Greater Noida. In addition, Mutambara and Bayaga (2020) found a non-statistically significant difference between students’ and teachers’ assessment of PU and BI among other factors on the use of mobile learning for STEM subjects. This alignment in perceptions between students and teachers regarding the PU and BI factor items supports the reliability and validity of the measures in capturing participants’ shared understanding of the effectiveness of PMDs in mathematics education.
In addition, our findings add to Dias and Victor’s (2022) study, which revealed that students and teachers are equally optimistic about the impact of PMDs use on student motivation, communication, collaboration and research abilities. The results further indicate that students’ intentions to learn mathematics with PMDs align with teachers’ intentions to facilitate this learning process. Both groups shared intentions related to PMDs’ efficacy in improving students’ mathematics results. Teachers aim to increase students’ PMD usage in alignment with classroom tasks, and their intentions to allow students to access the school’s Internet for learning mathematics align with students’ intentions to use the school’s Wi-Fi for mathematics learning. Furthermore, the results confirm that both groups intend to recommend PMDs for effective mathematics learning to their friends and colleagues. Arthur-Nyarko et al. (2020) highlight the potential of PMD usage in education generally, suggesting BYOD policies as a solution for overcoming challenges like limited access and high costs of the Internet.
The final objective of this study was to compare the structural parameters of the model between the student and teacher groups. This involved examining the overall structural relationships between the PU and BI factors by assessing whether the means of these factors were equivalent across the student and teacher groups regarding students’ mathematics learning with PMDs in school. Based on this objective, the fourth research question compared the students’ and teachers’ latent means to estimate the group of participants that had stronger PU and or BI. Like descriptive means that summarised and compared the central tendencies of PU and BI within our participant groups, latent means of the PU factor indicated teachers’ significantly lower perceptions of students’ PMDs’ usefulness for mathematics learning in school compared to students’ perceptions. Likewise, teachers have shown significantly lower intentions towards students learning mathematics with PMDs in school when compared to students’ intentions. This implies that although PU significantly predicted students’ and teachers’ BI and that both groups assessed PU and BI similarly, students highly anticipated learning mathematics with PMDs in school. Teachers value PMDs’ usefulness and are willing to permit their use for students’ mathematics learning in schools. However, they may feel unprepared to effectively facilitate lessons in which students are learning mathematics with PMDs.
In their study, Taleb et al. (2015) found that teachers perceive that mobile devices positively motivate students to learn mathematics. Thus, participating teachers in their study showed a strong interest in integrating mobile technology into mathematics education. However, our findings are different from Mutambara and Bayaga’s (2020), whose results showed no significant difference between students and teachers on factors such as PU that predict BI to adopt and use mobile learning in STEM subjects. The inconsistency in results is attributed to what Müller and Leyer (2023) termed the intention–behaviour gap. They identified this gap in teachers’ intention to integrate digital elements into teaching, highlighting that while teachers may value the usefulness and express intentions to use mobile devices in teaching, they may not align their actions with these intentions. Teachers can simultaneously believe in the usefulness of PMDs for mathematics learning while acknowledging the challenges associated with controlling their use in the classroom (Jatileni et al., 2023). Teachers are perhaps more willing to abandon the use of PMDs against the interest of students due to their uncertainty about its benefits to mathematics education. Therefore, providing teachers with opportunities to familiarise themselves with PMDs is crucial for effective implementation in teaching, as efforts to become familiar with digital elements significantly impact actual usage (Müller and Leyer, 2023).
This study offers implications and recommendations for educators, policymakers and educational administrators to gauge the impact of students’ PMD use on mathematics academic performance. It explored the feasibility of implementing BYOD initiatives and policies as technological pathways to support PMDs enhanced mathematics learning in schools. The findings are crucial to all education stakeholders, providing an enhanced understanding of how PMDs are perceived by students and teachers. The study further highlights potential disparities in students’ and teachers’ perceptions of PMDs usefulness and intentions in mathematics classrooms. Based on the main findings, we recommend that mathematics teachers familiarise themselves with technological tools, including PMDs, educational software and the Internet. Additionally, they should focus on enhancing their intentions and knowledge to effectively integrate PMDs into mathematics teaching. In-service teachers may enrol themselves in courses that offer training programmes that cover topics like digital safety, information literacy and the responsible use of technology in mathematics teaching. This will help mathematics teachers learn how to leverage technology for active learning by designing engaging lessons and facilitating collaborative problem-solving using PMDs as digital tools.
Teacher training institutions should ensure that mathematics teachers receive training in integrating different technologies into their teaching practices. This includes the effective use of PMDs in mathematics classrooms as adaptive learning tools that personalise instruction based on student needs. Future teachers should be familiarised with mathematics educational applications such as Kahoot, interactive software and online resources that can enhance teaching and learning. To maximise PMD effectiveness, we recommend that Ministries of Education empower teachers by providing them with access to digital learning materials and necessary training on how PMDs can be integrated into teaching different mathematics topics. Additionally, Ministries of Education worldwide should promote digital education by providing schools with electricity and Wi-Fi connections that would enable teachers to effectively integrate PMDs use into mathematics learning. Ministries of Education, through regional directorates, should encourage teachers’ intentions to integrate PMDs by facilitating continuous professional development channels for training and sharing experiences and best practices. For countries without a BYOD policy for education, their educational policymakers should consider developing a national BYOD policy for basic education as a guide for implementing BYOD in mathematics classrooms.
This study acknowledges the theoretical and practical limitations. While PU is a stronger predictor of BI, other factors, such as PEOU and attitudes, are essential components of the TAM framework but were not part of this study. Future studies in the context of PMDs use in mathematics classrooms could assess both PU and PEOU abilities to predict students’ and teachers’ BI. Future studies on PMDs in mathematics classrooms may investigate how PU and PEOU factors predict students’ and teachers’ BI, mediated by attitude, to provide valuable insights. Considering all TAM factors together can yield a comprehensive understanding of teachers’ and students’ intentions. Furthermore, examining both PU and PEOU helps identify potential barriers and facilitators to PMDs use in mathematics classrooms. Additionally, assessing all TAM factors together can help predict whether the participants intend to use PMDs in mathematics classrooms based on their attitudes, as attitude plays a crucial role in shaping BI. Practically, the participants in this study did not experience BYOD in mathematics classrooms. Future research could explore TAM factors among students and teachers who already use PMDs in mathematics classrooms.
Ultimately, our participants formed only a limited number of students and teachers from two out of 14 educational regions in Namibia. Generalising their views to the entire Namibian student and mathematics teacher population may not be accurate. Future research should expand the study context to other parts of the world where students are not permitted to use PMDs in schools to enhance the robustness of the topic and enable comparison across diverse educational systems and cultures. The study should further be expanded to include views from various educational stakeholders regarding students bringing their PMDs to school to offer a holistic understanding of the topic. Future research should investigate how teachers perceive PMD usefulness aligns with mathematics educational goals, and potential challenges to inform BYOD policy decisions. Finally, future research on this topic should explore both the advantages (bridging theoretical concepts with practical applications) and potential drawbacks (such as distractions or inequities) associated with students bringing their PMDs to school.
The raw data supporting the conclusions of this article will be made available by the authors, without undue reservation.
CJ: Conceptualization, Data curation, Formal analysis, Funding acquisition, Investigation, Methodology, Project administration, Resources, Software, Validation, Visualization, Writing – original draft. SH-N: Conceptualization, Investigation, Methodology, Project administration, Resources, Software, Supervision, Validation, Visualization, Writing – review & editing, Writing – original draft, Formal analysis. SP: Conceptualization, Investigation, Methodology, Project administration, Resources, Supervision, Validation, Visualization, Writing – review & editing. JK: Conceptualization, Formal analysis, Investigation, Methodology, Resources, Software, Supervision, Validation, Visualization, Writing – review & editing, Project administration.
The author(s) declare financial support was received for the research, authorship, and/or publication of this article. This research is supported by funding for early-stage doctoral researchers at the School of Applied Educational Science and Teacher Education within the Philosophical Faculty at the University of Eastern Finland. The funding aims to provide financial support for the doctoral student’s dissertation work.
The authors acknowledge the Ministry of Education, Arts, and Culture in Namibia for granting permission to conduct this research. Acknowledgements also go to the Khomas and Omusati Regional Directorates for granting us permission to gather data from students and teachers in their respective regions. We appreciate the students and mathematics teachers for their valuable time and participation in this research. Finally, our gratitude extends to the University of Eastern Finland for funding this research through its early-stage researcher doctoral programme in educational studies.
The authors declare that the research was conducted in the absence of any commercial or financial relationships that could be construed as a potential conflict of interest.
All claims expressed in this article are solely those of the authors and do not necessarily represent those of their affiliated organizations, or those of the publisher, the editors and the reviewers. Any product that may be evaluated in this article, or claim that may be made by its manufacturer, is not guaranteed or endorsed by the publisher.
Abidin, Z., and Saputro, T. M. E. (2020). Google classroom as a mathematics learning space: potentials and challenges. J. Phys. Conf. Ser. 1567:022094. doi: 10.1088/1742-6596/1567/2/022094
Abubakar, A., van de Vijver, F., Alonso-Arbiol, I., He, J., Adams, B., Aldhafri, S., et al. (2016). Measurement invariance of the brief multidimensional Student’s life satisfaction scale among adolescents and emerging adults across 23 cultural contexts. J. Psychoeduc. Assess. 34, 28–38. doi: 10.1177/0734282915611284
Açıkgül, K., and Şad, S. N. (2021). High school students’ acceptance and use of mobile technology in learning mathematics. Educ. Inf. Technol. 26, 4181–4201. doi: 10.1007/s10639-021-10466-7
Adipat, S., Laksana, K., Busayanon, K., Asawasowan, A., and Adipat, B. (2021). Engaging students in the learning process with game-based learning: the fundamental concepts. Int. J. Technol. Educ. 4, 542–552. doi: 10.46328/ijte.169
Adov, L., Pedaste, M., Leijen, Ä., and Rannikmäe, M. (2020). Does it have to be easy, useful, or do we need something else? STEM teachers’ attitudes towards mobile device use in teaching. Technol. Pedagog. Educ. 29, 511–526. doi: 10.1080/1475939x.2020.1785928
Al-Adwan, A. S., Li, N., Al-Adwan, A., Abbasi, G. A., Albelbisi, N. A., and Habibi, A. (2023). Extending the technology acceptance model (TAM) to predict university students’ intentions to use Metaverse-based learning platforms. Educ. Inf. Technol. 28, 15381–15413. doi: 10.1007/s10639-023-11816-3
Al-alami, A. M., and Alhamami, M. (2024). Saudi K-12 teachers’ views on English teaching using technology. English Learn. Innov. 5, 38–52. doi: 10.22219/englie.v5i1.31613
Alkindi, M. Z. H., Hafiz, A. D., Abulibdeh, E., Almurshidi, G., and Abulibdeh, A. (2022). Moderating effect of faculty status in the relationship between attitude, perceived usefulness, perceived ease of use, behavioral intention, subjective norms on mobile learning applications. J. Positive Sch. Psychol. 6, 5359–5379.
Arifjanova, O. (2022). Byod (bring your own device) technology and mobile learning in teaching languages. Acad. Res. Educ. Sci. 3, 1102–1105. doi: 10.24412/2181-1385-2022-5-1102-1105
Arthur-Nyarko, E., Agyei, D. D., and Armah, J. K. (2020). Digitizing distance learning materials: measuring students’ readiness and intended challenges. Educ. Inf. Technol. 25, 2987–3002. doi: 10.1007/s10639-019-10060-y
Attard, C., and Holmes, K. (2019). Technology-Enabled Mathematics Education: Optimising Student Engagement : Routledge, 1–11.
Budiarto, M. K., Gunarhadi, G., and Rahman, A. (2024). Technology in education through mobile learning application (MLA) and its impact on learning outcomes: literature review. J. Educ. Learn. 18, 413–420. doi: 10.11591/edulearn.v18i2.20976
Byrne, B. M. (2016). Structural Equation Modeling with Amos: Basic Concepts, Applications, and Programming. 3rd Edn. Routledge.
Camilleri, M. A., and Camilleri, A. (2017). Measuring the Educators' Behavioural Intention, Perceived Use and Ease of Use of Mobile Technologies. In 31st Annual Conference of the British Academy of Management, Conference Proceedings.
Chatterjee, S., Majumdar, D., Misra, S., and Damaševičius, R. (2020). Adoption of mobile applications for teaching-learning process in rural girls’ schools in India: an empirical study. Educ. Inf. Technol. 25, 4057–4076. doi: 10.1007/s10639-020-10168-6
Chechan, B., Ampadu, E., and Pears, A. (2023). Effect of using Desmos on high school students’ understanding and learning of functions. Eurasia J. Math. Sci. Technol. Educ. 19:em2331. doi: 10.29333/ejmste/13540
Cheung, G. W., and Rensvold, R. B. (2002). Evaluating goodness-of-fit indexes for testing measurement invariance. Struct. Equ. Model. Multidiscip. J. 9, 233–255. doi: 10.1207/s15328007sem0902_5
Chirimbana, M., Nghipandulwa, L. T., and Kamati, F. N. (2022). An investigation of the factors that contribute to poor problem-solving skills in grade 8 mathematics learners in Namibia. Open J. Soc. Sci. 10, 614–628. doi: 10.4236/jss.2022.1012042
Collier, J. E. (2020). Applied Structural Equation Modeling Using AMOS: Basic to Advanced Techniques : Taylor and Francis.
Cóndor-Herrera, O., and Ramos-Galarza, C. (2021). “E-learning and M-learning technological intervention in favor of mathematics” in Learning and Collaboration Technologies: New Challenges and Learning Experiences. HCII 2021. Lecture Notes in Computer Science. eds. P. Zaphiris and A. Ioannou, vol. 12784 (Cham: Springer), 401–408.
Curto Prieto, M., Orcos Palma, L., Blázquez Tobías, P., and León, F. (2019). Student assessment of the use of Kahoot in the learning process of science and mathematics. Educ. Sci. 9:55. doi: 10.3390/educsci9010055
Davis, F. D. (1989). Perceived usefulness, perceived ease of use, and user acceptance of information technology. MIS Q. Manag. Inform. Syst. 13, 319–340. doi: 10.2307/249008
Davis, F. D., Bagozzi, R. P., and Warshaw, P. R. (1989). User acceptance of computer technology: a comparison of two theoretical models. Manag. Sci. 35, 982–1003. doi: 10.1287/mnsc.35.8.982
Davis, F. D., Bagozzi, R. P., and Warshaw, P. R. (1992). Extrinsic and intrinsic motivation to use computers in the workplace 1. J. Appl. Soc. Psychol. 22, 1111–1132. doi: 10.1111/j.1559-1816.1992.tb00945.x
Davis, F. D., Granić, A., and Marangunić, N. (2023). The technology acceptance model 30 years of TAM. Technology 1, 1–150.
Department for Education [DfE]. (2023). Mobile Phone Use to Be Banned in Schools in England. Available at: https://www.gov.uk/government/news/mobile-phone-use-to-be-banned-in-schools-in-england (Accessed October 2, 2023). [Press Release].
Dias, L., and Victor, A. (2022). Teaching and learning with mobile devices in the 21st century digital world: benefits and challenges. Eur. J. Multidiscip. Stud. 5, 339–334. doi: 10.26417/ejms.v5i1.p339-344
Diharto, S. P., Radite, R., Inayah, I. Z., and Andayani, S. (2024). Study of the effect of mobile learning for mathematics understanding in middle school. AIP Conf. Proce. 2622. doi: 10.1063/5.0133802
Dubey, P., and Sahu, K. K. (2021). Students’ perceived benefits, adoption intention and satisfaction to technology-enhanced learning: examining the relationships. J. Res. Innov. Teach. Learn. 14, 310–328. doi: 10.1108/jrit-01-2021-0008
Fabian, K., Topping, K. J., and Barron, I. G. (2018). Using mobile technologies for mathematics: effects on student attitudes and achievement. Educ. Technol. Res. Dev. 66, 1119–1139. doi: 10.1007/s11423-018-9580-3
Fundi, M., Sanusi, I. T., Oyelere, S. S., and Ayere, M. (2024). Advancing Ai Education: Assessing Kenyan in-Service Teachers’ Preparedness for Integrating Artificial Intelligence in Competence-Based Curricula.
Granić, A., and Marangunić, N. (2019). Technology acceptance model in educational context: a systematic literature review. Br. J. Educ. Technol. 50, 2572–2593. doi: 10.1111/bjet.12864
Gregorich, S. E. (2006). Do self-report instruments allow meaningful comparisons across diverse population groups? Med. Care 44, S78–S94. doi: 10.1097/01.mlr.0000245454.12228.8f
Hair, J. F., Hult, G. T. M., Ringle, C. M., Sarstedt, M., Danks, N. P., and Ray, S. (2021). Partial Least Squares Structural Equation Modeling (PLS-SEM) Using R: A Workbook Companion: Business. (Cham: Springer).
Halim, I. I. A., Buja, A. G., Idris, M. S. S., and Mahat, N. J. (2023). Implementation of BYOD security policy in Malaysia institutions of higher learning (MIHL): an overview. J. Adv. Res. Appl. Sci. Eng. Technol. 33, 1–14. doi: 10.37934/araset.33.2.114
Hamukwaya, S. T., and Ruttenberg-Rozen, R. (2022). Believing in your own abilities: what Namibian high school students experiencing mathematics difficulties can teach us. Can. J. Sci. Math. Technol. Educ. 22, 739–757. doi: 10.1007/s42330-023-00260-7
Hoi, V. N. (2020). Understanding higher education learners’ acceptance and use of mobile devices for language learning: a Rasch-based path modeling approach. Comput. Educ. 146:103761. doi: 10.1016/j.compedu.2019.103761
Hoi, V. N., and Mu, G. M. (2021). Perceived teacher support and students’ acceptance of mobile-assisted language learning: evidence from Vietnamese higher education context. Br. J. Educ. Technol. 52, 879–898. doi: 10.1111/BJET.13044
Hopkins, N., Tate, M., Sylvester, A., and Johnstone, D. (2016). Motivations for 21st century school children to bring their own device to school. Inf. Syst. Front. 19, 1191–1203. doi: 10.1007/s10796-016-9644-z
Jarry, P. D. (2024). Adoption and Use of Learning Management Systems among Teachers and Students in Higher Educational Institutions in Greater Noida.
Jatileni, C. N., Havu-Nuutinen, S., and Pöntinen, S. (2023). Namibian teachers’ behavioural intentions on students’ mathematics learning using their own devices. Eur. J. Math. Sci. Educ. 4, 253–268. doi: 10.12973/ejmse.4.4.253
Kaliisa, R., and Michelle, P. (2019). Mobile learning policy and practice in Africa: towards inclusive and equitable access to higher education. Australas. J. Educ. Technol. 35, 1–14. doi: 10.14742/ajet.5562
Kemp, P., Brock, R., and O’Brien, A. (2024). Mobile Phone Bans in Schools: Impact on Achievement : BERA Blog.
Kuleto, V., Ilić, M., Dumangiu, M., Ranković, M., Martins, O. M. D., Păun, D., et al. (2021). Exploring opportunities and challenges of artificial intelligence and machine learning in higher education institutions. Sustain. For. 13:10424. doi: 10.3390/su131810424
Milfont Taciano, L., and Fischer, R. (2010). Testing measurement invariance across groups: applications in cross-cultural research. Int. J. Psychol. Res. 3, 111–130. doi: 10.21500/20112084.857
Mkude, B., Mwila, P., and Ndomba, R. M. (2023). Stakeholders’ perceptions of modern technology usage in secondary schools in Mvomero District, Tanzania. Int. J. Educ. Dev. Using Inf. Commun. Technol. 19, 236–258.
Müller, W., and Leyer, M. (2023). Understanding intention and use of digital elements in higher education teaching. Educ. Inf. Technol. 28, 15571–15597. doi: 10.1007/s10639-023-11798-2
Murray, A., Luo, T., and Franklin, T. (2019). Embracing a technologically enhanced environment: teachers’ experience educating students in an always-on and connected BYOD classroom. Int. J. E-Learn. 18, 53–78.
Musarurwa, S., Gamundani, A. M., and Shava, F. B. (2019). An Assessment of BYOD Control in Higher Learning Institutions: A Namibian Perspective. 2019 IST-Africa Week Conference.
Mutambara, D., and Bayaga, A. (2020). Rural-based science, technology, engineering and mathematics teachers’ and learners’ acceptance of mobile learning. S. Afr. J. Inform. Manag. 22, 1–10. doi: 10.4102/sajim.v22i1.1200
Mutambara, D., and Bayaga, A. (2021). Determinants of mobile learning acceptance for STEM education in rural areas. Comput. Educ. 160:104010. doi: 10.1016/j.compedu.2020.104010
Naeini, F. H., and Krishnam, B. (2012). Usage pattern, perceived usefulness and ease of use of computer games among Malaysian elementary school students. Res. J. Appl. Sci. Eng. Technol. 4, 5285–5297.
Ndjukuma, I. N., and Haufiku, I. (2023). The implementation of information communication technology policy at three selected schools in Outjo circuit in the Kunene region, Namibia. J. Curriculum Indonesia 6, 184–194.
Nikolopoulou, K. (2020). Secondary education teachers’ perceptions of mobile phone and tablet use in classrooms: benefits, constraints and concerns. J. Comput. Educ. 7, 257–275. doi: 10.1007/s40692-020-00156-7
Nkengbeza, D., Mbuzi, D., and Chainda, A. M. (2022). Challenges faced by primary school English teachers in integrating Media Technology in the Teaching and Learning of English. Creat. Educ. 13, 1139–1153. doi: 10.4236/ce.2022.134071
Okyere-Kwakye, E., Nor, K. M., and Ologbo, A. C. (2016). Technology acceptance: examining the intentions of Ghanaian teachers to use computer for teaching. Afr. J. Library Arch. Inform. Sci. 26, 119–132.
Ortiz-López, A., Sánchez-Prieto, J. C., and Olmos-Migueláñez, S. (2024). Perceived usefulness of mobile devices in assessment: a comparative study of three technology acceptance models using PLS-SEM. J. New Appr. Educ. Res. 13, 1–23. doi: 10.1007/s44322-023-00001-6
Osakwe, J., Dlodlo, N., and Jere, N. (2017). Where learners’ and teachers’ perceptions on mobile learning meet: a case of Namibian secondary schools in the Khomas region. Technol. Soc. 49, 16–30. doi: 10.1016/j.techsoc.2016.12.004
Oyedoyin, M., Sanusi, I. T., and Ayanwale, M. A. (2024). Young children’s conceptions of computing in an African setting. Comput. Sci. Educ. 1–36, 1–36. doi: 10.1080/08993408.2024.2314397
Pramana, E. (2018). Determinants of the adoption of mobile learning systems among university students in Indonesia. J. Inform. Technol. Educ. Res. 17, 365–398. doi: 10.28945/4119
Putnick, D. L., and Bornstein, M. H. (2016). Measurement invariance conventions and reporting: the state of the art and future directions for psychological research. Dev. Rev. 41, 71–90. doi: 10.1016/j.dr.2016.06.004
Qi, C. (2019). A double-edged sword? Exploring the impact of students’ academic usage of mobile devices on technostress and academic performance. Behav. Inform. Technol. 38, 1337–1354. doi: 10.1080/0144929x.2019.1585476
Sijtsma, K., and Pfadt, J. M. (2021). Rejoinder: the future of reliability. Psychome. 86, 887–892. doi: 10.1007/s11336-021-09807-9
Supriyadi, E., and Kuncoro, K. S. (2023). Exploring the future of mathematics teaching: insight with ChatGPT. Union: Jurnal Ilmiah Pendidikan. Matematika 11, 305–316. doi: 10.30738/union.v11i2.14898
Taimalu, M., Luik, P., Kantelinen, R., and Kukkonen, J. (2021). Why they choose a teaching career? Factors motivating career choice among Estonian and Finnish student teachers. Trames J. Hum. Soc. Sci. 25:19. doi: 10.3176/tr.2021.1.02
Taleb, Z., Ahmadi, A., and Musavi, M. (2015). The effect of M-learning on mathematics learning. Procedia Soc. Behav. Sci. 171, 83–89. doi: 10.1016/j.sbspro.2015.01.092
Tan, Ş., and Pektaş, S. (2020). Examining the invariance of a measurement model by using the covariance structure approach. Int. J. Contemp. Educ. Res. 7, 27–39. doi: 10.33200/ijcer.756865
Teo, T. (2019). Students and teachers’ intention to use technology: assessing their measurement equivalence and structural invariance. J. Educ. Comput. Res. 57, 201–225. doi: 10.1177/0735633117749430
Umboh, D., Tarusu, D., Marini, A., and Sumantri, M. S. (2021). Improvement of student mathematics learning outcomes through Kahoot learning games application at elementary school. J. Phys. Conf. Ser. 1869:012124. doi: 10.1088/1742-6596/1869/1/012124
Venkatesh, V., and Davis, F. D. (2000). Theoretical extension of the technology acceptance model: four longitudinal field studies. Manag. Sci. 46, 186–204. doi: 10.1287/MNSC.46.2.186.11926
Venkatesh, V., Thong, J., and Xu, X. (2012). Consumer acceptance and use of information technology: extending the unified theory of acceptance and use of technology. MIS Q. 36:157. doi: 10.2307/41410412
Waiganjo, I. N. (2021). Teachers’ perceptions and use of information and communication technology in teaching and learning: Kadjimi circuit, Kavango west, Namibia. OALib 8, 1–21. doi: 10.4236/oalib.1107236
Wu, J., and Du, H. (2012). Toward a better understanding of behavioral intention and system usage constructs. Eur. J. Inf. Syst. 21, 680–698. doi: 10.1057/ejis.2012.15
Xu, S., and Zhu, S. (2020). Factors influencing K-12 teachers’ intention to adopt mobile devices in teaching. Comput. Sch. 37, 292–309. doi: 10.1080/07380569.2020.1830257
Yaniawati, P., Sari, N. M., Rokhmah, N., Fitri, N., and Hadiansyah, S. (2022). Development of M-learning teaching materials on trigonometric materials to improve mathematic connection ability. Formatif Jurnal Ilmiah Pendidikan MIPA 12:11998. doi: 10.30998/formatif.v12i2.11998
Yanuarto, W. N., Setyaningsih, E., and Umiatun, K. N. (2023). Kahoot! As a collaborative gamified mathematics learning platform for Indonesian junior school students. Al-Jabar Jurnal Pendidikan Matematika 14, 99–108. doi: 10.24042/ajpm.v14i1.16623
Yeng, E. (2023). The influence of teachers familiarity on competency in integrating instructional Technology in Mathematics Teaching. Int. J. Res. Innov. Soc. Sci. 7, 503–515. doi: 10.47772/ijriss.2023.70943
Zaied, A. N. H. (2012). An integrated success model for evaluating information system in public sectors. J. Emerg. Trends Comput. Inform. Sci. 3, 814–825.
Zakaria, M. I., Abdul Hanid, M. F., and Hassan, R. (2023). Combination of M-learning with problem based learning: teaching activities for mathematics teachers. Int. J. Interact. Mobile Technol. 17, 4–19. doi: 10.3991/ijim.v17i09.38663
Zheng, J., and Li, S. (2020). What drives students’ intention to use tablet computers: an extended technology acceptance model. Int. J. Educ. Res. 102:101612. doi: 10.1016/j.ijer.2020.101612
Keywords: behavioural intentions, mathematics, measurement invariance, mathematics learning, personal mobile devices, mathematics education
Citation: Jatileni CN, Havu-Nuutinen S, Pöntinen S and Kukkonen J (2024) Learning mathematics with personal mobile devices in school: a multigroup invariance analysis of acceptance among students and teachers. Front. Educ. 9:1425779. doi: 10.3389/feduc.2024.1425779
Edited by:
Heidi Kloos, University of Cincinnati, United StatesReviewed by:
Paitoon Paitoon, King Mongkut’s Institute of Technology Ladkrabang, ThailandCopyright © 2024 Jatileni, Havu-Nuutinen, Pöntinen and Kukkonen. This is an open-access article distributed under the terms of the Creative Commons Attribution License (CC BY). The use, distribution or reproduction in other forums is permitted, provided the original author(s) and the copyright owner(s) are credited and that the original publication in this journal is cited, in accordance with accepted academic practice. No use, distribution or reproduction is permitted which does not comply with these terms.
*Correspondence: Cloneria Nyambali Jatileni, Y2xvbmVyaWEuamF0aWxlbmlAdWVmLmZp
Disclaimer: All claims expressed in this article are solely those of the authors and do not necessarily represent those of their affiliated organizations, or those of the publisher, the editors and the reviewers. Any product that may be evaluated in this article or claim that may be made by its manufacturer is not guaranteed or endorsed by the publisher.
Research integrity at Frontiers
Learn more about the work of our research integrity team to safeguard the quality of each article we publish.