 Xin Wei
 Susu Zhang
 Jihong Zhang3
- 1Digital Promise, Learning Science Research, Washington, DC, United States
- 2Department of Psychology, University of Illinois, Urbana-Champaign, Champaign, IL, United States
- 3Department of Counseling, Leadership, and Research Methods, University of Arkansas, Fayetteville, AR, United States
Mental rotation (MR), a key aspect of spatial reasoning, is highly predictive of success in STEM fields. This study analyzed strategies employed by 27,600 eighth-grade students during a digital MR task from the 2017 National Assessment of Educational Progress (NAEP) in mathematics. Utilizing K-means cluster analysis to categorize behavioral and performance patterns, we identified four distinct profiles: Cognitive Offloaders (15% of the sample), Internal Visualizers (55%), External Visualizers (5%), and Non-Triers (25%). Cognitive Offloaders, skilled at minimizing cognitive load by eliminating incorrect options, demonstrated the highest MR accuracy rates at 45%. Internal Visualizers, relying less on digital tools and more on mental strategies, achieved robust performance with an average score of 38%. External Visualizers, despite their extensive use of assistive tools and greater time investment, scored an average of 36%. Non-Triers showed minimal engagement and correspondingly the lowest performance, averaging 29%. These findings not only underscore the diverse strategies students adopt in solving MR tasks but also emphasize the need for educational strategies that are tailored to accommodate different cognitive styles. By integrating MR training into the curriculum and enhancing teacher preparedness to support diverse learning needs, this study advocates for educational reforms to promote equitable outcomes in mathematics and broader STEM fields.
1 Introduction
Spatial ability, a pivotal component of human intelligence, is strongly linked to success in high-demand fields such as architecture, engineering, and science (Park et al., 2010; Thompson et al., 2013; Johnson and Moore, 2020). Central to spatial ability is mental rotation (MR)—the capacity to mentally manipulate spatial figures and accurately predict their appearance from different perspectives (Shepard and Metzler, 1971). Proficiency in MR enhances performance in geometry and overall math achievement (Frick, 2018; Young et al., 2018; Newcombe et al., 2019), correlating with a higher likelihood of pursuing Science, Technology, Engineering, and Math (STEM) careers (Shea et al., 2001; Wai et al., 2009). In the United States, where only 26% of eighth graders reached proficiency in mathematics in 2022 National Assessment of Educational Progress (NAEP), bolstering spatial abilities is seen as crucial for global competitiveness in STEM (NAEP, 2023).
Eighth grade is a transformative period for cognitive development, where abstract thinking, including spatial reasoning essential for advanced mathematics and science, becomes refined. Historically, U.S. education systems have not emphasized spatial abilities in curricula or assessments (Park et al., 2010). This oversight is more pronounced among underprivileged students, who often exhibit lower spatial skills, hindering their potential success in STEM fields (Gonthier, 2022). Recent educational shifts, recognizing the importance of spatial skills, have led to their integration into assessments like the 2017 digital NAEP. This assessment introduces universal design (UD) tools—such as color contrast adjustments, zoom functionalities, text-to-speech (TTS) options, digital scratchpads, equation editors, and calculators— that aid in evaluating spatial reasoning, providing a more inclusive and equitable testing environment.
The 2017 digital NAEP leverages advanced technology to gather detailed process data from a MR task, offering unprecedented insights into students’ problem-solving strategies. This study exploits these rich data to identify distinct MR strategy profiles among eighth graders, using cluster analysis to explore how students interact with digital tools and tasks. These profiles reveal diverse approaches to spatial tasks, underscoring the need for educational strategies that address varying cognitive styles.
Understanding these MR strategy profiles is crucial for tailoring educational practices and policies that support diverse learning needs. It informs the development of specific instructional strategies and teacher training programs aimed at enhancing spatial reasoning across diverse student groups. Ultimately, this research aims to influence curriculum development and educational policies to foster equitable and effective STEM education.
1.1 Theoretical framework
The theoretical underpinning of this study is grounded in cognitive psychology and Howard Gardner’s Multiple Intelligences Theory (Gardner, 1983), which identifies spatial intelligence as one of the several critical intelligences. This theory highlights the necessity of recognizing individual differences in spatial intelligence to understand the varied strategies students use in MR tasks. Emphasizing these differences enables educators to adopt more personalized teaching approaches, enhancing students’ learning outcomes in math and science.
Building on the theoretical framework that recognizes diverse cognitive strengths, we delve into the specific visualization strategies that students employ in MR tasks. Visualization plays a dual role in mathematical problem-solving, incorporating both internal and external processes.
1.2 Internal visualization
Visualization is crucial for mathematical problem-solving, encompassing both internal mental representations and external displays (Cohen and Hegarty, 2007). Internal visualization involves generating, manipulating, and transforming mental images to infer new information, a fundamental aspect of human intelligence essential for scientific discoveries and inventions (Hegarty, 2004). A seminal study by Shepard and Metzler (1971) on MR tasks illustrates the complexity of these cognitive processes, which involve visual imagery, mental representation, spatial transformation, and decision-making.
Research differentiates between individuals with high and low spatial abilities in their approach to MR tasks. Those with high spatial ability often use holistic strategies, swiftly alternating strategies based on object complexity, and exhibiting faster response times with unfamiliar objects (Bethell-Fox and Shepard, 1988; Wang and Carr, 2014). Conversely, individuals with low spatial ability tend to employ piecemeal strategies, requiring more time for encoding and rotating objects (Mumaw et al., 1984; Khooshabeh et al., 2013). Brain imaging studies confirm these differences, showing varied brain activity in these groups during MR tasks (Logie et al., 2011).
1.3 External visualization and universal design tools
External visualization includes visual–spatial displays, both static (e.g., drawings, graphs, charts) and dynamic (e.g., animations), and plays a critical role in scientific and mathematical problem-solving (Cohen and Hegarty, 2007). These tools support internal visualization by helping individuals create accurate mental representations of spatial relationships, though they do not replace the need for internal visualization capabilities (Hegarty, 2004).
In MR tasks, external visualization could involve using pen and paper to sketch objects being mentally manipulated or employing physical models like blocks or toys. The advent of digital technology has significantly expanded these methods, introducing interactive environments that enhance understanding of complex spatial relationships. For instance, iPad apps allow third graders to rotate MR stimuli using touch controls, and virtual reality environments provide immersive experiences that aid comprehension (Zander et al., 2016; Zhou et al., 2022).
Integrating UD principles, these visualization tools make spatial tasks accessible and engaging for all students, including those with learning difficulties. They allow for flexible interaction modes—visual, auditory, tactile, and kinesthetic—which cater to a variety of learning preferences and needs (Rose et al., 2016).
1.4 Cognitive load and universal design in MR tasks
While external visualization tools assist in spatial understanding necessary for MR tasks, it is crucial to consider how these tools interact with cognitive load theories to optimize learning environments. Cognitive load theory provides a framework for managing the mental effort required during learning activities (Sweller, 1988). In this context, the use of UD tools in MR tasks enhances accessibility and reveals the strategies students employ. Specifically, digital pencils or elimination tools effectively streamline visual processing, simplifying how visual information is interpreted and managed. This simplification is crucial in reducing the extraneous cognitive load that often accompanies complex visual tasks, thereby minimizing distractions and unnecessary cognitive effort. Additionally, features like text-to-speech provide essential auditory support, further aiding students who benefit from auditory learning cues. By reducing these cognitive burdens, such tools enable students to allocate more mental resources towards the core aspects of MR tasks—comprehending and manipulating spatial representations.
1.5 Existing approaches to understand MR strategies and their limitations
Identifying the adoption of strategies during MR tasks is inherently challenging. Traditional tests like the Vandenberg and Kuse Mental Rotations Tests and the German Cube Comparison Test only capture the final answers without revealing the cognitive steps leading to these responses. Researchers have employed four primary methods to uncover MR strategies. The most common method involves asking participants to report their strategies through surveys post-experiment (Khooshabeh et al., 2013; Wang and Carr, 2014). Another method is the think-aloud technique, where participants articulate their thought processes during the MR task (Taylor and Tenbrink, 2013). Eye-tracking technology analyzes eye movements to infer cognitive processing (Peters et al., 1995), while brain imaging studies locate active brain regions during MR tasks to identify engaged cognitive functions (Logie et al., 2011).
Each method, however, has its limitations. Surveys may suffer from response biases, leading to skewed or incomplete data. The think-aloud method is less effective with participants who are not verbally expressive or self-aware, potentially limiting the diversity of the study sample. Eye-tracking is resource-intensive and may exclude participants with physical limitations or discomfort, besides presenting challenges in data analysis due to its voluminous nature. Brain imaging requires costly, specialized equipment and expertise, restricting the scalability of research efforts.
1.6 Use process data to study MR strategies
Process data, or behavioral log data, offers a dynamic view of how students engage with MR tasks, contrasting with the static nature of traditional assessments. This approach not only fills a gap in existing research but also provides deeper insights into students’ cognitive strategies and problem-solving behaviors. Analyzing detailed interactions and timings helps uncover nuanced strategies, facilitating a more refined understanding of how students approach complex spatial problems.
Time on task correlates highly with a test-taker’s problem-solving process and performance, often following an inverted U-shape relationship (Goldhammer et al., 2014; Greiff et al., 2016). Examining the time to the first action in addition to the total time is also important because it measures the speed of problem-solving, reading the question, understanding the math question, and formulating the action plan before any actions are taken (Chen, 2020; Lundgren and Eklöf, 2020).
The observable actions from test-taking process data, such as test takers performing specific actions or utilizing UD tools, help infer aspects of a test taker’s problem-solving process and engagement. For instance, the digital scratchpad allows users to visually plot and manipulate data (Kwak and Gweon, 2019), which could aid in solidifying mental rotations and spatial reasoning. Similarly, TTS can help lessen the cognitive load by providing auditory reinforcements of visual information, which is particularly beneficial for students who struggle with visual–spatial tasks (Wei, 2024). NAEP usability study found UD tools reduce unnecessary cognitive strain, thereby allowing students to focus more on solving the problems presented (Way and Strain-Seymour, 2021).
Extending the analysis of process data to the realm of profiling, previous studies have shown that analyzing behavior sequences in terms of action patterns and time-on-task can help identify problem-solving strategies. For instance, Teig et al. (2020) used process data from the 2015 PISA to identify three student interaction profiles that reflect their science inquiry performance. Song (2021) reported four problem-solving profiles: inactive, struggling, proficient, and adaptive, based on process data from the Norwegian PISA 2012.
To date, no studies have examined MR strategy profiles using process data. This study utilizes a parsimonious set of theoretically and empirically supported time and action features as well as performance to identify student profiles emergent in a MR task. By leveraging the rich, process-oriented data from the 2017 NAEP, we seek to delineate clear, actionable profiles that can inform both current educational practices and future research directions in spatial cognition.
1.7 Research questions
This study aimed to answer the following research questions:
1. What are the unique student profiles of strategies employed to solve a MR problem?
2. How do test-taking behavior, MR problem-solving accuracy, and general math achievement differ across these profiles?
3. Are there differences in sociodemographic characteristics across these profiles?
2 Materials and methods
2.1 Data sources
The NAEP, a low-stakes assessment, evaluates student performance across various subjects, including mathematics, by employing a deeply stratified multistage cluster sampling technique. This approach ensures the representativeness of the selected schools and students from 6,500 schools, with a total of 144,900 students participating. For the students who were sampled to take NAEP math assessments, they engaged in two 30-min blocks of math assessments and a subsequent 15-min survey, all administered on tablets.
2.2 Study sample
The NAEP released restricted-use process data for two out of ten math item blocks from the 2017 assessment. This study analyzed the one block which has a larger sample size, involving 28,200 students, with the final analytical sample comprising 27,620 students. This group includes 1,530 students identified with learning disabilities, 150 with autism, 540 with other disabilities, and 25,400 from general education, all of whom worked on a MR item. Figure 1 shows the interface of the MR item. It is the 8th item on the test.
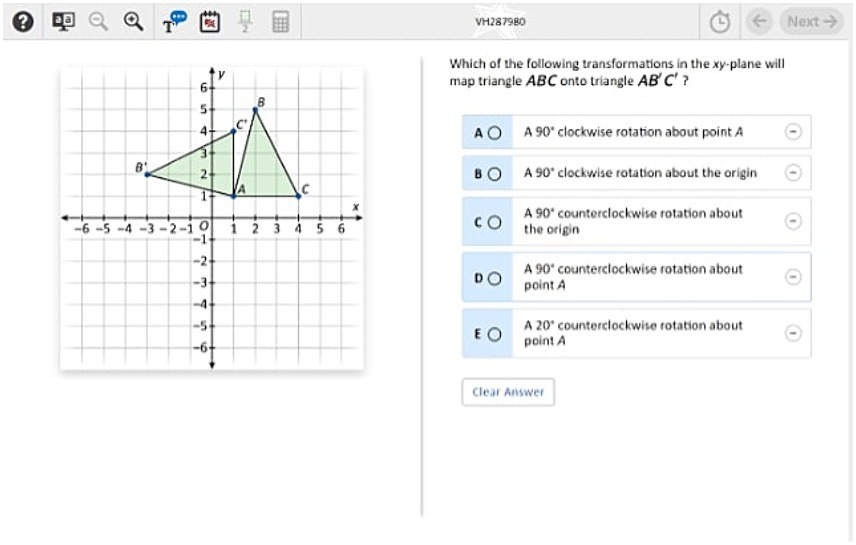
Figure 1. 2017 NAEP 8th Grade Mental Rotation Math Item 8. Source: https://nces.ed.gov/NationsReportCard/nqt/Search.
The restricted process data used in this study include response, process, and survey data. The response data recorded the students’ answers to each math item, while the process data documented the clicks, entries, and timestamps during students’ interactions with the test items. The survey data included demographic characteristics and responses to survey questions. This study utilized a rich dataset to analyze and compare time and action features during MR, MR accuracy, general math achievement, and student demographic characteristics.
2.3 Extract time and action features from process data
We extracted key time and action features based on an extensive literature review and expert review. Subject matter experts in cognitive science, math assessment, special education, and psychometrics collectively reviewed the MR item and process data to derive consensus-based categories of appropriate time and action features that measure the strategies used in MR.
2.4 Measures
2.4.1 Total time spent
The total time spent on the MR task variable is more complex than the commonly used “time on task,” as Goldhammer et al. (2014) defined, which only measures the time from task onset to task completion. In the NAEP math assessment, test takers can jump between items, including revisiting the same item multiple times. Therefore, the total time spent on the MR task is the cumulative time spent during each visit to the item across multiple attempts. This study uses the total time to measure a student’s engagement with the MR task as the sum of the time spent on initial attempts and subsequent revisits, measured in seconds.
2.4.2 Time to the first action
To calculate the time to first action, we measured the time in seconds from when a test-taker entered an item to the first logged action during their initial visit.
2.4.3 Number of visits
To assess the effort invested by each student in completing the MR task, we tallied the number of times a student visited the MR item, with visits lasting less than 3 s excluded. To differentiate between genuine problem-solving and repaid guessing, we followed the 3-s rule proposed by Kong et al. (2007). According to Kong et al. (2007), interactions with a math item that lasts less than 3 s are unlikely to involve significant cognitive engagement. This amount of time is insufficient for performing math operations. Such fleeting visits may be due to human errors, navigation to another question, blind guessing, or system errors. Since the frequency of visits is moderately and significantly correlated with performance (Bezirhan et al., 2021), this variable could help us distinguish between the MR strategies adopted by different students.
2.4.4 Number of times submitted answers
This variable tracks the total number of times an examinee submits an answer, including the initial attempt and subsequent revisions. This includes the initial answer and any changes made to the answer during the initial visit or revisits. For instance, if an examinee answers a question once without making any changes, the “number of times submitted answers” would be 1. However, if the examinee answers the question, then changes their answer, and later changes it back, the “number of times submitted answers” would be 3. Previous research suggests that high-ability examinees benefit from changing their answers, while low-ability examinees do not (McMorris et al., 1987).
2.4.5 UD tool use
The NAEP math test was administered on Microsoft Surface Pro tablets with an external keyboard, a stylus, and a pair of earbuds for audio. The equation editor and calculator are not available for this MR item. The study conducted a detailed analysis of the utilization of four most frequently used UD tools during MR tasks:
1. Drawing Tool Usage: This feature tracked the number of times students used the drawing tool, accessed by clicking the scratchwork icon on the upper left of the screen. The use of the digital pencil allows students to draw directly on the screen, aiding in the rotation of objects, such as a triangle. Usage was measured by counting the total instances of pencil use across all task sessions.
2. Eraser Utilization: This feature counted how often students erased their drawings or writings, reflecting adjustments or changes in strategy. It was quantified by the number of times the eraser tool was activated during the MR tasks.
3. TTS Tool Utilization: This measured the number of times students engaged the TTS tool to have the math item read aloud. Activation involved clicking the TTS icon, usually located on the upper left of the screen, and was recorded by counting each use across sessions.
4. Elimination of Answer Choices: This feature assessed the strategic elimination of answer choices by students, determined by the number of times the elimination icon next to each answer choice was clicked.
2.4.6 MR accuracy
This MR test item has a maximum score of 1 and a minimum score of 0. Incorrect responses are assigned a score of 0, and one correct answer is scored 1.
2.4.7 General math achievement
This math test includes a total of 15 test items, including questions about fractions, lines, shapes and rotations, the product of two two-digit decimals, x- and y-intercepts, circle graphs, box plots, stem-and-leaf plots, the diameter and circumference of circles, and the area of shapes. The total score, a summation of item-level scores across all 15 test items with a maximum score of 25, is included in the NAEP dataset. The total score is a measure of a student’s general math achievement.
2.4.8 Student demographic characteristics
The demographic variables used in this study to describe the student sample included the age of the student in years at the time of testing, gender, race/ethnicity (coded as four dichotomous variables for African American, Hispanic, white, or other, which includes Asian, American Indian, Pacific Islander, or multiple races), disability category, and free or reduced-price lunch status.
2.5 Statistical analysis
2.5.1 Descriptive analysis
All analyses used R version 4.1.0 (R Core Team, 2021). We describe the time and action features extracted from the process data, student performance, and demographic characteristics in Table 1.
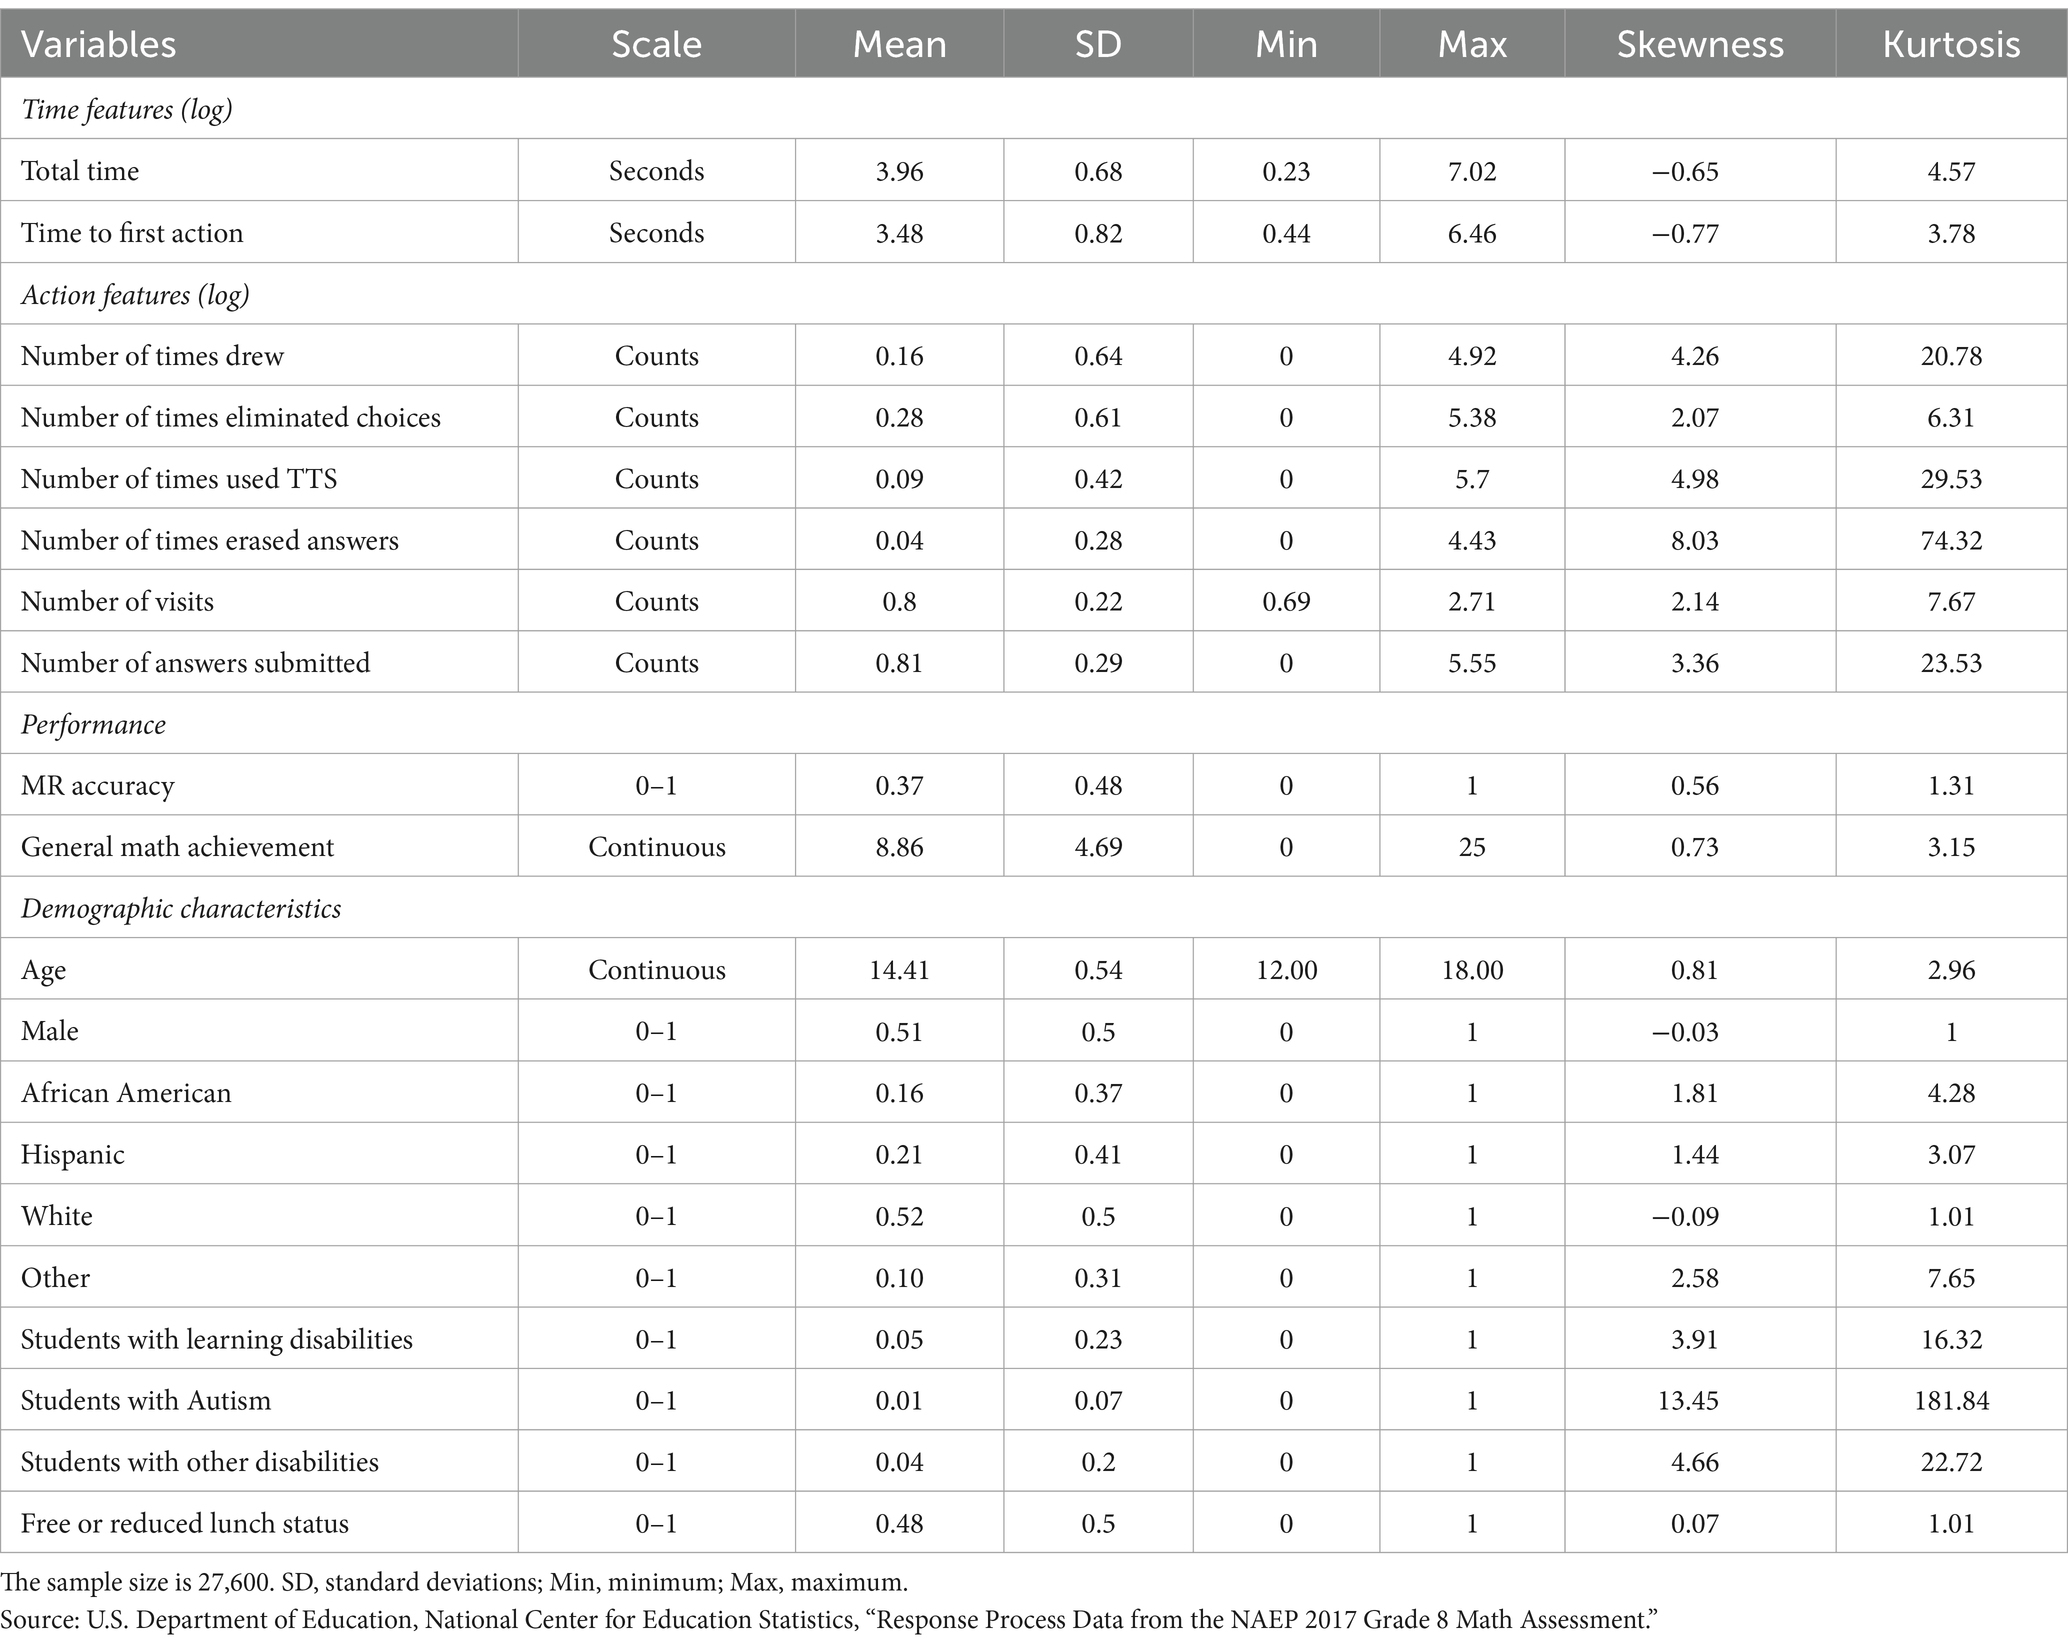
Table 1. Sample characteristics.
2.5.2 Cluster analysis
Using cluster analysis to identify student profiles has been well-documented in the literature (Wei et al., 2014; Stenlund et al., 2018; Lundgren and Eklöf, 2020). K-means cluster analysis procedures in R (cluster package, Maechler et al., 2021) were used to identify groups of students with typical time and action features solving the MR task. Individuals were clustered based on nine variables: eight time and action features extracted from the NAEP process data and the MR accuracy extracted from the NAEP response data. General math achievement and student demographic characteristics were not included in the cluster analysis. The clustering was conducted based on the Euclidean distances computed from nine variables. Observations close to each other were assigned to the same cluster, whereas those far away were assigned to different clusters. We used R package “cluster” for cluster analysis, ensuring reproducibility through detailed documentation of software versions.
2.5.2.1 Preprocessing details
Eight time and action features were log-transformed. Log Transformation reduces the influence of extreme values or outliers, which can disproportionately affect the mean and standard deviation of the data, thereby influencing the distance calculations in K-means. Eight log-transformed features and the MC accuracy variable were then normalized to a mean zero and standard deviation one before the cluster analyses. Normalization ensures that each feature has equal importance, preventing features with larger scales from overpowering those with smaller scales in the clustering process.
Cluster determination was guided by the elbow plot and silhouette plot methods to ascertain the optimal number of clusters. Both plots are crucial in justifying the number of clusters chosen, enhancing the validity of our clustering approach by aligning statistical evidence with the interpretative clarity of the resulting clusters.
2.5.2.2 Elbow plot
The elbow plot method involves plotting the within-cluster sum of squared errors (WSS) against different numbers of clusters (k). This graph helps identify the most appropriate number of clusters by pinpointing where the WSS begins to level off, forming an “elbow” (Kaufman and Rousseeuw, 2009). This point suggests that adding more clusters does not significantly improve the model’s fit. For this study, the elbow was observed at k = 4 (Figure 2), indicating that four clusters provided a reasonable trade-off between complexity and explanatory power, without overly fragmenting the data.
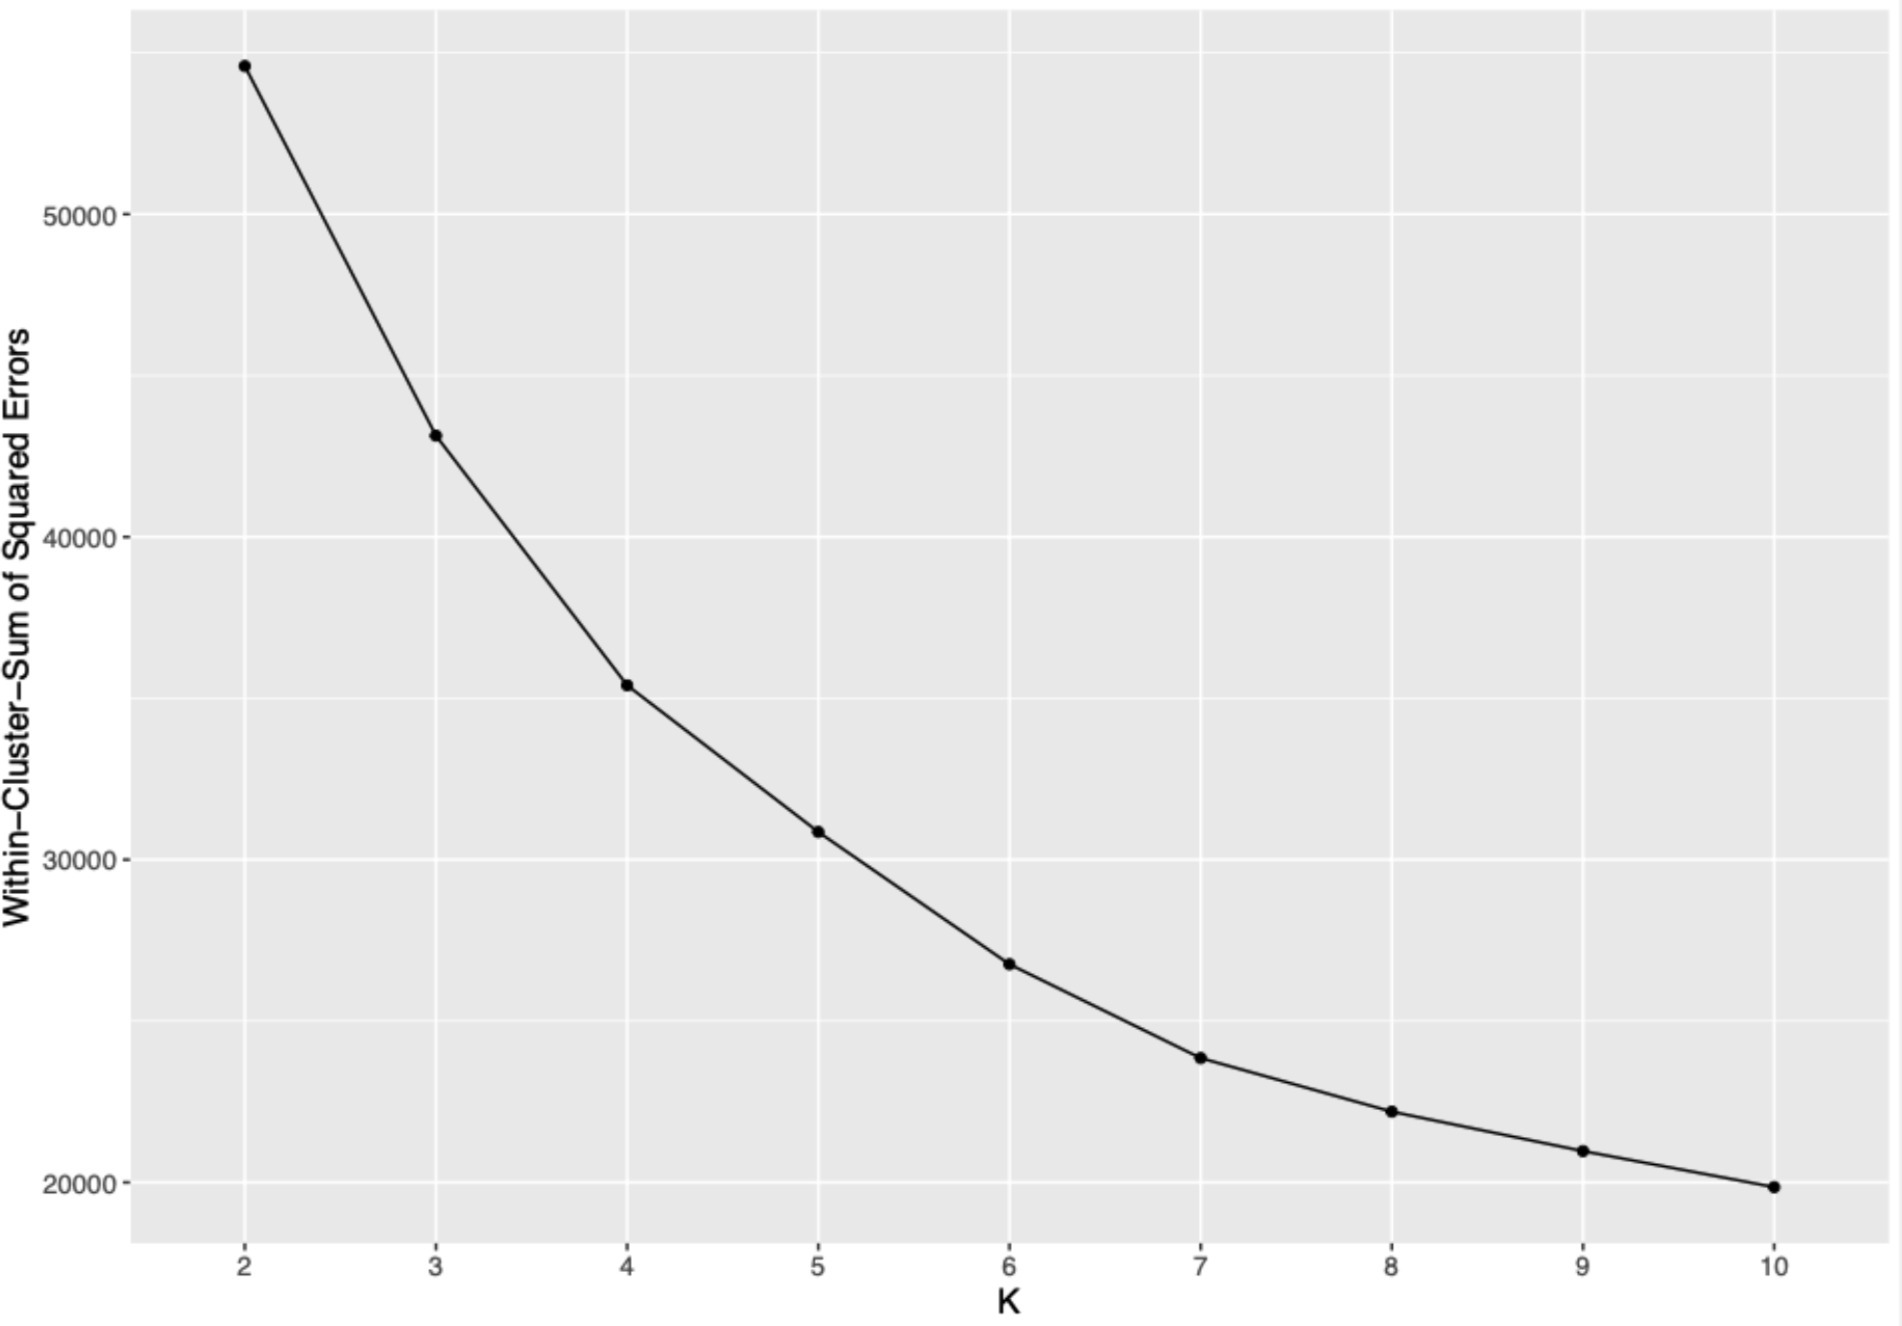
Figure 2. Elbow plot illustrating within-cluster sum of squared errors by number of clusters. This graph displays the decline in within-cluster sum of squared errors as the number of clusters increases, aiding in the selection of an optimal cluster count based on the “elbow” method. Source: U.S. Department of Education, National Center for Education Statistics, “Response Process Data from the NAEP 2017 Grade 8 Math Assessment.”
2.5.2.3 Silhouette plot
Complementing the elbow plot, the silhouette plot assesses the quality of clustering by measuring how similar each point is to its own cluster compared to other clusters. A silhouette value ranges from −1 to 1, where values closer to 1 indicate a clear distinction between clusters (Kaufman and Rousseeuw, 2009). Our analysis showed that at k = 4, the average silhouette score peaked, suggesting that the clusters are well separated and cohesive (Figure 3). This supported the decision to select four clusters, aligning with theoretical expectations and ensuring meaningful differentiation within the data.
Figure 3. Silhouette plot for determining optimal cluster number. This silhouette plot displays the coherence within clusters at varying numbers of clusters k from 2 to 10. A higher silhouette score indicates better-defined clusters. The plot highlights a peak at k = 4, suggesting optimal cluster separation at this configuration, thus guiding the selection of four clusters for analysis. Source: U.S. Department of Education, National Center for Education Statistics, “Response Process Data from the NAEP 2017 Grade 8 Math Assessment.”
2.5.2.4 Robustness check of cluster grouping
The sample was randomly divided into two equal halves, and separate cluster analyses were performed on each subset as well as on the entire sample. This approach involved several steps to verify the consistency and reliability of our findings:
1. Descriptive Comparison: We computed basic statistics such as mean, median, and standard deviation for key variables within each cluster across the half-samples and the full sample. This step helped assess whether the central tendencies and variability of the clusters were preserved across different subsets of the data. Our descriptive statistics show that the clusters are very similar across half-samples and the full sample, indicating consistent cluster characteristics regardless of the sample subset.
2. Visual Analysis: Scatter plots were utilized to visualize and compare the clustering configurations between each half-sample and the entire dataset. This visual inspection helped identify any discrepancies or anomalies in cluster formations across the splits. The plots revealed no significant visual discrepancies, suggesting that the clusters maintained their integrity across different data splits.
3. Quantitative Validation with ARI: The Adjusted Rand Index (ARI) was calculated to quantitatively measure the similarity between the cluster results obtained from each half and those from the full dataset. ARI values range from −1 to 1, where 1 denotes perfect agreement between two clusterings, 0 indicates no better agreement than chance, and values below 0 suggest less agreement than expected by chance. A value close to 0 would imply that the clusterings do not align better than random. To ensure the robustness and consistency of our clustering results, the dataset was randomly divided into two halves, and this 50/50 split process was repeated 100 times. The analyses of these 100 iterations yielded an average ARI value of 0.78, indicating a high level of similarity and affirming the reliability of our clustering approach.
2.5.2.5 Missing data handling
In our study, the missing data rates for the nine variables utilized in the cluster analysis were notably low, at 1%, and for other variables, at 3%. The primary cause of missingness in the time and action feature data stemmed from system anomalies that occasionally disrupted the data collection process. These incidents impacted only a very small proportion of subjects. Consequently, we employed a complete case analysis approach, which included only those students who had no missing data across all nine variables used in the cluster analysis.
2.5.3 Ethical considerations
Access to the restricted-use 2017 NAEP process data was secured through a comprehensive license application process overseen by the National Center for Education Statistics (NCES). The application included a detailed proposal that outlined our research objectives and the necessity of restricted data for these aims, a comprehensive data security plan, signed nondisclosure agreements by all team members, and mandatory annual training. Once approved, our team adhered to strict guidelines to ensure student privacy and data confidentiality, with NCES conducting regular compliance audits. Our protocols, under constant scrutiny, included operating within secured data environments and restricting data access exclusively to authorized personnel, thus protecting the sensitive demographic information of the students.
2.5.4 T-test to detect group differences
Statistical assumptions, including the assumption of normality required for t-tests, were thoroughly examined. To analyze variations among students in different clusters based on time, action, performance, and demographic characteristics, we employed independent sample t-tests.
Specifically, for the nine variables included in the cluster analysis, the t-tests were utilized to support interpretations of the clusters rather than for formal hypothesis testing. This approach underscores that our primary intent was interpretative rather than confirmatory.
For variables not involved in the cluster analysis, such as general math achievement (total score) and demographic variables, the application of t-tests serves to independently validate or explore associations with the clusters identified. This ensures that our findings are robust and provide meaningful insights into how these external variables correlate with the cluster patterns observed.
To rigorously control type I error rates, adjustments for multiple comparisons were made using the Bonferroni method. Specifically, the alpha value was set to 0.0083 to account for six pairwise comparisons per variable. Details of the significance levels are provided in the last column of Table 2.
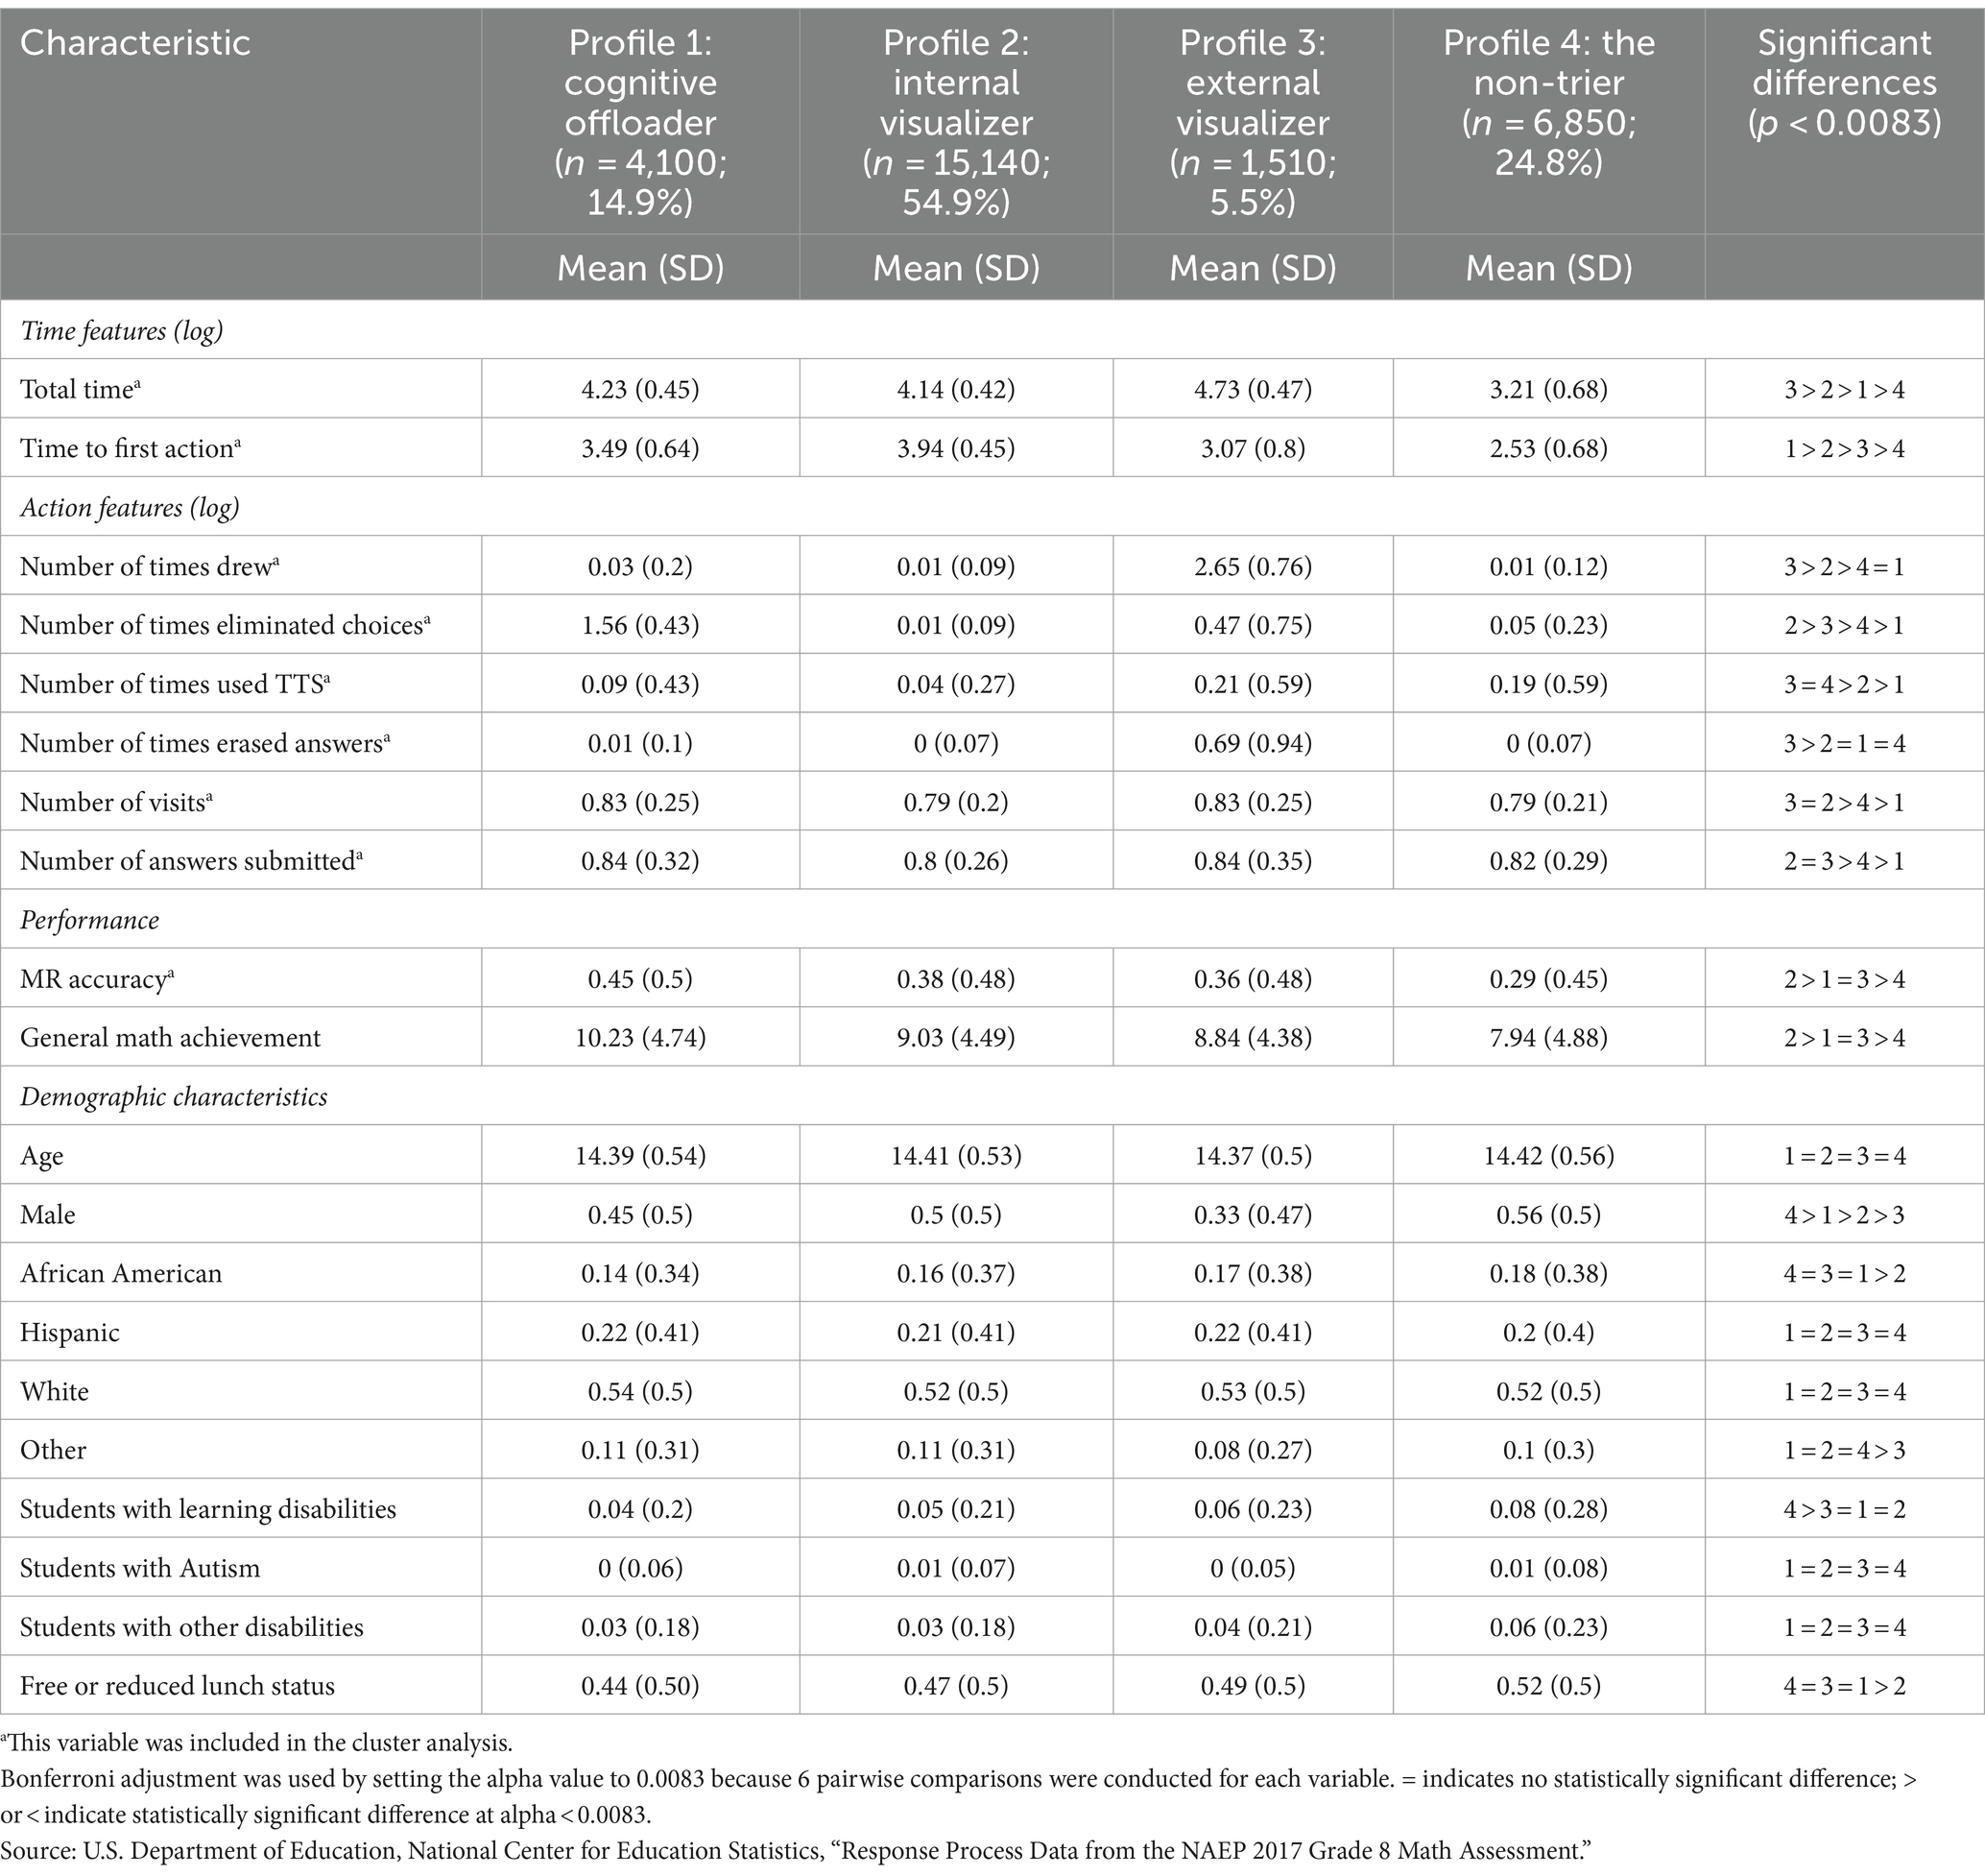
Table 2. Characteristics of students, by profiles.
3 Results
3.1 Four distinct student profiles in a MR task solving
Our analysis utilized both the elbow plot and the silhouette plot to determine the optimal number of clusters for classifying student strategies in mental rotation tasks. While the elbow plot (Figure 2) did not show a distinct elbow, a marked decrease in the WSS was noted at four clusters, indicating a substantial reduction in variance within each cluster beyond this point. Concurrently, the silhouette plot (Figure 3) demonstrated that the average silhouette widths reached their peak at four clusters, suggesting that this number of clusters best captured the distinct groupings within the data. These statistical indicators, coupled with theoretical expectations about diverse learning strategies in educational psychology, supported the selection of a four-cluster solution.
The detailed examination of the nine variables involved in the cluster analysis identified distinct profiles, each with unique approaches to the MR task. These profiles—cognitive offloaders, internal visualizers, external visualizers, and non-triers—constituted 15, 55, 5, and 25% of the sample, respectively. Their specific patterns in terms of time spent on tasks, action frequency, MR task performance, and demographic characteristics are summarized in Table 2 and depicted in Figures 4–6.
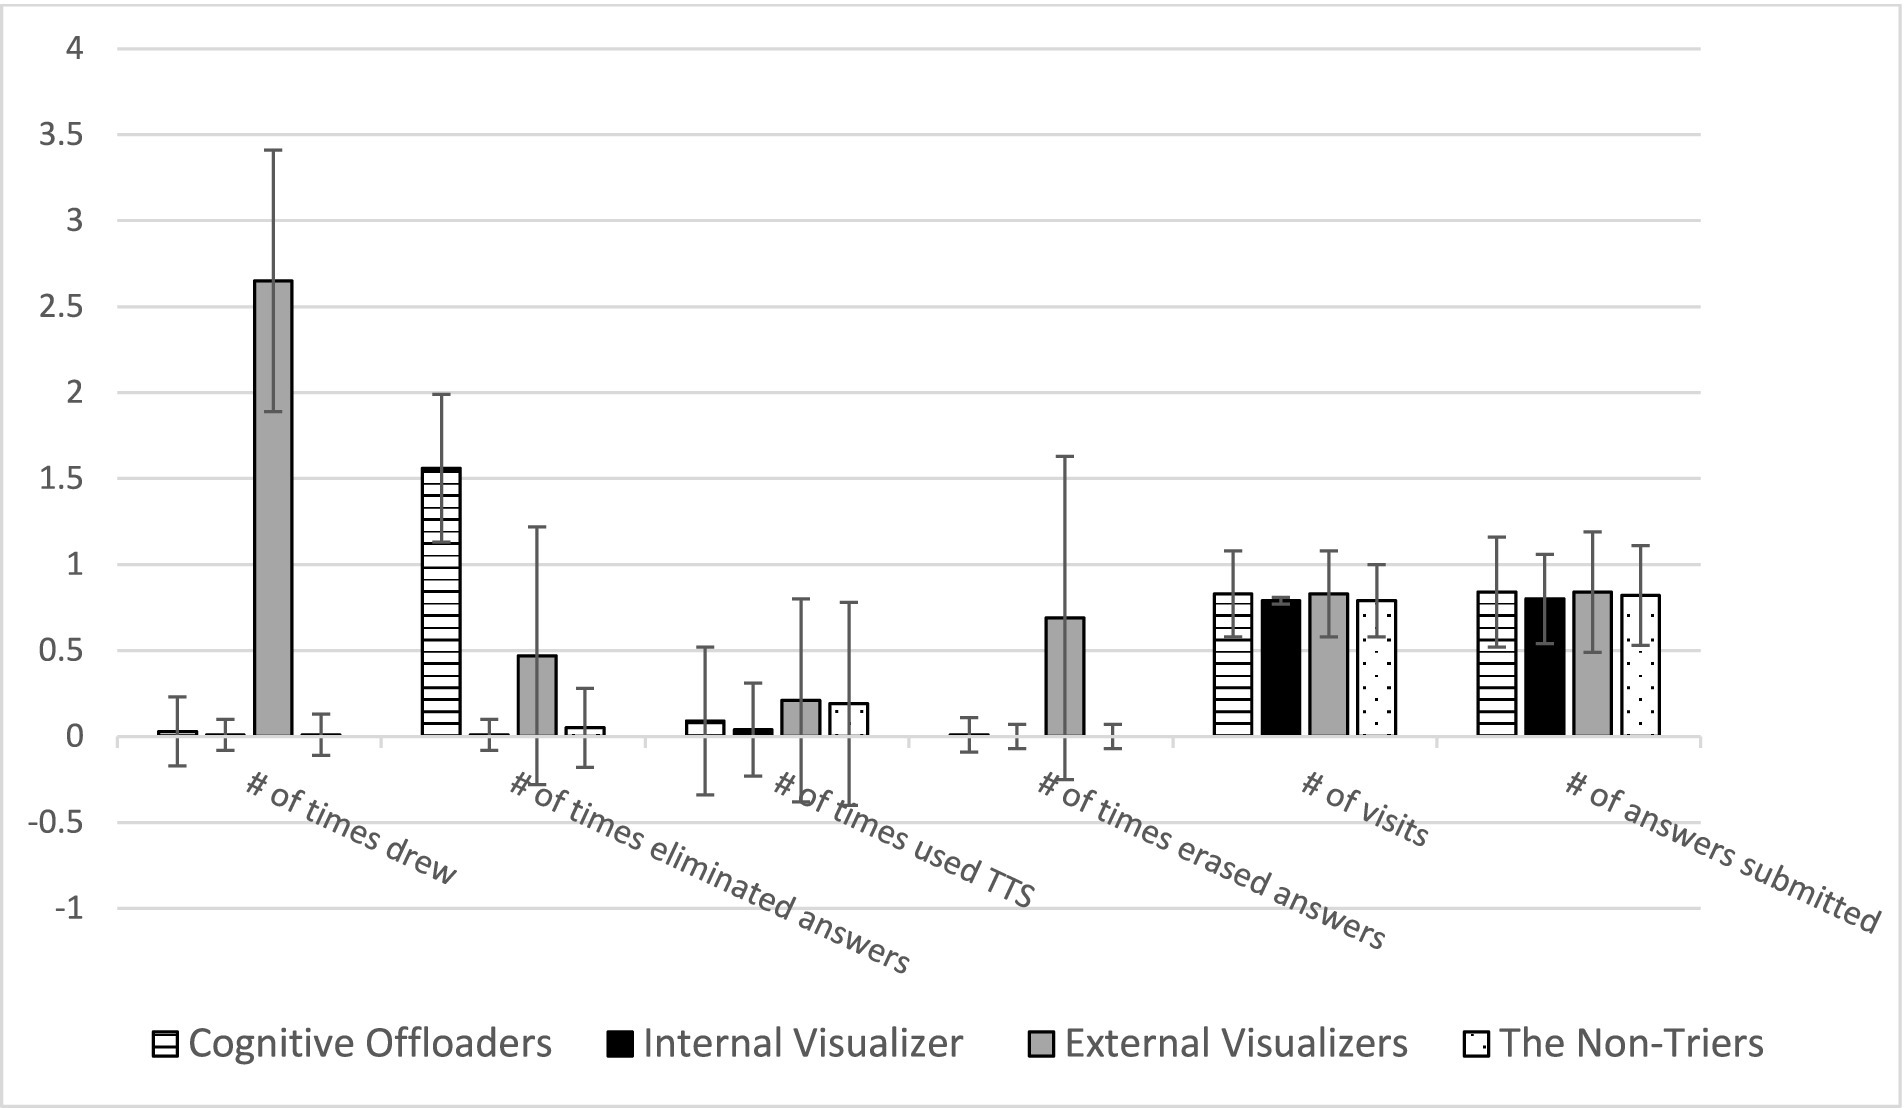
Figure 4. Mean and standard deviations of six action features across four student profiles. This figure presents the means and standard deviations of logged action features for four student profiles identified through cluster analysis. It highlights significant behavioral differences across the profiles during the MR task, such as the extensive use of drawing tools by External Visualizers and the frequent elimination of answer choices by cognitive offloaders. Such distinctions underscore the varied strategies employed by students to manage the task’s cognitive demands. Source: U.S. Department of Education, National Center for Education Statistics, “Response Process Data from the NAEP 2017 Grade 8 Math Assessment.”
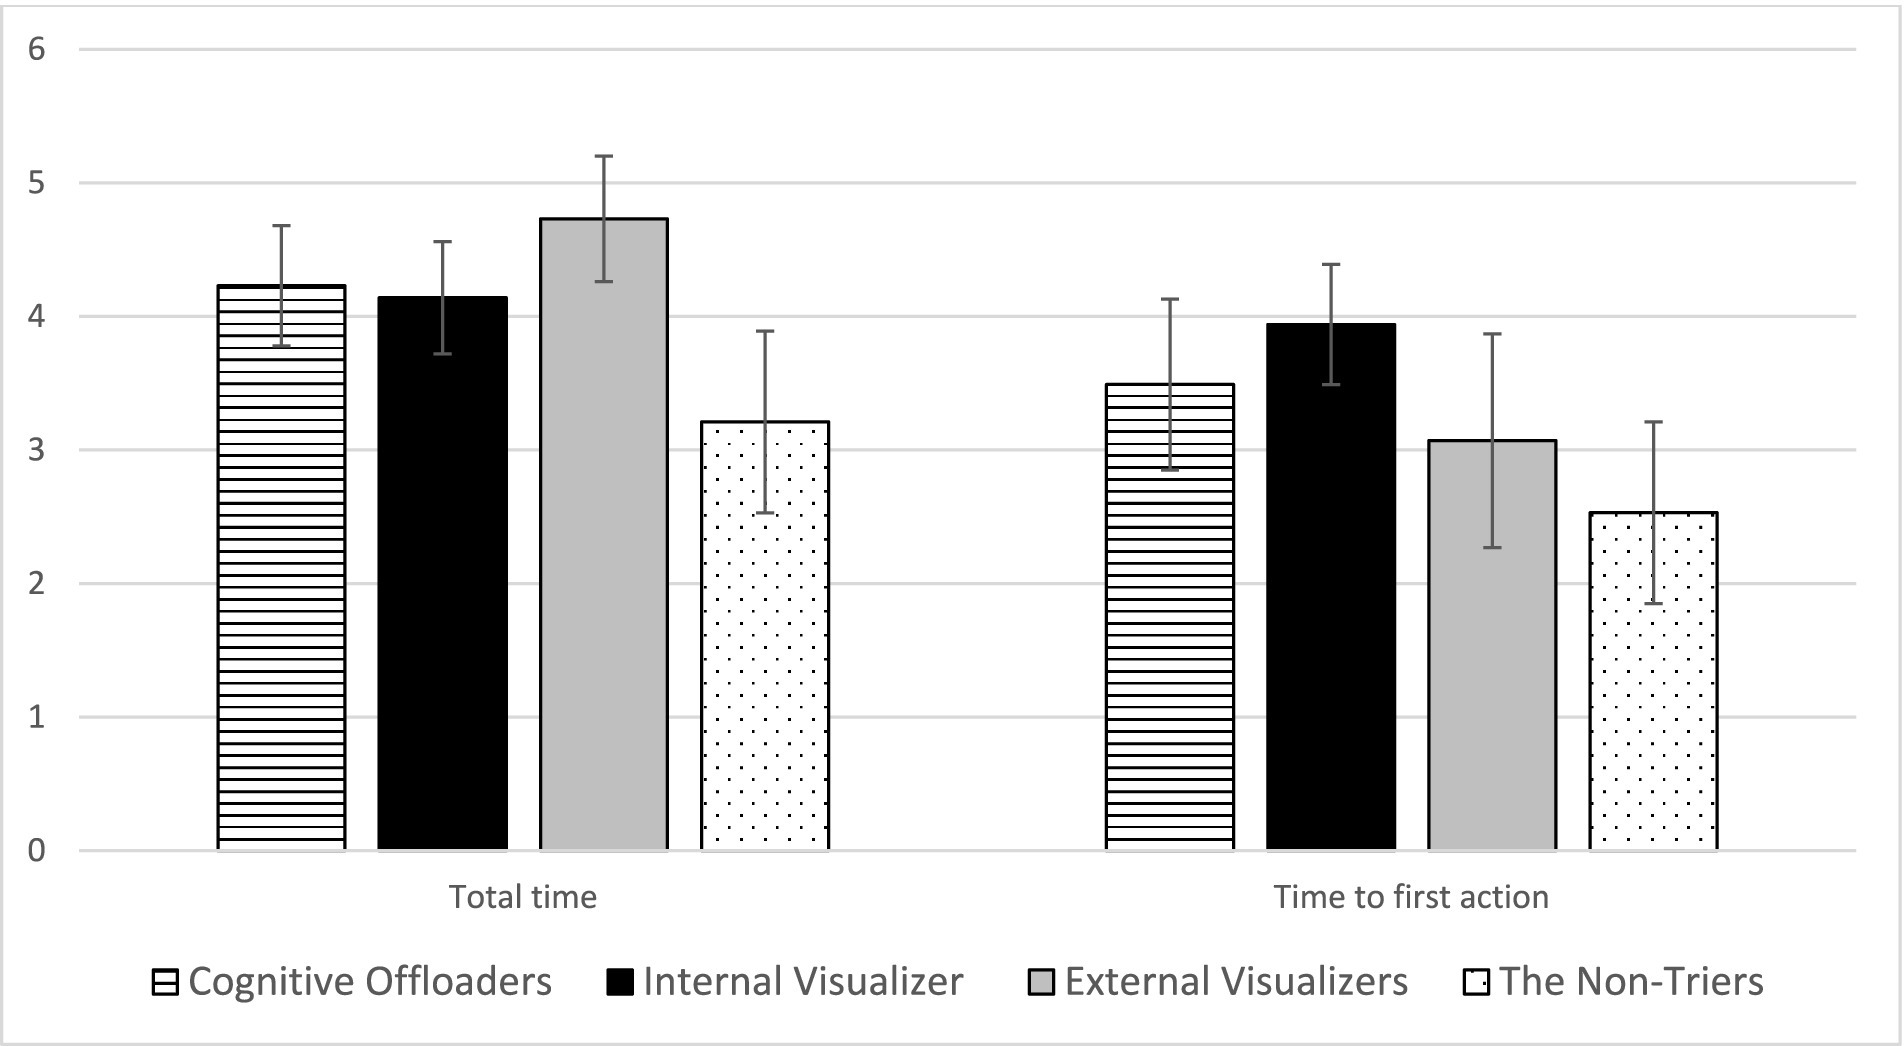
Figure 5. Mean and standard deviations of time spent and initial action time across four student profiles. This figure displays the mean and standard deviations of two logged time variables: total time and time to first action, categorized by student profiles identified through cluster analysis. It highlights that external visualizers typically spend the most total time on tasks, whereas internal visualizers take the longest to initiate their first action. This distinction underscores the differing strategic approaches to mental rotation tasks among the profiles. The error bars represent standard deviations, indicating variability within each group. Source: U.S. Department of Education, National Center for Education Statistics, “Response Process Data from the NAEP 2017 Grade 8 Math Assessment.”
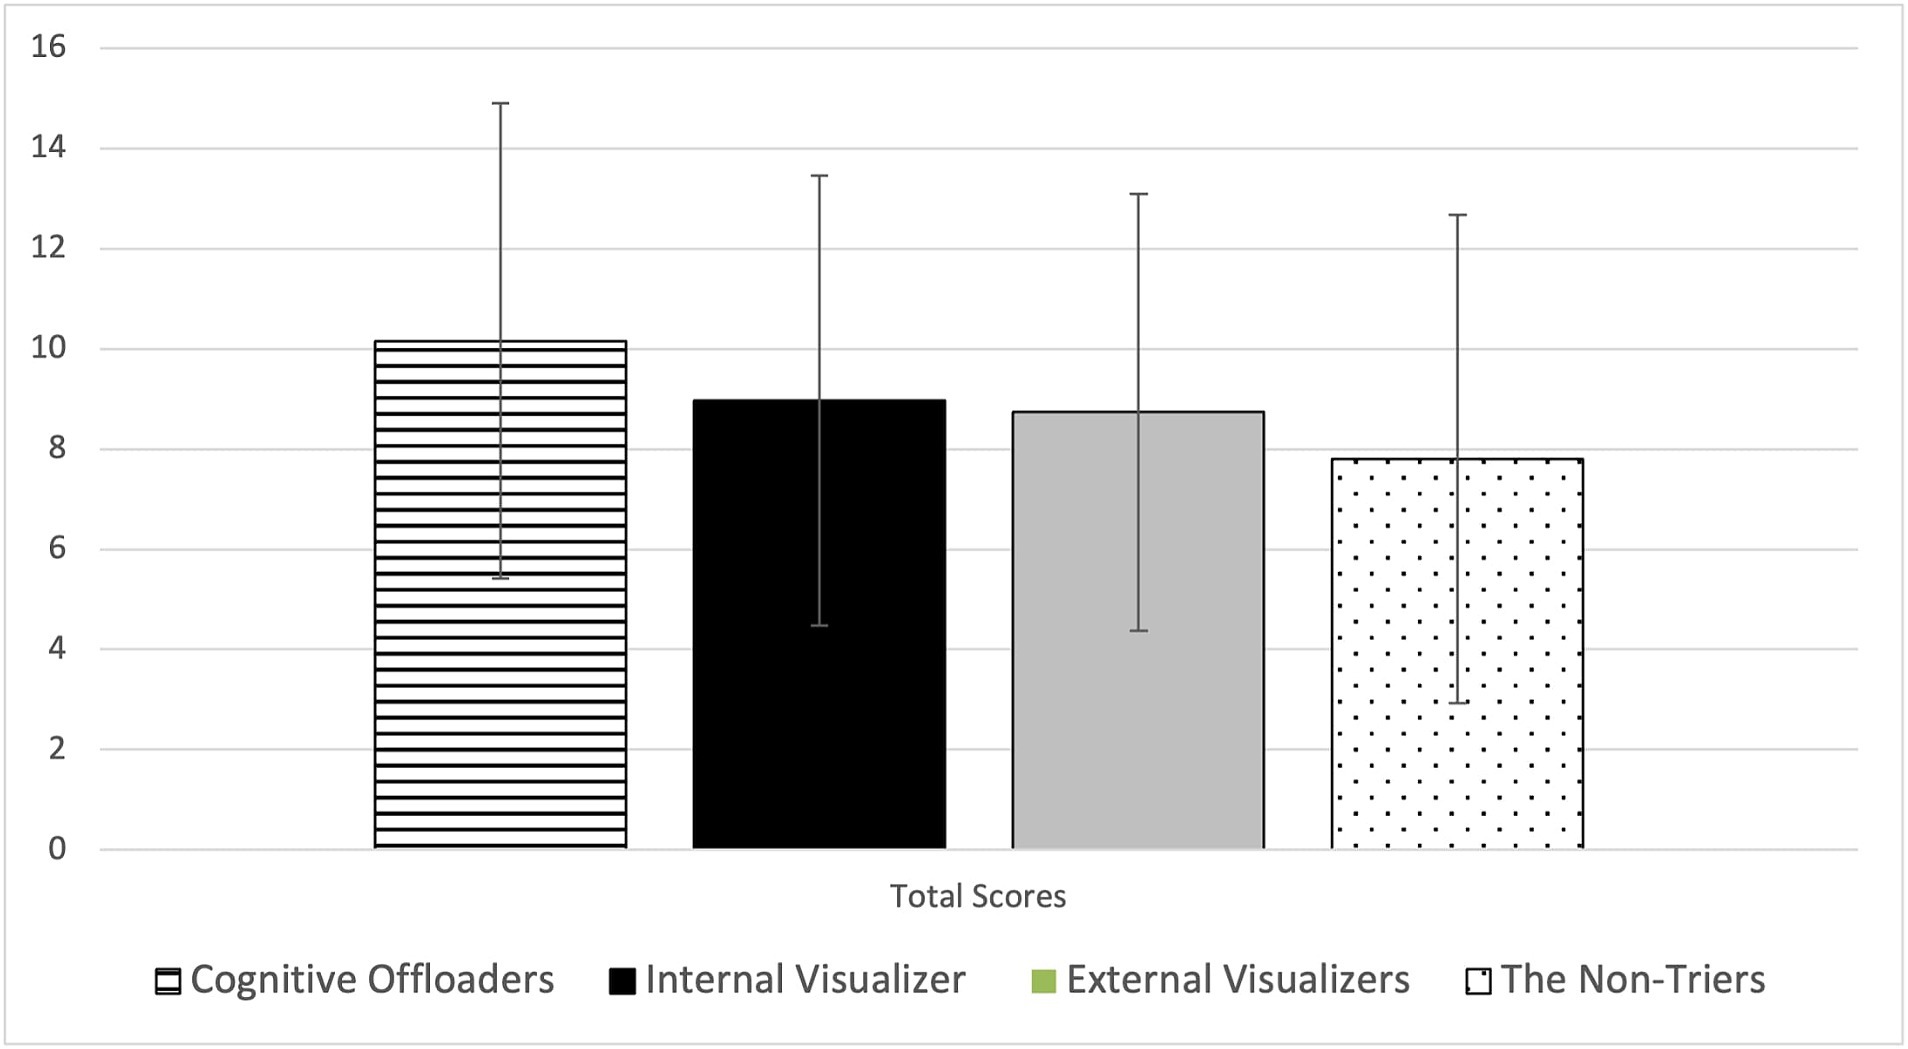
Figure 6. Mean and standard deviations of general math achievement across four student profiles. This figure displays the mean and standard deviations of general math achievement scores for each of the four student profiles identified by the cluster analysis. The data highlights that cognitive offloaders, on average, score higher compared to other profiles, which aligns with their strategic elimination of incorrect choices. The error bars represent standard deviations, indicating variability within each group. Source: U.S. Department of Education, National Center for Education Statistics, “Response Process Data from the NAEP 2017 Grade 8 Math Assessment.”
Cognitive offloaders were characterized by their proactive strategy of eliminating answer choices, with an average logarithm of number of eliminations being 1.56, significantly higher than the near-zero logged attempts by internal visualizers and non-triers and only 0.47 by external visualizers. This approach correlated with the highest MR task accuracy of 45%, significantly surpassing internal visualizers at 38%, external visualizers at 36%, and non-triers at 29%. Moreover, cognitive offloaders demonstrated superior general mathematics achievement, scoring an average of 10.23, which was significantly higher than other profiles—0.26, 0.31, and 0.51 standard deviations above internal visualizers, external visualizers, and non-triers, respectively. This efficiency in filtering incorrect options likely confers academic advantages, enhancing performance in standardized assessments and classroom learning.
Internal visualizers, in contrast, were slow to act, taking the longest before their first action but spending the second shortest total time. They utilized UD tools minimally, recorded the fewest visits, and submitted the fewest answers, yet still managed the second-best performance among the profiles. Their strategy suggests a deep, reflective engagement with tasks rather than frequent tool interaction.
External visualizers heavily employed digital drawing and erasing tools, significantly more than their peers, and also used text-to-speech tools more frequently than internal visualizers and cognitive offloaders. They spent the most time on tasks, visited items most frequently, and frequently revised their answers, culminating in the third-highest performance level.
Non-triers engaged minimally, spending the least amount of time and seldom using the available tools, which resulted in the lowest performance in both the MR tasks and the general mathematics test. Their minimal engagement reflects in their significantly lower achievement levels compared to other groups.
3.2 Demographic differences by profile
Significant demographic variations were observed across profiles (Table 2 and Figure 7). The non-triers had a higher proportion of students with learning disabilities than the other three groups. Cognitive offloaders had notably fewer low-SES or African American students than the other three groups. Gender differences were also prominent, with the non-triers having the highest proportion of male students, and the external visualizers having the least.
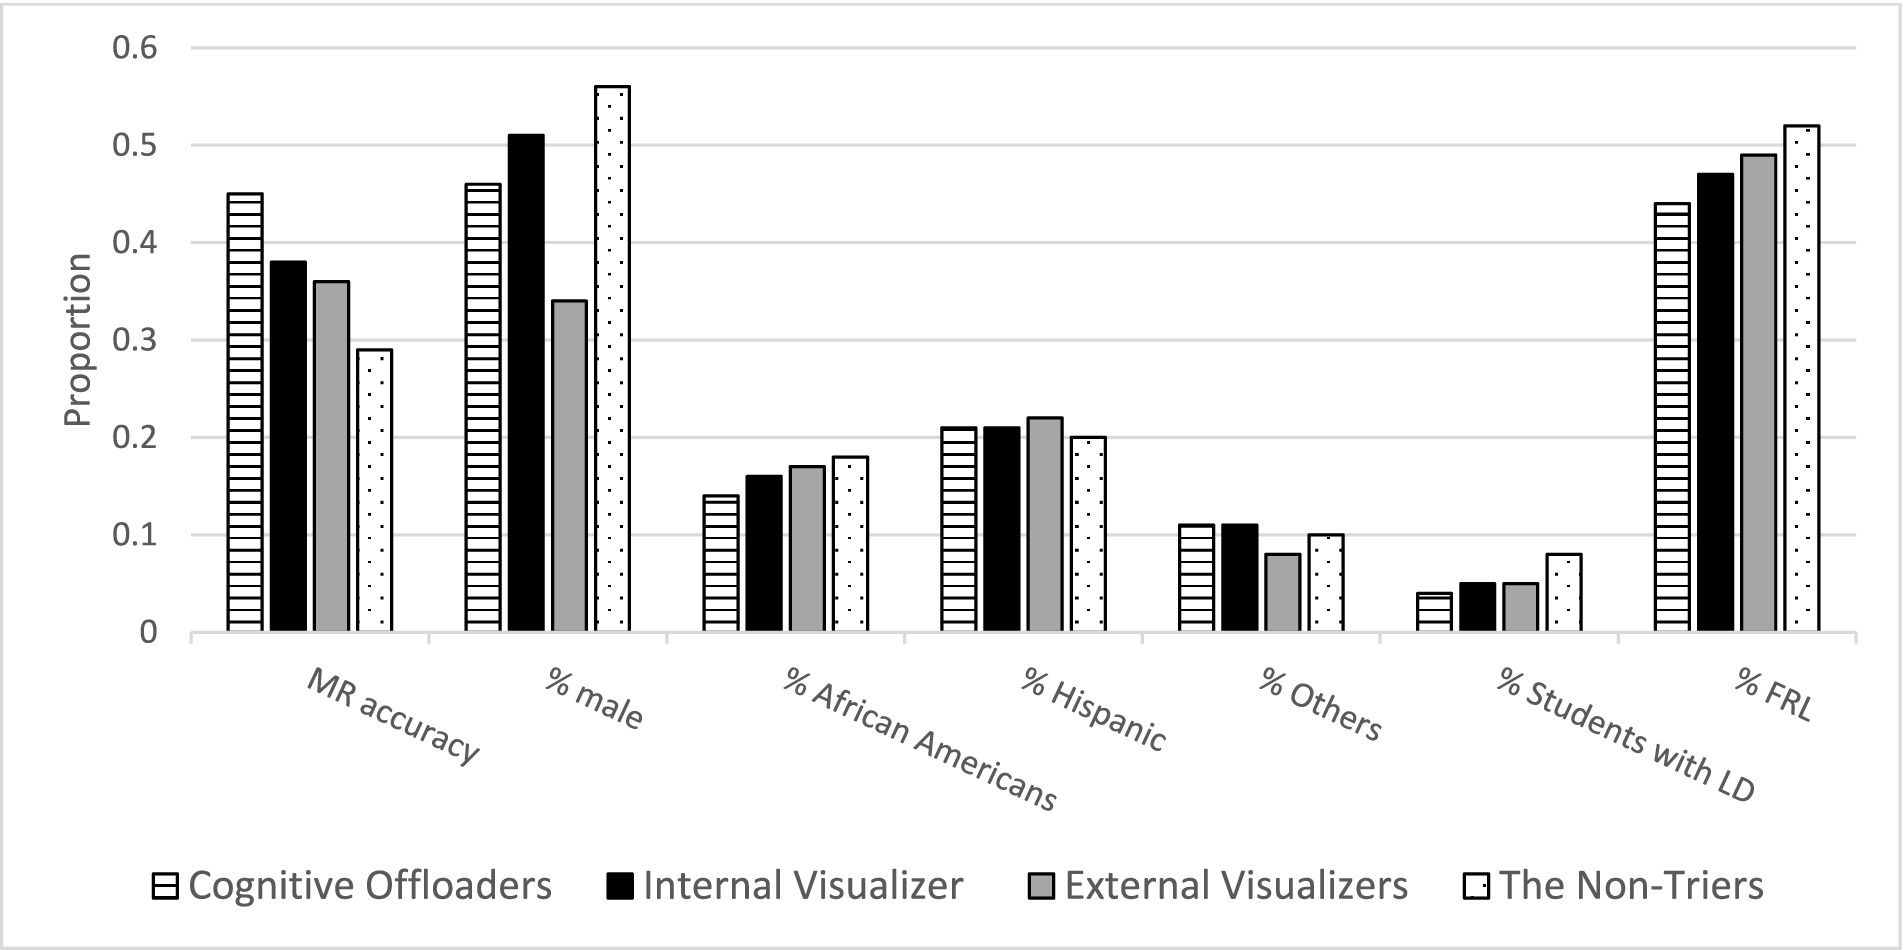
Figure 7. Mental rotation accuracy and demographic characteristics across four student profiles. This figure illustrates the differences in mental rotation (MR) accuracy and various demographic characteristics across four student profiles. Each bar represents the proportion of students within a particular profile, showing either MR accuracy or demographic characteristics such as gender, ethnicity, presence of learning disabilities, or low socioeconomic status. Source: U.S. Department of Education, National Center for Education Statistics, “Response Process Data from the NAEP 2017 Grade 8 Math Assessment.”
4 Discussion
The 2017 NAEP math digital assessment process data unveils a variety of strategies in mental rotation tasks, highlighting four distinct profiles: cognitive offloaders, internal visualizers, external visualizers, and non-triers, each exhibiting unique behaviors and performance metrics.
The MR task is very cognitively demanding. Cognitive offloaders effectively managed task demands through strategic elimination of options, a practice supported by cognitive load theory which emphasizes the importance of reducing working memory load (Sweller, 1988; Risko and Gilbert, 2016), contributing to the best MR performance. Cognitive offloading is “the use of physical action to alter the information processing requirements of a task to reduce cognitive demand” (Risko and Gilbert, 2016, p. 677). Offloading can avoid exceeding the capacity limits of working memory or visual perception (Risko and Gilbert, 2016). In this multiple-choice MR task, holding all five answer choices in working memory could exceed capacity limits. Eliminating the wrong choice make it easier for students to focus on the remaining choices and ultimately choose the correct answer. This elimination process is also known as “weeding” according to the cognitive offloading theory, and it involves eliminating extraneous material that could distract the examinee from the task at hand (Mayer and Moreno, 2003). Studies have shown that this load-reducing strategy is associated with improved performance in spatial reasoning (Chu and Kita, 2011). Therefore, it is possible that cognitive offloading is the reason why cognitive offloaders performed the best on this MR task. However, the underrepresentation of disadvantaged students, such as those with learning disabilities, African American students, and students from low-SES families, in this group suggests the need for targeted interventions to broaden the benefits of cognitive offloading strategies.
Internal visualizers tended to take the longest time before taking action but the shortest time from their first action to task completion. This suggests that these students spent considerable time reading and understanding the question, mentally representing and rotating the object, and comparing it to the target before taking action. Additionally, 83.6% of internal visualizers’ first action was to select an answer, indicating they had a clear mental representation of the MR task. Once they completed their thought process, they quickly chose the final solution. Their pre-action mental preparation and efficient task execution likely reflects high mental rotation abilities, suggesting that minimal intervention is likely required for this group.
External visualizers’ extensive use of digital tools highlights a reliance on visual aids to support problem-solving, which may indicate challenges in inherent spatial abilities. Although digital tools could have helped reduce the working memory load and help with spatial reasoning, these strategies may not fully compensate for their lower spatial ability. Therefore, their overall performance was not on par with cognitive offloaders or internal visualizers, pointing to a need for enhancing fundamental spatial processing skills through targeted interventions.
Non-triers present a critical concern due to their minimal engagement and poor performance, pointing to a need for motivational and educational interventions that are engaging and relevant. Alarmingly, the non-trier group has a high concentration of male, African American, and low-SES students. These demographic trends may reflect structural inequality issues such as unequal access to quality educational resources, differing cultural attitudes towards education, and varying levels of parental or community support. To combat these inequities, targeted interventions are essential. These could include programs designed to increase engagement among underrepresented groups, policies aimed at equalizing access to educational technologies and resources, and curricular adjustments to better accommodate diverse learning needs. Such strategic initiatives are crucial to dismantling barriers and fostering an educational environment that supports all students equitably, promoting inclusivity and fairness in educational outcomes.
The study’s findings reinforce Howard Gardner’s Multiple Intelligences Theory, particularly the facet of spatial intelligence. Gardner posits that individuals possess distinct types of intelligence, including spatial intelligence, which significantly influences their ability to manipulate and visualize spatial information effectively (Gardner, 1983). The identification of different student profiles, such as cognitive offloaders and internal visualizers, aligns with this theory, suggesting that these students exhibit strong spatial intelligence. Understanding these MR profiles not only deepens our comprehension of cognitive processes but also highlights the necessity of designing educational practices that cater to the diverse cognitive strengths of students. This approach could help maximize each student’s learning potential, advocating for educational strategies that recognize and nurture multiple intelligences in the classroom.
Digital tools play a pivotal role in facilitating spatial reasoning, a concept that is deeply rooted in the universal design for learning framework which emphasizes the importance of multiple presentations and supports in learning environments. These tools, such as digital scratchpads and visualization software, provide tangible aids for students to manipulate spatial information dynamically and intuitively. By externalizing complex spatial manipulations, digital tools help reduce cognitive load, allowing students to allocate more mental resources to understanding and solving spatial problems. This supports cognitive theories that suggest external representations can enhance the internal cognitive processes of students by providing visual and interactive experiences that are otherwise challenging to achieve. The effective integration of these tools into educational settings can, therefore, significantly bolster students’ spatial reasoning skills, aligning with educational objectives that aim to enhance cognitive competencies across diverse learning profiles.
5 Limitations
This study, while comprehensive, has its limitations. The lack of data on students’ actual drawings and notes on digital devices restricts our understanding of how these tools were specifically employed during the tasks. Moreover, the observational nature of the process data limits our ability to establish causality definitively. We can infer the strategies and behaviors but not their direct effects on outcomes. Future research should include more detailed data collection and possibly experimental or longitudinal designs to determine the causality and assess the long-term impacts of these strategies on learning outcomes. Another limitation is the lack of focus on how students’ understanding of specific mathematical terms impacts MR task performance, which should be explored in future studies. Finally, this study conducted complete case cluster analysis because the low missing data rates. However, this approach did not address the potential biases introduced by excluding cases with missing data, which could affect the generalizability of the findings. Further research might explore methods for handling missing data to assess whether the exclusion of incomplete cases significantly impacts the results.
6 Implications
Despite the limitations of our study, the insights garnered significantly enhance our understanding of mental rotation strategies within the context of digital assessments. By delineating student profiles based on test-taking behavior and performance, we underscore the necessity of bespoke educational interventions tailored to the distinct needs of diverse learners.
Tailored Educational Interventions: It is imperative to devise specific interventions that cater to each identified student profile. For instance, cognitive offloaders could benefit from structured problem-solving techniques integrated within the standard curriculum to bolster their strategic skills. Internal visualizers might be aided by strategies that hasten their initial decision-making without compromising accuracy. External visualizers could improve with targeted practice designed to bolster their internal visualization skills, thus reducing dependency on digital tools. For non-triers, creating engaging and relevant learning experiences, possibly through gamification or real-world applications, could significantly enhance motivation and participation. Moreover, universally teaching effective cognitive offloading strategies, digital literacy, and internal visualization skills across all profiles can raise overall MR competencies.
Education Equity and Resource Allocation: This study also highlights the crucial need for educational equity. We advocate for policy changes at various administrative levels to ensure all students have access to resources that develop spatial reasoning skills. This includes advocating for integration of spatial reasoning in curricula and securing funding for initiatives that offer spatial skills training, particularly targeting underrepresented groups. Additionally, ensuring that digital literacy and comprehensive training in the use of educational technologies are embedded in school curricula could help bridge the current achievement gaps observed in STEM fields.
Professional Development and Training: There is a pronounced need for professional development that prepares educators to recognize and nurture various cognitive styles associated with MR tasks. Training programs should include comprehensive modules on spatial reasoning, cognitive offloading, and effective use of digital tools, complemented by approaches for engaging students who are less naturally inclined towards these tasks. Additionally, integrating digital literacy and culturally responsive teaching practices into teacher training programs can significantly enhance educators’ ability to support diverse learners.
Innovative Learning Platforms: The integration of digital learning platforms that use adaptive learning technologies and AI-driven tutoring systems can provide personalized learning experiences that accommodate diverse learning strategies. These platforms should also be designed to collect and analyze process data to offer real-time feedback, helping students understand and utilize various cognitive strategies effectively.
Longitudinal and Collaborative Research: To truly gauge the long-term impacts of spatial reasoning interventions, sustained longitudinal studies are essential. These studies should explore how improvements in spatial reasoning influence educational outcomes and career trajectories in STEM fields. Collaborative efforts between academia, educational authorities, and policy makers will be crucial in evaluating the effectiveness of these interventions and expanding successful practices.
By addressing these implications and extending upon our findings, subsequent research and educational methodologies can more effectively equip students with the necessary skills to excel in STEM disciplines, thereby fostering a more inclusive and competent future workforce.
Data availability statement
The dataset used in this study is available under a restricted-use data license from the National Center for Education Statistics (NCES). For access to the “Response Process Data from the NAEP 2017 Grade 8 Math Assessment,” interested researchers must apply for a license through NCES. Additional information on the licensing process and requirements can be found at the NCES website: https://nces.ed.gov/pubsearch/licenses.asp#.
Ethics statement
The study, which analyzed secondary data, was reviewed and deemed not to constitute human subjects research by Salus IRB, contact: 512-380-1244. Consequently, it was exempt from further IRB review. The study was conducted in accordance with local legislation and institutional requirements.
Author contributions
XW: Conceptualization, Funding acquisition, Investigation, Methodology, Project administration, Writing – original draft, Writing – review & editing. SZ: Conceptualization, Formal Analysis, Funding acquisition, Investigation, Methodology, Project administration, Visualization, Writing – review & editing. JZ: Data curation, Investigation, Methodology, Validation, Visualization, Writing – review & editing.
Funding
The author(s) declare financial support was received for the research, authorship, and/or publication of this article. The research reported here was supported by the Institute of Education Sciences, U.S. Department of Education, through Grant R324P230002 to Digital Promise. The opinions expressed are those of the authors and do not represent the views of the Institute or the U.S. Department of Education.
Conflict of interest
XW was employed by Digital Promise.
The remaining authors declare that the research was conducted in the absence of any commercial or financial relationships that could be construed as a potential conflict of interest.
Publisher’s note
All claims expressed in this article are solely those of the authors and do not necessarily represent those of their affiliated organizations, or those of the publisher, the editors and the reviewers. Any product that may be evaluated in this article, or claim that may be made by its manufacturer, is not guaranteed or endorsed by the publisher.
References
Bethell-Fox, C. E., and Shepard, R. N. (1988). Mental rotation: effects of stimulus complexity and familiarity. J. Exp. Psychol. Hum. Percept. Perform. 14, 12–23.
Bezirhan, U., von Davier, M., and Grabovsky, I. (2021). Modeling item revisit behavior: the hierarchical speed–accuracy–revisits model. Educ. Psychol. Meas. 81, 363–387. doi: 10.1177/0013164420950556
Chen, Y. (2020). A continuous-time dynamic choice measurement model for problem-solving process data. Psychometrika 85, 1052–1075. doi: 10.1007/s11336-020-09734-1
Chu, M., and Kita, S. (2011). The nature of gestures’ beneficial role in spatial problem-solving. J. Exp. Psychol. Gen. 140, 102–116. doi: 10.1037/a0021790
Cohen, C., and Hegarty, M. (2007). Individual differences in use of external visualisations to perform an internal visualisation task. Appl. Cogn. Psychol. 21, 701–711. doi: 10.1002/acp.1344
Frick, A. (2018). Spatial transformation abilities and their relation to later mathematics performance. Psychol. Res. 83, 1465–1484. doi: 10.1007/s00426-018-1008-5
Goldhammer, F., Naumann, J., Selter, A., Toth, K., Rolke, H., and Klieme, E. (2014). The time on task effect in reading and problem solving is moderated by task difficulty and skill: insights from a computer-based large-scale assessment. J. Educ. Psychol. 106, 608–626. doi: 10.1037/a0034716
Gonthier, C. (2022). Cross-cultural differences in visuo-spatial processing and the culture-fairness of visuo-spatial intelligence tests: an integrative review and a model for matrices tasks. Cogn. Res. Princ. Implic. 7:11. doi: 10.1186/s41235-021-00350-w
Greiff, S., Niepel, C., Scherer, R., and Martin, R. (2016). Understanding students’ performance in a computer-based assessment of complex problem solving: an analysis of behavioral data from computer-generated log files. Comput. Hum. Behav. 61, 36–46. doi: 10.1016/j.chb.2016.02.095
Hegarty, M. (2004). “Diagrams in the mind and in the world: relations between internal and external visualizations” in Diagrammatic representation and inference. Diagrams 2004. Lecture notes in computer science, vol. 2980. eds. A. F. Blackwell, K. Marriott, and A. Shimojima (Berlin, Heidelberg: Springer).
Johnson, S. P., and Moore, D. S. (2020). Spatial thinking in infancy: origins and development of mental rotation between 3 and 10 months of age. Cogn. Res. 5:10. doi: 10.1186/s41235-020-00212-x
Kaufman, L., and Rousseeuw, P. J. (2009). Finding groups in data: An introduction to cluster analysis. New York: Wiley.
Khooshabeh, P., Hegarty, M., and Shipley, T. F. (2013). Individual differences in mental rotation: piecemeal versus holistic processing. Exp. Psychol. 60, 164–171. doi: 10.1027/1618-3169/a000184
Kong, X. J., Wise, S. L., and Bhola, D. S. (2007). Setting the response time threshold parameter to differentiate solution behavior from rapid-guessing behavior. Educ. Psychol. Meas. 67, 606–619. doi: 10.1177/0013164406294779
Kwak, M., and Gweon, G. (2019). “Should students use digital scratchpads? Impact of using a digital assistive tool on arithmetic problem-solving” in Artificial intelligence in education. AIED 2019. Lecture Notes in Computer Science, vol 11626. eds. S. Isotani, E. Millán, A. Ogan, P. Hastings, B. McLaren, and R. Luckin (Cham: Springer).
Logie, R. H., Pernet, C. R., Buonocore, A., and Della Sala, S. (2011). Low and high imagers activate networks differentially in mental rotation. Neuropsychologia 49, 3071–3077. doi: 10.1016/j.neuropsychologia.2011.07.011
Lundgren, E., and Eklöf, H. (2020). Within-item response processes as indicators of test-taking effort and motivation. Educ. Res. Eval. 26, 275–301. doi: 10.1080/13803611.2021.1963940
Maechler, M., Rousseeuw, P., Struyf, A., Hubert, M., and Hornik, K. (2021). Cluster: cluster analysis basics and extensions. R package version 2.1.2. Available at: https://CRAN.R-project.org/package=cluster.
Mayer, R. E., and Moreno, R. (2003). Nine ways to reduce cognitive load in multimedia learning. Educational Psychologist, 38, 43–52. doi: 10.1207/S15326985EP3801_6
McMorris, R. F., DeMers, L. P., and Schwarz, S. P. (1987). Attitudes, behaviors, and reasons for changing responses following answer-changing instruction. J. Educ. Meas. 24, 131–143. doi: 10.1111/j.1745-3984.1987.tb00269.x
Mumaw, R. J., Pellegrino, J. W., Kail, R. V., and Carter, P. (1984). Different slopes for different folks: process analysis of spatial aptitude. Mem. Cogn. 12, 515–521. doi: 10.3758/BF03198314
NAEP (2023). NAEP report card: 2022 NAEP mathematics assessment highlighted results at grades 4 and 8 for the nation, states, and districts. Available at: https://www.nationsreportcard.gov/highlights/mathematics/2022/
Newcombe, N. S., Booth, J. L., and Gunderson, E. (2019). “Spatial skills, reasoning, and mathematics” in Cambridge handbook of cognition and education. eds. J. Dunlosky and K. A. Rawson (Cambridge: Cambridge University Press), 100–123.
Park, G., Lubinski, D. L., and Benbow, C. P. (2010). Recognizing spatial intelligence. Scientific American. Available at: http://www.scientificamerican.com/article/recognizing-spatial-intel/.
Peters, M., Laeng, B., Latham, K., Jackson, M., Zaiyouna, R., and Richardson, C. (1995). A redrawn Vandenberg and Kuse mental rotations test: different versions and factors that affect performance. Brain Cogn. 28, 39–58. doi: 10.1006/brcg.1995.1032
R Core Team (2021). R: A language and environment for statistical computing. R Foundation for Statistical Computing, Vienna, Austria. Available at: https://www.R-project.org/
Risko, E. F., and Gilbert, S. J. (2016). Cognitive offloading. Trends Cogn. Sci. 20, 676–688. doi: 10.1016/j.tics.2016.07.002
Rose, D. H., Meyer, A., Strangman, N., and Rappolt, G. (2016). Teaching every student in the digital age: Universal Design for Learning : Association for Supervision and Curriculum Development, Alexandria, VA.
Shea, D. L., Lubinski, D., and Benbow, C. P. (2001). Importance of assessing spatial ability in intellectually talented young adolescents: a 20-year longitudinal study. J. Educ. Psychol. 93, 604–614. doi: 10.1037/0022-0663.93.3.604
Shepard, R. N., and Metzler, J. (1971). Mental rotation of three-dimensional objects. Science 171, 701–703. doi: 10.1126/science.171.3972.701
Song, J. (2021). Beyond the results: Identifying students’ problem solving processes on a problem solving task. Master thesis, University of Oslo.
Stenlund, T., Lyrén, P.-E., and Eklöf, H. (2018). The successful test taker: exploring test-taking behavior profiles through cluster analysis. Eur. J. Psychol. Educ. 33, 403–417. doi: 10.1007/s10212-017-0332-2
Sweller, J. (1988). Cognitive load during problem solving: effects on learning. Cogn. Sci. 12, 257–285. doi: 10.1207/s15516709cog1202_4
Taylor, H. A., and Tenbrink, T. (2013). The spatial thinking of origami: evidence from think-aloud protocols. Cogn. Process. 14, 189–191. doi: 10.1007/s10339-013-0540-x
Teig, N., Scherer, R., and Kjærnsli, M. (2020). Identifying patterns of students’ performance on simulated inquiry tasks using PISA 2015 log-file data. J. Res. Sci. Teach. 57, 1400–1429. doi: 10.1002/tea.21657
Thompson, J. M., Nuerk, H. C., Moeller, K., and Cohen Kadosh, R. (2013). The link between mental rotation ability and basic numerical representations. Acta Psychol. 144, 324–331. doi: 10.1016/j.actpsy.2013.05.009
Wai, J., Lubinski, D., and Benbow, C. (2009). Spatial ability for STEM domains: aligning over 50 years of cumulative psychological knowledge solidifies its importance. J. Educ. Psychol. 101, 817–835. doi: 10.1037/a0016127
Wang, L., and Carr, M. (2014). Working memory and strategy use contribute to gender differences in spatial ability. Educ. Psychol. 49, 261–282. doi: 10.1080/00461520.2014.960568
Way, D., and Strain-Seymour, E. (2021). A framework for considering device and interface features that may affect student performance on the National Assessment of educational Progress. NAEP report. Available at: https://www.air.org/sites/default/files/Framework-for-Considering-Device-and-Interface-Features-NAEP-NVS-Panel-March-2021.pdf
Wei, X. (2024). Text-to-speech technology and math performance: a comparative study of students with disabilities, English language learners, and their general education peers. Educ. Res. doi: 10.3102/0013189X241232995
Wei, X., Christiano, E., Yu, J., Wagner, M., and Spiker, D. (2014). Reading and math achievement profiles and longitudinal growth trajectories of children with an autism spectrum disorder. Autism 19, 200–210. doi: 10.1177/1362361313516549
Young, C. J., Levine, S. C., and Mix, K. S. (2018). The connection between spatial and mathematical ability across development. Front. Psychol. 9:755. doi: 10.3389/fpsyg.2018.00755
Zander, S., Wetzel, S., and Bertel, S. (2016). Rotate it! – Effects of touch-based gestures on elementary school students’ solving of mental rotation tasks. Comput. Educ. 103, 158–169. doi: 10.1016/j.compedu.2016.10.007
Keywords: mental rotation, visualization strategies, student profiles, NAEP, process data, cognitive load, cluster analysis, universal design tools
Citation: Wei X, Zhang S and Zhang J (2024) Identifying student profiles in a digital mental rotation task: insights from the 2017 NAEP math assessment. Front. Educ. 9:1423602. doi: 10.3389/feduc.2024.1423602
Edited by:
Xiang Hu, Renmin University of China, ChinaReviewed by:
Yunxiao Chen, London School of Economics and Political Science, United KingdomMoleboheng Mokhele-Ramulumo, University of South Africa, South Africa
Copyright © 2024 Wei, Zhang and Zhang. This is an open-access article distributed under the terms of the Creative Commons Attribution License (CC BY). The use, distribution or reproduction in other forums is permitted, provided the original author(s) and the copyright owner(s) are credited and that the original publication in this journal is cited, in accordance with accepted academic practice. No use, distribution or reproduction is permitted which does not comply with these terms.
*Correspondence: Xin Wei, eHdlaUBkaWdpdGFscHJvbWlzZS5vcmc=