 Suzanne W. Dietrich
 Anna M. Cunningham
- School of Mathematical and Natural Sciences, Arizona State University, Phoenix, AZ, United States
The ability to work with data to extract valuable information is a useful skill set, especially in STEM disciplines that produce large amounts of scientific data. This paper reports on the pedagogy and experience of incorporating fundamental database concepts into a STEM Success course, which included a hands-on project. Students worked in groups to design a database for existing tabular data available on the Web and then derived the data to populate the database using SQL queries. This paper reflects on the experience both from a pedagogical perspective as well as a student perspective, including qualitative code analysis of student feedback and survey results regarding attitudes of confidence using, interest in, and usefulness of databases.
1 Introduction
Our school offers a one-credit STEM Success course every semester, which is a cohort and skill- building course for all recipients of a S-STEM scholarship funded by the National Science Foundation. This scholarship is offered to low-income, academically talented students who transferred to a comprehensive university from a local community college. Most of these students have not traveled a direct path toward their undergraduate degree - many are non-traditional students who are returning to college after a few years, or who are caring for children or aging parents. Their majors include mathematical sciences (applied computing, applied mathematics or statistics) or natural sciences (biology, environmental science, pharmacology/toxicology or forensic science). The instructor and goals of the class change each semester with offerings covering relevant STEM skills that translate across a variety of disciplines. Some offerings of the course have covered career readiness, growth mindset, and cross-cultural competency. Typically, students are given reading and journaling assignments as assessments in the class.
The Fall 2022 course offering emphasized Data and Ethics for the first time. Specifically, the learning goals included improving the student’s knowledge of tools for processing data, such as non-trivial features of spreadsheets and the introduction of relational databases. When working with data, it is important to include a discussion of ethical responsibilities, such as privacy and sharing of data, as these are essential to STEM fields for scientific data management. Table 1 provides an overview of the topic coverage with the student learning objectives.
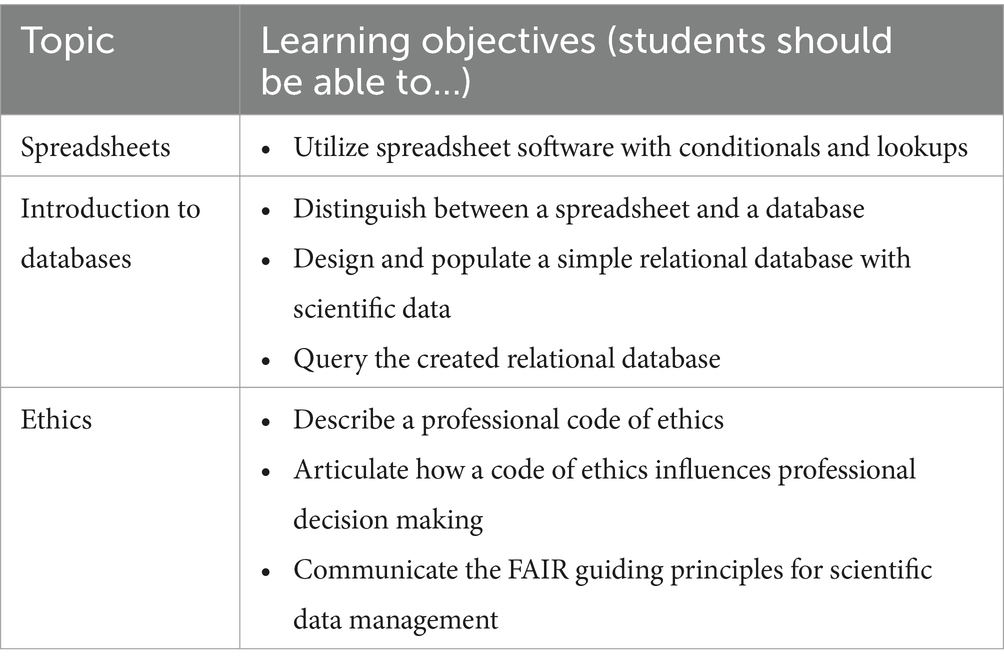
Table 1. Topics and learning objectives.
2 Database and non-computing majors
Natural science fields increasingly utilize large data sets (such as bioinformatics, long-term ecological data, or geospatial distribution of water quality data), yet many natural science students do not learn beneficial quantitative skills, such as how to manipulate or query large data sets, as part of their undergraduate curriculum (Klug et al., 2017; Wilson Sayres et al., 2018; Williams et al., 2019). Many natural science courses are beginning to add database components to their curriculum, in fields ranging from chemistry to biology to environmental science (Magana et al., 2014; Klug et al., 2017; Madlung, 2018; Jouaneh et al., 2022; Gao and Guo, 2023). Additionally, one study noted that field-based ecology courses have great potential to contribute to long-term ecological data sets, a process which also enhances them pedagogically. Unfortunately, this same study concluded that “A main challenge identified by instructors in sharing their data was inputting the raw field data into a database (48%)” (Messager et al., 2022). Similarly, Williams et al. (2019) reported that the primary barrier to incorporating bioinformatics into the biology curriculum was faculty expertise.
Non-major courses offered by computer scientists have a broad range of topics, which must be prioritized (Walker, 2015). Some focus on computational thinking (Wing, 2006) while others focus on information fluency (Snyder and Henry, 2018). Goelman (2008) describes a course emphasizing databases for beginners, which formed the basis of the “Databases for Many Majors” project (Dietrich and Goelman, 2024). Others propose an informatics minor (Zilora, 2011), in which a dedicated course on databases is required, to prepare students with the skill sets that enable them to extract valuable information from the field-specific data. Another non-majors course (Sullivan, 2013) uses data-centric topics to introduce students to computer science by covering relational databases and SQL, programming in Python to process collections of data, data visualization, and data mining. Some introduce non-major courses as a bridge to taking additional computer science courses. For example, Erkan and Lee (2019) describe a non-majors course focused on spreadsheets and databases, which can be used as a prerequisite to the database course for computer science majors.
3 Course overview
The STEM Success course is a one-credit course that is typically taught in-person every other week, with an assignment in lieu of class on the alternating week, and at a time that avoids overlapping with as many STEM courses as possible. Table 2 provides an overview of the course plan for the Data and Ethics offering of the STEM Success course. For the data coverage, the instructor prepared a custom overview of advanced features of spreadsheets, and for databases utilized the suite of visualizations from the Databases for Many Majors project (Dietrich and Goelman, 2024). The spreadsheet example presented how to include multiple worksheets in one workbook along with named ranges and the functions: if, countif, and vlookup. The three visualizations cover various fundamental concepts of databases. Specifically, the first visualization introduces what a database is and how it differs from a spreadsheet (Dietrich et al., 2015). Based on the established goal of the class being that students create a database from existing spreadsheet data, the next visualization covered how to design a database (Goelman and Dietrich, 2018). For this, a graphical representation, known as an Entity-Relationship diagram, identifies the concepts or entities that are to be stored in the database and how the data are related. The visualization then illustrated how to map the Entity-Relationship diagram to a correct representation in a relational database. The last visualization emphasized how to ask questions, called queries, over the data stored in a relational database using the SQL industry standard query language. A demonstration of each visualization was presented in class using a default example of students taking courses at a university. The student assignment related to each visualization was to run the visualization on a different example and to complete the assessment feature, called a checkpoint, which is part of the visualization itself (Dietrich and Goelman, 2017). When starting the visualization, students can choose from the following STEM examples: Astronomy, Computational Molecular Biology, Environmental Science, Geographic Information Systems, Forensics, Neuroinformatics, and Statistics (Dietrich et al., 2021). The checkpoint, which is also customized based on the data example chosen, consists of mostly multiple choice questions and a few True/False questions that formatively assess the student’s knowledge of the visualization’s learning objectives (Dietrich et al., 2020).
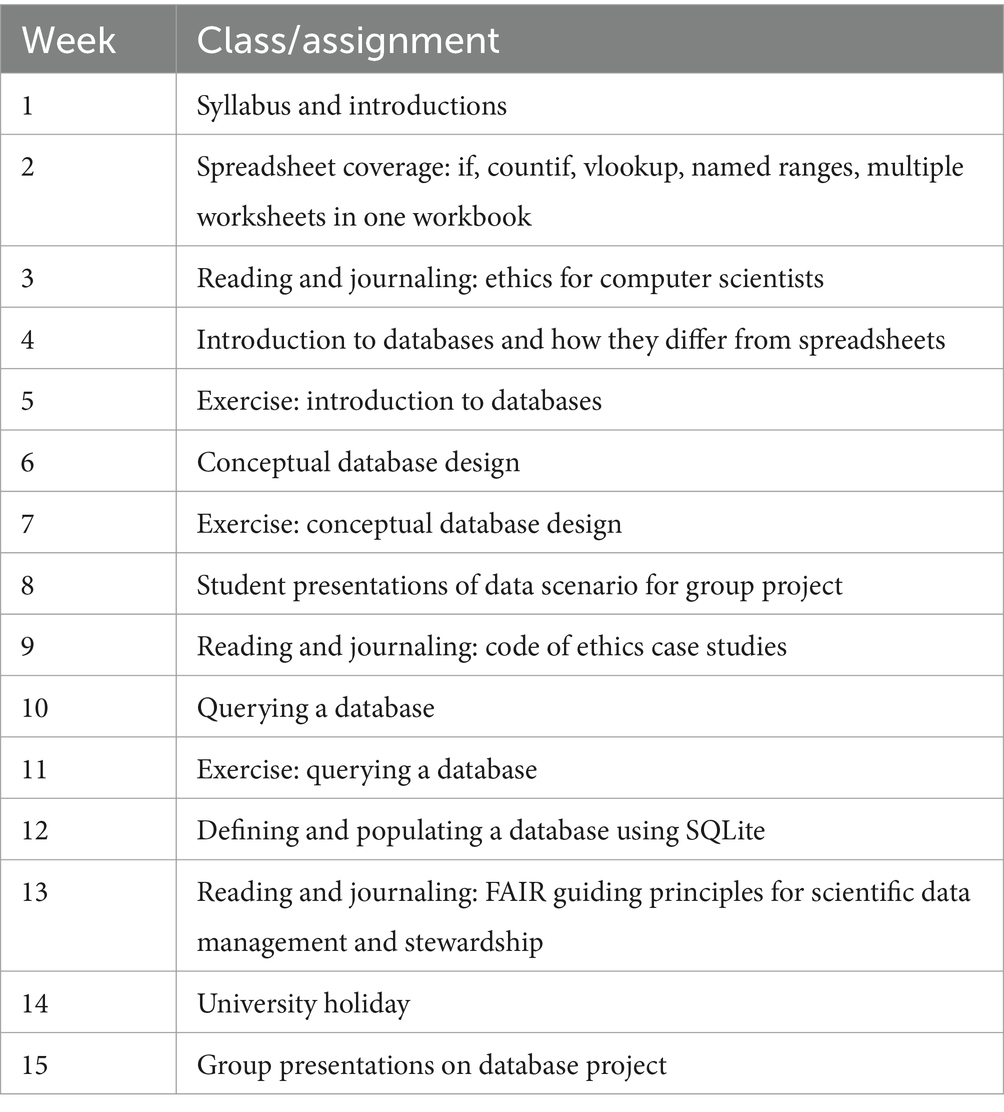
Table 2. STEM success course plan for Fall 2022.
The reading and journaling assignments covered ethics topics as well as the FAIR guiding principles for scientific data management and stewardship (Wilkinson et al., 2016). Since the instructor’s expertise was in computer science, the ACM Code of Ethics (Association for Computing Machinery, 2024) was used as a sample code of ethics. Students were asked to journal about the code and how it related to the university’s academic integrity and student code of conduct policies. Additionally, students were asked to provide examples of ethical codes in their field of study, (e.g., American Veterinary Medical Association, 2024 and the Society of Toxicology, 2024). Students were also asked to read a paper discussing the case studies of several ethical scenarios that point out how a code of ethics could apply (Gotterbarn and Miller, 2009). Finally, students read the FAIR guidelines and contributed a data repository in their field along with a description of how it satisfies the FAIR guiding principles. There are many data repositories across various disciplines from which students can choose, including the EDI data portal (Environmental Data Initiative, 2024) for environmental data, or general online data sharing repositories, such as the Open Science Framework (Center for Open Science, 2017) or a dataverse (e.g., Harvard, 2024).
4 Database group project
The database group project consisted of several phases that coincided with class coverage of fundamental concepts of databases. Students formed their own groups of two. After the introduction to databases and conceptual database design content, the first phase of the project consisted of choosing a dataset from a collection of about 60 datasets, in csv format, available through The Collection of Really, Great, Interesting, Situated Datasets (CORGIS) (Bart et al., 2017, 2024). CORGIS links to the original data that it used to provide its situated datasets and provides an overview of each of the fields. The assignment deliverable was a 2-slide presentation with the first slide consisting of a description of the dataset chosen and the second slide consisting of the proposed conceptual database design representing the concepts and associations in the data. The format of the dataset description was not specified and students were asked to be creative in describing the data. The second slide on conceptual database design utilized the Entity-Relationship diagrams introduced in the visualization and students were strongly encouraged to attend office hours to discuss their design before the assignment was due. Part of the assignment was to choose a dataset based on their field of interest and verify that the selected dataset would only generate 2–3 relational tables in the future database. The mapping of Entity-Relationship diagrams to relational databases was covered as part of the conceptual design visualization and assessed using the formative assessment checkpoint built-in to the visualization.
Figure 1 shows a representation of the CORGIS COVID dataset, which consisted of a screenshot of the CSV data overview from the CORGIS site with color coding indicating three concepts that the CSV represented: date, location, and the COVID data relating the location and date. The names of the columns in the CSV dataset use a prefix to indicate the concept.
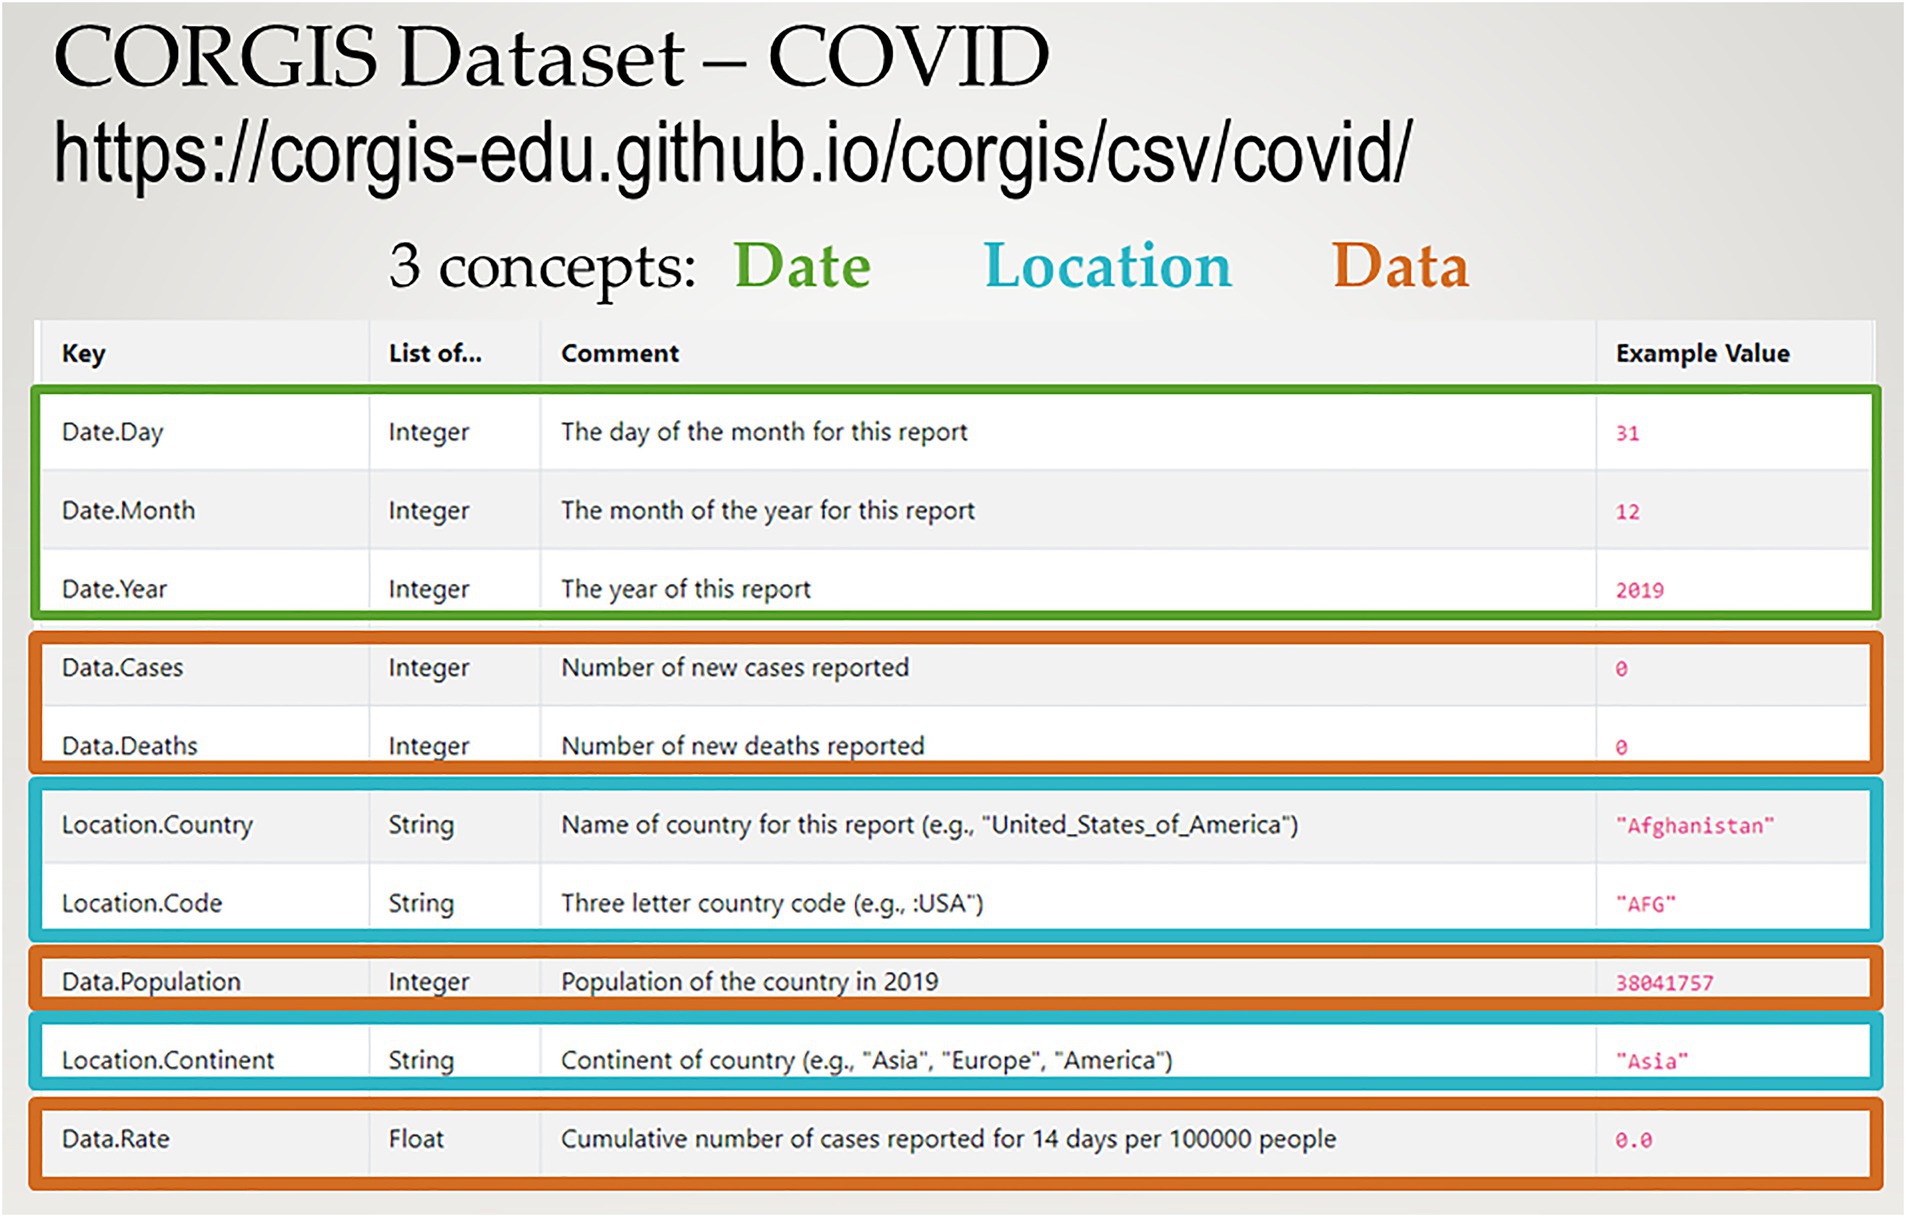
Figure 1. CORGIS COVID dataset (Kafura et al., 2021).
Figure 2 shows the Entity-Relationship diagram and mapping to relational tables for the COVID dataset. The conceptual design depicts the entities and relationships between the entities. Entities are enclosed in rectangles and relationships are represented by diamonds. The location and date are entities, and the data is a relationship associating a location and a date. Each column from the CSV file represents an attribute, which is indicated by ovals, that is linked to the entity or relationship that it describes. The M and N labels on the edges linking the entities to the relationship indicate how many times an instance of that entity participates in the relationship. A location can have data for many dates, and a date can provide data for many locations. Thus, the data represents a many-to-many (M:N) relationship. Each entity is mapped to a table in a relational database design. The underlined attribute for an entity indicates the attribute that uniquely identifies an instance of the entity. For example, code uniquely identifies a location and a datestring was created in the format yyyy-mm-dd from the year, month, and day attributes to uniquely identify a date. In a relational database, the attributes that uniquely identify a row in the table are called primary keys. The data relationship is also mapped to a table that must contain the primary keys of the tables that it is associating along with its descriptive attributes. The primary key of the data table consists of the combination of the datestring and location code because data is a M:N relationship. Both the date and location are needed to uniquely identify the data row in the table.
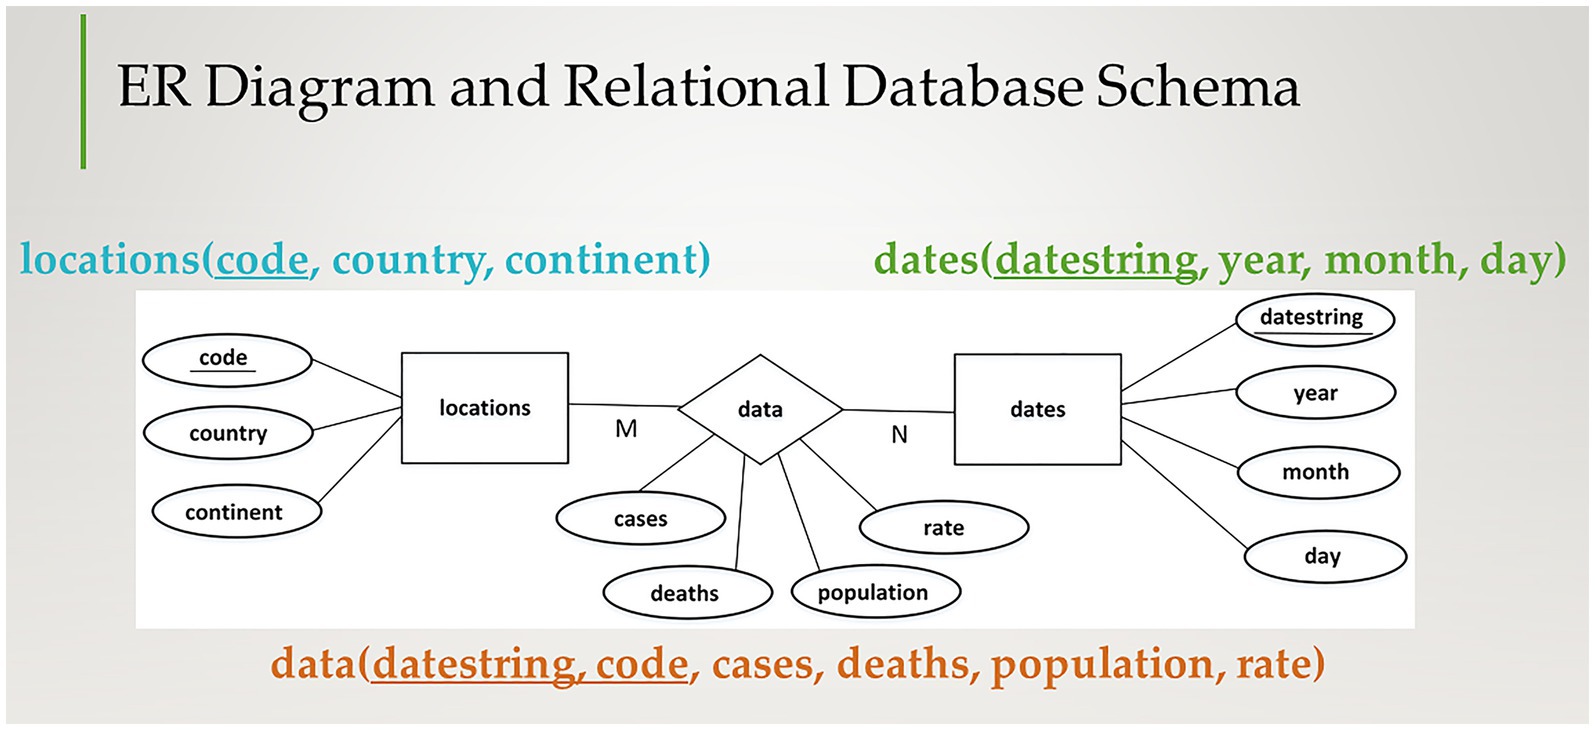
Figure 2. Entity-relationship diagram and proposed mapping to relational tables.
In the relational database design, each concept from the original CSV data is in its own table. The locations table will have only one row for each location, uniquely identified by its code. A date will appear only once in the dates table, uniquely identified by its datestring. For the data table, the location code and date must appear with the attributes describing the information for that location and date (cases, deaths, population, rate). In the original CSV, the country and continent was repeated for each date in the data. Databases do not want unnecessary repetition of information due to the issues that may arise when updating, deleting or inserting data in the database. These issues, known as anomalies, are described by example in the visualization that introduces relational databases.
Students were then introduced to the industry-standard SQL query language through an introduction to querying databases visualization and formative assessment exercise. Whereas spreadsheets are limited to formulas, databases use the SQL query language to relate the data across tables for analysis. In the data table, the datestring and code attributes are called foreign keys, which means that they represent primary keys in another table. Using SQL, queries can join the information across tables using the primary and foreign keys.
The database project utilized a free software known as SQLite (SQLite Consortium, 2024). SQLite provides a full-featured SQL database engine and saves a database in a single file. SQLite is widely used across many platforms and libraries are available in most programming languages for accessing the database within a program. SQLite also provides free browser software for interacting with the database, which is what the class utilized.
Figure 3 provides an overview of the database project applied in the context of the COVID dataset. An entire class was allocated to going over the sample. A pdf of the step-by-step process with screenshots and highlighting was provided to the students on the course management system before class. The instructor recorded the class which demonstrated these steps and the video was posted after class. Essentially, the original CSV dataset is imported as a single table in a SQLite database. SQL queries create the data needed for populating each table in the proposed relational database. The result of each query can be exported to a CSV file. After a new SQLite database is created with the tables defined using SQL “create table” statements, the CSV files are imported to populate the tables.
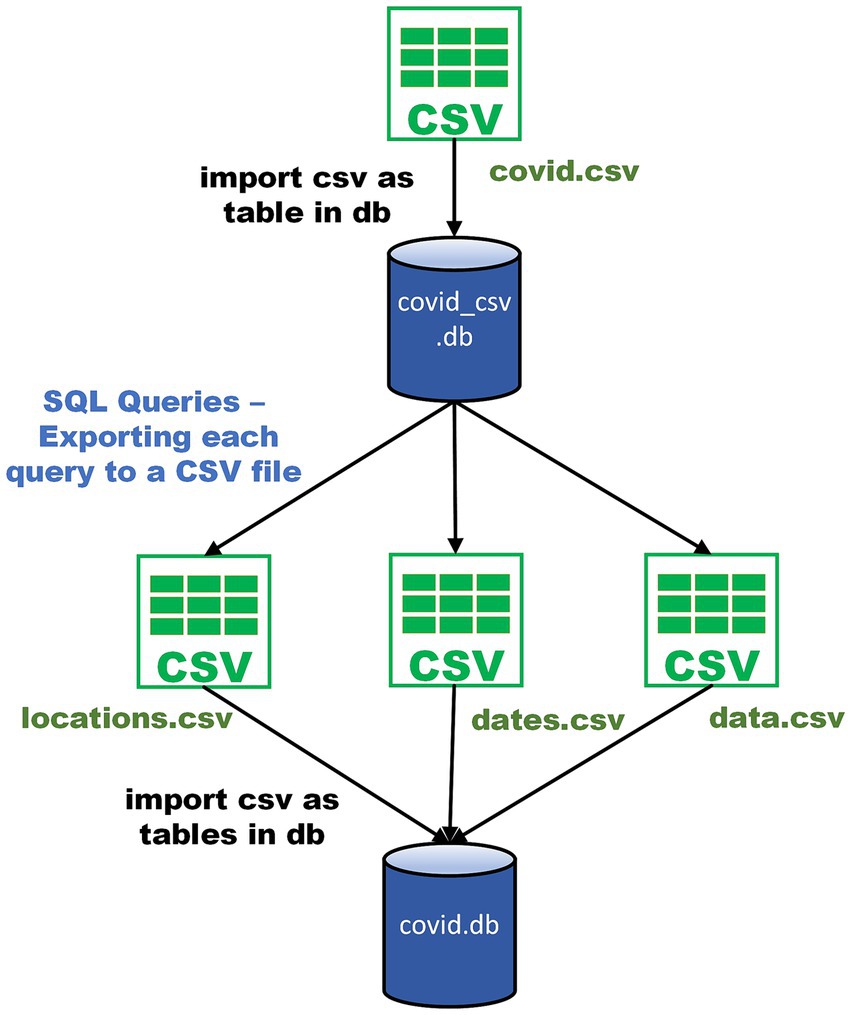
Figure 3. Overview of database project using sample COVID dataset.
The student group project consisted of applying the techniques illustrated on the COVID dataset to their chosen dataset. There was an intermediate deliverable consisting of a revised CORGIS Dataset Presentation based on feedback provided by the instructor, along with the “create table” commands in SQL for storing the data and SQL queries over the original CSV dataset to generate the data for later population of the tables. The instructor provided detailed feedback on the intermediate deliverable to assist each group in the submission of a correct final deliverable that created a relational database for their chosen CORGIS dataset. Each student was also responsible for including an SQL query of their choice to answer a question over their database that required a join of at least two tables with ordering of results on multiple attributes. Each group presented their databases on the last day of class. Their presentation extended the earlier presentation that described the dataset and database design with the SQL table export queries used to populate their database, each group member’s SQL query, and a reflection on the lessons learned from the experience.
The CORGIS datasets chosen by the student groups included: Airlines, Broadway, Cancer, Classics, Drugs, Health, Hydropower, and Opioids. All datasets resulted in databases with only 3–4 tables. Some were as straightforward as the COVID dataset whereas others were more complicated due to the encoding of the data. One such example was the Cancer dataset, which had over 70 columns that encoded the cancer rate based on the type of cancer, age ranges, race, and sex. The database generalized the concepts to 4 tables: state, cancer, stats, and rate where rate represented the value for a type of cancer and a stat, which is a combination of the age, race, and sex attributes for a particular state. Other data sets illustrated inconsistent representations for data in text fields. For example, in the Hydropower dataset, the Location.County field had multiple representations for dams that cross counties: “Dona Ana, NM; El Paso, Tx,” “Mohave (AZ), Clark (NV),” “Imperial, CA; Yuma, AZ,” “Yuma, Ariz and Imperial, Calif.” The different representations of the same information provide a counter-example to students, showing that data must have a consistent description to support computational processing and storage in a database.
The goal of the database group project is to introduce STEM students to database concepts using real data. The understanding of data stored as concepts and associations between these concepts will guide them in future endeavors of storing raw data in either a spreadsheet or a database with consistent representation. Since this was a one-credit course, only an introduction to querying of data in a database could be covered. Informal discussions of the database group project with students prompted the development and implementation of a survey to gain feedback on the first offering of the data and ethics topic of the STEM Success class.
5 Research participants, methods and analysis
5.1 Research methods
This phenomenological study (Leedy and Ormrod, 2019) examined the experiences of science, technology and math/statistics students who learned basic database analysis skills as part of a general studies course focused on success in STEM career paths. As part of the study, students voluntarily submitted responses to an online survey that contained Likert-scale questions and open-ended questions about their experiences in the course. Figure 4 provides an overview of the data collection process and analysis.

Figure 4. Overview of the data collection process and analysis.
5.2 Participants
Survey respondents included 10 students who took the STEM Success (STEM career skills) course. A total of 25 students were enrolled in the course in Fall 2022, and all of these students were invited to take a brief online survey following the Spring 2023 semester. Participation was voluntary and confidential. Students were recruited via email, including one initial message and one reminder message 2 weeks later, in which they were sent a link to a Google form. The first page of the form was a consent form, and students were required to check a box agreeing to their participation before the rest of the survey became available. They did not receive any compensation for taking the survey. Of the 10 students who volunteered to participate in the study, 6 self-identified as male and 4 as female. Six students identified as pursuing a natural science major (biology, environmental science, pharmacology/toxicology or forensic science) whereas 4 were pursuing mathematical sciences (applied computing, applied mathematics, or statistics). Two of the students had already graduated from the university when they took the survey.
5.3 Survey instrument
The online survey was constructed to assess student attitudes pertaining to their confidence in, perceived usefulness of, and interest in databases, and to ask for feedback on the data and ethics content of the course (including specific feedback regarding the group project). The first part of the survey included Likert-scale responses, in which students indicated how much they agree or disagree with each, to assess different learning-related constructs. The attitude constructs (confidence, usefulness, and interest) were based on a validated Computer Science Attitudes Survey (Heersink and Moskal, 2010) where terminology referring to computer science was changed to databases. This same survey was also used in a study on the impact of the customized version of introductory database visualizations on both learning and attitudes towards databases (Dietrich et al., 2021), which indicated that learning outcomes are met regardless of the visualization’s customization but attitudes and beliefs towards the usefulness of databases were more positive with the contextualization.
The second part of the survey consisted of open-ended questions to gather feedback for possible future offerings of the Data and Ethics topic. These included:
• “How has learning about databases influenced your future plans, and if so how? Please elaborate about how you see yourself using databases in your future career path.”
• “Would you recommend that we include the Data & Ethics coverage for future STEM success classes? Why or why not?”
• “Please provide constructive feedback for the structure of the database project:
o Should the project be group or individual?
o Why do you think so?
o What was your experience like working with your group (or independently)?”
o Should the dataset be the same for all or chosen from a list of provided datasets across different majors? Why? What benefits do you see in structuring it this way?”
o Did you find the class presentations beneficial?
o Which topics helped you the most?
o Were there any topics you would have LIKED to see, or topics that were less helpful?”
o Additional feedback that you can share with us about your experiences?”
The open-ended questions were analyzed qualitatively (Schreier, 2012) using a thematic approach. The responses to the questions above were read by two of the authors first to identify themes, and then again to group the responses into themes. Five themes were identified, as noted below:
• Influence - how/if the project influenced the student’s future STEM career plans
• Include - whether or not the student thought that databases and ethics should be included for future student cohorts
• Presentations - how/if student presentations aided understanding of others in the course
• Use of data sets - whether there should be a variety of data sets offered
• Group or individual - did they prefer to work in teams, or individually, on their projects
Finally, students were asked to respond (optionally) to a few demographic questions, such as their major and gender identification, and these responses are summarized in the description of our participants. The complete survey is available - see Data Availability statement.
5.4 Analysis
The Likert-scale survey responses were analyzed quantitatively by calculating a mean score and standard deviation for each set of responses, including confidence, usefulness and interest. The open-ended responses were examined by first identifying themes and quotes, which were then grouped into categories, as shown in Figure 4.
6 Results
Both quantitative and qualitative results were obtained for this mixed methods study. The quantitative, Likert-scale survey results related to students’ confidence with, perceived usefulness of, and interest in databases were analyzed by computing a mean and a standard deviation for each score. These results are summarized in Figure 5. A score of less than three would indicate that students’ generally disagree with the positive statements, and a score of more than three indicates that students generally agreed with the positive statements. The qualitative results were analyzed using a thematic analysis, and these results are summarized in Figure 6.
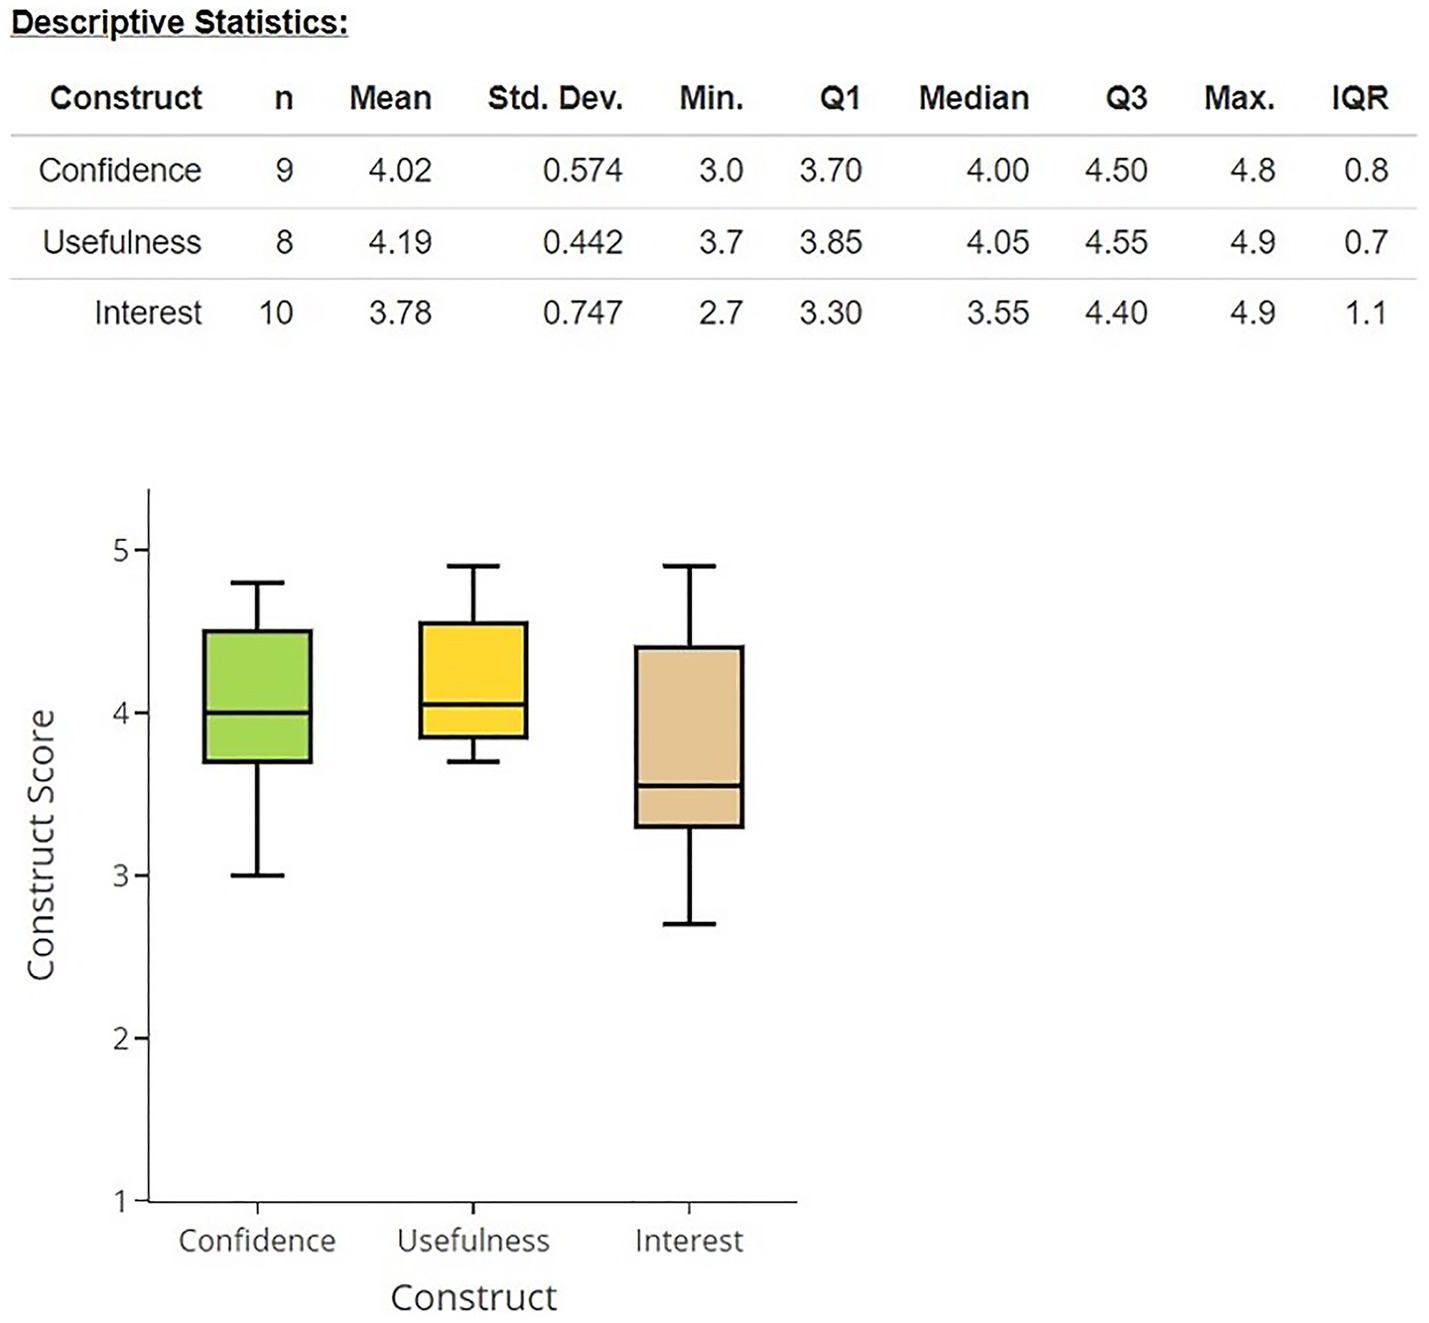
Figure 5. Student attitudes pertaining to their confidence with (8 questions), usefulness of (7 questions), and interest in (10 questions) database knowledge and skills.
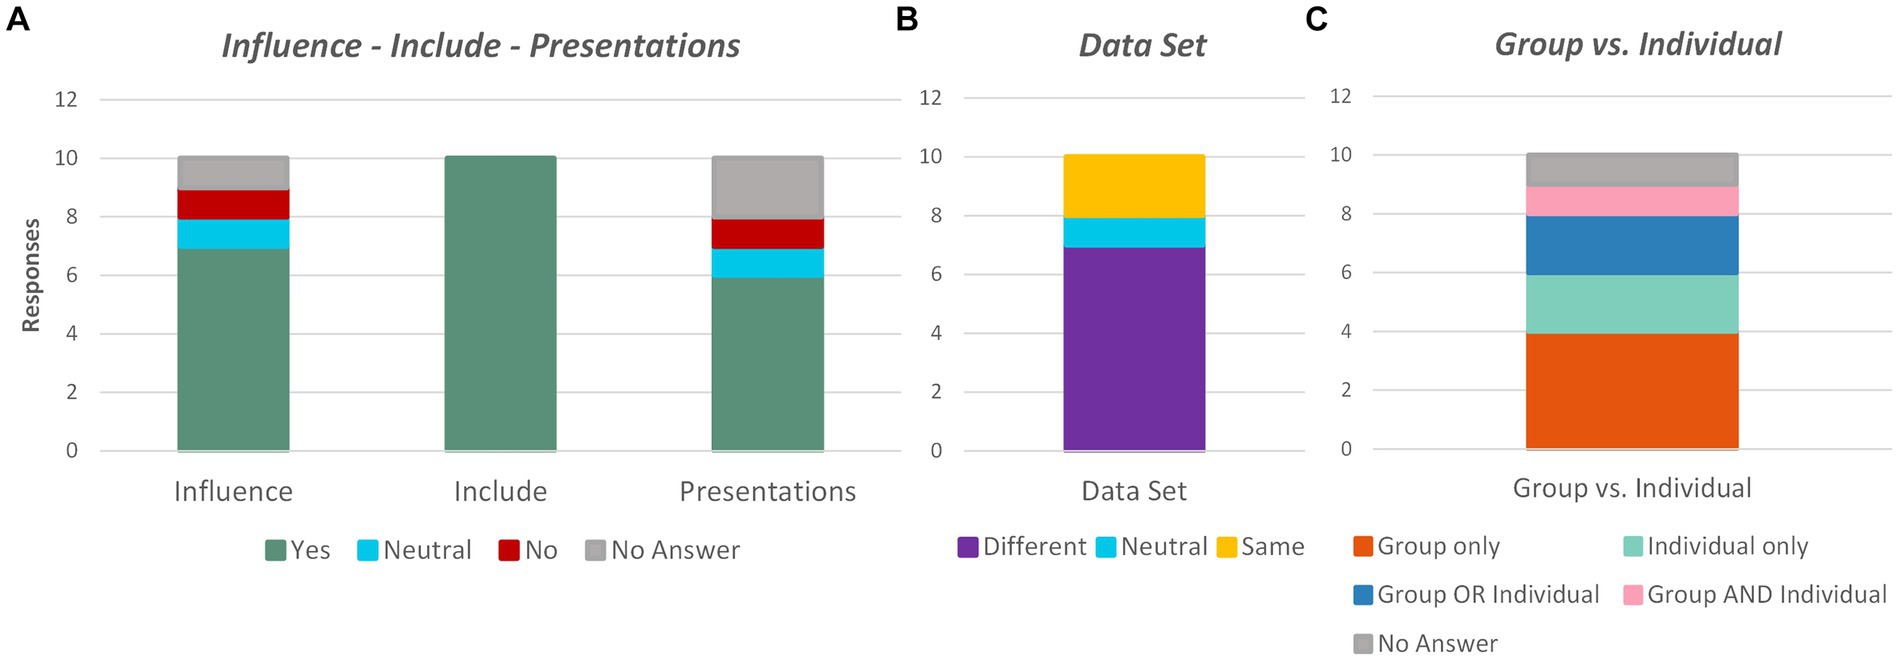
Figure 6. Code analysis of student’s responses on open-ended questions. (A) Indicates responses regarding the influence of databases on student future plans, the inclusion of databases for future offerings, and the use of project presentations for understanding (B) Shows feedback on the choice of the same or different data sets for the project (C) Summarizes comments on the structure of the database project as group versus individual.
Figure 5 demonstrates the results of the attitude and belief questions in the survey. Students reported generally high confidence (4.10 +/− 0.59) in and usefulness (4.15 +/− 0.52) of database knowledge and skills. For example, all students agreed or strongly agreed that they are confident in their ability to solve problems using database applications (confidence) and expect that learning to use database skills will help them achieve their career goals (usefulness). Additionally, all respondents answered “yes” to “Would you recommend that we include the Data and Ethics coverage for future STEM success classes,” with several noting the value and utility of this information (e.g.: “Yes, the world is not going to get any less digital…”; “Yes, because data is more prevalent that [sic] it has ever been; regardless of the student’s field of study, it will likely have an impact on their career to some degree;” “Yes, it’s very important in the healthcare setting…”).
Regardless of their confidence in the material and the perceived utility of the information, students tended toward neutrality with regard to their overall interest in databases or in learning more about databases and their applications (3.78 +/− 0.74). Even so, all but two students agreed or strongly agreed that they think databases are interesting, (with the other two selecting neutral, as opposed to disagree or strongly disagree) and only one person “agreed” that “databases are boring,” while all other students remained neutral (3), disagreed (3), or strongly disagreed (3) with this statement. Additionally, six students expressed interest in voluntarily taking additional database courses, whereas the other four students remained neutral about this possibility (rather than expressing disinterest). Students’ perceived utility of the information did not always align with their interest in the subject; for example, one student noted that “I can work with [databases] but… I am entirely neutral about using them.” However, for some, the curriculum inspired confidence and resulting interest: “After learning about databases, I am open to job opportunities involving data analysis, and would like to do a cybersecurity job that requires use of databases. I am also less intimidated by databases because I learned about them.”
Figure 6 shows the thematic analysis of the student’s essay responses. Two of the authors categorized student responses based on themes individually, and then met to reach a consensus. Figure 6A shows an overview of the responses on influence, topic inclusion, and presentation. Most agreed that the data and ethics curriculum had influenced their future plans. Almost all agreed that the curriculum should be included in the rotation of topics for the STEM Success class. A majority of the students thought that the class presentations were useful for comparison and for increasing their understanding of the material. Figure 6B illustrates that most of the students thought that the project should allow choice of data sets from a preselected pool of options across the various STEM majors in the class. Figure 6C summarizes the responses for group versus individual projects, which were more mixed, with some opinions indicating only group, only individual, or a combination of both.
7 Discussion and future directions
This paper reflected on the introduction of relational database concepts to a class containing a variety of STEM majors by surveying the participants both on their attitudes and for specific feedback. As stated by others (Klug et al., 2017; Wilson Sayres et al., 2018; Williams et al., 2019), many natural science undergraduate curricula do not include the increasingly necessary and useful database skills that were taught as part of this course. While some academic programs have addressed this problem by adding data science minors or by promoting double majors in data science fields, it may be more helpful to incorporate these concepts into natural science curriculum directly, as has been documented by others (Magana et al., 2014; Madlung, 2018; Jouaneh et al., 2022; Gao and Guo, 2023).
As detailed by Messager et al. (2022), many natural science students are uncomfortable using databases, even at the basic level of entering data into a system. In the present study, the attitudes and belief survey indicated that most students in the sample agreed that databases are useful and gained confidence in their ability to solve problems using databases. Despite this, their overall interest in learning more about databases tended toward neutral. However, open-ended feedback indicated that the course had influenced their career plans and that the data and ethics curriculum should be included in future iterations of the STEM Success course. We propose that as students gain confidence in their abilities in utilizing databases, they may be more likely to consider minors, double majors and/or career paths in data science as proposed by Zilora (2011). Additionally, it is an increasingly sought-after skill for scientists to be able to effectively store, analyze, and interpret large datasets (Harris et al., 2014) – thus, this curriculum will aid in the future employability of STEM students.
A difficulty in introducing database curriculum into STEM courses is that STEM faculty may lack the expertise and/or confidence necessary to effectively discuss the necessary concepts (Williams et al., 2019). If databases can be offered early in the natural science college curriculum, its inclusion could be seen as a strategy to recruit students into data science minors or double majors, such that it benefits the data science department to share faculty expertise with related programs. As one example, Erkan and Lee’s (2019) non-majors computing course focused on spreadsheets and databases, and acted as a prerequisite to the database course for computer science majors – thus, students were able to seamlessly transition from a STEM to a computer science program. Alternatively, data science curriculum may be infused into natural science coursework through pre-packaged programs/curriculum offered by external partners, such as that posted by Project EDDIE (Farrell and Carey, 2018).
As described in the Results section, most students agreed that the database curriculum was beneficial; however, they had some suggestions for improving upon the curriculum and its integration into this general STEM Success course. Specifically, it was suggested that the database project be revised so that students are provided a predefined set of datasets from which to choose rather than being given the freedom to choose from the 60 options through CORGIS to ensure that datasets chosen are similar in complexity and scale. A risk with database curriculum for nonmajors is the potential for students to feel defeated and therefore demotivated (Farrell and Carey, 2018). Providing a collection of feasibly organized datasets, as suggested by student feedback in this study, could mitigate the risk of students getting lost in the details of a complicated dataset and becoming demotivated to complete the remainder of the project. Additionally, motivation increases when individuals are provided with a task that is challenging but still appropriately matches their skill level, encouraging them to grow and improve (Dweck and Leggett, 1988; Bandura, 1997; Yarborough and Fedesco, 2020). Indeed, after completion of some particularly challenging database projects (e.g.: the Cancer project), students shared with the instructor that they felt empowered by the knowledge of databases and were considering looking into additional opportunities to expand their education in this realm. Thus, pre-selection of a group of datasets that are appropriately challenging but within reach for students with no experience with database design is key in future curriculum deployments.
Student feedback also indicated that the course should continue to include class presentations so that students can learn from one another. Student opinions varied with respect to the structure of the project as group or individual; however, the existing group structure included an individual project component for querying of the data, and as such allowed for both independent and group work. Collaborative group learning benefits students in STEM and computer science curriculum tremendously and this was an influence in the initial plans for group projects (Huysken et al., 2019; Lin et al., 2021). Additionally, STEM fields such as engineering are increasingly recognizing the importance of students to work in interdisciplinary teams, further supporting the benefits of including group work in STEM Success programming (Finelli et al., 2011).
In addition to introducing data concepts, the course integrated a component on ethics, in which the instructor utilized their existing knowledge of computer science ethics and the FAIR guiding principles for sharing scientific data. Based on their observations of and interactions with students in the class discussions regarding ethics, the instructor identified an additional improvement for the course. Rather than focusing on computer science ethics, the ethics coverage should be explored in the context of various STEM disciplines. Also, additional references on the FAIR principles, besides (Wilkinson et al., 2016), are needed for an accessible overview of the guidelines to a general undergraduate STEM audience.
While this study has been illuminating, it was not without limitations. The survey provided valuable feedback, but it was limited due to only 10 out of 25 students responding. Unfortunately, due to the complex needs of teaching assignments and changes to the scholarship project due to the funding cycle, the data and ethics topic has not yet been offered a second time for the STEM Success class. There is, however, great potential to expand upon it as more programs, including those at the authors’ institution, work to integrate data science into all STEM curriculum. This study demonstrated the potential of incorporating database literacy and data science techniques into general STEM curricula, and the many benefits that students gain from their participation. Going forward, we will track these students to determine if they are more likely to enroll in a data science intensive graduate program or job after graduation. Further, we would like to integrate this curriculum into a variety of natural and mathematical science curricula and examine its impact on our students’ data fluency.
Data availability statement
The datasets presented in this article are not readily available because of a small number of participants. However, the database project sample and the survey presented in this study are available in the Databases for STEM Success component (https://osf.io/zhaxs/) of the Open Science Framework site for the Databases for Many Majors project: https://osf.io/qgepn. Requests to access the datasets should be directed to SD, ZGlldHJpY2hAYXN1LmVkdQ==.
Ethics statement
The studies involving humans were approved by Arizona State University Institutional Review Board. The studies were conducted in accordance with the local legislation and institutional requirements. The participants provided their written informed consent to participate in this study.
Author contributions
SD: Writing – original draft, Writing – review & editing. AC: Writing – original draft, Writing – review & editing. SS: Writing – original draft, Writing – review & editing.
Funding
The author(s) declare that financial support was received for the research, authorship, and/or publication of this article. This work was supported in part by the National Science Foundation grant number DUE-1742038.
Acknowledgments
The authors thank Jennifer Broatch for her guidance on creating some of the charts included in this paper.
Conflict of interest
The authors declare that the research was conducted in the absence of any commercial or financial relationships that could be construed as a potential conflict of interest.
Publisher’s note
All claims expressed in this article are solely those of the authors and do not necessarily represent those of their affiliated organizations, or those of the publisher, the editors and the reviewers. Any product that may be evaluated in this article, or claim that may be made by its manufacturer, is not guaranteed or endorsed by the publisher.
Author disclaimer
Any opinions, findings, and conclusions or recommendations expressed in this material are those of the author(s) and do not necessarily reflect the views of the National Science Foundation.
References
American Veterinary Medical Association. Principles of Veterinary Medical Ethics of the AVMA. (2024). Available at:https://www.avma.org/resources-tools/avma-policies/principles-veterinary-medical-ethics-avma Accessed on March 13, 2024.
Association for Computing Machinery, ACM Code of Ethics and Professional Conduct. (2024) Available at:https://www.acm.org/code-of-ethics. Accessed on March 13, 2024
Bandura, A. (1997). Self-efficacy: The exercise of control : W H Freeman/Times Books/Henry Holt & Co.
Bart, A. C., Whitcomb, R., Kafura, D., Shaffer, C. A., and Tilevich, E. (2017). “Computing with CORGIS: diverse, real-world datasets for introductory computing” in Proceedings of the 2017 ACM SIGCSE technical symposium on computer science education (SIGCSE '17) (New York, NY, USA: Association for Computing Machinery), 57–62.
Bart, A. C., Whitcomb, R., Riddle, J., Saleem, O., Tilevich, E., Shaffer, C. A., et al. (2024). CORGIS: The collection or really great, interesting, situated datasets. Available at:https://corgis-edu.github.io/corgis/. Accessed on March 13, 2024
Center for Open Science (2017). Open Science Framework (OSF). J. Med. Libr. Assoc.., Vol. 105, No. (2017), pp. 203–206, doi: 10.5195/jmla.2017.88
Dietrich, S. W., and Goelman, D. (2017). “Formative self-assessment for customizable database visualizations: checkpoints for learning,” In Paper presented at 2017 ASEE Annual Conference & Exposition. Columbus, Ohio
Dietrich, S. W., and Goelman, D. (2024). Databases for Many Majors. Available at:https://databasesmanymajors.faculty.asu.edu. Accessed on March 13, 2024
Dietrich, S. W., Goelman, D., Borror, C. M., and Crook, S. M. (2015). An animated introduction to relational databases for many majors. IEEE Trans. Edu. 58, 81–89. doi: 10.1109/TE.2014.2326834
Dietrich, S. W., Goelman, D., Broatch, J., Crook, S., Ball, B., Kobojek, K., et al. (2020). Using formative assessment for improving pedagogy: reflections on feedback informing database visualizations. ACM Inroads 11, 27–34. doi: 10.1145/3430766
Dietrich, S. W., Goelman, D., Broatch, J., Crook, S., Ball, B., Kobojek, K., et al. (2021). Introducing databases in context through customizable visualizations. Front. Educ. 6:719134. doi: 10.3389/feduc.2021.719134
Dweck, C. S., and Leggett, E. L. (1988). A social-cognitive approach to motivation and personality. Psychol. Rev. 95, 256–273. doi: 10.1037/0033-295X.95.2.256
Environmental Data Initiative (2024). EDI Data Portal. Available at:https://portal.edirepository.org/nis/home.jsp. Accessed on March 13, 2024.
Erkan, A., and Lee, A. (2019). “Connecting majors/non-majors courses via tabular data” in Proceedings of the 2019 ACM conference on innovation and Technology in Computer Science Education (ITiCSE '19) (New York, NY, USA: Association for Computing Machinery), 235–236.
Farrell, K. J., and Carey, C. C. (2018). Power, pitfalls, and potential for integrating computational literacy into undergraduate ecology courses. Ecol. Evol. 8, 7744–7751. doi: 10.1002/ece3.4363
Finelli, C. J., Bergom, I., and Mesa, V. (2011). Student teams in the engineering classroom and beyond: setting up students for success. CRLT Occasional Papers 29:12.
Gao, L., and Guo, M. (2023). A course-based undergraduate research experience for bioinformatics education in undergraduate students. Biochem. Mol. Biol. Educ. 51, 189–199. doi: 10.1002/bmb.21710
Goelman, D. (2008). “Databases, non-majors and collaborative learning: a ternary relationship” in Proceedings of the 13th annual conference on innovation and Technology in Computer Science Education (ITiCSE ‘08) (New York, NY, USA: Association for Computing Machinery), 27–31.
Goelman, D., and Dietrich, S. W. (2018). “A visual introduction to conceptual database design for all” in Proceedings of the 49th ACM technical symposium on computer science education (SIGCSE '18) (New York, NY, USA: Association for Computing Machinery), 320–325.
Gotterbarn, D., and Miller, K. W. (2009). The public is priority: making decisions using the software engineering code of ethics. Computer 42, 66–73. doi: 10.1109/MC.2009.204
Harris, J. G., Shetterley, N., Alter, A. E., and Schnell, K. (2014). It takes teams to solve the data scientist shortage. Available at:http://blogs.wsj.com/cio/2014/02/14/it-takes-teamsto-solve-the-data-scientist-shortage.
Harvard (2024). Harvard Dataverse. Available at:https://dataverse.harvard.edu/. Accessed on March 13, 2024.
Heersink, D., and Moskal, B. M. (2010). “Measuring high school students’ attitudes toward computing” in Proceedings of the 41st ACM technical symposium on computer science education (SIGCSE ‘10) (New York, NY, USA: Association for Computing Machinery), 446–450.
Huysken, K., Olivey, H., McElmurry, K., Gao, M., and Avis, P. (2019). Assessing collaborative, project-based learning models in introductory science courses. J.Scholar. Teach. Learn. 19, 6–28. doi: 10.14434/josotl.v19i1.26777
Jouaneh, T. M. M., Rosario, M. E., Li, Y., Leibovitz, E., and Bertin, M. J. (2022). Incorporating LC−MS/MS analysis and the Dereplication of natural product samples into an upper-division undergraduate laboratory course. J. Chem. Educ. 99, 2636–2642. doi: 10.1021/acs.jchemed.1c01212
Kafura, D., Sutphin, M., Choi, J. M., and Guan, B. (2021) Covid CSV File from the CORGIS Dataset Project. Available at:https://corgis-edu.github.io/corgis/csv/covid/. Accessed on March 13, 2024
Klug, J. L., Carey, C. C., Richardson, D. C., and Gougis, R. D. (2017). Analysis of high-frequency and long-term data in undergraduate ecology classes improves quantitative literacy. Ecosphere 8:e01733. doi: 10.1002/ecs2.1733
Leedy, P. D., and Ormrod, J. E. (2019). Practical research: Planning and design. 12th Edn. New York: Pearson.
Lin, X, and Connors, J., Lim, C., and Hott, J. R. (2021). How do students collaborate? Analyzing group choice in a collaborative learning environment. In Proceedings of the 52nd ACM technical symposium on computer science education (SIGCSE '21). Association for Computing Machinery, New York, NY, USA, 212–218
Madlung, A. (2018). Assessing an effective undergraduate module teaching applied bioinformatics to biology students. PLoS Comput. Biol. 14:e1005872. doi: 10.1371/Journal.pcbi.1005872
Magana, A. J., Taleyarkhan, M., Alvarado, D. R., Kane, M., Springer, J., and Clase, K. (2014). A survey of scholarly literature describing the field of bioinformatics education and bioinformatics educational research. CBE Life Sci. Educ. 13, 607–623. doi: 10.1187/cbe.13-10-0193
Messager, M. L., Comte, L., Cuoto, T. B. A., Koontz, E. D., Kuehne, L. M., Rogosch, J. S., et al. (2022). Course-based undergraduate research to advance environmental education, science, and resource management. Front Ecol Environ 2022 20, 431–440. doi: 10.1002/fee.2507
Snyder, L., and Henry, R. (2018). Fluency with information technology: Skills, concepts, & capabilities. 7th Edn: Pearson.
Society of Toxicology. (2024). Code of Conduct. Available at:https://www.toxicology.org/about/vp/code-of-conduct.asp. Accessed on March 13, 2024.
SQLite Consortium. (2024). SQLite. Available at:https://sqlite.org. Accessed on March 13, 2024
Sullivan, D. G. (2013). “A data-centric introduction to computer science for non-majors” in Proceedings of the 44th ACM technical symposium on computer science education (SIGCSE '13) (New York, NY, USA: Association for Computing Machinery), 71–76.
Walker, H. W. (2015). Priorities for the non-majors, CS course: programming may not make the cut. ACM Inroads 6, 46–49. doi: 10.1145/2727127
Wilkinson, M., Dumontier, M., Aalbersberg, I., Appleton, G., Axton, M., Baak, A., et al. (2016). The FAIR guiding principles for scientific data management and stewardship. Sci Data 3:160018. doi: 10.1038/sdata.2016.18
Williams, J. J., Drew, J. C., Galindo-Gonzalez, S., Robic, S., Dinsdale, E., Morgan, W. R., et al. (2019). Barriers to integration of bioinformatics into undergraduate life sciences education: a national study of US life sciences faculty uncover significant barriers to integrating bioinformatics into undergraduate instruction. PLoS One 14:e0224288. doi: 10.1371/journal.pone.0224288
Wilson Sayres, M. A., Hauser, C., Sierk, M., Robic, S., Rosenwald, A. G., Smith, T. M., et al. (2018). Bioinformatics core competencies for undergraduate life sciences education. PLoS One 13:e0196878. doi: 10.1371/journal.pone.0196878
Yarborough, C. B., and Fedesco, H. N. (2020). Motivating students. Available at:https://cft.vanderbilt.edu//cft/guides-sub-pages/motivating-students/.
Keywords: STEM, databases, scientific data, ethics, interdisciplinary
Citation: Dietrich SW, Cunningham AM and Sandrin SK (2024) Databases for STEM success: lessons learned. Front. Educ. 9:1414458. doi: 10.3389/feduc.2024.1414458
Edited by:
Ali Ibrahim Can Gözüm, Kafkas University, TürkiyeReviewed by:
Mary Ellen Wiltrout, Massachusetts Institute of Technology, United StatesZerrin Mercan, Bartin University, Türkiye
Copyright © 2024 Dietrich, Cunningham and Sandrin. This is an open-access article distributed under the terms of the Creative Commons Attribution License (CC BY). The use, distribution or reproduction in other forums is permitted, provided the original author(s) and the copyright owner(s) are credited and that the original publication in this journal is cited, in accordance with accepted academic practice. No use, distribution or reproduction is permitted which does not comply with these terms.
*Correspondence: Suzanne W. Dietrich, ZGlldHJpY2hAYXN1LmVkdQ==