
95% of researchers rate our articles as excellent or good
Learn more about the work of our research integrity team to safeguard the quality of each article we publish.
Find out more
ORIGINAL RESEARCH article
Front. Educ. , 19 July 2024
Sec. STEM Education
Volume 9 - 2024 | https://doi.org/10.3389/feduc.2024.1414423
This article is part of the Research Topic Exploring Sources and Mitigation Strategies for Science Anxiety in Educational Contexts View all articles
 Lawrence Grabau1*
 Benoît Galand2
 Dominique Lafontaine3†
 Jari Lavonen4†Ragnar F. Ólafsson5†Louis Trudel6†
 SaeYeol Yoon7†
What is the shape of the association between schoolwork-related anxiety (SRA; sometimes referred to as “test anxiety”) and science literacy proficiency (SLP)? Prior results in some areas (e.g., Flanders) have showed an inverse linear relationship between SRA and SLP. Intriguingly, academic anxiety showed an inverse “U-shaped” association with academic performance in Taiwan. Data for six southeast Asian (SEA; Hong Kong, Japan, Korea, Macao, Singapore, Taiwan) and six northwest European (NWE; Belgium, Estonia, Finland, Iceland, Ireland, the Netherlands) nations/entities were drawn from PISA 2015, the most recent science-focused iteration of OECD’s (Organization for Economic Cooperation and Development) triennial PISA (Programme for International Student Assessment) evaluations. Mean SRA and SLP, respectively, were 0.34 and 532 across the selected SEA representatives (aggregate n = 35711) and −0.21 and 515 across the identified NWE nations (n = 34601). We sorted each nation’s/entity’s dataset into five SLP levels (utilizing PISA’s own criteria) and placed students into SLP levels based on an average of ten plausible values for each individual student). ANOVA results showed Taiwan, Japan, and Korea, (with some qualified evidence for SEA as a region) to have an inverse U-shaped relationship between SRA and SLP; Finland, and Iceland (along with modest evidence for NWE as a region) had a negative linear relationship between SRA and SLP. Multilevel modeling (MLM; within nations/entities only) partially confirmed our parallel ANOVA results: an inverse U-shaped relationship for Taiwan, and the negative linear relationship for Finland and Iceland. Our Belgian MLM also showed negative linearity. Thus, our results confirmed the earlier observation of an inverse U-shaped relationship between student anxiety measures and academic performance in Taiwan (extending that finding to a science context—and further extending that finding for science to Japan and Korea). We discuss possible classroom interventions aimed at mitigating non-adaptive anxieties among students at intermediate SLP levels.
“Science anxiety is a phenomenon of national scope which is well known but little understood and rarely dealt with. Professors of physics, chemistry, and biology have long recognized that many students enter the introductory courses, already fearful of the material, and expecting to do poorly” (Mallow, 1978, p. 862). Perhaps, a science professor/teacher could have authored a very similar statement in 2024! Mallow, a university-level physics professor, has continued to research science anxiety (Mallow, 1994; Mallow and Kastrup, 2023); however, much fallow ground in this arena remains. A recent meta-analysis, covering test anxiety research over a 30-year span (1988–2018), concluded that test anxiety is significantly and inversely related to a broad spectrum of educational outcomes (von der Embse et al., 2018). Furthermore, science anxiety (as such) has impeded students from achieving their potential in science-related fields (Udo et al., 2004). Unfortunately, many science students still experience varying levels of science anxiety (Megreya et al., 2021); painfully, the related construct of schoolwork-related anxiety (SRA) may depend on their cultural settings (Altun and Kalkan, 2021). For example, as Table 1 illustrates, SEA students reported generally higher levels of SRA (Korea was the exception) than did their peers from NWE (OECD, 2017b). Further, while the normative expectation is that higher performing students would experience less science anxiety (Cassady and Johnson, 2002); Taiwanese students reported academic anxiety in an inverse U-shaped fashion; that is, both low- and high-performing students experienced less academic anxiety than did their peers with intermediate scores (Sung et al., 2016). The term “inverse U-shaped” was invoked by Sung et al. (2016) to emphasize that their results expressed a particular sort of curvilinear relationship—that the outcome measure (academic anxiety in this case) for both extremes of the independent variable (academic performance) than for the intermediate levels of the independent variable. Our research was intended to determine if the results of Sung et al. (2016) might be relevant to a potential relationship of SRA with SLP—thus, moving from their generalized academic context to a more specific science context. Further, might other nations/entities geographically/culturally near Taiwan (Sung et al., 2016; e.g., SEA) also display an inverse U-shaped relationship between SRA and science literacy? Perhaps, geographically/culturally distant nations/entities (e.g., NWE) might show a negative linear relationship between SRA and SLP (Cassady and Johnson, 2002)? Ólafsson and Hansen (2022) found that teaching and learning practices have shown connections with geographic nearness and cultural similarity, thus supporting possible similarities among near neighbor nations/entities. Preliminary information from Flanders (Grabau, 2022) revealed decreasing SRA with higher tracks, suggesting a negative linear relationship with higher SLP. This introduction is intended to shed further light on four sequentially connected concepts by: (i) contextualizing a range of anxieties that science students may experience, (ii) reviewing research relating science anxiety to science performance, (iii) providing two theoretical frameworks through which to evaluate the social comparisons that science students may be making (as well as the stereotype threats that they may be sensing), and, finally, (iv) considering the practical importance of a potential inverse U-shaped relationship between science students’ SRA and their science performance.
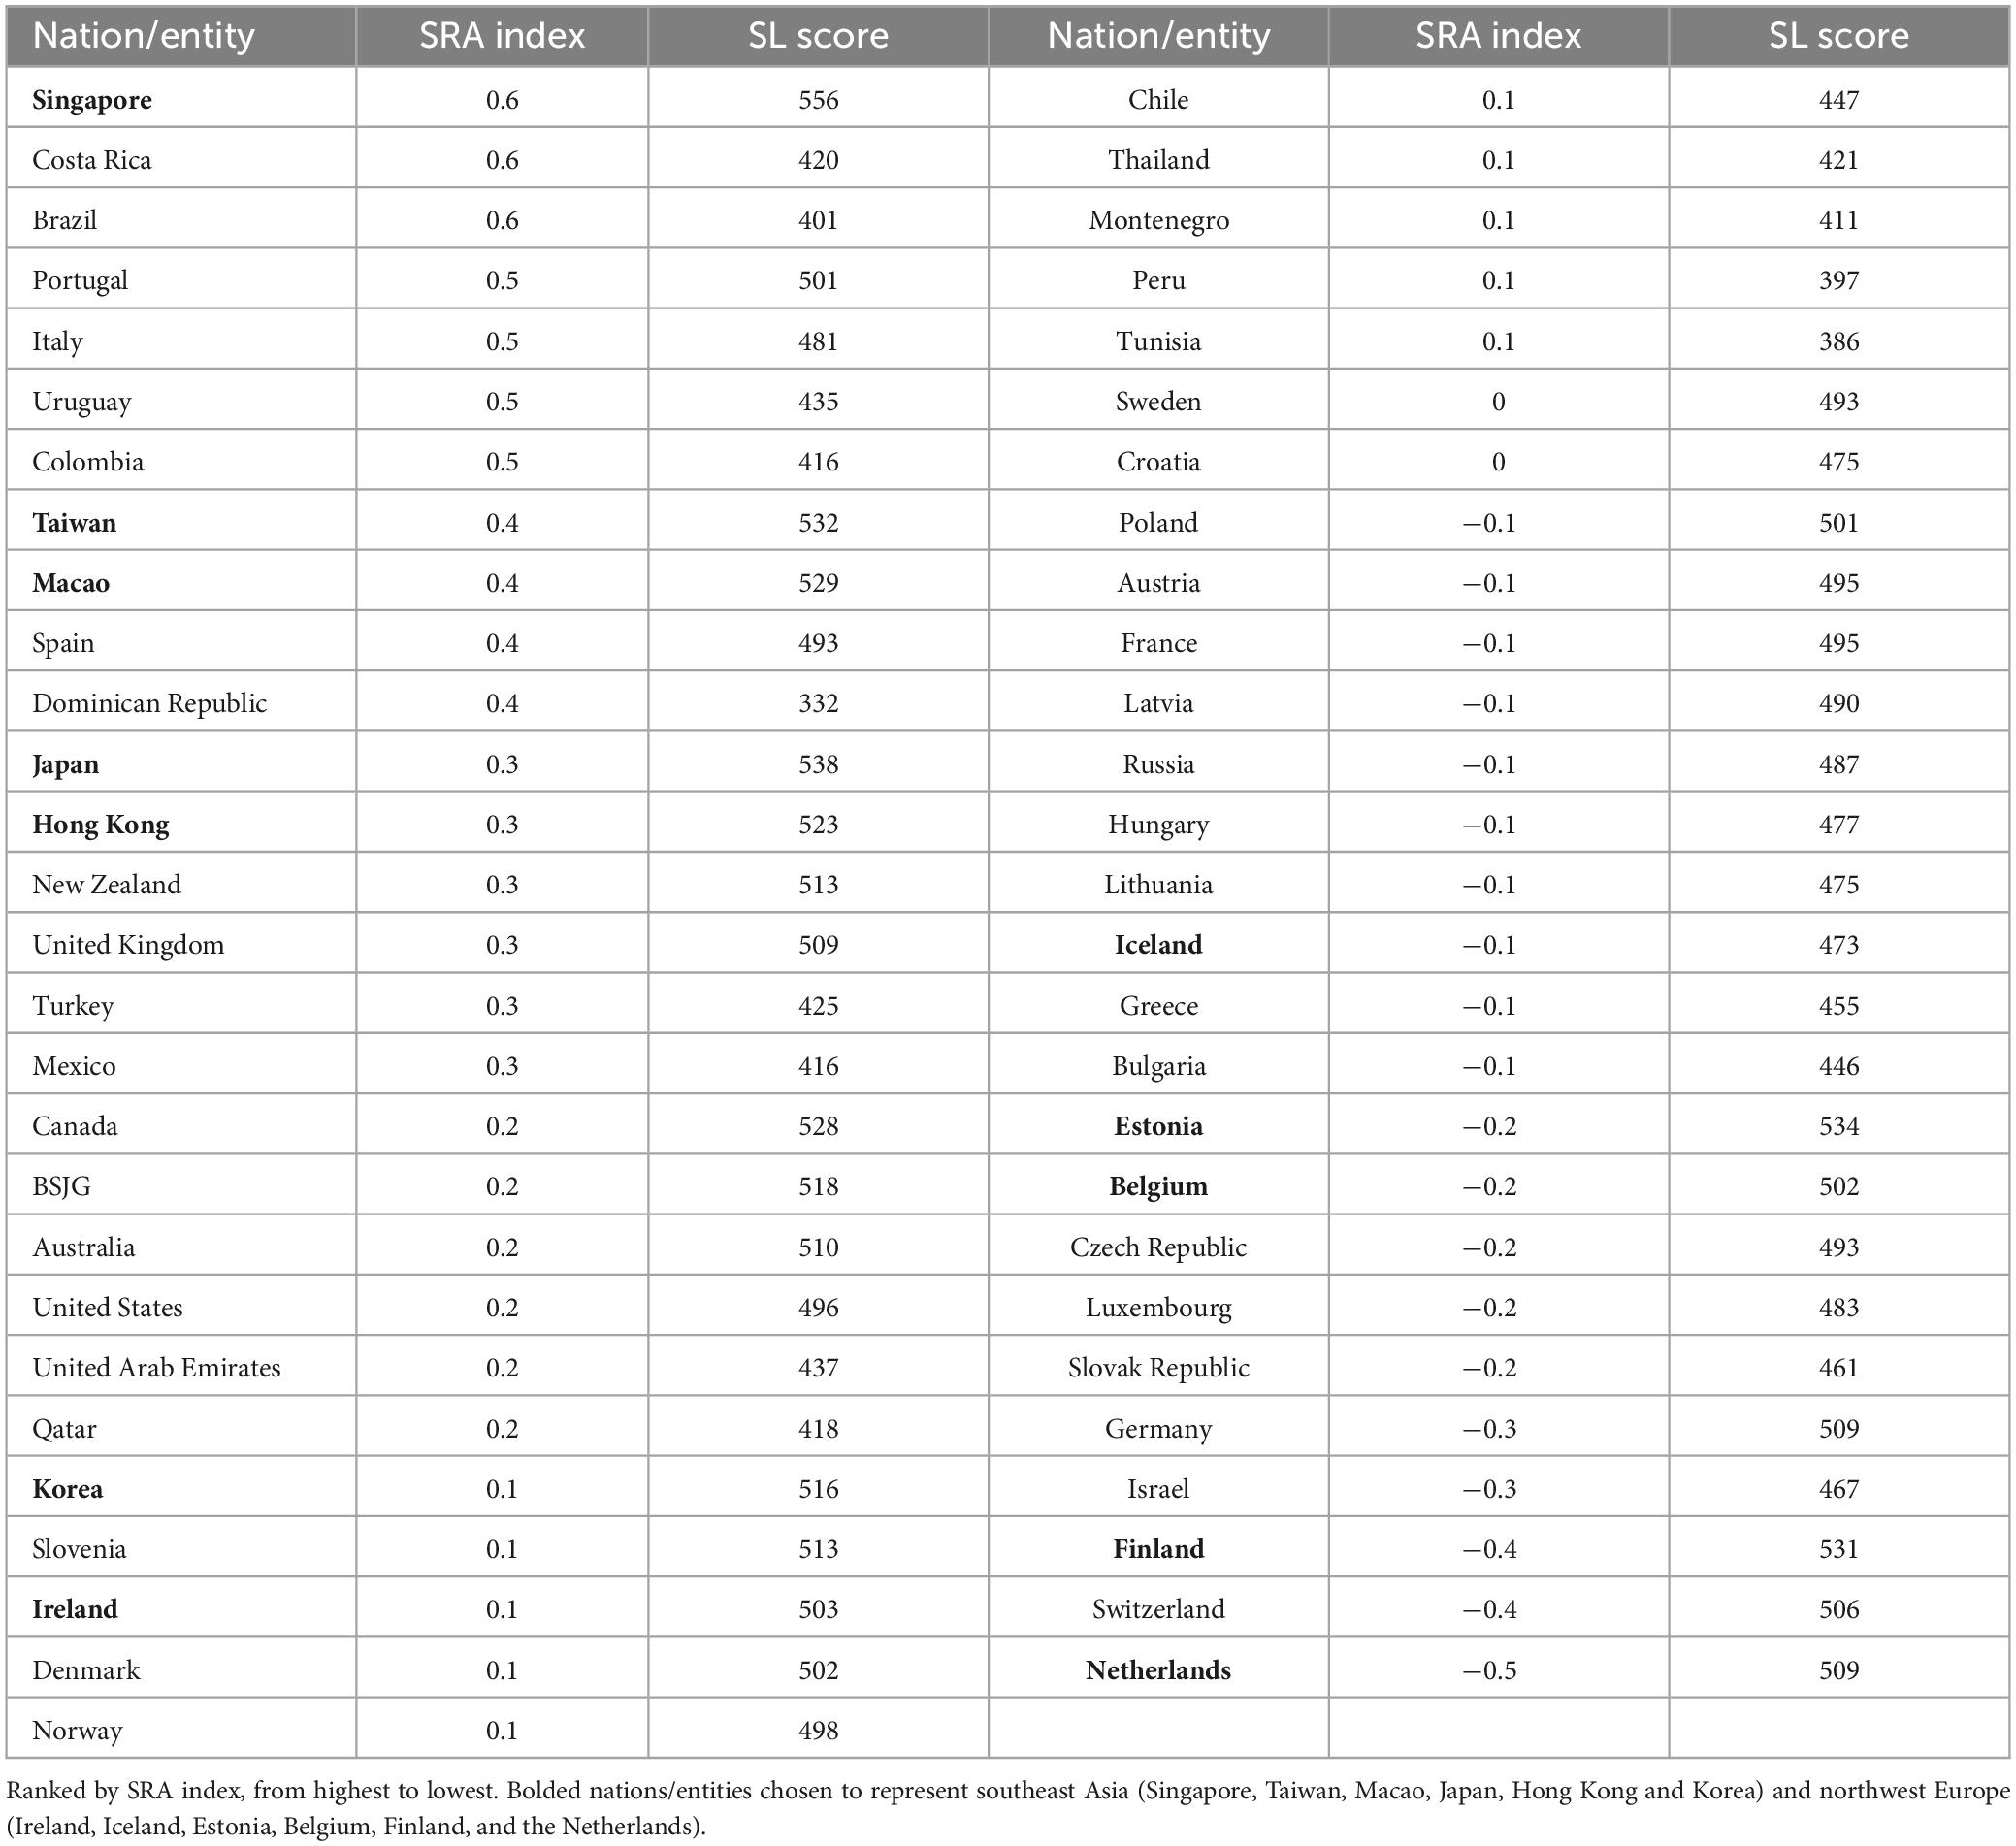
Table 1. Schoolwork-related anxiety (SRA) indices and science literacy (SL) scores (OECD, 2017b) for nations/entities that assessed SRA in PISA 2015 (OECD, 2018a).
Generalized anxiety among students, already high prior to the COVID-19 pandemic (Xin et al., 2020), appears to have risen as the pandemic’s impacts on education became evident (Wang and Zhao, 2020). A sudden jumble of instructional modalities (emergency online; planned online; face-to-face) elevated generalized anxiety levels (Eshet et al., 2021). Overall academic and discipline-specific anxieties have been shown to be more closely related to one another than were either to generalized anxiety (Sahranavard et al., 2013; Carey et al., 2017a). Math anxiety, well-studied in numerous international large-scale assessments (Stoet et al., 2016; Foley et al., 2017; Jia et al., 2021; Lau et al., 2022), may involve both learning and evaluation aspects; that is, math anxiety may result from a combination of concerns about learning mathematics as well as math performance per se (Carey et al., 2017b). Further, Holm et al. (2017) uncovered differences in math-related emotions associated with math performance levels. While science anxiety has been on the minds of science educators for several decades (Mallow, 1978, 1994; Brownlow et al., 2000)—particularly as a mechanism by which science learning and science achievement have been negatively impacted (Mallow, 1994)—large scale international assessments (e.g., PISA) have not included science anxiety in their student surveys. Thus, while transnational/cross-cultural comparisons of math anxiety (and the impact of math anxiety on math achievement) have been possible for many years, such comparisons are less accessible in a science context.
Science anxiety research has been advanced recently by instruments directly measuring this parameter (Kurbanoğlu and Akin, 2015; Kurbanoğlu and Takunyaci, 2017; Benlloch-Pla et al., 2019). Notably, the approach created and validated by Benlloch-Pla et al. (2019) separately considered science tasks (analogous to science learning) and science evaluations (closely related to science testing). Their conclusion was that both aspects were relevant to science anxiety overall, jointly impacting science performance. In the PISA context, while science anxiety has not been directly evaluated, the measure “test anxiety” (see full details below in Methods) includes prompts related to both academic learning and academic testing (OECD, 2017b). Therefore, “test anxiety” (a shorthand descriptor for the construct measured by PISA) has been more appropriately described by PISA itself as “schoolwork-related anxiety” (SRA); SRA may serve as a reasonable alternative in a PISA context for science anxiety (OECD, 2017b). Since measures of SRA and SLP (science achievement, framed in the PISA context as a disciplinary literacy) are available for each individual student participating in science-focused iterations of PISA, this construct may provide a “treasure trove” of international data to explore for relationships between SRA and SLP. Further, the 2015 iteration of PISA emphasized SLP as the primary outcome measure, making results from that PISA round of particular interest. A recent meta-analysis has shown test anxiety to be the highest for middle school students (von der Embse et al., 2018), implying that students in their early to middle teen years may be most vulnerable to that measure of academically related anxiety. Their conclusion thus provides additional support for a focus on PISA data, as it is drawn from a 15-year-old student pool in each nation/region participating in these assessments. Thus, we believe that invoking SRA as an alternative measure in place of science anxiety, using the science-focused 2015 PISA dataset, is an appropriate means to investigate relationships between SRA and SLP.
Even though Mallow (1978) identified the importance of science anxiety as a roadblock to science learning and science performance decades ago, relatively little research has been reported on this obstacle. Brownlow et al. (2000), utilizing Mallow (1994) scale, found that social factors (including self-assessment, parental influence, and teacher support) impacted science anxiety over-and-above a persistent gender effect. Science anxiety contributed adversely to science achievement for Hong Kongese students and was counterposed to science enjoyment (Wan and Lee, 2017). Benlloch-Pla et al. (2019) identified anxiety in science contexts (that is, science tasks) separately from anxiety evoked by science evaluations. Altun and Kalkan (2021) determined that SRA significantly predicted SLP across three cultures with differing mean SRA levels (Singapore, Italy, and Turkey, using PISA 2015 data). However, Altun and Kalkan (2021) did not reckon with the possibility of a lack of cultural invariance with this SRA measure; both Rutkowski and Svetina (2014) and Lafontaine et al. (2019) have cautioned against drawing such inferences regarding the strength of student perceptions (e.g., disciplinary climate in the former, reading self-concept in the latter) across widely divergent cultural and educational settings.1 Hence, the current research focuses primarily on patterns of SRA responses to SLP levels within nations/entities. Taking that caution into account, we note that Kurbanoğlu and Nefes (2015, 2016) found that context-based questions not only reduced test anxiety of Turkish secondary students, but also enhanced science achievement. Organic chemistry students showed a negative relationship between science anxiety and achievement (Kurbanoğlu and Akin, 2015). Socioeconomic levels have been related to science anxiety among Iranian middle school students (Sahranavard et al., 2013). Megreya et al. (2021) recently developed the abbreviated science anxiety scale (ASAS); their scale included science anxiety in both learning and evaluation contexts. Both constructs were independently (and negatively) associated with science achievement. In summary, existing research supports measures of science anxiety which involve both science learning and science evaluation aspects.
Both social cognitive theory (SCT) and stereotype threat theory (STT) relate social comparisons/perceptions of students to their educational outcomes. For example, social-cognitive inferences by students can influence their academic performance (Bandura, 2005; Schunk and DiBenedetto, 2020), and stereotype threat can impact exam performance (Aronson et al., 2002; Keller, 2007; Appel et al., 2015). Invoking social cognitive theory in an Australian context, Burns et al. (2021) suggested that students with high science self-efficacy may not attain the anticipated benefits of this trait, should they also experience high science anxiety. Meanwhile, students with low science self-efficacy may benefit from situational interest triggered by science anxiety (Burns et al., 2021). Thus, the relationship between science anxiety and science achievement may be indirect in some cases, operative through science self-efficacy (Yildirim, 2012). Further SCT implications exist; for example, test anxiety and/or science anxiety may depend on a range of interactive social factors—for example, parental pressure, self-interpretation, peer contexts, and teacher expectations (Wigfield and Eccles, 1989), and self-perceptions (including gender-related perceptions), parents, and teachers (Brownlow et al., 2000). Turning to STT research, Spencer et al. (1999) and Seo and Lee (2021) affirmed that when students from stigmatized groups perceive that they are being judged based on negative group stereotypes, such students may experience both anxiety and underperformance in academic settings. While Keller (2007) found stereotype threat to adversely influence math achievement by German females; African Americans (Aronson et al., 2002) and immigrants (differentially in Europe compared with the US, Appel et al., 2015) evidenced adverse academic impacts via stereotype threats.
Given the above theoretical frameworks, one might anticipate that student background characteristics, experienced by students through SCT and/or STT lenses, could amplify science anxiety (or SRA) as well as its adverse effects. Socioeconomic, cultural, and parental factors may interact in unforeseen ways to induce SRA; further, the way students experience these factors may thus depend on their international contexts (OECD, 2017b). We remind our readers here (and ourselves!) that the cautions of interpreting psychological constructs across diverse geographies/cultures without first establishing cultural invariance of the given measure remain in play (Rutkowski and Svetina, 2014; Lafontaine et al., 2019). Female gender (Britner, 2008; Putwain and Daly, 2014; Núñez-Peña et al., 2016; and Kuo et al., 2020), perceived parental pressure (Chen, 2012; Gherasim and Butnaru, 2012), private (vs. public) school contexts (Leonard et al., 2015), second language learning (Roo et al., 2020), instructional approaches (Dávila-Acedo et al., 2021), and rurality (Stupurienė et al., 2022) provide examples of social contexts within cultural settings that may be associated with heightened science anxiety. In summary, many aspects of the social environment that students experience in their school contexts may be associated with their titer of science anxiety and/or SRAy. Thus, student background, and student perceptions of the science environments in their school classrooms, may well relate not only to science anxiety, but also to the alternative measure (SRA) available in the PISA 2015 dataset.
Sung et al. (2016), working with Taiwanese ninth graders, observed an inverse U-shaped relationship between test anxiety and academic achievement; specifically, both high- and low-achieving students had lower test anxiety than medium-achieving students. Further, the anxiety/achievement relationships within those achievement categories differed; that is, lower-achieving students had an overall positive relationship between test anxiety and achievement [attributed by Sung et al. (2016) to a motivational enhancement model—as suggested previously by Struthers et al. (2000) and Cassady and Johnson (2002)]. In the case of Sung et al. (2016), lower-achieving students generally had less reason to care about impending consequential exams, as such students already understood that they would not be able to qualify for elite schools. However, better scoring students from the lower-achieving cohort may have benefitted from adaptive situational interest (Struthers et al., 2000). Meanwhile, their higher-achieving students had a negative relationship between text anxiety and academic performance explained by Sung et al. (2016) via the cognitive interference model (Hembree, 1988). For their intermediate-achieving students (with the highest levels of test anxiety), Sung et al. (2016, p. 249) invoked a “stress-of-uncertainty” model—students lacked assurance about their future school placement, which depended on their performance on then-impending high stakes exams (Chao and Sung, 2019) and were uncertain (and therefore, stressed) about how best to prepare themselves. Munz et al. (1975) argued that an inverse U-shaped relationship between achievement anxiety and test performance could be explained by differing arousal states (performance-enhancing versus performance-impeding). Sommer and Arendasy (2014, 2015) supported a deficit model as an explanation for the relationship between test anxiety and academic performance. Meanwhile, both Tobias (1985) and Everson et al. (1989) found that cognitive interference and skills deficits (in study habits and/or in test-taking) both contributed to test anxiety. Worry and emotionality both contributed to test anxiety (Minor and Gold, 1985); as did proximity (in time) to a final examination (Lotz and Sparfeldt, 2017).
Subsequent work by Sung’s group has called for specific interventions to ease test anxiety of intermediate-achieving students (practices to enhance career advice for middle school students and policies directed to encourage families to seek high school placement in nearby rather than elite schools—Chao and Sung, 2023) and more attention to national test design and revision (Chao et al., 2024). Finally, Chao and Sung (2023) developed the “Adolescents’ Uncertainty Scale” and suggested guidance counselors and teachers could tailor support to those students (most likely, intermediate achievers) that showed high levels of academic uncertainty.
In summary, much remains to be uncovered regarding test anxiety/SRA; for example, Jerrim (2023, p. 336; working in the high-stakes test environment of the United Kingdom) concludes that “… surprisingly little work has considered the extent to which the link between test anxiety and examination performance is non-linear. Specifically, is there a particular point when test anxiety becomes too much and examination performance starts to decline? Similarly, is there any evidence that test anxiety can be too low, with a casual attitude and complacency about important upcoming examinations meaning some teenagers end up achieving worse results?”
Taking advantage of the international dataset provided by PISA 2015 (OECD, 2016a) which includes not only a measure of SRA (OECD, 2017a, p. 317) but also a well-established measure of SLP (OECD, 2018b, p. 75), we sought to identify linkages among these two measures. Our sample consisted of six nations/entities selected from SEA (high average SRA, high average SLP) as well as six nations selected from NWE (low average SRA, high average SLP). Further, we compared five SLP levels within each nation/entity, facilitating potential validation of the inverse U-shaped response (Sung et al., 2016) in Taiwan (in a slightly different context) as well as a possible extension of that finding to the SEA region. Our overarching research objective for this international project was therefore to assess the relationship of SLP levels with SRA in Taiwan and other SEA nations/entities in contrast with that of NWE nations.
After this introductory paragraph regarding the two primary variables of interest in our work, data acquisition, data curation, and analytical methods are sequentially described. Two variables transcend all other measurements in this research: first, SRA and second, SLP. The primary outcome measure for this research was SRA (sometimes referred to as “test anxiety”); however, a close consideration of the prompts used to derive SRA2 reveals that SRA is a more accurate descriptor for this measure (OECD, 2017b). Secondly, SLP, as measured by PISA, essentially relates to a student’s capacity to think scientifically [see footnote below for a more formal description directly from OECD (2018b)].3 Student’s SLP scores are derived from their responses to a subset of the item pool and are estimated from ten probable values. For our work, we have identified five science proficiency levels [1 through 5, with 5 being the highest SLP level) based on science proficiency categories as previously identified by OECD (2016b), p. 60] See details in the data curation section below.
Every nine years, the triennial PISA assessment focuses on science literacy and student- and school-level variables potentially associated with SLP; the 2015 iteration was the most recent such science-focused assessment by OECD (2016a). Table 1 represents a synthesis of twin summary tables from PISA 2015; the first of those tables listed SRA for each of the 55 nations/entities that chose to include this parameter in their student surveys (OECD, 2017b); the second listed SLP for those same 55 nations/entities (OECD, 2018a). Based on Table 1, six SEA nations/entities (Singapore, Taiwan, Macao, Japan, Hong Kong, and Korea) and six NWE nations (Ireland, Iceland, Estonia, Belgium, Finland, and the Netherlands) were selected for more intensive research. Data for those 12 nations/entities were downloaded from the OECD database (OECD, 2016a) as SPSS files to facilitate the ensuing data curation. Ólafsson and Hansen (2022) have shown that school characteristics show relationships among culturally/geographically clustered nations.4
Prior research identified contextual similarities and differences among the twelve chosen nations that could potentially influence the associations between SRA and SLP. For example, eight of the twelve nations/entities chosen for the current research project have been shown to have differing instructional practices—while influence science performance to varying degrees (Lau and Lam, 2017). For example, Estonia and Finland used similar instructional practices in science teaching contexts (Ronkainen et al., 2023); however, those practices differed sharply from instruction provided in the same suite of six SEA nations chosen for the current study (Lau and Lam, 2017). Importantly, high stakes testing is faced by Taiwanese students (Sung et al., 2016) while no such national testing is experienced by Finnish students (Ministry of Education and Culture, Finland [MECF], 2024). Further, perceived social expectations can act as a trigger for test anxiety in Taiwan (Sung and Chao, 2015) as well as Singapore (Ang et al., 2009) and Korea (Lee and Larson, 2000). Recent work by King et al. (2024) with the PISA 2015 dataset, identified income inequality at the national level as an important consideration for test anxiety. Notably, all six NWE nations and five of six SEA nations/entities (Macao was the lone exclusion) were included in the report of King et al. (2024). Average income inequality for the NEW cluster in their report was 27.7; meanwhile, average income inequality for the five included SEA nations/entities was 34.1. Thus, King et al. (2024) provide additional support for our selection of these groups of nations/entities.5 Differences within regions were also noted; for example, the highly stratified schools (via tracking and grade retention) in Flanders (Dutch-speaking region of Belgium) showed different associations between science literacy and several dispositions towards science than did those of Ireland (Grabau and Van Damme, 2023).
While SRA values (on an individual student basis) were directly usable in subsequent analyses, science literacy proficiency (SLP) levels were consolidated from those provided by OECD for this work; this paragraph describes the consolidation process we used. National Center for Education Statistics [NCES] (2023) summarized eight SLP levels for PISA 2015 as follows: (i) below level 1b (SL scores from 0 to < 260.54, (ii) level 1b (SL scores 260.54 to < 334.94), (iii) level 1a (SL scores 334.94 to < 409.54), (iv) level 2 (SL scores 409.54 to < 484.14), (v) level 3 (SL scores 484.14 to < 558.73); (vi) level 4 (SL scores 558.73 to < 633.33), (vii) level 5 (SL scores 633.33 to < 707.93), and (viii) level 6 (SL scores 707.93 to 1000). As OECD (2016b) further describes as “low performers” those students below their level 2, and “high performers” those above level 4, we chose to simplify the categorization of science proficiency to five levels for this research. Thus, the SLP descriptors used in this study were level one (SLP < 409.54); levels two, three, and four (as shown above), and level five (SLP > 633.33. Assignment of each a student to a given science proficiency level was based upon the average of each student’s ten plausible SLP values. We note that Jerrim et al. (2017) concluded that using all available plausible values could slightly improve measurement precision. These data manipulations (as well as those described below) were completed using SPSS (version 29.0).
To take advantage of the value of MLM to evaluate potential associations of SLP levels (one through five, as defined above) with SRA6, we downloaded, then appropriately configured a suite of both student- and school-level variables previously associated with SLP in the context of PISA 2015 (Grabau et al., 2021, 2022). While some student-level (e.g., gender) and school-level (e.g., school-mean ESCS) were available for all 12 nations/entities in this research, important differences between the available suites of student- and school-level measures existed (e.g., only Belgium and the Netherlands used tracking—and their tracks were somewhat different).
Student-level variables were acquired from the student questionnaire (OECD, 2016c) and configured for our MLM analyses as follows: gender (dummy variable; females coded as 0, males as 1), age (continuous variable, age in years around target as of 15—lower limit of 15.25 years, upper limit of 16.25 years), immigration status (double dummy variable; native students as 1, second- and first-generation immigrants as 0; first-generation students as 1, native and second-generation students as 0), home language (dummy variable; majority language as 1; other languages as 0),7 grade standing [generally, a double dummy approach for those nations that used “retention-in-grade” practices to a substantive degree; generally, using grade 108 and higher as one dummy variable (grade 10+ coded as 1, lower grades as 0) and grades 7&8 as the other dummy variable (grades 9 and up coded as 0)], student-level ESCS (continuous), and tracking as a double dummy for both Belgium and the Netherlands [general (Belgium) or university (the Netherlands) as l, lower tracks as 0 and vocational (both nations) as 1, higher tracks (including the intermediate technical track) as 0].
School-level measures included: school size (continuous, in thousands), science-certified teachers (continuous, proportion of total), school grade level (continuous, derived from student grade level), school community size (dummy coded as 1 for communities of 100,000 or more people, 0 for smaller communities), school-mean ESCS (derived from student ESCS, continuous), instructional leadership (continuous, from survey of principals), disciplinary climate in science classes and teaching support in science classes (both continuous, both aggregated from student responses), and parental support for science (continuous, from survey of parents).
For each of the five SLP levels for each of the twelve nations/entities (as well as both regions), SRA means and standard deviations were calculated (using SPSS). Note that Supplementary Table 1 also includes the total number of students for each nation/entity within each SLP level, as well as percentages compared with the given nation/entity (or region). To compare means of the five SLP levels at the regional level (separately, SEA and NWE), we used one-way analysis of variance (ANOVA) complemented by post-hoc means comparisons (Supplementary Table 2).
We utilized MLM to be able to isolate “above-and-beyond” associations of SLP levels with SRA; that is, this approach controlled for other student (and school) variables potentially associated with our outcome measure (SRA). MLM, using HLM 8.0 (Raudenbush et al., 2011; Scientific Software International [SSI], 2019), considered SRA as the outcome variable for 24 separate models (two for each nation/entity). Data for each nation/entity were split into two cohorts: the lower cohort (including SLP levels one, two and three), and the upper cohort including SLP levels three, four and five). Two dummy SLP variables were created for each cohort, as follows: i) for the lower cohort’s first dummy variable, level one was coded as 1 and levels two and three as 0; and ii) for the lower cohort’s second dummy variable, level three was coded as 1, and levels one and two as 0. A similar pair of dummy variables was created, in a similar fashion, for the upper cohort. These dummy variables provided an unambiguous mechanism to identify significant associations among each of the five SLP levels for all nations/entities in this research. For example, if both levels one and three (within the lower cohort) were found to be significantly associated with SRA, we would conclude that level one differed from level two and that level three also differed from level two. If, for example, only level one was significantly associated with SRA, we would conclude that levels two and three did not differ. This approach is supported by Wissmann et al. (2007) and Anderson et al. (2014) as appropriate for categorical values such as these implemented for SLP levels. The following paragraph details the steps taken for each of the 24 models of interest.9
The outcome variable (for all models) was SRA. We invoked a full maximum likelihood procedure and utilized OECD-provided (OECD, 2016a) weights at both student (W_FSTUWT; final trimmed nonresponse adjusted student weight) and school (W_SCHGRNRABWT; grade nonresponse adjusted school base weight) levels. Thus, weights were applied in concordance with the recommendations of Anderson et al. (2014) and Jerrim et al. (2017). Missing values for student variables were dropped at the stage of analysis; missing values at the school level were handled via multiple imputation within SPSS. All variables, including categorical ones (Yaremych et al., 2023), were grand mean centered for multilevel modeling. First, a null model was run for each of the 24 models; this allowed us to identify the proportion of null variance attributed to student and school variances (Supplementary Table 3). Second, for each model, the full suite of student variables for each given nation/entity (see Supplementary Table 4 footnote for details) was entered at the outset; after each run of the model, the least significant student-level variable was dropped from the model until all remaining variables met the p < 0.05 criterion. We then loaded the full suite of school variables for each given nation/entity; once again, we dropped the least significant school variable after each run, until all remaining school variables met the p < 0.05 criterion. Resultant statistics for each parsimonious final model are shown in their entirety in Supplementary Table 4. Effect sizes (Cohen’s d; Cohen, 1988) were calculated for each variable showing significant associations with SRA. Table 2 presents all significant SLP level associations with SRA, as drawn faithfully from Supplementary Table 4. Both student and school variances for each of the 24 final (parsimonious) models are shown in Supplementary Table 3. Note that proportions of both student and school variance accounted for by the parsimonious model are also shown in Supplementary Table 3.
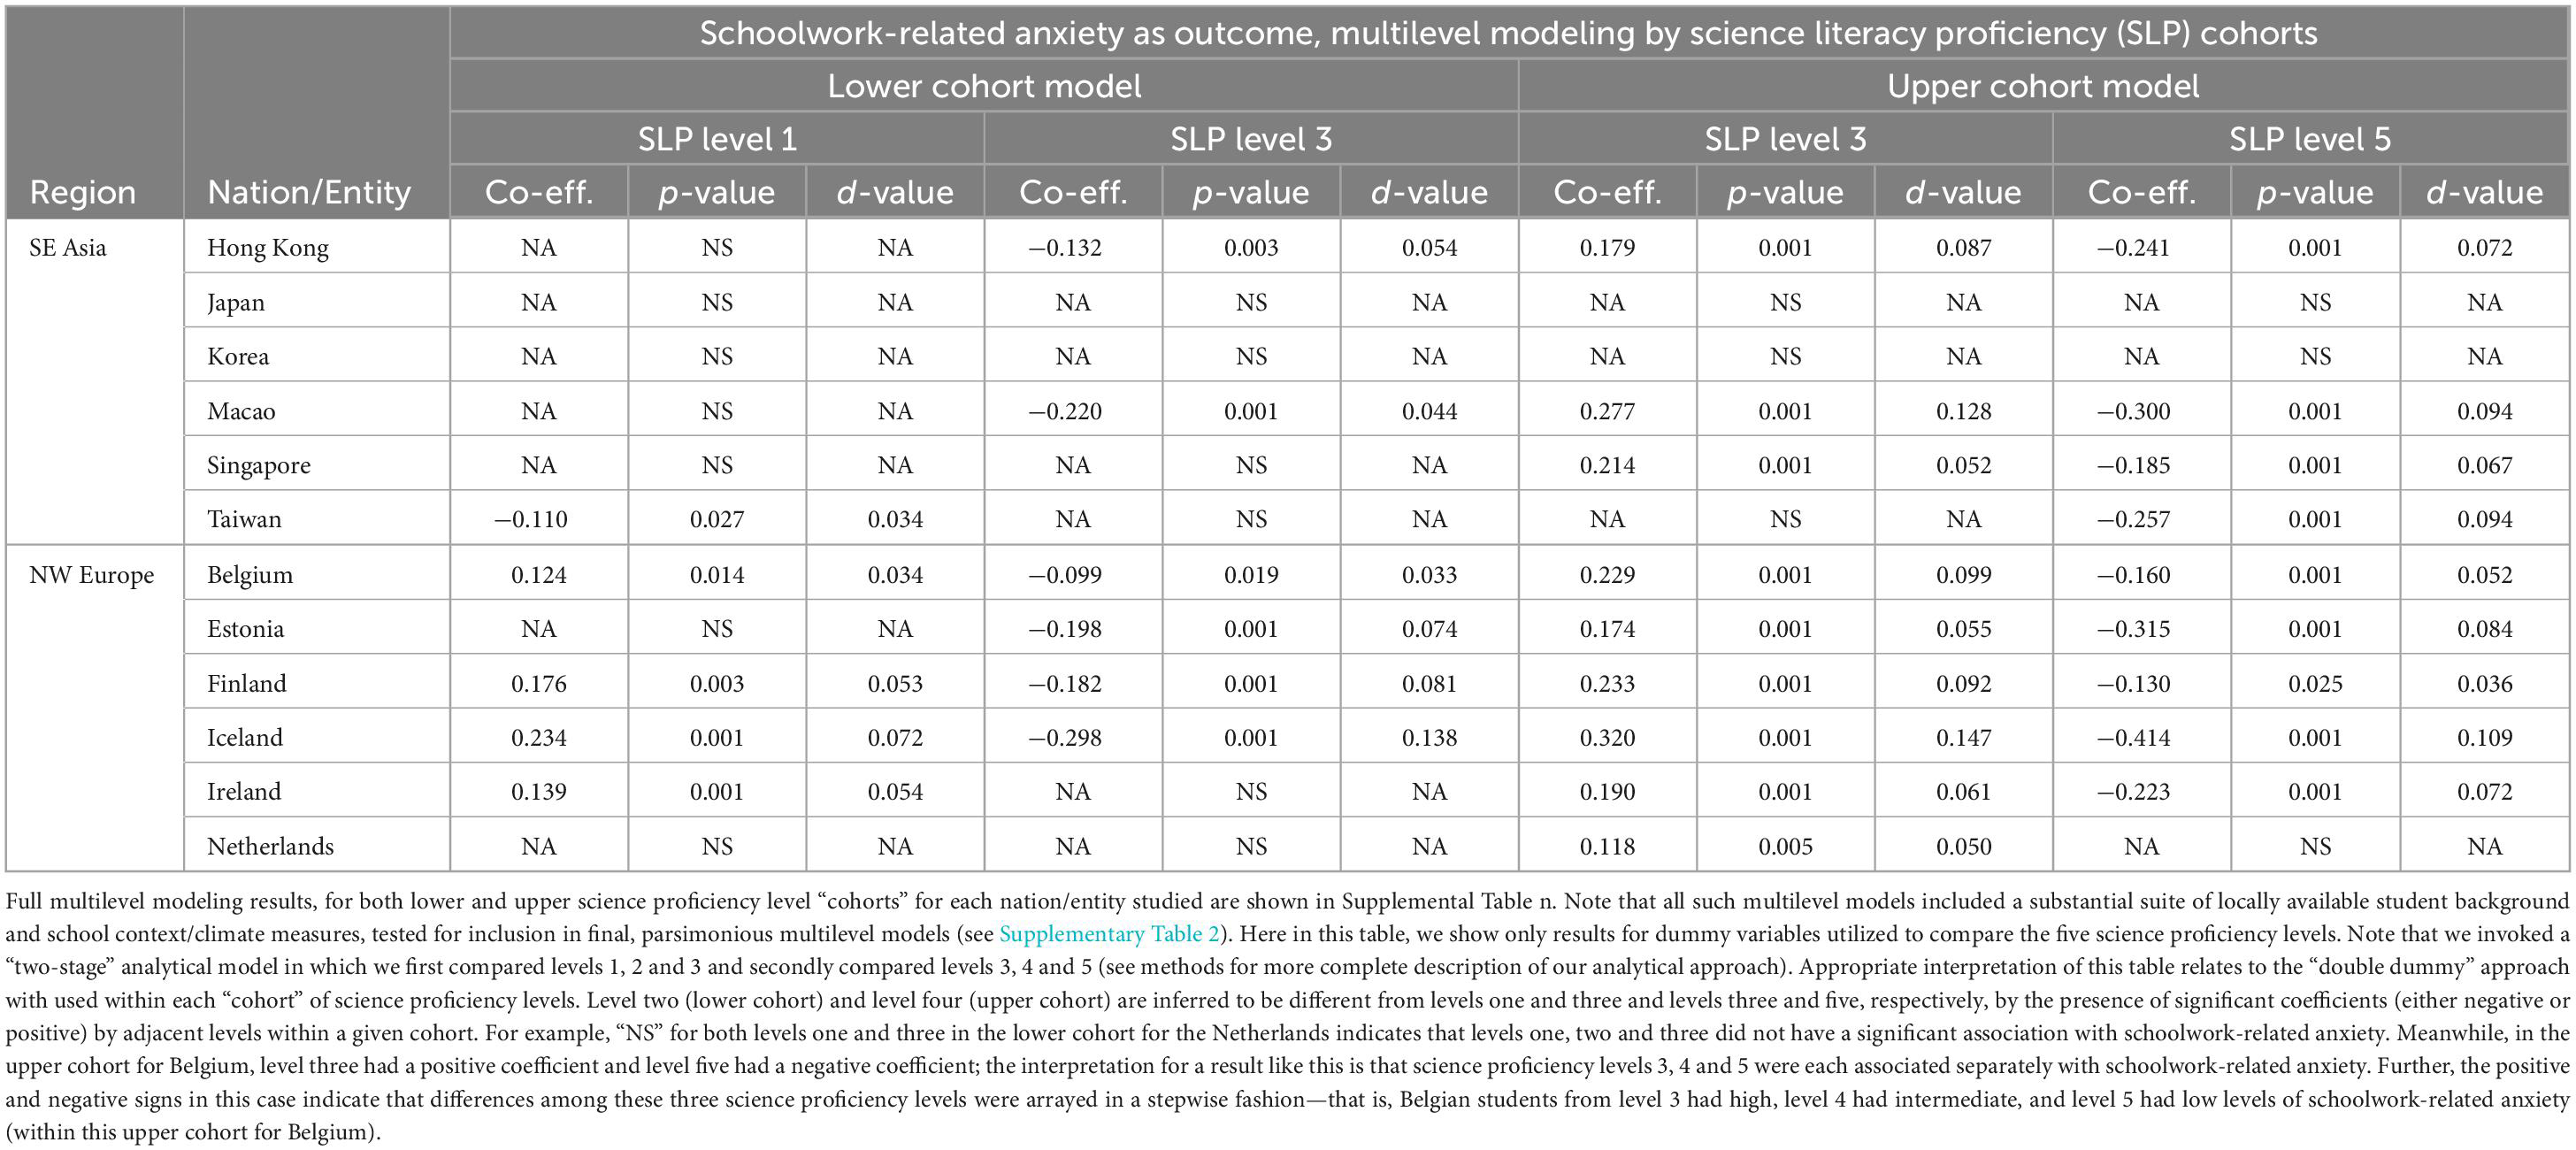
Table 2. Multilevel modeling results for each of six nations/entities within Southeast Asian or Northwest European nations.
Finally, we chose not to invoke a multi-group confirmatory factor analysis (MG CFA) in this research study. As both Rutkowski and Svetina (2014) and Lafontaine et al. (2019) have pointed out, international studies utilizing common psychological constructs across cultures may be understood (and thus addressed) differently by students in divergent cultures. Should researchers wish to directly compare results across cultures, a reasonable expectation could be that an MG CFA be applied, and that such an analysis would support cultural invariance of the measure of interest. Both our intent (to compare SRA response to SLP levels within cultures) and our initial evaluation of cross-cultural correlations suggested that MG CFA would not be necessary to invoke nor likely to be confirmed. Regarding those correlations, the six selected SEA nations/entities showed a positive correlation (+0.88*) between mean SRA and SLP levels, while the six chosen NWE nations showed a negative correlation (−0.41, NS) among the same pair of variables. Hence, we have focused on relationships within nations/entities, rather than on regional similarities/differences.
Our presentation of results relates to the associations between SRA and SLP levels as provided by (a) ANOVA of mean SRA with respect to both individual nations/entities as well as across regions, (b) MLM (which tested such associations in the context of a substantial suite of other student and school variables), and (c) a comparison of the results from our two analytical approaches (ANOVA and MLM).
We present comparisons of mean SRA by SLP levels in three stages: first, an overall descriptive comparison by regions; secondly, a descriptive comparison of nations/entities within the two regions; and thirdly, a comparison by SLP levels for each of the 12 nations/entities studied. We underscore here the descriptive nature of the below comparisons of both regions and nations/entities, given the likely cultural variance in responses of students to the SRA prompts. Overall results for both the SEA and NWE regions are presented as descriptive measures subjected to analysis of variance (Figure 1). Across 35711 students from six SEA nations/entities, SRA averaged 0.34; meanwhile, across 34601 students from six NWE nations, SRA averaged −0.21 (p < 0.001, t1, 70310 = 75.991). Thus, the SRA average was significantly and substantially greater (by 0.55 standard deviation units, revealing greater anxiety in school contexts) for the SEA region than for the NWE region. Distributions of students to SLP levels, expressed as percentages of the regional totals (Supplementary Table 1), revealed numerically higher percentages of NWE students in both lower SLP levels (one and two); however, level three percentages were similar for both regions, and numerically greater for SEA for both SLP levels four and five. Notably, the weighted average SLP score (533) for the six nations/entities chosen to represent SEA was numerically higher than the weighted average SLP score (510) for the six nations chosen to represent NWE [calculated from nation/entity mean SLP scores (Table 1) and nation/entity student numbers (Supplementary Table 1)]. The observed distribution differences can be further illuminated by comparing pooled percentages for SLP levels one and two, SLP level three, and pooled percentages for SLP levels four and five, as following: 29.2%, 29.8%, and 41.1% for the SEA region; and 36.6%, 29.5%, and 33.9% for the NWE region, respectively. At the regional level, SRA for SLP levels showed significantly differing patterns for the two regions. While SEA had a “modified U-shaped” response, NWE showed stepwise (or “staircase”) negative linear response (Figure 1). More specifically, the SEA region showed the highest SRA values for SLP levels two and three, intermediate values for SLP levels for one and four, and lowest SRA values for the highest SLP level (five). Meanwhile for NWE, each successive SLP level from lowest (one) to highest (five) had successively and significantly lower SRA values. We acknowledge the descriptive nature of these comparisons, owing to an obvious lack of cultural invariance of the SRA construct employed.
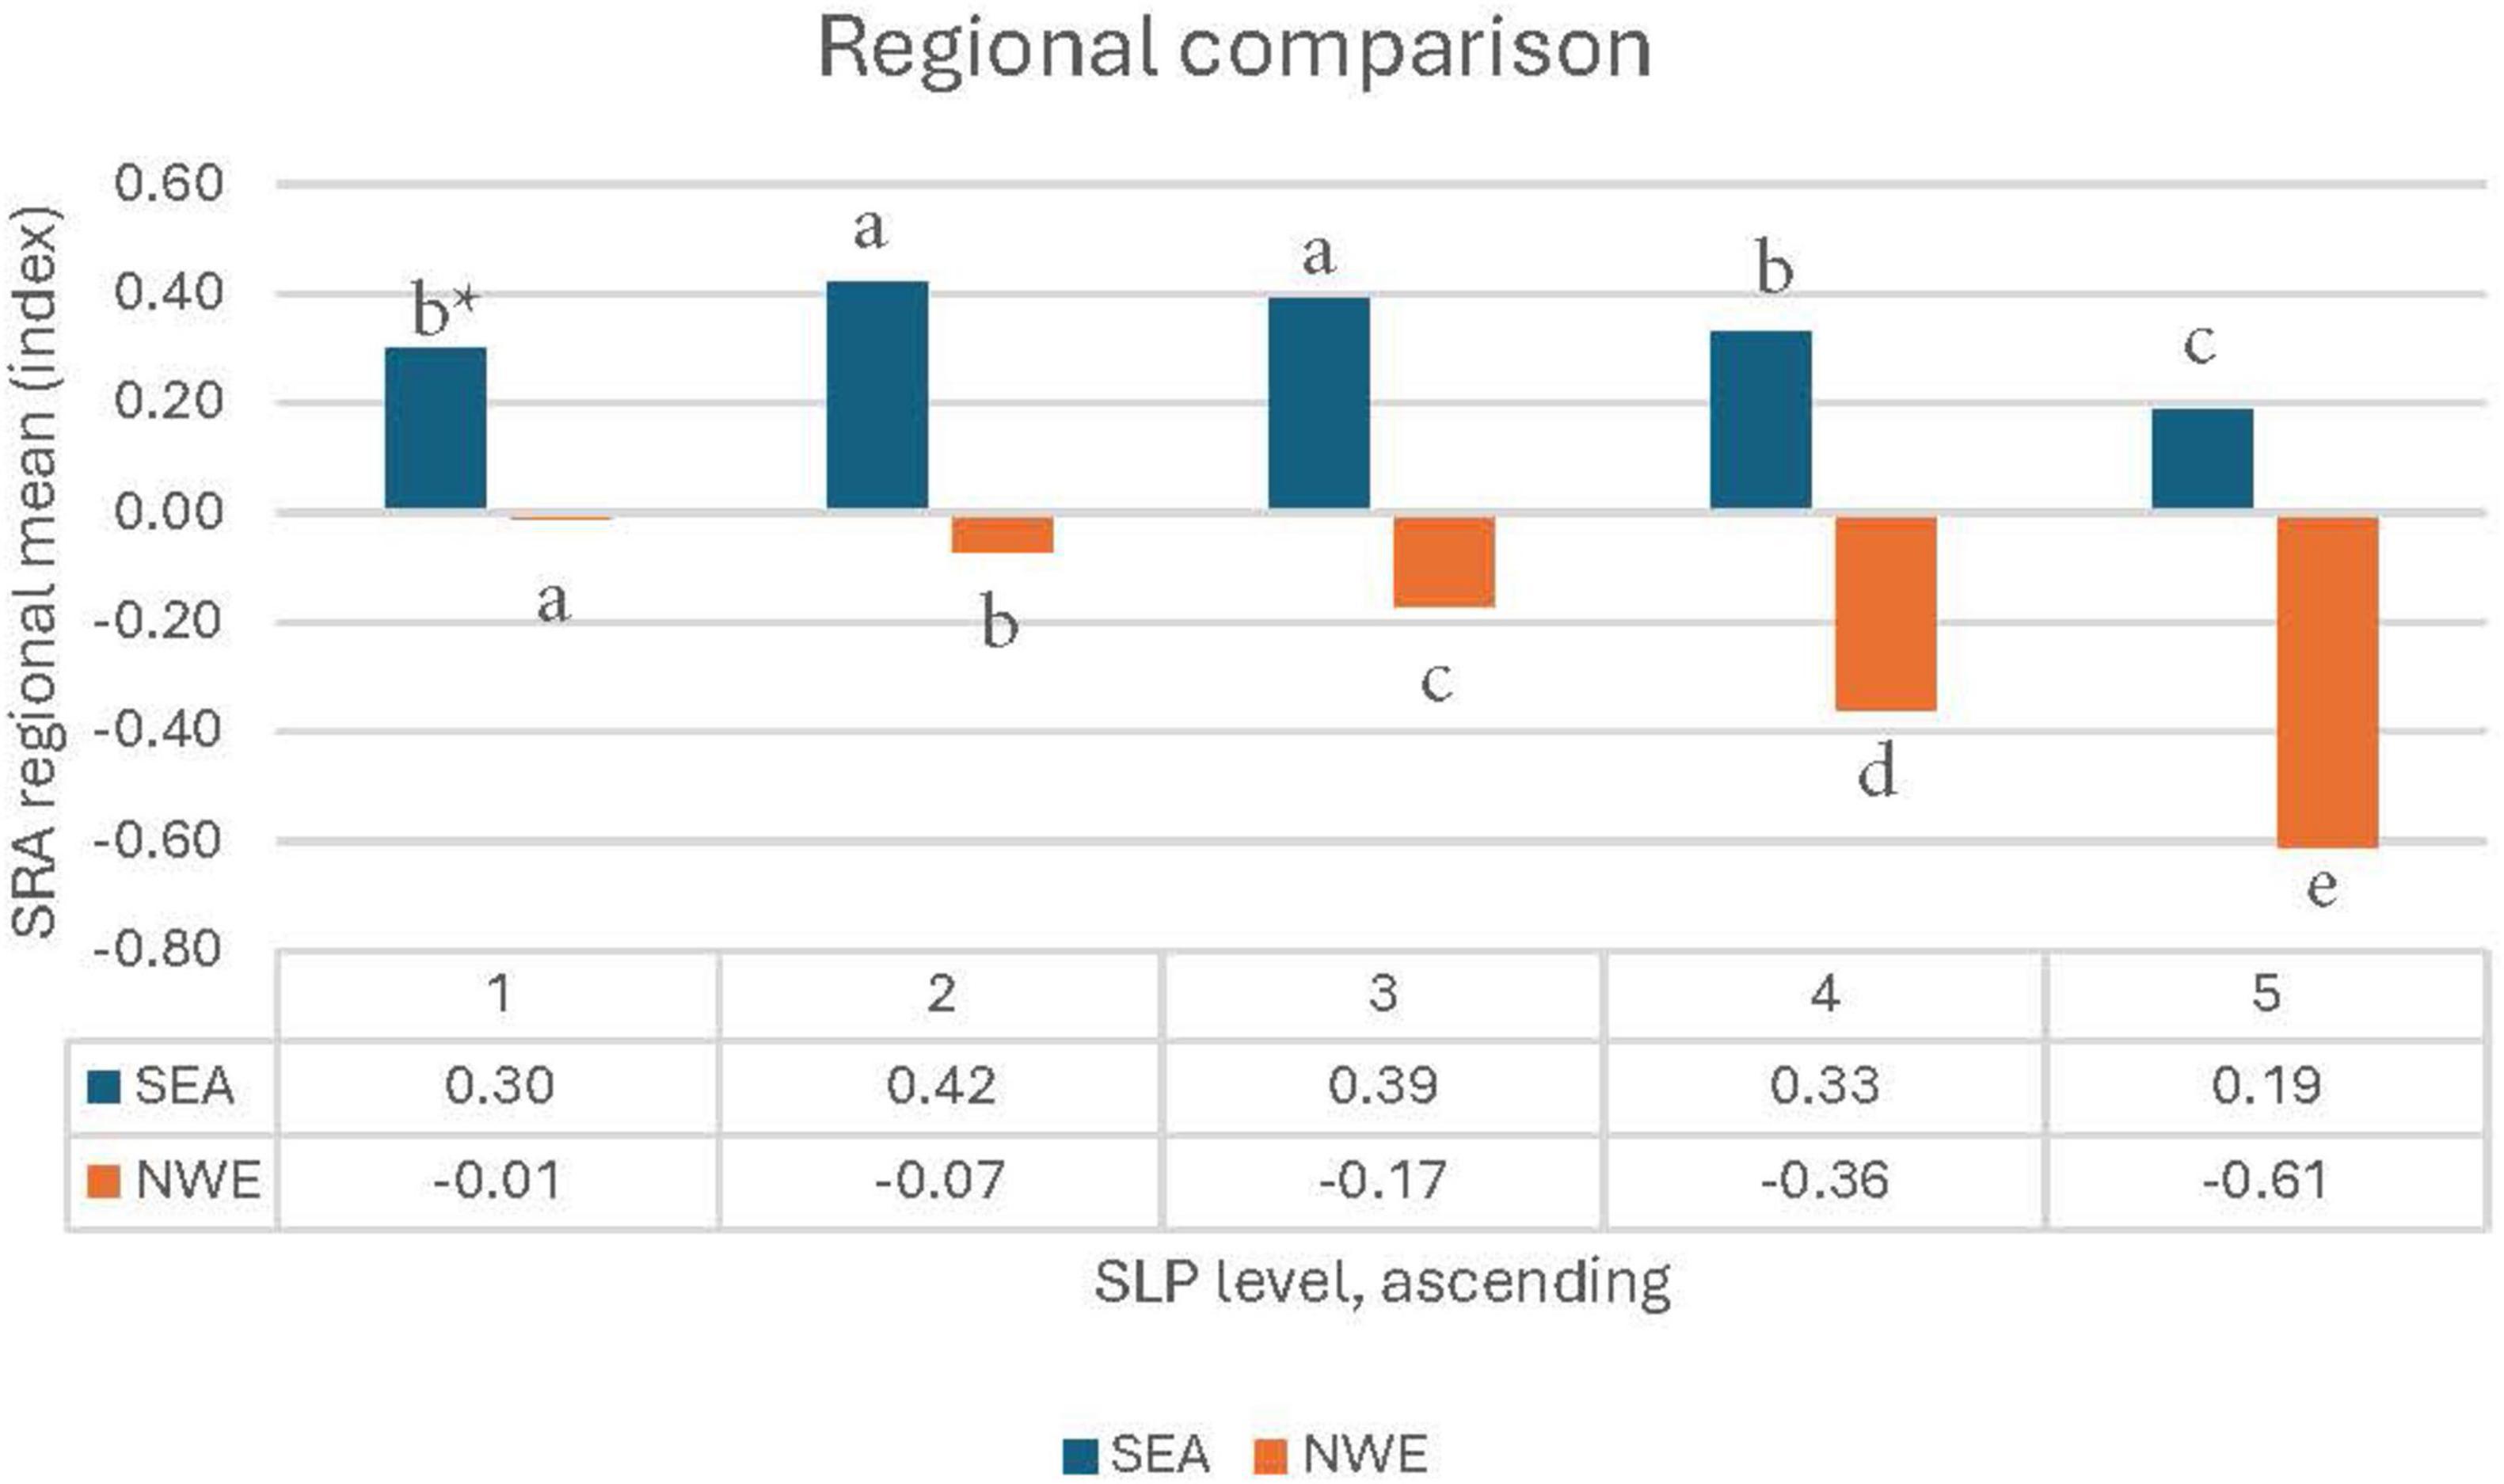
Figure 1. Regional comparisons between SEA and NWE of mean SRA by ascending SLP levels. *Bars with differing letter notations significantly differ within SEA or NWE regions.
At the national/entity level, SRA means varied from 0.11 (Korea) to 0.59 (Singapore) within the SEA region, and from 0.15 (Ireland) to −0.54 (the Netherlands) within the NWE region (Supplementary Table 2). Thus, the SEA nation (Korea) with the lowest mean SRA had a similar SRA mean as did the NWE nation (Ireland) with the highest regional SRA mean. Meanwhile, Singapore’s SRA mean was more than a full standard deviation unit higher than that of the Netherlands. Within the SEA region, the remaining four nations/entities (Taiwan, Macao, Hong Kong, and Japan) had relatively similar SRA means; meanwhile, Finland’s mean SRA of −0.41 was numerically less than the means of the remaining three NWE nations (Estonia, Belgium, and Iceland). Note that means separation by nation/entity (within region) are shown in Supplementary Table 2. Once again, we present these comparisons under the “caution flag” of likely cultural variance in students’ readings of SRA prompts. Sample sizes varied by nation/entity; the largest sample sizes were for Taiwan in the SEA region and Belgium in the NWE region, and the smallest sample sizes were for Macao (SEA) and Iceland (NWE).10 Since our regionally comparative ANOVA was over-represented by both Taiwan and Belgium and under-represented by Macao and Iceland, these regional comparisons should be treated as descriptive rather than as conclusive. We note that the following analyses (Figure 2) are not similarly constrained by over- or under-representation, since the comparisons are within nations/entities.
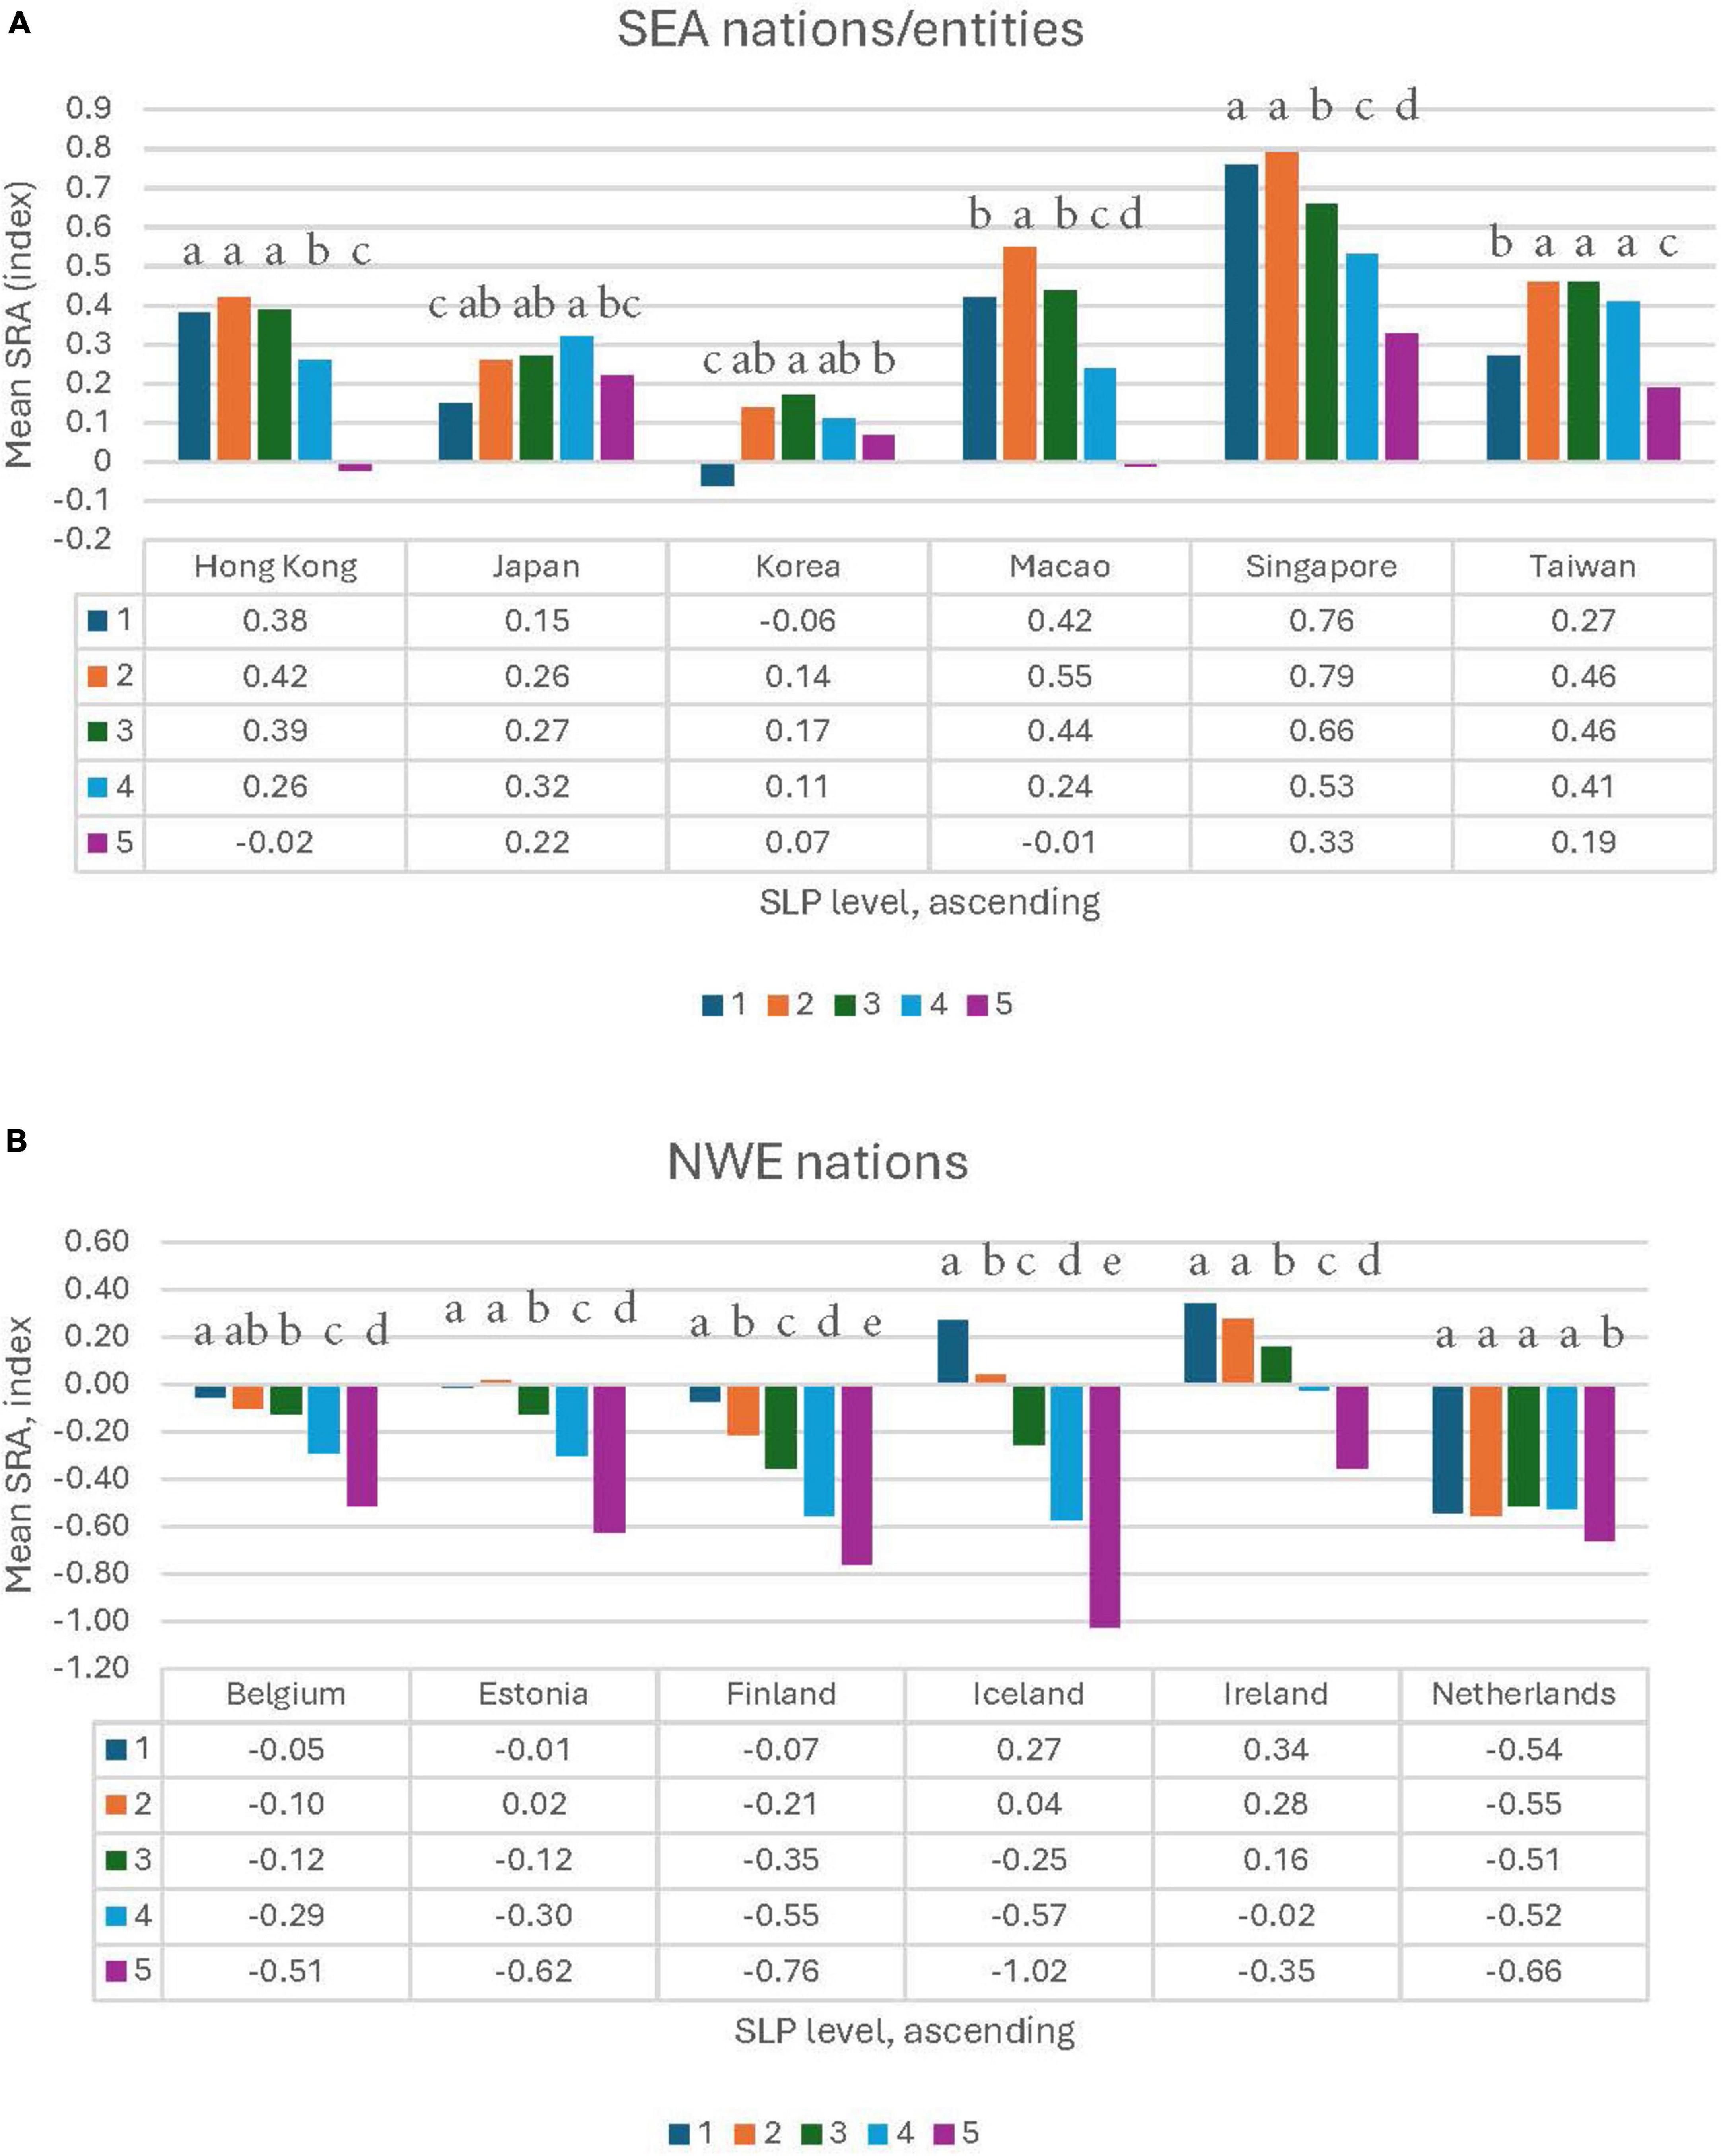
Figure 2. Comparison of mean SRA for each of five ascending SLP levels for six nations/entities from both SEA (A) and NWE (B). Bars with differing letter notations significantly differ within SEA or NWE nations/entities.
Patterns of SRA in response to SLP levels differed by nation/entity within region. For the SEA region, Taiwan showed a clear inverse U-shaped response, with both SLP levels 1 and 5 showing significantly lower SRA than the intermediate SLP levels (2, 3 and 4) (Figure 2A). For both Japan and Korea, the lowest SRA means were for SLP level 1; however, SRA means of intermediate SLP levels were not significantly different from SLP level 5. Meanwhile, Hong Kong, Macao, and Singapore all showed a trend for significantly declining SRA means for higher SLP levels. In contrast, the norm for NWE nations was to show stepwise (Finland and Iceland) or nearly stepwise (Belgium, Estonia, Ireland) declines in SRA means at higher SLP levels (Figure 2B). Only the Netherlands diverged from this pattern; consistent and remarkably low SRA levels only differed for SLP level 5.
MLM was invoked to identify the “above-and-beyond” associations of SRA with SLP levels within each of the twelve nations/entities studied in this research project. Thus, student and school variables (as available in each of the twelve contexts) were included in these models, alongside SLP variables, chosen to provide unambiguous separation among the five different SLP levels.
Table 2 shows those SLP variables which were significantly associated with SRA in both lower (levels one to three) and upper (levels three to five) cohorts for each of the twelve nations/entities. Note that full MLM results are shown in Supplementary Tables 3, 4 (Supplementary Table 3 compares null and parsimonious model statistics, and Supplementary Table 4 lists significant variables for each of 24 parsimonious models, along with their coefficients, significance levels and d values). Briefly, the proportion of student variance accounted for by the parsimonious models (expressed as percentages) ranged from 0.3 to 5.8% for SEA nations/entities and from 4.5 to 16.1% for NWE nations. We first present the MLM results for SLP levels based on Table 2; secondly, we compare (and contrast) MLM results with ANOVA results for each nation/entity.
For Hong Kong, we will explain the logic of our interpretation of MLM results (Table 2), then will move through the remaining nations/entities without re-explaining our interpretive schema. The use of two dummy SLP variables for the lower cohort and two dummy SLP variables for the upper cohort allowed us to compare the three SLP levels in each cohort. In the case of the lower cohort for Hong Kong, the dummy variable for SLP level one was not significant; we interpret this to indicate that SLP levels one and two did not differ. Meanwhile the dummy variable for SLP level three was significant, with a negative coefficient. We interpret this result as showing that SRA of level three was significantly less that than of level two. In the case of the upper cohort of Hong Kong, the dummy variable for level three was significant, with a positive coefficient, while the dummy variable for level five was also significant, but with a negative coefficient. We interpret these results to show that SLP level three had higher SRA than did SLP level four, and that SLP level four had higher SRA than did SLP level five. In summary, across the two Hong Kong cohorts, levels one and two showed the highest SRA, and levels three to five showed a significant and stepwise decrease in SRA.
Neither Japan nor Korea showed differences among SLP levels. The general pattern for Macao matched that of Hong Kong; that is, SLP levels one and two did not differ from each other, but SLP levels three to five showed significant, stepwise declines in SRA. The pattern for Singapore diverged from that of Macao and Hong Kong; that is, SLP levels one, two, and three did not differ; however, levels four and five had sharply declining SRA values. Finally, the pattern for Taiwan was quite different, with SLP level one having a lower SRA value than SLP levels two, three, or four (those three SLP levels did not differ for Taiwan), and SLP level five also showing a lower SRA value than the “central” three SLP levels (two, three and four).
Belgium, Finland, and Iceland showed significant and stepwise declines for each SLP level, from one through five. The coefficients for Iceland were particularly pronounced and were numerically the largest of any of the twelve nations/entities at each step. The pattern for Estonia matched that of Hong Kong and Macao, with SLP levels one and two not different, but with SLP levels three through five showing progressively lower SRA values. The pattern for Ireland was unique, with higher SRA values for SLP level one than SLP levels two or three (which did not differ from one another), and then progressively lower SRA values for SLP levels four and five. SLP levels one, two and three did not show differing SRA values for the Netherlands; however, SLP level four had lower SRA than did SLP level three (and SLP levels four and five did not differ).
We first identify similarities between our two analytical approaches (notably, confirmation of Taiwan’s inverse U-shaped response), and then move to differences between these approaches. For both approaches, Taiwan had significantly lower SRA values for SLP levels one and five, with no differences among the intermediate three SLP levels. For both Japan and Korea, ANOVA provided some support for an inverse U-shaped relationship between SRA and SLP levels; however, under MLM, these differences disappeared. For Hong Kong, Macao, and Singapore, SRA significance and values were less frequent or pronounced at the lower SLP levels than at the upper SLP levels—for both analytical approaches. For both analytical approaches, both Finland and Iceland showed significant stepwise declines in SRA values across SLP levels (from one through five). In a similar manner, the patterns for both Estonia and Ireland were confirmed by both analytical approaches. Belgium’s pattern showed a modest difference among approaches (fully stepwise under MLM, less stepwise under ANOVA). Finally, the Netherlands (with very low SRA values at all five SLP levels) showed different results under MLM (SLP level three highest SRA) compared with ANOVA (SLP level five lowest SRA value).
The objective of this research was to assess the relationship of SLP levels with SRA in Taiwan and other SEA nations/entities in contrast with that of NWE nations. Our discussion thus begins with Taiwan-specific inferences, and then moves on to inferences within both SEA and NWE regions. We continue with implications and recommendations based on this work, and finish with limitations and conclusions.
Despite differences in sampling frame and measurements, our results (comparing measures of anxiety with measures of performance) were comparable to those of Sung et al. (2016). Our sampling frame differed in year (2015 vs. 2011 of Sung et al., 2016), student grade level (by age—15.25 to 16.25 years of age at sampling, 56.1% in tenth grade, 43.9% in ninth grade vs. all ninth graders), sample size (7708 vs. 1931 students), and student performance levels [five SLP levels, as described by PISA 2015 (OECD, 2016b) vs. ten decile levels on the standardized overall academic achievement exam for Taiwan]. Importantly, measures of anxiety also differed [SRA vs. “examination stress scale”, consisting of three dimensions (physiological, social, and cognitive/behavioral)]. Notably, both sets of students were sampled from schools throughout Taiwan. Despite such differences, the overall results were similar—in both cases, an inverse U-shaped relationship between test-related anxiety and academic performance were detected. Thus, we argue that the similarity of our results to those of Sung et al. (2016) provides support both for our approach and our findings. We further note that all three dimensions of the examination stress scale (Sung et al., 2016) showed inverse U-shaped relationships with standardized examination performance. We believe that this similarity provides support for extension of the corresponding outcomes from the two Taiwanese studies to our broader comparisons of other nations/entities within SEA (see next paragraph) as well as to our implications section (below).
While prior reports have emphasized a negative linear relationship between academic and discipline-specific anxiety measures and student performance (e.g., Cassady and Johnson, 2002), our ANOVA (Figure 1, Supplementary Table 1) has shown an inverse U-shaped relationship between SRA and SLP levels for the SEA region. In contrast, the ANOVA (Figure 1, Supplementary Table 1) for the NWE region described an overall negative linear relationship between SRA and SLP levels. We recognize that the presence of differing response patterns for individual nations/entities within both SEA and NWE regions (Figure 2) limits the generalizability of our regional analysis. At a national/entity scale and relating to our ANOVA approach, three SEA nations/entities (Taiwan, Japan, and Korea) showed inverse U-shaped relationships between SRA and SLP levels, both confirming (Taiwan) and extending (Japan and Korea) the prior results of Sung et al. (2016). Thus, we argue that our Taiwanese results extend the generalized academic work of Sung et al. (2016) into the discipline-specific context of science (via our established association among SRA and SLP levels) and provide some evidence of a similar relationship for both Japan and Korea. While the ANOVA results for the remaining three SEA nations/entities (Hong Kong, Macao, and Singapore) were generally representative of a negative linear relationship between SRA and SLP levels (as were Belgium, Estonia and Ireland from the NWE region), both Finland and Iceland were fully stepwise in this relationship, with each successive SLP level showing significantly lower SRA. As noted in the results above, Iceland showed the most pronounced differences in SRA by SLP level of any of the twelve nations/entities studied. The Netherlands showed minimal SRA differences across SLP levels. Finally, and importantly, most nations/entities showed a strong relationship between SRA and SLP levels.
While the complexities of differing availabilities of student and school variables for the included suites of nations/entities precluded a transcendent MLM approach (that is, MLMs across nations/entities and/or across regions), single nation/entity MLMs granted us the opportunity to evaluate the associations of SRA with SLP levels within each of the 12 nations/entities considered in this research. Under MLM, only Taiwan showed an inverse U-shaped response of SRA to SLP levels (Table 2). Thus, our MLM results partially confirmed our less-rigorous ANOVA results (Figure 2). Some other SEA entities (Hong Kong, Macao) showed a nearly stepwise response of SRA to SLP levels— (levels 1 and 2 were equivalent). Excepting the unusual case of the Netherlands, NWE nations were either stepwise (Belgium, Finland, Iceland) or nearly so (Estonia, Ireland). Thus, highest SRA values (greatest anxiety) were generally for the lowest SLP levels.
Given the strong coherence of our Taiwanese results with the prior work of Sung et al. (2016) and given our moderate evidence (from ANOVA) for similar inverse U-shaped associations between SRA and SLP for Japan and Korea, we believe that science educators in those nations (and perhaps in that region?) may need to target SRA-management efforts on students in middle-performance levels. While Hong (2010) reported on an intervention effort designed to minimize science anxiety among high-performing students, both our results and those of Sung et al. (2016) would suggest that, in certain contexts, both high- and low-performing students may be less subject to performance-inhibiting science anxiety/SRA than those in middle-performance levels. Further, while inverse U-shaped relationships between SRA and SLP were not detected amongst our sample of NWE nations, such relationships could well occur in other regions (for example, Latin America—see Table 1) or indeed within local schools (or classrooms) anywhere in the world. Additionally, the possibility that some in-class anxiety could be adaptive has been raised (Munz et al., 1975); this could conceivably suggest that an effort to enhance adaptative anxiety of low-performing students could be fruitful.
Interventions intended to mitigate SRA (or other forms of academic anxiety) should both be well-grounded in existing theoretical frameworks and field tested in relevant student learning contexts. Both SCT and STT can help provide insights here, as well as the approach of Sung’s group (Sung and Chao, 2015; Sung et al., 2016; Chao and Sung, 2019, 2023; Chao et al., 2024) toward explaining their observed inverse U-shaped response in Taiwan. Under both SCT and STT, students collate their perceptions about how other persons see them in a learning/performance context (Putwain and Daly, 2014; Appel et al., 2015; Schunk and DiBenedetto, 2020); educators may need to consider potential adverse triggering of student anxiety as they implement teaching strategies designed to heighten student attentiveness and engagement. Given the heightened SRA among intermediate SLP levels in Taiwan (compared with both the lowest and highest SLP levels), social comparisons/sensations of stereotype threat may be more problematic for students are intermediate performance levels. Thus, selection of teaching strategies may need to bear in mind these potential vulnerabilities of their intermediate performing students. For example, active student learning (vs. passive teacher lecturing) has received much attention of late (Daniel, 2016; England et al., 2017; Cooper et al., 2018; Downing et al., 2020; Liu et al., 2022); examinations of a variety of active learning strategies have revealed dissonances in how such strategies are associated with academic anxiety. Generally, calling on individual students (England et al., 2017; Cooper et al., 2018) appears to increase anxiety of at least some students, while retrieval practice (using classroom clickers; Agarwal et al., 2014), particularly as a formative assessment (Molin et al., 2021) mitigated academic anxiety. Collaborative/group work is generally supportive of lessened anxiety (Fung, 2020) and enhanced performance (Grabau and Ma, 2017); unfortunately, socially anxious science students may not respond well to this intervention (Scanlon et al., 2020). Students in middle-performance levels may reasonably sense higher stakes for their science performance (Sung et al., 2016); social comparisons with their peers (whether high- or middle-performing) may indeed heighten these students’ anxieties. A more comprehensive active learning strategy (incorporating educational games and formative assessment) not only reduced students’ anxiety levels, but also improved science proficiency for both undergraduates (Cardozo et al., 2020) and dental students (Cardozo et al., 2023).
Besides the above-noted differences among nations/entities included in this work, vis-à-vis teaching approaches (Lau and Lam, 2017; Ronkainen et al., 2023) and high stakes testing (Chao et al., 2024; Ministry of Education and Culture, Finland [MECF], 2024), other differences in social contexts (Lee and Larson, 2000; Ang et al., 2009; Sung and Chao, 2015) could conspire to trigger student anxieties in divergent ways. Recently, Chao and Sung (2023) have developed and validated an “Adolescent Uncertainty Scale” (which assesses their uncertainty-of-stress model at an individual level); evaluation of student responses to this scale could be useful in counseling and supporting students experiencing higher academic anxiety levels (perhaps concentrated, in the case of Taiwan and other culturally near, high-stakes testing nations/entities, among middle-performing students). This new development may provide new insights to student’s academic anxieties, above and beyond what was possible under earlier approaches (Minor and Gold, 1985; Tobias, 1985; Sommer and Arendasy, 2014, 2015). At an individual level, improved career counselling (Chao and Sung, 2023) and enhanced stress coping strategies (Shields, 2001; Sung et al., 2016) have been suggested to reduce uncertainty-related stress. At a social level, Chao and Sung (2019) urged educational policymakers to work to socially normalize reduced pressure to gain access to elite schools. Relatedly, the ongoing investment by students (under pressure from their parents?) in “cram schools” in advance of consequential exams could be reduced by appropriate educational policies (Chao and Sung, 2019; Chao et al., 2024).
We recommend follow-up research regarding inverse U-shaped relationships between academic anxieties (science anxiety per se; SRA) and science literacy in other contexts, for example, Latin America might be a good investigative choice, given the generally elevated national means for Costa Rica, Brazil, Uruguay and Colombia (Table 1). Identification of such relationships in other educational contexts could well provide impetus for interventions designed to minimize maladaptive anxiety [among intermediate performing students having the most to gain (or lose) by their exam performance (Sung et al., 2016)] or to enhance adaptive attentiveness (Munz et al., 1975) of lower performing students.
We acknowledge several limitations to our work: i) the correlational/associational nature of inferences that can be drawn from the PISA 2015 dataset (OECD, 2016a) invoked in this research, ii) the use of a general measure of students’ anxiety in a science context (SRA) rather than a discipline-specific measure of science anxiety (Megreya et al., 2021), iii) the limited sample of nations/entities within the two regions chosen for study, iv) the apparent lack of cultural invariance in the anxiety measure (SRA) used in this international assessment, and v) over-and under-representation of nations/entities in the regional comparisons (SEA and NWE that we evaluated). We have consistently tried to avoid language suggesting that the associations observed in our research infer causality; subsequent research work (e.g., longitudinal student observations) may support such causal inferences. Regarding our use of SRA as an alternative to science anxiety, we believe that the availability of SRA alongside SLP levels within the expansive PISA 2015 dataset, along with inclusion of both learning anxiety and performative anxiety as part of the SRA construct [like recently published science anxiety measures (Megreya et al., 2021)] provide support for our approach. Notably, our research was not intended to be globally comprehensive, but instead to verify prior Taiwanese results showing an inverse U-shaped relationship between test anxiety and academic performance (Sung et al., 2016) and to conceivably extend their results to a science context as well as to culturally near nations/entities. We chose not to test for cultural invariance of the SRA measure, since our primary emphasis in this research was to compare SRA responses to SLP levels within nations/entities. Thus, we recognize (and honour) the appropriate cautions of Rutkowski and Svetina (2014) and Lafontaine et al. (2019) against direct cross-cultural comparisons (unprotected by validation of cultural invariance). Finally, the overall regional comparisons should be regarded as descriptive (rather than conclusive) over concerns regarding both over- and under-sampling and the likelihood of cultural variance in students’ SRA construct responses.
In conclusion, our Taiwanese results (both ANOVA and MLM) support the Taiwanese results of Sung et al. (2016); both show an inverse U-shaped relationship between measures of academically related anxiety and academic performance. In addition, our work extends their generalized academic results into a science-specific context. Further, we present evidence that Japan and Korea, along with the SEA region inclusive of these three nations, may also include an inverse U-shaped relationship between students’ anxiety and academic performance in a science context. These results seem to indicate that follow-up research regarding interventions toward mitigation of science-related anxiety among students showing moderate science performance may prove fruitful. Meanwhile, the negative linear relationship between SRA and SLP displayed by most NWE nations in this study may instead support such interventions among the lowest performing groups of students. We believe that such interventions may need to be fine-tuned for this differentiated suite of performance levels; that is, interventions designed (and shown to be effective) toward ameliorating adverse anxiety among intermediate science students may well differ from those targeting lower performing science students.
The datasets analyzed in support of this study can be found online through the Organization for Economic Cooperation and Development’s (OECD) Programme for International Student Assessment (PISA) 2015 Database at https://www.oecd.org/pisa/data/2015database/.
The studies involving humans were approved by the Organization for Economic Cooperation and Development arranged for parental consent for student participants in the Programme for International Student Assessment in each nation/entity included in this research. The studies were conducted in accordance with the local legislation and institutional requirements. Written informed consent for participation in this study was provided by the participants’ legal guardians/next of kin.
LG: Writing–review and editing, Writing–original draft, Project administration, Methodology, Formal analysis, Data curation, Conceptualization. BG: Writing–review and editing, Methodology, Conceptualization. DL: Writing–review and editing. JL: Writing–review and editing. RO: Writing–review and editing. LT: Writing–review and editing. SY: Writing–review and editing.
The author(s) declare that no financial support was received for the research, authorship, and/or publication of this article.
Gratitude is extended to BG (of UC Louvain) and Jan Van Damme (of KU Leuven) for their kindness in hosting LG for a research sabbatical in 2019–2020. During that time frame, professional connections were made/affirmed with the co-authors of this manuscript, and prospective research work was initiated.
The authors declare that the research was conducted in the absence of any commercial or financial relationships that could be construed as a potential conflict of interest.
All claims expressed in this article are solely those of the authors and do not necessarily represent those of their affiliated organizations, or those of the publisher, the editors and the reviewers. Any product that may be evaluated in this article, or claim that may be made by its manufacturer, is not guaranteed or endorsed by the publisher.
The Supplementary Material for this article can be found online at: https://www.frontiersin.org/articles/10.3389/feduc.2024.1414423/full#supplementary-material
Agarwal, P. K. D., Antonio, L., Roediger, H. L., McDermott, K. B., and McDaniel, M. A. (2014). Classroom-based programs of retrieval practice reduce middle school and high school students’ test anxiety. J. Appl. Res. Mem. Cogn. 3, 131–139. doi: 10.1016/j.jarmac.2014.07.002
Altun, A., and Kalkan, ÖK. (2021). Cross-national study on students and school factors affecting science literacy. Educ. Stud. 47, 403–421. doi: 10.1080/03055698.2019.1702511
Anderson, C. J., Kim, J.-S., and Keller, B. (2014). “Multilevel modeling of categorical response variables,” in Handbook of international large-scale assessment: Background, technical issues, and methods of data analysis, eds L. Rutkowski, M. von Davier, and D. Rutkowski (New York, NY: Taylor & Francis Group), doi: 10.1201/b16061
Ang, R. P., Klassen, R. M., Chong, W. H., Huan, V. S., Wong, I. Y. F., Leo, L. S., et al. (2009). Cross-cultural invariance of the academic expectations stress inventory: Adolescent samples from Canada and Singapore. J. Adolesc. 32, 1225–1237. doi: 10.1016/j.adolescence.2009.01.009
Appel, M., Weber, S., and Kronberger, N. (2015). The influence of stereotype threat on immigrants: Review and meta-analysis. Front. Psychol. 6:900. doi: 10.3389/fpsyg.2015.00900
Aronson, J., Fried, C. B., and Good, C. (2002). Reducing the effects of stereotype threat on African American college students by shaping theories of intelligence. J. Exp. Soc. Psychol. 38, 113–125. doi: 10.1006/jesp.2001.1491
Bandura, A. (2005). “The evolution of social cognitive theory,” in Great minds in management, eds K. G. Smith and M. A. Hitt (Oxford: Oxford University Press), 9–35.
Benlloch-Pla, M., Solaz-Portolés, J. J., and Sanjosé-López, V. (2019). Ansiedad ante las ciencias y pruebas de evaluación científicas: Efectos del nivel académico y genero. [Science and science assessment test anxiety: Gender and academic level effects.]. Rev. Científica 34, 20–33. doi: 10.14483/23448350.13542
Britner, S. (2008). Motivation in high school science students: A comparison of gender differences in life, physical, and earth science classes. J. Res. Sci. Teach. 45, 955–970. doi: 10.1002/tea.20249
Brownlow, S., Jacobi, T., and Rogers, M. (2000). Science anxiety as a function of gender and experience. Sex Roles 42, 119–131. doi: 10.1023/A:1007040529319
Burns, E. C., Martin, A. J., Kennett, R. K., Pearson, J., and Munro-Smith, V. (2021). Optimizing science self-efficacy: A multilevel examination of the moderating effects of anxiety on the relationship between self-efficacy and achievement in science. Contemp. Educ. Psychol. 64:101937. doi: 10.1016/j.cedpsych.2020.101937
Cardozo, L. T., de Lima, P. O., Morais Carvalho, M. S., Casale, K. R., Bettioli, A. L., and Ramos, et al. (2023). Active learning methodology, associated to formative assessment, improved cardiac physiology knowledge and decreased pre-test stress and anxiety. Front. Physiol. 14:1261199. doi: 10.3389/fphys.2023.1261199
Cardozo, L. T., Ramos, de Azevedo, M. A., Morais Carvalho, M. S., Costa, R., de Lima, P. O., et al. (2020). Effect of an active learning methodology combined with formative assessments on performance, test anxiety, and stress of university students. Adv. Physiol. Educ. 44, 744–751. doi: 10.1152/advan.00075.2020
Carey, E., Devine, A., Hill, F., and Szücs, D. (2017a). Differentiating anxiety forms and their role in academic performance from primary to secondary school. PLoS One 12:e0174418. doi: 10.1371/journal.pone.0174418
Carey, E., Hill, F., Devine, A., and Szücs, D. (2017b). The modified abbreviated math anxiety scale: A valid and reliable instrument for use with children. Front. Psychol. 8:11. doi: 10.3389/fpsyg.2017.00011
Cassady, J. C., and Johnson, R. E. (2002). Cognitive test anxiety and academic performance. Contemp. Educ. Psychol. 27, 270–295. doi: 10.1006/ceps.2001.1094
Chao, T.-Y., and Sung, Y.-T. (2019). An investigation of the reasons for test anxiety, time spent studying, and achievement among adolescents in Taiwan. Asia Pac. J. Educ. 39, 469–484. doi: 10.1080/02188791.2019.1671804
Chao, T.-Y., and Sung, Y.-T. (2023). Testing the uncertainty-of-stress model: Developing the adolescent uncertainty scale for Taiwanese adolescents. Asia Pac. Educ. Res. 32, 531–544. doi: 10.1007/s40299-022-00674-1
Chao, T.-Y., Sung, Y.-T., and Tseng, F.-L. (2024). High-stakes test anxiety among Taiwanese adolescents: A longitudinal study. Cogent Educ. 11:2321019. doi: 10.1080/2331886X.2024.2321019
Chen, H. (2012). Impact of parent’s socioeconomic status on perceived parental pressure and test anxiety among Chinese high school students. Int. J. Psychol. Stud. 4, 235–245. doi: 10.5539/ijps.v4n2p235
Cohen, J. (1988). Statistical power analysis for the behavioral sciences, 2nd Edn. Hillsdale, NJ: Lawrence Erlbaum.
Cooper, K. M., Downing, V. R., and Brownell, S. E. (2018). The influence of active learning practices on student anxiety in large-enrollment college science classrooms. Int. J. STEM Educ. 5:23. doi: 10.1186/s40594-018-0123-6
Daniel, K. L. (2016). Impacts of active learning on student outcomes in large-lecture biology courses. Am. Biol. Teach. 78, 651–655. doi: 10.1525/abt.2016.78.8.651
Dávila-Acedo, M. A., Airado-Rodríguez, D., Cañada-Cañada, F., and Sánchez-Martín, J. (2021). Detailed emotional profile of secondary education students toward learning physics and chemistry. Front. Psychol. 12:659009. doi: 10.3389/fpsyg.2021.659009
Downing, V. R., Cooper, K. M., Cala, J. M., Gin, L. E., and Brownell, S. E. (2020). Fear of negative evaluation and student anxiety in community college active-learning science courses. CBE Life Sci. Educ. 19:ar20. doi: 10.1187/cbe.19-09-0186
England, B. J., Brigati, J. R., and Schussler, E. E. (2017). Student anxiety in introductory biology classrooms: Perceptions about active learning and persistence in the major. PLoS One 12:e0182506. doi: 10.371/journal.pone.0182506
Eshet, Y., Steinberger, P., and Grinautsky, K. (2021). Relationship between statistics anxiety and academic dishonesty: A comparison between learning environments in social sciences. Sustainability 13:1564. doi: 10.3390/su13031564
Everson, H., Millsap, R. E., and Browne, J. (1989). Cognitive interference or skills deficit: An empirical test of two competing theories of test anxiety. Anxiety Res. 1, 313–325. doi: 10.1080/08917778908248728
Foley, A. E., Herts, J. B., Borgonovi, F., Guerriero, S., Levine, S. C., and Beilock, S. L. (2017). The math anxiety-performance link: A global phenomenon. Curr. Dir. Psychol. Sci. 26, 52–58. doi: 10.1177/0963721416672463
Fung, D. (2020). The impacts of effective group work on social and gender differences in Hong Kong science classrooms. Int. J. Sci. Educ. 42, 372–405. doi: 10.1080/09500693.2020.1713419
Gherasim, L. R., and Butnaru, S. (2012). The effort attribution, text anxiety, and achievement in sciences: The moderating effect of parental behavior. Int. J. Learn. 18, 283–294. doi: 10.18848/1447-9494/CGP/v18i10/47671
Govorova, E., Benitez, I., and Muñiz, J. (2020). How schools affect student well-being: A cross-cultural approach in 35 OECD countries. Front. Psychol. 11:431. doi: 10.3389/fpsyg.2020.00431
Grabau, L. J. (2022). “Antecedents and associations of test anxiety in the context of science literacy,” in Proceedings of the APA annual meeting proceedings, (Minneapolis, MN).
Grabau, L. J., and Ma, X. (2017). Science engagement and science achievement in the context of science instruction: A multilevel analysis of U.S. students and schools. Int. J. Sci. Educ. 39, 1045–1068. doi: 10.1080/09500693.2017.1313468
Grabau, L. J., and Van Damme, J. (2023). School stratification and science climate in early secondary education in Ireland and Flanders: Associations with students’ science dispositions and science literacy. Int. J. Sci. Maths. Educ. doi: 10.1007/s10763-023-10439-x [Epub ahead of print].
Grabau, L. J., Lavonen, J., and Juuti, K. (2021). Finland, a package deal: Disciplinary climate in science classes, science dispositions and science literacy. Sustainability 13:13857. doi: 10.3390/su13241.3857
Grabau, L. J., Trudel, L., and Ma, X. (2022). Associations between science dispositions and science literacy: A comparison of the United States and Canada. Int. J. Sci. Educ. 44, 1440–1461. doi: 10.1080/09500693.2022.2080887
Hembree, R. (1988). Correlates, causes, effects, and treatment of test anxiety. Rev. Educ. Res. 58, 47–77. doi: 10.3102/00346543058001047
Holm, M. E., Hannula, M. S., and Bjorn, P. M. (2017). Mathematics-related emotions among Finnish adolescents across different performance levels. Educ. Psychol. 37, 205–218. doi: 10.1080/01443410.2016.1152354
Hong, Z.-R. (2010). Effects of a collaborative science intervention on high achieving students’ learning anxiety and attitudes towards science. Int. J. Sci. Educ. 32, 1971–1988. doi: 10.1080/09500690903229304
Jerrim, J. (2023). Test anxiety: Is it associated with performance in high-stakes examinations? Oxford Rev. Educ. 49, 321–341. doi: 10.1080/03054985.2022.2079616
Jerrim, J., and Zieger, L. (2024). How robust are socio-economic achievement gradients using PISA data? A case study from Germany. Br. Educ. Res. J. 50, 438–353. doi: 10.1002/berj.3934
Jerrim, J., Lopez-Agudo, L. A., Marcenaro-Guitierrez, O. D., and Shure, N. (2017). What happens when econometrics and psychometrics collide? An example using PISA data. Econ. Educ. Rev. 61, 51–58. doi: 10.1016/j.econedurev.2017.09.007
Jia, B., Zhu, Z., and Gao, H. (2021). International comparative study of statistics learning trajectories based on PISA data on cognitive diagnostic models. Front. Psychol. 12:657858. doi: 10.3389/fpsyg.2021.657858
Keller, J. (2007). Stereotype threat in classroom settings: The interactive effect of domain identification, task difficulty and stereotype threat on female students’ Maths performance. Br. J. Educ. Psychol. 77, 323–338. doi: 10.1348/000709906X113662
King, R. B., Cai, Y., and Elliot, A. J. (2024). Income inequality is associated with heightened test anxiety and lower academic achievement: A cross-national study in 51 countries. Learn. Instruct. 54:101825. doi: 10.1016/j.learninstruc.2023.101825
Kuo, Y.-R., Tuan, H.-L., and Chin, C. C. (2020). The influence of inquiry-based teaching on male and female students’ motivation and engagement. Res. Sci. Educ. 50, 549–572. doi: 10.1007/s11165-018-9701-3
Kurbanoğlu, N. I, and Nefes, F. K. (2015). Effect of context-based questions on secondary school students’ test anxiety and science attitude. J. Baltic Sci. Educ. 14, 216–226. doi: 10.33225/jbse/15.14.216
Kurbanoğlu, N. I., and Akin, A. (2015). Development of a scale to measure organic chemistry anxiety level of university students. J. Baltic Sci. Educ. 14, 391–400. doi: 10.33225/jbse/15.14.391
Kurbanoğlu, N. I., and Nefes, F. K. (2016). Context-based questions in science education: Their effects on test anxiety and science achievement in relation to the gender of secondary school students. J. Baltic Sci. Educ. 15, 382–390. doi: 10.33225/jbse/16.15.382
Kurbanoğlu, N. I., and Takunyaci, M. (2017). Development and evaluation of an instrument measuring anxiety towards physics laboratory classes among university students. J. Baltic Sci. Educ. 16, 592–598. doi: 10.33225/jbse/17.16.592
Lafontaine, D., Dupont, V., Jaegers, D., and Schillings, P. (2019). Self-concept in reading: Factor structure, cross-cultural invariance and relationships with reading achievement in an international context (PIRLS 2011). Stud. Educ. Eval. 60, 48–89. doi: 10.1016/j.stueduc.2018.11.005
Lau, K.-C., and Lam, T. Y.-P. (2017). Instructional practices and science performance of 10 top-performing regions in PISA 2015. Int. J. Sci. Educ. 39, 2128–2149. doi: 10.1080/09500693.2017.1387947
Lau, N. T. T., Hawes, Z., Tremblay, P., and Ansari, D. (2022). Disentangling the individual and contextual effects of math anxiety: A global perspective. Proc. Natl. Acad. Sci. U.S.A. 119:e21125855119. doi: 10.1073/pnas.2115855119
Lee, M., and Larson, R. (2000). The Korean examination hell: Long hours of studying, distress, and depression. J. Youth Adolesc. 29, 249–272. doi: 10.1023/A:1005160717081
Leonard, N. R., Gwadz, M. V., Ritchie, A., Linick, J. L., Cleland, C. M., Elliot, L., et al. (2015). A multi-method exploratory study of stress, coping, and substance use among high school youth in private schools. Front. Psychol. 6:1028. doi: 10.3389/fpsyg.2015.01028
List, M. K., Schmidt, F. T. C., Mundt, D., and Föste-Eggers, D. (2020). Still green at fifteen? Investigating environmental awareness of the PISA 2015 population: Cross-national differences and correlates. Sustainability 12:2985. doi: 10.3390/su12072985
Liu, Y., He, W., and Zhao, L. (2022). Effects of inquiry learning with different task orders on fifth graders’ individual and situational interest and concept achievement in science education. J. Baltic Sci. Educ. 21, 849–861. doi: 10.33225/jbse/22.21.849
Lotz, C., and Sparfeldt, J. R. (2017). Does test anxiety increase as the exam draws near?—Students’ state test anxiety recorded over the course of one semester. Pers. Individ. Differ. 104, 397–400. doi: 10.1016/j.paid.2016.08.032
Mallow, J. V. (1994). Gender-related science anxiety: A first binational study. J. Sci. Educ. Technol. 3, 227–238. doi: 10.1007/BF01575898
Mallow, J. V., and Kastrup, H. (2023). Fear of physics: And how to help students overcome it. Bristol: IOP, doi: 10.1088/978-0-7503-4866-9ch15
Megreya, A. M., Szücs, D., and Moustafa, A. A. (2021). The abbreviated science anxiety scale: Psychometric properties, gender differences and associations with test anxiety, general anxiety and science achievement. PLoS One 16:e0245200. doi: 10.1371/journal.pone.0245200
Ministry of Education and Culture, Finland [MECF] (2024). Finnish education system. Available online at: https://okm.fi/en/education-system (accessed June 1, 2024).
Minor, S. W., and Gold, S. R. (1985). Worry and emotionality components of test anxiety. J. Pers. Assess. 49, 82–85.
Molin, F., Cabus, S., Haelermans, C., and Groot, W. (2021). Toward reducing anxiety and increasing performance in physics education: Evidence from a randomized experiment. Res. Sci. Educ. 51, S233–S249. doi: 10.1007/s1165-019-9845-9
Munz, D. C., Costello, C. T., and Korabik, K. (1975). A further test of the inverted-U hypothesis relating achievement anxiety to academic test performance. J. Psychol. 38, 39–47. doi: 10.1080/00223980.1975.9923904
National Center for Education Statistics [NCES] (2023). Methodology and technical notes, PISA 2015, proficiency levels. Washington, DC: National Center for Education Statistics [NCES].
Núñez-Peña, M. I., and Suárez-Pellicioni Bono, R. (2016). Gender differences in test anxiety and their impact on higher education students’ academic achievement. Proc. Soil Behav. Sci. 228, 154–160. doi: 10.1016/j.sbspro.2016.07.023
OECD (2016b). Science performance among 15-year-olds, PISA 2015 results (Volume I): Excellence and equity in education. Paris: OECD Publishing.
OECD (2017b). Schoolwork-related anxiety, PISA 2015 results (Volume III): Students’ well-being. Paris: OECD Publishing, doi: 10.1787/9789264273856-8-en
OECD (2018b). PISA for development assessment and analytical framework: Reading, mathematics and science. Paris: OECD Publishing, doi: 10.1787/9789264305274-en
Ólafsson, R. F., and Hansen, B. (2022). Characteristics of the authority basis of Icelandic compulsory school principals in comparison to other TALIS countries. Educ. Sci. 12:219. doi: 10.3390/educsci12030219
Putwain, D., and Daly, A. L. (2014). Test anxiety prevalence and gender differences in a sample of English secondary school students. Educ. Stud. 40, 554–570. doi: 10.1080/03055698.2014.953914
Raudenbush, S. W., Bryk, A. S., and Congdon, R. (2011). HLM 7 for windows. [Computer software]. Skokie, IL: Scientific Software International, Inc.
Ronkainen, R., Kuusisto, E., Eisenschmidt, E., and Tirri, K. (2023). Purposeful teachers and teaching in Finland and Estonia. Teach. Teach. doi: 10.1080/13540602.2023.2287080
Roo, A. K., Ardasheva, Y., Newcomer, S. N., and Vidrio Magaña, M. (2020). Contributions of tracking, literacy skills, and attitudes to science achievement of students with varied English proficiency. Int. J. Biling. Educ. Biling. 23, 1108–1124. doi: 10.1080/12670050.2018.1434125
Rutkowski, L., and Svetina, D. (2014). Assessing the hypothesis of measurement invariance in the context of large-scale international surveys. Educ. Psychol. Meas. 74, 31–57. doi: 10.1177/0013164413498257
Sahranavard, M., Hassan, S. A., Elias, H., and Abdullah, M. C. (2013). Comparison of scores in psychological measurement tools of 8th grade Iranian students from various income levels. Asia Life Sci. 22, 61–73.
Scanlon, C. L., Del Toro, J., and Wang, M.-T. (2020). Socially anxious science achievers: The roles of peer social support and social engagement in the relation between adolescents’ social anxiety and science achievement. J. Youth Adolesc. 49, 1005–1016. doi: 10.1007/s10964-020-01224-y
Schunk, D. E., and DiBenedetto, M. K. (2020). Motivation and social cognitive theory. Contemp. Educ. Psychol. 60:101832. doi: 10.1016/j.cedpsych.2019.101832
Scientific Software International [SSI] (2019). HLM 8 for windows. Baltimore, MD: Scientific Software International [SSI].
Seo, E., and Lee, Y.-K. (2021). Stereotype threat in high school classrooms: How it links to teacher mindset climate, mathematics anxiety, and achievement. J. Youth Adolesc. 50, 1410–1423. doi: 10.1007/s10964-021-01435-x
Shields, N. (2001). Stress, active coping, and academic performance among persisting and nonpersisting college students. J. Appl. Biobehav. Res. 6, 65–81. doi: 10.1111/j.1751-9861.2001.tb00107.x
Sommer, M., and Arendasy, M. E. (2014). Comparing different explanations of the effect of test anxiety on respondents’ test scores. Intelligence 42, 115–127. doi: 10.1016/j.intell.2013.11.003
Sommer, M., and Arendasy, M. E. (2015). Further evidence for the deficit account of the test anxiety-test performance relationships from a high-stakes admission testing setting. Intelligence 53, 72–80. doi: 10.1016/j.intell.2015.08.007
Spencer, S. J., Steele, C. M., and Quinn, D. M. (1999). Stereotype threat and women’s math performance. J. Exp. Soc. Psychol. 35, 4–28. doi: 10.1006/jesp.1998.1373
Stoet, G., Bailey, D. H., Moore, A. M., and Geary, D. C. (2016). Countries with higher levels of gender equality show larger national sex differences on mathematics anxiety and relatively lower parental mathematics valuation for girls. PLoS One 11:e0153857. doi: 10.1371/journal.pone.0153857
Struthers, C. W., Perry, R. P., and Menec, V. H. (2000). An examination of the relationship among academic stress, coping, motivation, and performance in college. Res. High. Educ. 41, 581–592. doi: 10.1023/A:1007094931292
Stupurienė, G., Jevsikova, T., and Juškevičienė, A. (2022). Solving ecological problems through physical computing to ensure gender balance in STEM education. Sustainability 14:4924. doi: 10.3390/su14094924
Sung, Y.-T., and Chao, T.-Y. (2015). Construction of an examination stress scale for adolescent students. Meas. Eval. Couns. Dev. 48, 44–58. doi: 10.1177/0748175614538062
Sung, Y.-T., Chao, T.-Y., and Tseng, F.-L. (2016). Reexamining the relationship between test anxiety and learning achievement: An individual-differences perspective. Contemp. Educ. Psychol. 46, 241–252. doi: 10.1016/j.cedpsych.2016.07.001
Tobias, S. (1985). Test anxiety: Inference, defective skills, and cognitive capacity. Educ. Psychol. 20, 135–142. doi: 10.1207/s15326985ep2003_3
Udo, M. K., Ramsey, G. P., and Mallow, J. V. (2004). Science anxiety and gender in students taking general education science courses. J. Sci. Educ. Technol. 13, 435–446. doi: 10.1007/s10956-004-1465-z
von der Embse, N., Jester, D., Roy, D., and Post, J. (2018). Test anxiety effects, predictors, and correlates: A 30-year meta-analytic review. J. Affect. Disord. 227, 483–493. doi: 10.1016/j.jad.2017.11.048
Wan, Z. H., and Lee, J. C. K. (2017). Hong Kong secondary school students’ attitudes towards science: A study of structural models and gender differences. Int. J. Sci. Educ. 39, 507–527. doi: 10.1080/09500693.2017.1292015
Wang, C., and Zhao, H. (2020). The impact of COVID-19 on anxiety in Chinese university students. Front. Psychol. 11:1168. doi: 10.3389/fpsyg.2020.01168
Wigfield, A., and Eccles, J. S. (1989). Test anxiety in elementary and secondary school students. Educ. Psychol. 24, 159–183. doi: 10.1207/s15326985ep2402_3
Wissmann, M., Toutenburg, H., and Shalabh. (2007). Role of categorical variables in multicollinearity in the linear regression model. Technical report No. 008. Munich: University of Munich.
Xin, S., Wang, Y., and Sheng, L. (2020). Impact of social changes and birth cohort on anxiety in adolescents in mainland China (1992-2017): A cross-temporal meta-analysis. Child. Youth Serv. Rev. 116:105159. doi: 10.1016/j.childyouth.2020.105159
Yaremych, H. E., Preacher, K. J., and Hedeker, D. (2023). Centering categorical predictors in multilevel models: Best practices and interpretation. Psychol. Methods 28, 613–630. doi: 10.1037/met0000434
Keywords: schoolwork-related anxiety, science literacy proficiency, inverse U-shaped response, Southeast Asia, Northwest Europe
Citation: Grabau L, Galand B, Lafontaine D, Lavonen J, Ólafsson RF, Trudel L and Yoon S (2024) What is the association between schoolwork-related anxiety and science literacy proficiency? A comparison between Southeast Asia and Northwest Europe. Front. Educ. 9:1414423. doi: 10.3389/feduc.2024.1414423
Received: 08 April 2024; Accepted: 05 July 2024;
Published: 19 July 2024.
Edited by:
Ali Ibrahim Can Gözüm, Kafkas University, TürkiyeReviewed by:
Jerrell C. Cassady, Ball State University, United StatesCopyright © 2024 Grabau, Galand, Lafontaine, Lavonen, Ólafsson, Trudel and Yoon. This is an open-access article distributed under the terms of the Creative Commons Attribution License (CC BY). The use, distribution or reproduction in other forums is permitted, provided the original author(s) and the copyright owner(s) are credited and that the original publication in this journal is cited, in accordance with accepted academic practice. No use, distribution or reproduction is permitted which does not comply with these terms.
*Correspondence: Lawrence Grabau, bGdyYWJhdUB1a3kuZWR1
†These authors have contributed equally to this work and share last authorship
Disclaimer: All claims expressed in this article are solely those of the authors and do not necessarily represent those of their affiliated organizations, or those of the publisher, the editors and the reviewers. Any product that may be evaluated in this article or claim that may be made by its manufacturer is not guaranteed or endorsed by the publisher.
Research integrity at Frontiers
Learn more about the work of our research integrity team to safeguard the quality of each article we publish.