 Daniela Vasco
 Kate Thompson
 Sakinah Alhadad1
- 1School of Education and Professional Studies, Griffith University, Brisbane, QLD, Australia
- 2School of Teacher Education and Leadership, Queensland University of Technology, Brisbane, QLD, Australia
Introduction: Researchers in the learning sciences have been considering methods of analysing and representing group-level temporal data, particularly discourse analysis, in Computed Supported Collaborative Learning for many years.
Methods: This paper compares two methods used to analyse and represent connections in discourse, Discrete Time Markov Chains and Epistemic Network Analysis. We illustrate both methods by comparing group-level discourse using the same coded dataset of 15 high school students who engaged in group work. The groups were based on the tools they used namely the computer, iPad, or Interactive Whiteboard group. The aim here is not to advocate for a particular method but to investigate each method’s affordances.
Results: The results indicate that both methods are relevant in evaluating the code connection within each group. In both cases, the techniques have supported the analysis of cognitive connections by representing frequent co-occurrences of concepts in a given segment of discourse.
Discussion: As the affordances of both methods vary, practitioners may consider both to gain insight into what each technique can allow them to conclude about the group dynamics and collaborative learning processes to close the loop for learners.
1 Introduction
Understanding how group-level measures of learner activity change over time in computer-supported learning environments is a continuing challenge for researchers in education. In the research published in the years since Reimann (2009) seminal work on event-based measures of Computed Supported Collaborative Learning (CSCL), much of the research has focused on discourse (although some do address other aspects such as gaze), and many approaches have been used to analyse the nature of connections between topics (e.g., Siebert-Evenstone et al., 2017), organisation within groups (Thompson et al., 2013a), interactions with resources (e.g., Martinez-Maldonado et al., 2013), and with instructors (Riel et al., 2018). These include those that consider the comparisons of networks of activity (Kelly et al., 2015; Dowell et al., 2018) as well as those that account for order (e.g., Reimann et al., 2009; Kapur, 2011). More recently, the specific study of collaboration analytics, which applies learning analytics to focus on groups of learners through “measuring, collecting and analysing data from groups of learners for the purpose of supporting them” has expanded the conceptualisation of this research space and identified areas of future research including creating adaptive systems, contributing to theory, and expanding data collection techniques (Schneider et al., 2021). In 2023, Wise et al. identified nine elements for robust collaboration analytics. Both sets of authors highlight the importance of considering the analytics to be actionable (able to be acted upon) and in particular, “what information to provide to whom and how” (Wise et al., 2023).
Many methods considered to study connections in relation to collaboration analytics use some visual representation of the modelled connections. This paper highlights two methods: Discrete Time Markov Chain (DTMC) and Epistemic Network Analysis (ENA). We have selected these two approaches because both DTMC and ENA have been applied in learning sciences to study connections between topics in discourse and exploit visual properties to communicate results. Creating visual representations of group-level collaboration activity that comprises the contributions of individuals can aid teams of researchers to better understand the multiple complex processes that occur during collaborative learning. These visualisations created by teams or on behalf of teams (Akkerman and Bakker, 2011), can act as boundary objects, which support learners, instructors, and the other stakeholders of learning analytics to cross boundaries concerned with syntax, semantics and interests (Abraham, 2017). In considering the use of visual representations in research, the affordances of representations for communicating the underlying theoretical assumptions of the analysis should be considered, in addition to cognitive factors such as visual attention, perception, judgement or decision-making (Alhadad, 2018). Therefore, it is important to understand and contrast the different properties and features of both methods empirically to understand the role of visualisations in closing the loop for actionable learning analytics.
This paper starts by presenting the study background and briefly discussing visualisations in educational research. Then we present an overview of both methods under consideration for the analysis of individual contributions to collaborative learning: DTMC and ENA, and their affordances before presenting the analysis and visualisations of coded discourse of a CSCL task (Thompson et al., 2013a,b) using these two approaches. A comparison of the representational affordances of the two approaches in terms of analysis and communication is then provided before concluding with considerations for the use of visualisations for actionable learning analytics.
2 Background
2.1 Study background
Computer-supported collaborative learning (CSCL) “refers to situations in which computer technology plays a significant role in shaping the collaboration” (Goodyear et al., 2014, p. 440). Accounting for tracking student learning over time has grown as an area of interest for CSCL researchers, many of whom draw on Reimann (2009) research on process mining (e.g., Thompson et al., 2014; Malmberg et al., 2015; Sonnenberg and Bannert, 2018). In many cases, CSCL research addresses the challenge of accounting for individual and group-level learning (Cress and Hesse, 2013; Stahl et al., 2014). This paper assumes that group-level learning is an emergent property of the individual-level activity of learners. Understanding this, and the roles of individuals has been discussed further in the literature about collaboration literacy (Worsley et al., 2021). Worsley et al. (2021) consider factors in relation to data collection, such as climate, communication, conflict, contribution and constructiveness, among others.
The study presented in this paper aimed to evaluate the group dynamics and how effectively they used the different elements of learning design, as defined by the Activity Centred Analysis and Design (ACAD) framework (Goodyear et al., 2014). The project involved 15 students from the same high school (aged between 12 and 17 years) and 11 adults from educational and government agencies. It was funded by local councils and supported by an environmental rehabilitation organization. The goal was for the students to develop a multimedia resource to engage other students in learning about water and land management issues. The project ran over 5 months and the students participated in planning sessions, a site visit, and a day of hands-on site restoration at a local creek; before attending the Design Day at the University of Sydney’s Educational Design Research Studio (Martinez-Maldonado et al., 2016).
Students had worked together in groups of five before the Design Day, and the composition (gender and age) of each group differed, as did the tools they accessed to support the task. Here, the groups are identified by the tools they used: the computer, the iPad and the Interactive Whiteboard (IWB) groups. This paper follows the three groups during the ideate stage, which ran for 40 min during the six-hour Design Day. The 40-min idea was naturally contained (three separate groups) and scaffolded but open (ideation). To stimulate the period of learning activity under analysis, the students had to generate ideas to create an online resource, for other students, about water and land management that would inform the design brief given to the multimedia designer.
2.2 Visualisations in educational research
Visual representations of data, both quantitative and qualitative, is one of the cornerstones of educational research as a commitment to improving the communication of scientific information to a broader set of audience. Educational research inherently has the impetus for impact, whether in practice, policy, or further research. Given the multidisciplinary nature of educational research and practice, this places greater importance on communicating research findings in ways that transcend singular disciplinary epistemologies with varying degrees of data literacy (Pangrazio and Sefton-Green, 2020; Raffaghelli and Stewart, 2020; Wise, 2020). While the impetus for data visualisations in enhancing science communication is clear, the details foreboding researcher judgement and decision-making of how they might best represent the data to support effective communication remains an empirical challenge (Alhadad, 2018; Zacks and Franconeri, 2020; Franconeri et al., 2021).
Ineffectively designed data visualisation can disrupt or hinder fundamental information processing processes for further comprehension such as overloading one’s working memory, misguided attentional orientation, or even questioning conventions of data representations (Alhadad, 2018). This has consequential implications when the intention is to communicate findings to high-stakes practitioners or policymakers as poorly designed data visualisations can create confusion, misunderstanding, and even scepticism or distrust about the research or related risk (Wiley et al., 2018; Zacks and Franconeri, 2020). Uncertainty representation in data visualisations provides information about the underlying properties of the data and enables one to understand probabilities, risk or occurrence, or even the extent of meaningfulness of the data for their context. Recent research has shown that even decisions about line segmenting in high variability line graphs can perceptually bias readers towards overestimating averages and trends (Moritz et al., 2023).
In this paper, we refer to the affordances of the two visualisations we have selected to compare in the analysis of groups of individuals interacting in learning situations. By using the term affordance, we are drawing on Gibson (2014) work concerning the actionable properties between the world and a particular actor. In other words, we are using this term to indicate the actions that the visualisations allow the user to take in terms of decisions about learning and collaborative processes. These visualisations can also, as mentioned in the introduction, be considered to act as boundary-negotiating objects (Lee, 2005). This means that they can act as an object around which instructors, students and other stakeholders of learning can use to explore and share ideas, create a venue for the exchange of information, and create a shared understanding of specific design problems (Lee, 2005).
2.3 Overview of discrete time Markov chains and epistemic network analysis
The two fundamental premises about collaborative learning (change over time and emergent properties of collaborative learning) informed the decision to investigate the affordances of the visualisations produced as a result of analysis of the discourse of individuals in teams that unfold over time: Discrete Time Markov Chains and Epistemic Network Analysis. Discrete Time Markov Chains and Epistemic Network Analysis (ENA) are both mathematical frameworks used to model systems with interconnected states or variables but have different characteristics.
Markov Chains (MC) model stochastic processes where the probability of transitioning from one state to another depends only on the current state and not on the sequence of events that preceded it (also known as memoryless property; Gagniuc, 2017). Thus, MC can be used for describing systems in which future events depend only on their current state, that is, the events are likened as in a chain. Discrete-time Markov Chains (DTMC) allow for the modelling of transition probabilities between discrete states. These transitions are typically represented by a transition matrix. Even though a DTMC model is not a graphical model, the transition matrix is often represented visually as a directed graph or network.
DTMC statistical models have been applied in many fields to model complex real-world processes, such as estimating the time of travel on highways (e.g., Yeon et al., 2008) or inferring the magnitude of financing costs (Hennessy and Whited, 2007). In the learning sciences, DTMC has been used to model patterns of decision-making (e.g., Reimann, 2009), problem-solving (Thompson et al., 2014); self-regulation (e.g., Malmberg et al., 2015; Sonnenberg and Bannert, 2018) and idea generation (Thompson et al., 2014).
Epistemic Network Analysis (ENA) was created and used specifically to identify and quantify connections among elements in a coded dataset, which are then illustrated in a network model (Shaffer, 2017; Shaffer and Ruis, 2017). ENA represents the frequency of association within a selected segment of data (or stanza) as a symmetric adjacency matrix, in which columns and rows are the existing codes characterised by a binary classification (1: codes occur within the same stanza, 0: otherwise). These matrices are used to quantify the co-occurrence of codes in the groups’ dialogue. Then these connections are represented in a two-coordinate space as a discourse network, where its location is defined by its centroid (centre position), and its nodes represent the codes. This method enables the comparison of different networks by contrasting their weighted structure of connections, both visually and through summary and test statistics.
ENA allows for the use of sliding window analysis (Dyke et al., 2012; Suthers and Desiato, 2012) to account for the context of each speech act of individuals within the groups, as it is usually a response to some previous speech act. The considered “context” is defined by a chosen number of previous utterances. This technique constructs an adjacency matrix with the connections in the considered “window” of analysis (context) of each utterance. The use of sliding windows has been suggested as a method to track student activity over time (e.g., Dyke et al., 2012; Kelly et al., 2015; Siebert-Evenstone et al., 2017), in particular in reference to the analysis of discourse and considering the influence of the recent history of student activity. ENA has been applied to many contexts of learning, for instance, to understand the effects of ability grouping on the learners’ collaborative problem-solving patterns (An and Zhang, 2024), to model learners’ experience with procedural simulators in medical education (Ruis et al., 2018), and to assess the usefulness of virtual internship on preservice teachers’ technological pedagogical content knowledge (TPACK; Oner, 2020).
2.4 The affordances of DTMC and ENA
A selection of the affordances of the DTMC and ENA representations and approaches are presented in Table 1.
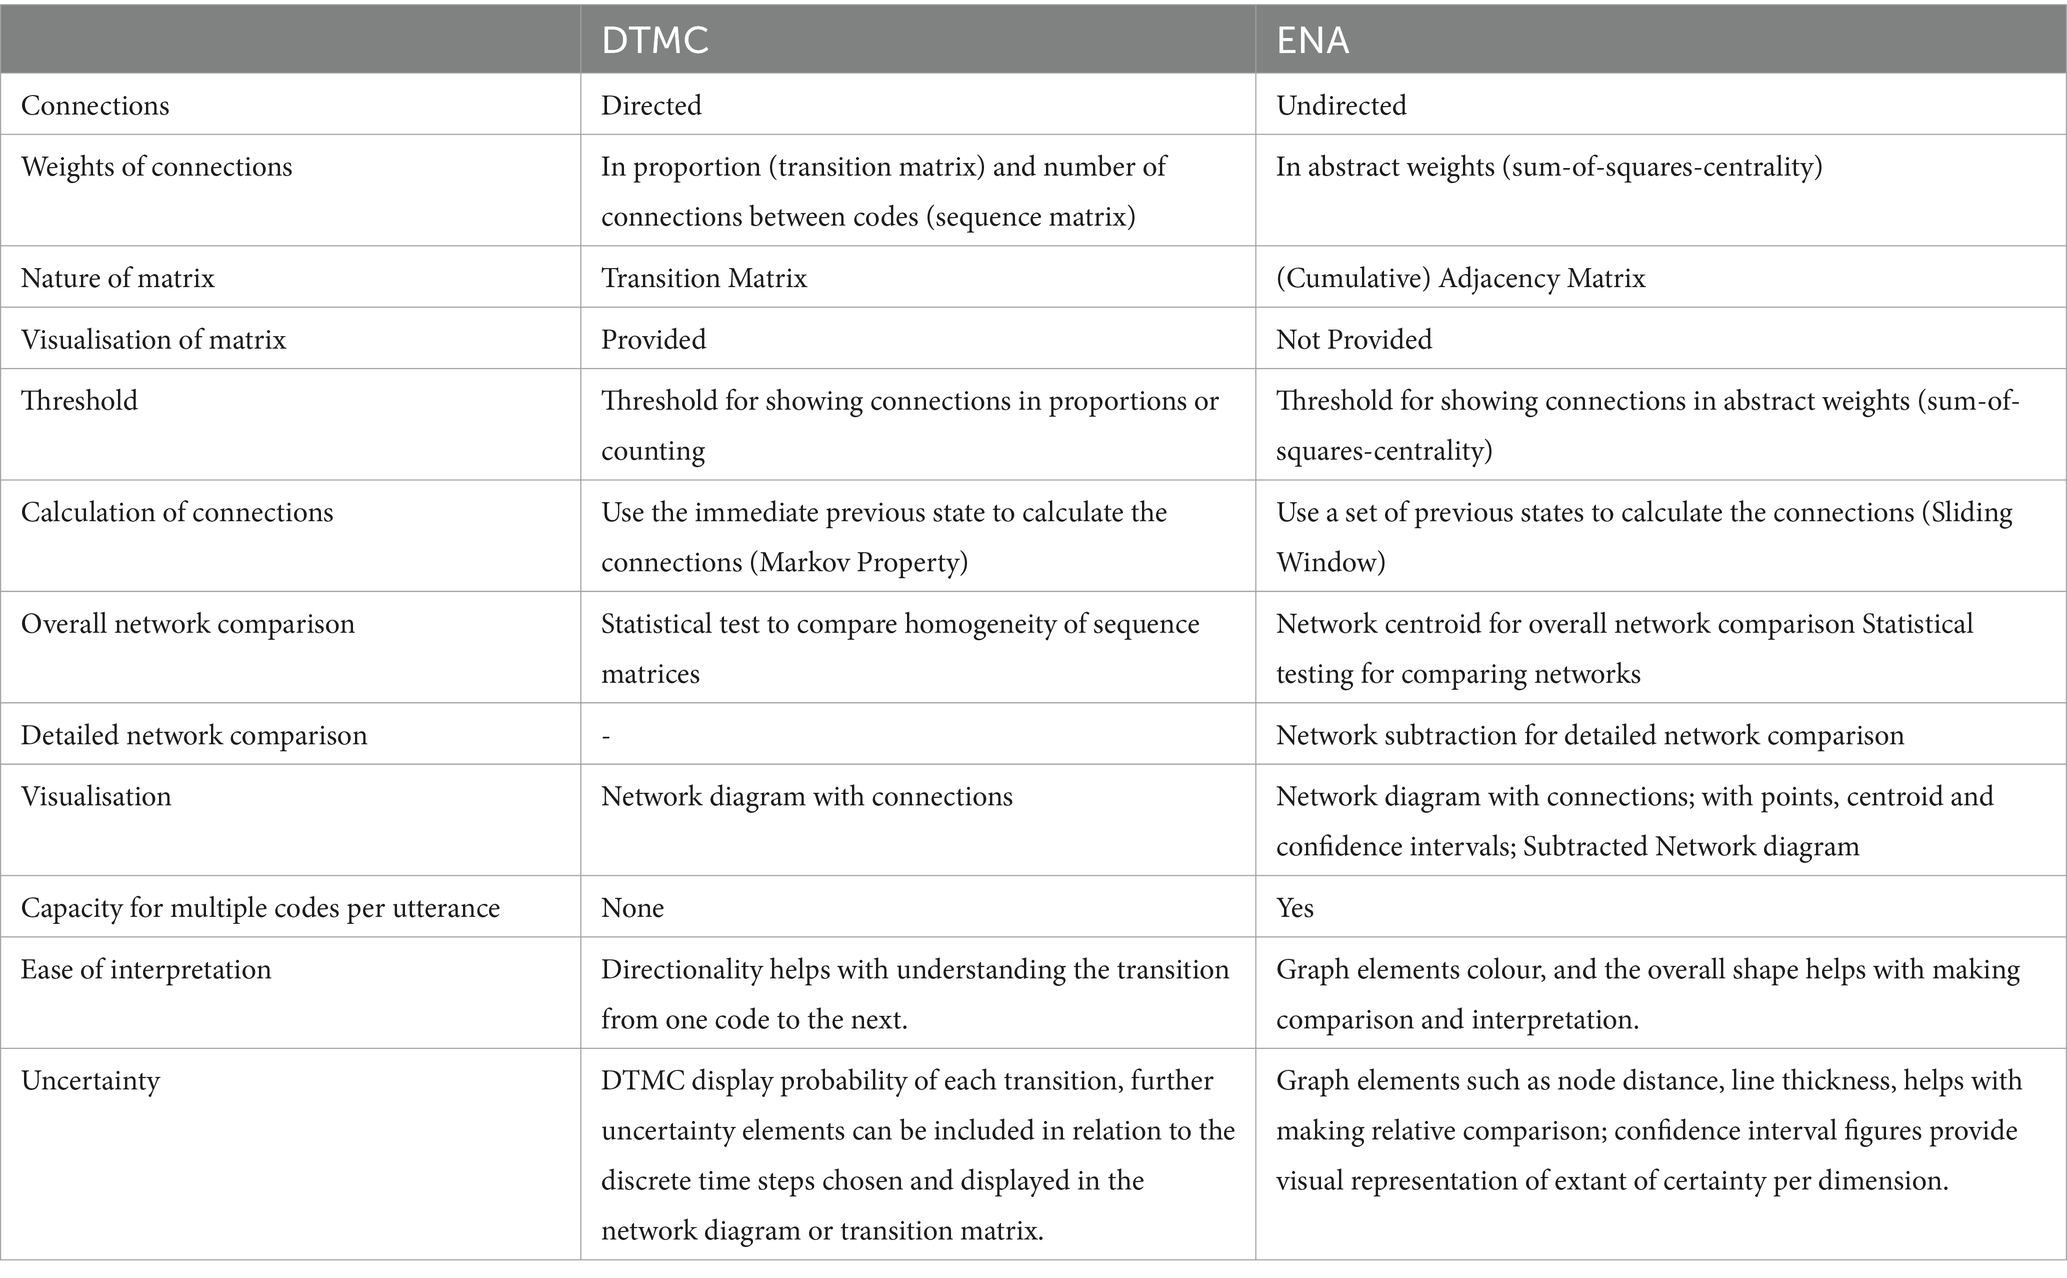
Table 1. Affordances of the DTMC and ENA approaches.
Some of the affordances highlighted in Table 1 are intrinsic to the specific method of analysis (e.g., the nature of the matrices), while others depend on the software package used to conduct the analysis (e.g., the possibility of visualising the matrices). Other differences illustrated in Table 1 are due to the differences in the theoretical framework that informs each method (e.g., DTMC is based on the Theory of Probability whereas ENA builds on the Theory of Graphs). In what follows, we aim to illustrate these affordances by analysing the same data (discourse of three groups of five high schools engaged in a CSCL task) with both methods to gain some insight into what each method can allow us to conclude about the group dynamics and collaborative learning process.
3 Methods
To compare the representational affordances for analysis and communication, the same coded dataset was analysed using DTMC and ENA. Even though this dataset has been analysed previously (Thompson et al., 2013a, b), this particular analysis has not been published before.
3.1 Coding
As students engaged in an educational design task, we used the Activity Centred Analysis and Design (ACAD) framework to code the transcript (Goodyear et al., 2014). The ACAD framework describes three design elements that can be considered in the process of design for learning: the epistemic (knowledge creation processes, sometimes referred to as tasks), the social (the roles and rules for individuals in a learning situation), and the set (the tools in the digital and physical learning environment). Once the design is enacted, the co-configuration and co-creation of learning occurs as learners and instructors implement the design. In this case, we were interested in learners’ discourse in the three groups as it related to the task (epistemic), the social (interactions and roles), and the tools (the physical and digital learning environment) differentiated between planning and action. The discourse was also coded for ‘off-task’ discussion. The student discourse codes related to the elements of the framework (plan-epistemic, epistemic, plan-social, social, plan-tools, tools, and off-task). A researcher expert in learning sciences coded the data manually.
3.2 Data analysis
In the analysis, co-occurrences indicate the connections among speech acts that serve to distribute the thoughts and actions of the group. To implement each of the methods, the DTMC and ENA, we used two packages from the R Project Software (R Core Team, 2018), the markovchain (Spedicato, 2017) and rENA (Marquart et al., 2018), respectively. We used the igraph package (Csardi and Nepusz, 2006) to plot the DTMC diagram and the ggplot2 package (Wickham, 2016) for the descriptive plot.
A first-order DTMC was applied, where the codes represented the states and the rows in the dataset, corresponding to an utterance from a group member, represented the time. When plotting the transition matrix, to only show connections that seemed to be sizeable, we chose a minimum of 25 connections or 20% of all connections. If both conditions were satisfied the connections were represented by a solid line. A dashed line was used if only one condition was satisfied. To compare networks, we tested if the transition matrices of the groups come from the same unknown chain. This method was inspired by Kullback et al. (1962) and its test statistics follow a chi-squared law. Here, we used the function verifyHomogeneity from the markovchain package.
For the ENA analysis, we coded the data in the ENA format, where each row in the dataset corresponded to an utterance from a group member and each column corresponded to a code (epistemic, plan-epistemic, tool, plan-tool, social, plan-social), to which was attributed a binary code (1 if the code was present, 0 otherwise). The size of the window considered here was four turns of talk, that is, a connection was considered if the code was up to four utterances distant from the considered utterance. For plotting, we adopted the default threshold. We obtained the mean locations of each group with confidence intervals (as well as independent samples t-tests). Because the graphs of the network of each team are coordinated in the projected metric space (Marquart et al., 2018), ENA was then used to create mean network graphs for each group by computing the average value for each edge weight. Then, to see the differences in the relative strengths of connections between each pair of networks, ENA was used to obtain difference graphs that subtract the edge weights of one network from another, indicating which connections are stronger in each network.
4 Results
4.1 Coding summary
The Computer group had 723 utterances, the iPad group had 470, and the IWB group had 525. Every utterance was coded as “epistemic,” “plan-epistemic,” “tools,” “plan-tools,” “social,” “plan-social,” and “off task.” The following are examples of utterances coded with each of these elements:
• Epistemic: “And we were thinking you could put that into a virtual world”
• Plan-Epistemic: “Did you have any other ideas that you can include?”
• Tools: “No, that was CAPS lock I think.”
• Plan-Tools: “Can you copy this down? Are you erasing that?”
• Social: “That’s so cool.”
• Plan-Social: “Who wants to go next?”
• Off Task: “I just really want to eat, I’m so hungry”
The percentage of utterances coded by each element also varied (Figure 1), but all groups tended to focus more on epistemic discussion (around 40% of the utterances). Discussion about tools was the second most frequent (Computer: 19%, iPad: 19%, IWB: 20%), only slightly less frequent than social for the Computer group (22%). The Computer group had double the number of utterances coded for social discussion when compared with the iPad (10%) and IWB (12%) groups, but had the least number of utterances coded as off-task discussion (Computer: 2%, iPad: 12%, IWB: 6%). Overall, across all groups, the least number of utterances were coded as planning (ranging from 2 to 11%), regarding epistemic, tools or social.
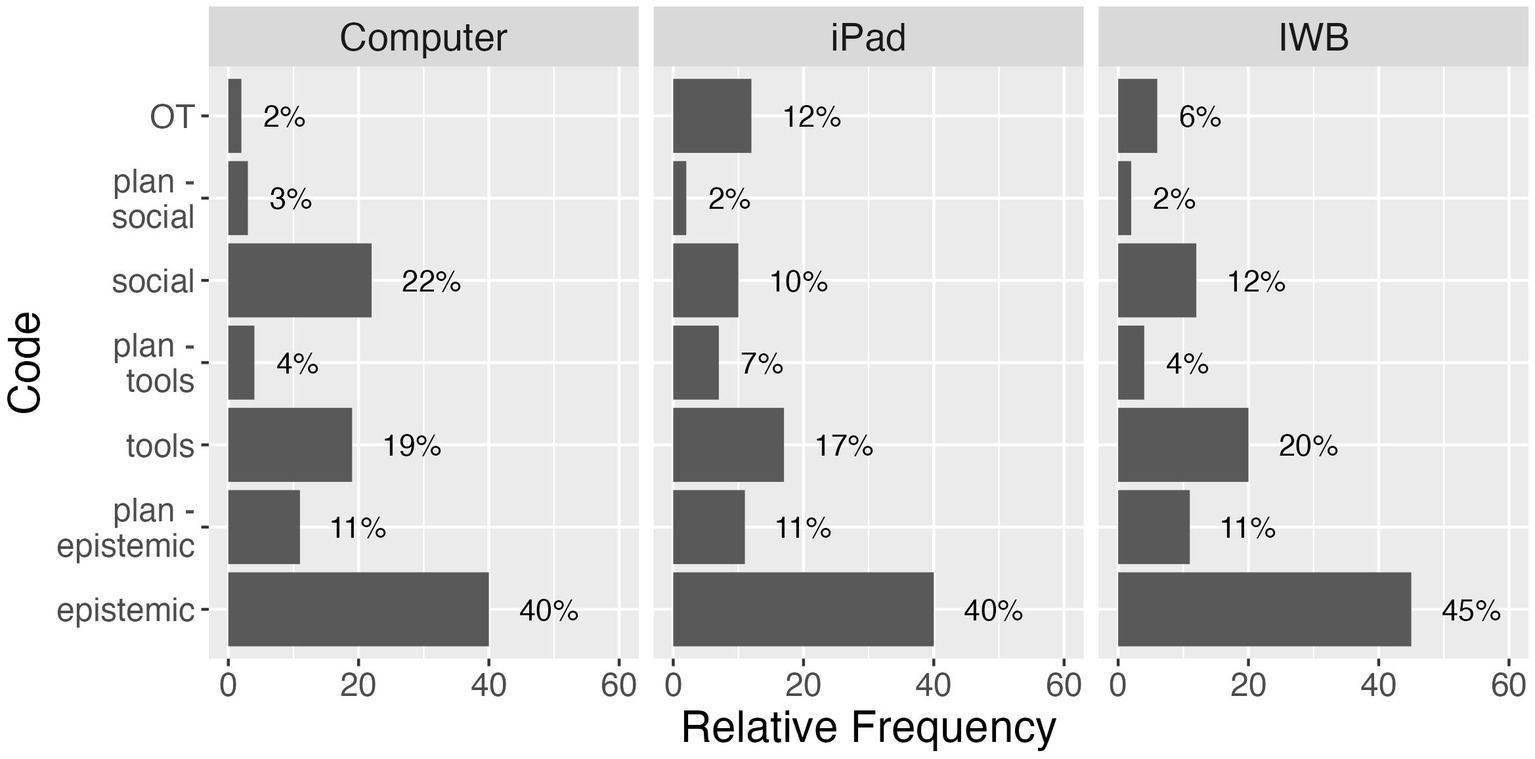
Figure 1. Relative frequency (x-axis) of the ACAD codes (y-axis) for all three groups.
4.2 Discrete-time Markov chains vs. epistemic network analysis
4.2.1 Network morphology and interpretation
Figure 2 shows the DTMC and ENA diagrams of the Computer (red), iPad (blue) and IWB (green) groups. In the DTMC (Figure 2, left), each box represents a code, and the arrows represent the direction of the connections. A solid line represents that a minimum of 25 connections and 20% of all connections were satisfied, while a dashed line represents that only one of these conditions were satisfied. The number of transitions and the percentage that this represents are next to the arrow. Note that although some connections reach the threshold of 20%, the number of connections can be as small as two, as it is relative to all connections made by the particular code.
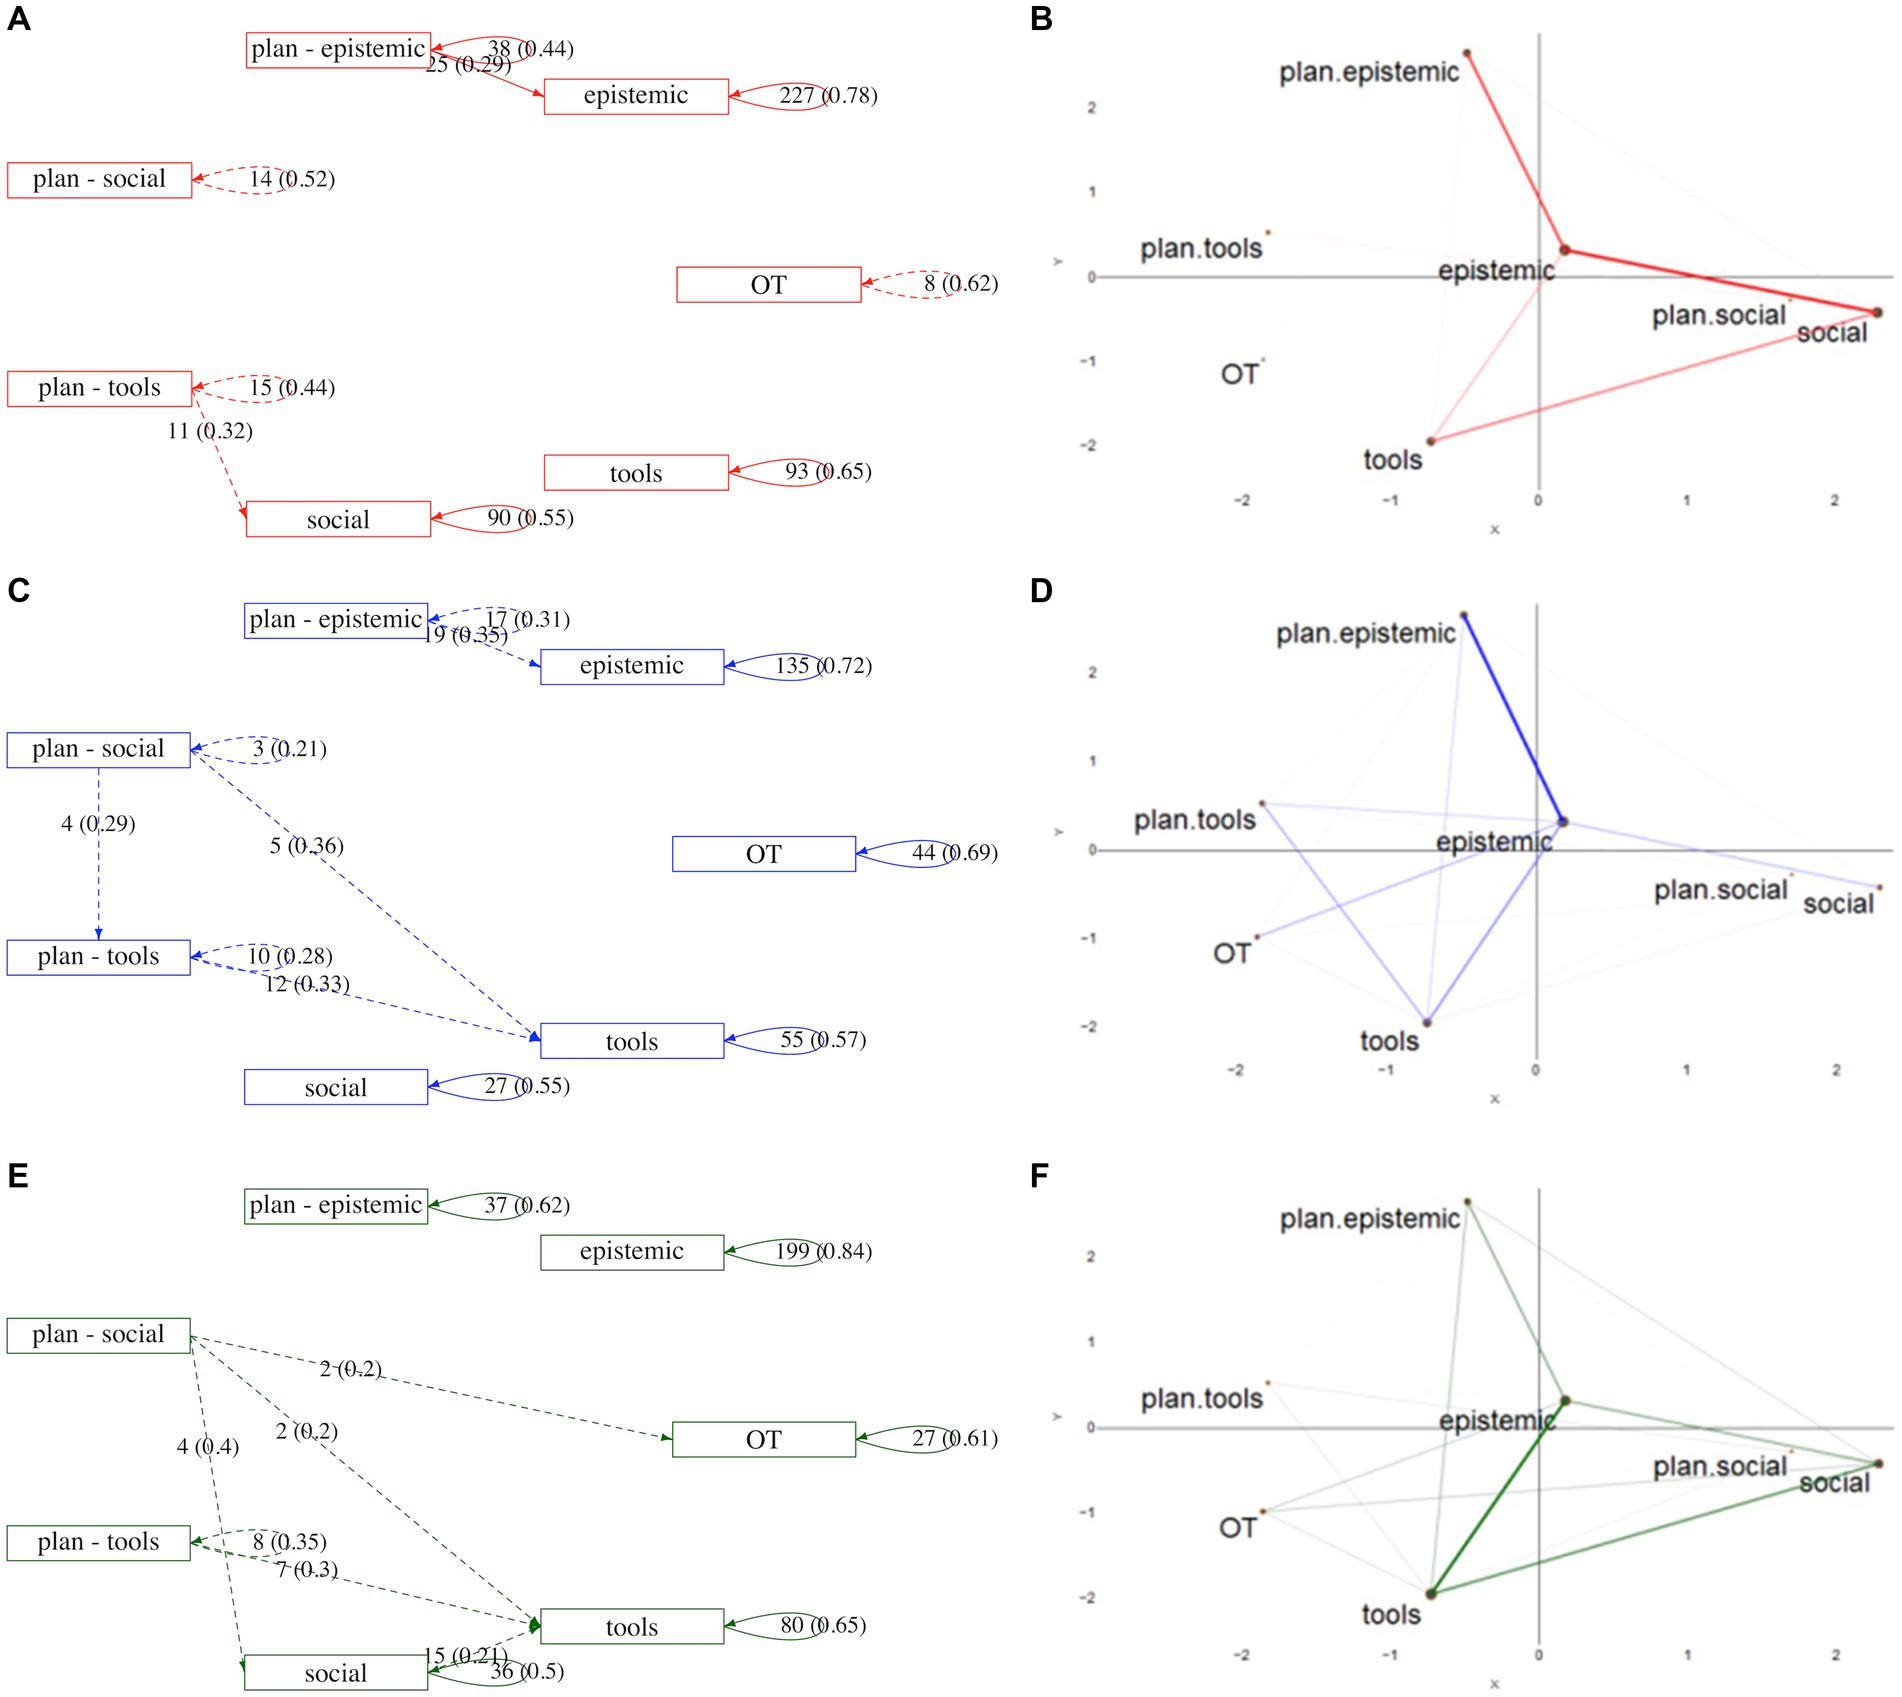
Figure 2. DTMC (left) and ENA (right) diagrams for each group: Computer (Top, Red), iPad (Middle, Blue) and IWB (Bottom, Green). In the DTMC diagrams (A,C,E) the solid lines mean that both conditions (at least 20% of the connections and at least 25 connection) were satisfied, while the dashed lines mean that only one of these conditions were satisfied. In the ENA diagrams, the linewidth represents the strength of the connections between codes (B,D,F).
In all groups, most connections were within a particular code, with limited transitions between codes (Figure 2, left). Once students began discussing an element of the design of their learning resource, they continued talking about that. For the Computer group (Figure 2A), most inter-coding connections were between plan-epistemic and epistemic, and plan-tools and social. Similarly, the iPad group (Figure 2C) also had two main sets of code connections, one between plan-epistemic and epistemic and another between plan-social, plan-tools and tools. The discourse coded as Off-Task (OT) was not highly connected with any other code in these two groups. In the IWB group (Figure 2E), OT connected with plan-social. Other connections identified in the discourse by the IWB group were mainly between plan-social, tools and social, and between plan-tools and tools.
In the ENA (Figure 2, right column), the width of the lines represents the strength of the connections. Therefore, the thickest lines are those connections most influencing the position of the centroid. By analysing the networks, the first quadrant is only epistemic, the second is planning (epistemic and tools), the third is mainly tools, and the fourth is social. By connecting this information with that in the DTMC diagrams (Figure 2, left), we can conclude that there were more connections in the discourses within the epistemic code for the Computer Group and some discourse coded as social, the iPad Group engaged in more continuous planning and the IWB group more discourse coded for tools, epistemic and social.
Analysing each network in more detail, it is important to note that the discourse coded as epistemic and plan epistemic as well as epistemic and social were more strongly connected (thicker line) than other connections between coded discourse in the Computer Group (Figure 2B). There were weaker connections between discourse coded as epistemic and tools, and also social and tools. The iPad Group ENA diagram (Figure 2D) shows the strongest connections between epistemic and plan-epistemic, and some weaker connections between epistemic and plan-tools, epistemic and off-task, epistemic and tools and epistemic and social, as well as plan-tools and tools. The IWB ENA diagram (Figure 2F) shows that most connections made in the discourse in this group were between epistemic and tools and also some between those codes and social. There were also some weaker connections between these three codes and plan-epistemic. Most of the weight of this network structure is between the third and fourth quadrants.
An instructor examining the diagrams for each group in Figure 2, above, could interpret them as follows. The DTMC diagram for the Computer group (A) shows that this group stays discussing a particular topic once it starts and is very rarely distracted, but they also did not revisit topics after they have moved on. They use the tools (e.g., keyboard and mouse) to plan the roles of the people in the group, but neither of these are connected to their knowledge creation discussion. The ENA diagram (B) shows that discussion that related to planning for the task, doing the task and the social roles were all connected, with weak links to the discussion of the tools. An instructor may intervene to help students better connect a considered approach to how to organise themselves and the technology to doing the task, but given how little off task discussion was occurring, and that it appears unrelated to any other code (and so probably incidental), they may choose not to intervene. The DMTC diagram for the iPad group (C) indicates that this group too stayed on topic once discussing it with little revisiting once they had moved on. there were a larger number of off task utterances that seemed to occur in a block. They used the tool use to plan, particularly in relation to roles and rules for the group to work together, but very little discussion of social roles and rules in connection to knowledge creation or during tool use. The ENA (D) showed that for this group, knowledge creation was central in relation to social roles and rules and also the use of technology. The off-task discussions seemed to be in relation to the epistemic code. An instructor could have intervened to reduce the off task discourse, and to help provide better connections between planning for how to approach the collaboration and the enactment of that collaborative activity. The DTMC diagram for the IWB (E) showed that this group was able to engage with ideas and knowledge creation in a focused way and connected their use of tools with their roles in the group, with planning directly connected to their discourse. The ENA (F) diagram shows a network with many connections, including strong connections between the use of tools in the creation of knowledge and social roles and rules. Off-task discourse was connected to all aspects of their conversation. An instructor could decide to not intervene when viewing these diagrams depending on other markers of progress through the task. It appears that planning is connected to action and that the group is discussing roles, technology and ideas in a connected way.
4.2.2 Network morphology comparison
There is no standard way of visually comparing the DTMC networks of the different groups. Here, we tested if they came from the same unknown chain. The results indicate that all groups have non-homogeneous chains, i.e., they all come from different unknown chains: Computer versus iPad group , p-value ; Computer versus IWB: , p-value= and iPad versus IWB: , p-value= .
For the ENA, we can visually compare the difference in the strength of each connection (Figure 3), that is, it compares the mean network graphs. When comparing the networks from the Computer with the iPad group (A), the connections between social and tools, and social and epistemic are stronger in the Computer group than in the iPad group. The iPad group had stronger connections between plan-tools and tools and plan-tools and epistemic, and OT and epistemic and OT and tools. In summary, the Computer group had more connections towards quadrants 1 and 4, while the iPad group had more connections in quadrants 2 and 3. They had similar connections with plan-epistemic (subtraction equals or very close to zero).
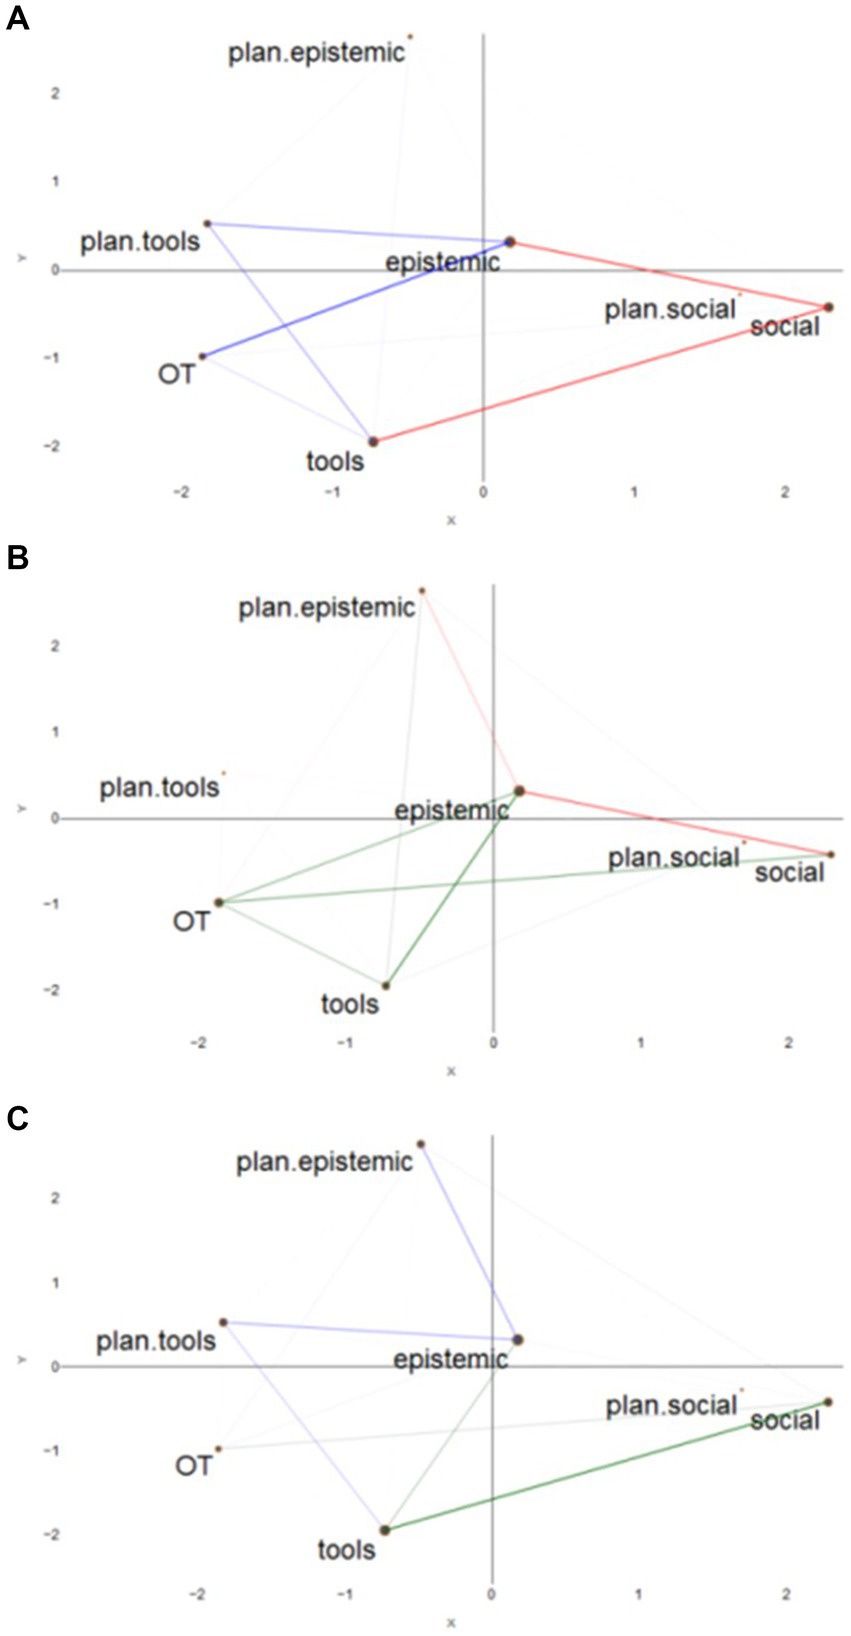
Figure 3. Pairwise comparison of networks: Computer (Red) vs. iPad (Blue) (A), Computer (Red) vs. IWB (Green) (B) and iPad (Blue) vs. IWB (Green) (C).
When comparing the Computer with the IWB group (B), the Computer group has stronger connections between epistemic and social and epistemic and plan-epistemic. The IWB group had stronger connections between OT and epistemic, tools and social and between epistemic and tools and plan-epistemic and tools. In general, the Computer Group had stronger epistemic and social connections (in quadrants 1 and 4) while the IWB had stronger tools and OT connections (quadrant 3). Finally, comparing the iPad with the IWB group (C), the iPad group has stronger connections between epistemic and plan-epistemic and plan-tools, and plan-tools and tools. The IWB group demonstrated stronger connections between tools and epistemic and tools and social, as well as OT and social. In summary, the iPad group had stronger epistemic and tools connections, with a focus on planning, while the IWB group had stronger tools and social connections, with some epistemic connections but also OT.
The centroids (mean and confidence intervals) of each group’s network reflect the weighted structure of connections. In Figure 4, the means are represented by the corresponding squares, and the boxes around each mean indicate the 95% confidence interval for each dimension.
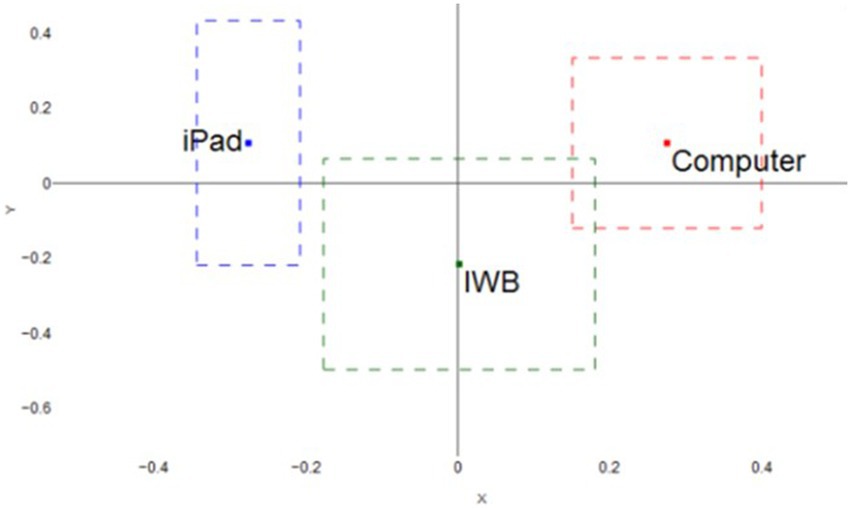
Figure 4. Mean and Confidence Intervals of each group network: Computer (Red, Right), iPad (Blue, Left) and IWB (Green, Middle).
As can be seen in Figure 4, the networks of each group are distinct from each other. The network of the Computer Group was heavily weighted in the first quadrant but with the confidence interval crossing to the fourth quadrant. For the iPad group network, the mean is confidently in the second quadrant while the confidence interval of the IWB group crosses the third and fourth quadrants. Note that the confidence intervals are relatively narrow, revealing limited uncertainty in the estimation of the mean of each network.
The mean of the centroids of the three groups’ networks were compared via independent samples t-tests and Cohen’s d coefficients: Computer Group ( , ), iPad ( , ) and IWB ( , ). The Computer group network centroid was very distinct from the iPad (Table 2, Row 1). Although there appears to be a small overlap between the 95%CI of the mean of the Computer and the IWB groups (Figure 4), their centroids are significantly different (Table 2, Row 2).This difference between the means was expected since the Computer group in which the network has a positive mean. The iPad and the IWB groups also showed a statistically significant difference between their network means (Table 2, Row 3).
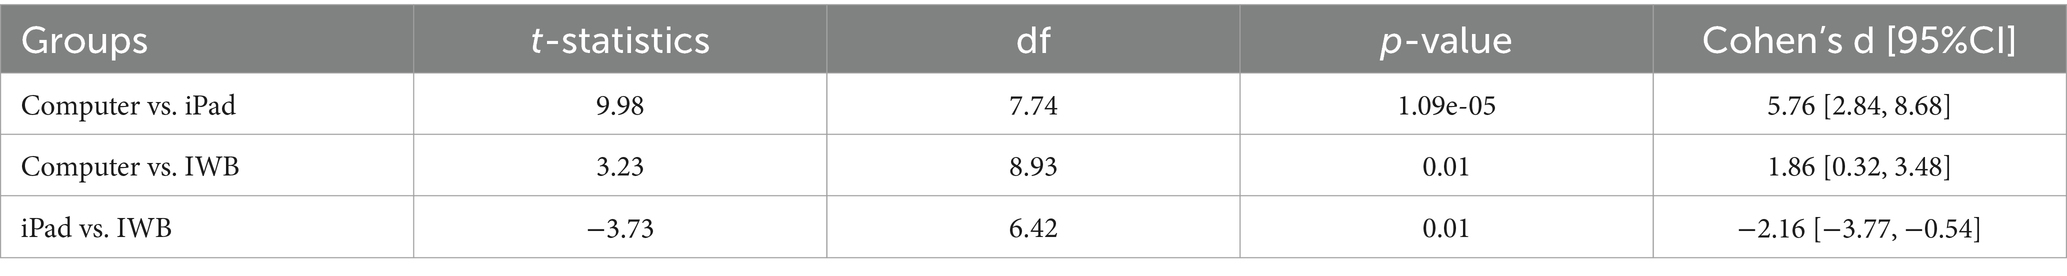
Table 2. Statistical comparison of the ENA diagrams of the computer, iPad and IWB groups.
5 Discussion
After conducting the analysis, we can now discuss the strengths and limitations of each method, based on the affordances illustrated previously in Table 1. We particularly focus on the types of connections, the unit of comparison, the consideration of context, and the potential for use by practitioners to close the loop for actionable learning analytics (Alhadad, 2018; Zacks and Franconeri, 2020; Franconeri et al., 2021).
The unit adopted by the two approaches for reporting and comparison is different. The DTMC approach uses probabilities as “units,” while ENA uses weights. If Figure 2 (left column) is examined, then the measures of probability and counts can be used to make comparisons between transitions in the groups (e.g., the probability that epistemic followed plan-epistemic was 35% in the iPad group, corresponding to 19 utterances, and 29% in the Computer group, corresponding to 25 utterances). While this transition accounted for a larger proportion of transitions in the iPad group, it occurred fewer times. ENA uses visual features to compare networks and provides test statistics to support this comparison. Figure 2 (right column) shows that there was a strong connection between those two nodes in both groups and Figure 3 demonstrates that there was a minor difference there. The reason for the difference is the use of the Transition Matrix in the DTMC approach, informed by the Theory of Probability, while the Adjacency Matrix used in ENA comes from Graph Theory. They both concern the connections between codes (states), but the former uses probability or counts, while the latter is binary. The Cumulative Adjacency Matrix is the sum of all Adjacency Matrices, so it will be made of integers (count). It is possible to explore the Transition Matrix generated as part of the DTMC approach. However, a (Cumulative) Adjacency Matrix is not given as an output by the rENA package.
DTMC allows for the representation of directionality in the transitions between codes. By having a directed network diagram, it is therefore possible to identify the “direction” of the conversation. Even though the standard ENA analysis presented here does not take into account the direction of the connections, a directed ENA (dENA; Fogel et al., 2021) and an Ordered Network Analysis (ONA, Tan et al., 2022) have been recently proposed. In the directed models the connections between different codes is highlighted as well as the connections between the same codes. This shows how much of the discussion was engaged in the same code. For example, for the Computer group the transitions with the highest probability were within each code. In other words, for instance, an utterance coded as “epistemic” was most followed by another utterance coded as “epistemic.” This could only be clearly seen in the DTMC diagram (Figure 2, left top). If the direction is not important in the analysis, then transforming the Markov Chain to an undirected chain is possible and some additional connections may become significant once combined. However, that would be a post hoc analysis. Detecting connections between the same codes is more challenging using ENA as each is represented by the size of the nodes of the network. In the ENA diagrams the information about within-code transitions are less obvious, being very difficult to compare the sizes of the vertices (Figure 2).
Context is important when considering any analysis of learning. While the DTMC approach only requires the current state (or code) to predict an unknown following state, because the ENA uses the Sliding Window method, it allows the consideration of the “context” in which some statement (use of coding) was made. The ENA can be conducted considering only the previous state, as in the DTMC. A higher-order Markov chain could be fitted to consider a broader type of “context,” than only the previous state. That would allow the consideration of a sequence of previous codes, and it is available as part of the markovchain package using the function fitHigherOrder. Although the mathematical interpretation of an ENA is not as intuitive as the DTMC, its graphical representation is developed in a more practitioner-friendly fashion, as it uses graphical features, such as line thickness and distances, to convey meaning instead of relying on numbers. By providing multiple representations of the shape of a group’s network, thicker or thinner lines, or different colours, the representation encourages the user to make comparisons, thereby supporting the reader’s/ researcher’s comprehension of data for meaning. The representation encourages the user to create a language that gives meaning to the graphs, identifying the differences in connections in the groups by their location in different quadrants (e.g., Figure 3) or discussing comparisons between the location of networks in quadrants (e.g., Figure 4). ENA also provides predefined ways of comparing networks, considering the centroids or subtracted networks, and some test statistics, such as a t-test and Cohen’s d. The use of Cohen’s d is advisable, as it focuses on effect sizes and not on p-values. In this paper, both methods were used to analyse the current data and not to make predictions about future groups. While this is possible using DTMC, in this context, we expect that each group will work differently depending on several contextual factors. There is only one package in R to fit an ENA (rENA), and if the modeller is not comfortable with coding, there is a website with a user-friendly application to fit an ENA.1 There are other packages to fit a DTMC, such as DTMCPack (Wilson, 2022), however, the markovchain offers more flexibility in handling as well as providing methods suited to perform statistical and probabilistic analysis.
Finally, even though only ENA has come formally from the field of quantitative ethnography, both of these methods can contribute to quantitative ethnography, as, by applying them, researchers can gain a deeper understanding of the social dynamics, knowledge structures, and behavioural patterns, enriching the insights provided by traditional qualitative ethnographic methods.
6 Conclusion
This paper illustrates the applications of DTMC and ENA to analyse discourse data to better understand two considerations in collaboration analytics and use visualisations for actionable learning analytics to close the loop. From the results presented here, it can be concluded that both methods are relevant when evaluating the code connections made by each group. The affordances of the two approaches selected are connected to the different assumptions of the statistical theory that informs them. However, the representations themselves as well as the considerations of change over time (directed analysis and sliding windows), how uncertainty is represented, and the inclusion of the context of learning further encourage particular practices concerning the interpretation and potential for educational decision-making. While DTMC, to a certain extent, provides the user with greater flexibility, ENA encourages network comparisons. ENA, with the integration of a sliding window, better accounts for the consideration of context, and better accounts for data generated by several aspects of the learning situation. Ultimately, because the primary goal of modelling is to conduct inference to the available data to answer a question, having multiple tools available to the modeller allows them to build a more complete understanding of the collaborative learning situation and therefore choose the method that better provides insight into their data for communication to close the loop.
Data availability statement
The datasets presented in this article are not readily available because permission to share data was not granted. Requests to access the datasets should be directed to KT, a2F0ZS5qLnRob21wc29uQHF1dC5lZHUuYXU=.
Ethics statement
The studies involving humans were approved by The University of Sydney Human Research Ethics Committee. The studies were conducted in accordance with the local legislation and institutional requirements. Written informed consent for participation in this study was provided by the participants’ legal guardians/next of kin. Data analysed for inclusion in this paper were conducted under human ethics protocol number 2012/2794, entitled “Learning, technology and design: architectures for productive networked learning - Using complementary methods of analysis.”
Author contributions
DV: Conceptualization, Data curation, Formal analysis, Investigation, Methodology, Software, Validation, Visualization, Writing – original draft, Writing – review & editing. KT: Conceptualization, Data curation, Investigation, Methodology, Project administration, Resources, Supervision, Validation, Writing – original draft, Writing – review & editing. SA: Conceptualization, Methodology, Writing – original draft, Writing – review & editing. MJ: Writing – review & editing.
Funding
The author(s) declare that financial support was received for the research, authorship, and/or publication of this article. Part of this work was funded by the Australian Research Council (Laureate Fellowship Grant FL100100203).
Conflict of interest
The authors declare that the research was conducted in the absence of any commercial or financial relationships that could be construed as a potential conflict of interest.
Publisher's note
All claims expressed in this article are solely those of the authors and do not necessarily represent those of their affiliated organizations, or those of the publisher, the editors and the reviewers. Any product that may be evaluated in this article, or claim that may be made by its manufacturer, is not guaranteed or endorsed by the publisher.
Footnotes
References
Abraham, R. (2017). “Guidelines for architecture models as boundary objects,” in Architectural coordination of enterprise transformation. The enterprise engineering series. eds. H. Proper, R. Winter, S. Aier, and S. de Kinderen (Cham: Springer).
Akkerman, S. F., and Bakker, A. (2011). Boundary crossing and boundary objects. Rev. Educ. Res. 81, 132–169. doi: 10.3102/0034654311404435
Alhadad, S. S. J. (2018). Visualizing data to support judgement, inference, and decision making in learning analytics: insights from cognitive psychology and visualization science. J. Learn. Analytics 5, 60–85. doi: 10.18608/jla.2018.52.5
An, S., and Zhang, S. (2024). Effects of ability grouping on students’ collaborative problem solving patterns: evidence from lag sequence analysis and epistemic network analysis. Think. Skills Creat. 51:101453. doi: 10.1016/j.tsc.2023.101453
Cress, U., and Hesse, F. W. (2013). “Quantitative methods for studying small groups” in The international handbook of collaborative learning. eds. C. Hmelo-Silver, A. Chinn, C. K. K. Chan, and A. O’Donnell (New York: Routledge), 93–111.
Csardi, G., and Nepusz, T. (2006). The igraph software package for complex network research. InterJournal, Complex Systems 1695, 1–9. doi: 10.5281/zenodo.3630268
Dowell, N., Poque, O., and Brooks, C. (2018). “Applying group communication analysis to educational Discourse Interactions at Scale,” in Rethinking learning in the digital age: Making the learning sciences count, 13th International Conference of the Learning Sciences (ICLS) 2018, Volume 3. eds. J. Kay and R. Luckin (London, UK: International Society of the Learning Sciences).
Dyke, G., Kumar, R., Ai, H., and Rosé, C. P. (2012). “Challenging assumptions: Using sliding window visualizations to reveal time-based irregularities in CSCL processes,” in The future of learning: Proceedings of the 10th international conference of the learning sciences (ICLS) 2012. eds. J. van Aalst, K. Thompson, M. J. Jacobson, and P. Reimann (Sydney: International Society of the Learning Sciences), 1, 363–370.
Fogel, A., Swiecki, Z., Marquart, C., Cai, Z., Wang, Y., Brohinsky, J., et al. (2021). “Directed epistemic network analysis,” in Advances in quantitative ethnography. international conference on quantitative ethnography 2021. Communications in computer and information science. eds. A. R. Ruis and S. B. Lee (Cham: Springer), 1312, 122–136.
Franconeri, S. L., Padilla, L. M., Shah, P., Zacks, J. M., and Hullman, J. (2021). The science of visual data communication: what works. Psychol. Sci. Public Interest. 22, 110–161. doi: 10.1177/15291006211051956
Gagniuc, P. A. (2017). Markov chains: From theory to implementation and experimentation. USA, NJ: John Wiley & Sons, 1–235.
Gibson, J. J. (2014). The Ecological approach to visual perception: Classic edition (1st ed.). NY: Psychology Press.
Goodyear, P., Jones, C., and Thompson, K. (2014). “Computer-supported collaborative learning: instructional approaches, group processes and educational designs,” in Handbook of research on educational communications and technology. eds. J. Spector, M. Merrill, J. Elen, and M. Bishop (New York, NY: Springer).
Hennessy, C. A., and Whited, T. M. (2007). How costly is external financing? Evidence from a structural estimation. J. Financ. 62, 1705–1745. doi: 10.1111/j.1540-6261.2007.01255.x
Kapur, M. (2011). Temporality matters: advancing a method for analyzing problem-solving processes in a computer-supported collaborative environment. Int. J. Comput.-Support. Collab. Learn. 6, 39–56. doi: 10.1007/s11412-011-9109-9
Kelly, N., Thompson, K., and Yeoman, P. (2015). Theory-led design of instruments and representations in learning analytics: Developing a novel tool for orchestration of online collaborative learning. J. Learn. Anal. 2, 14–43. doi: 10.18608/jla.2015.22.3
Kullback, S., Kupperman, M., and Ku, H. H. (1962). Tests for contingency tables and Marltov chains. Technometrics 4, 573–608. doi: 10.1080/00401706.1962.10490041
Lee, C. P. (2005). “Between chaos and routine: Boundary negotiating artifacts in collaboration,” in ECSCW 2005: proceedings of the ninth european conference on computer-supported cooperative work, Paris, France. eds. H. Gellersen, K. Schmidt, M. Beaudouin-Lafon, and W. Mackay (Dordrecht: Springer Netherlands), 387–406.
Malmberg, J., Järvelä, S., Järvenoja, H., and Panadero, E. (2015). Promoting socially shared regulation of learning in CSCL: Progress of socially shared regulation among high- and low-performing groups. Comput. Hum. Behav. 52, 562–572. doi: 10.1016/j.chb.2015.03.082
Marquart, C. L., Swiecki, Z., Collier, W., Eagan, B., Woodward, R., and Shaffer, D. W. (2018). rENA: epistemic network analysis. R package version 0.1.5. Available at: https://CRAN.R-project.org/package=rENA
Martinez-Maldonado, R., Dimitriadis, Y., Martinez-Monés, A., Kay, J., and Yacef, K. (2013). Capturing and analyzing verbal and physical collaborative learning interactions at an enriched interactive tabletop. Int. J. Comput.-Support. Collab. Learn. 8, 455–485. doi: 10.1007/s11412-013-9184-1
Martinez-Maldonado, R., Goodyear, P., Kay, J., Thompson, K., and Carvalho, L. (2016). “An actionable approach to understand group experience in complex, multi-surface spaces,” in Proceedings of the 2016 CHI conference on human factors in computing systems. New York, NY, USA: Association for Computing Machinery, 2062–2074.
Moritz, D., Padilla, L. M., Nguyen, F., and Franconeri, S. L. (2023). Average estimates in line graphs are biased toward areas of higher variability. IEEE Trans. Vis. Comput. Graph. 30, 1–10. doi: 10.1109/TVCG.2023.3326589
Oner, D. (2020). A virtual internship for developing technological pedagogical content knowledge. Australas. J. Educ. Technol. 36, 27–42. doi: 10.14742/ajet.5192
Pangrazio, L., and Sefton-Green, J. (2020). The social utility of ‘data literacy’. Learn. Media Technol. 45, 208–220. doi: 10.1080/17439884.2020.1707223
Raffaghelli, J. E., and Stewart, B. (2020). Centering complexity in ‘educators’ data literacy’ to support future practices in faculty development: a systematic review of the literature. Teach. High. Educ. 25, 435–455. doi: 10.1080/13562517.2019.1696301
R Core Team (2018). R: A language and environment for statistical computing. Vienna, Austria: R Foundation for Statistical Computing. Available at: https://www.R-project.org/
Reimann, P. (2009). Time is precious: variable- and event-centred approaches to process analysis in CSCL research. Int. J. Comput.-Support. Collab. Learn. 4, 239–257. doi: 10.1007/s11412-009-9070-z
Reimann, P., Frerejean, J., and Thompson, K. (2009). Using process mining to identify models of group decision making in chat data, in Proceedings of the 9th international conference on computer supported collaborative learning: CSCL2009: CSCL practices. eds. C. O’Malley, D. Suthers, P. Reimann, and A. Dimitracopoulou (Rhodes, Greece: University of the Aegean), 98–107.
Riel, J., Lawless, K. A., and Brown, S. W. (2018). Timing matters: approaches for measuring and visualizing Behaviours of timing and spacing of work in self-paced online teacher professional development courses. J. Learn. Analytics 5:Article 1. doi: 10.18608/jla.2018.51.3
Ruis, A. R., Siebert-Evenstone, A. L., Pozen, R., Eagan, B., and Shaffer, D. W. (2018). “A method for determining the extent of recent temporal context in analyses of complex, collaborative thinking,” in Rethinking learning in the digital age: Making the learning sciences count, 13th international conference of the learning sciences (ICLS) 2018. eds. J. Kay and R. Luckin, 3, 1625–1626.
Schneider, B., Dowell, N., and Thompson, K. (2021). Collaboration analytics — current state and potential futures. J. Learn. Analytics 8, 1–12. doi: 10.18608/jla.2021.7447
Shaffer, D. W., and Ruis, A. R. (2017). “Epistemic network analysis: A worked example of theory-based learning analytics,” in Handbook of learning analytics. eds. C. Lang, G. Siemens, A. Wise, and D. Grasevic (Upstate, NY: Society for Learning Analytics Research), 175–187.
Siebert-Evenstone, A. L., Irgens, G. A., Collier, W., Swiecki, Z., Ruis, A. R., and Shaffer, D. W. (2017). In search of conversational grain size: modelling semantic structure using moving stanza windows. J Learn Anal. 4, 123–139. doi: 10.18608/jla.2017.43.7
Sonnenberg, C., and Bannert, M. (2018). Using process mining to examine the sustainability of instructional support: how stable are the effects of metacognitive prompting on self-regulatory behavior? Comput. Hum. Behav. 96, 259–272. doi: 10.1016/j.chb.2018.06.003
Spedicato, G. A. (2017). Discrete time Markov chains with R. The R Journal. R package version 9. Available at: https://journal.r-project.org/archive/2017/RJ-2017-036/index.html
Stahl, G., Koschmann, T., and Suthers, D. (2014). “Computer-supported collaborative learning” in The Cambridge handbook of the learning sciences. 2nd ed. ed. R. K. Sawyer (Cambridge: Cambridge University Press), 479–500.
Suthers, D., and Desiato, C. (2012). “Exposing chat features through analysis of uptake between contributions,” in Proceedings of the 45th Hawaii International Conference on System Sciences, Maui, Hawaii USA, 3368–3377.
Tan, Y., Ruis, A. R., Marquart, C., Cai, Z., Knowles, M. A., and Shaffer, D. W. (2022). “Ordered network analysis,” in Advances in quantitative ethnography. international conference on quantitative ethnography 2022. Communications in computer and information science, vol 1785. eds. C. Damşa and A. Barany (Cham: Springer).
Thompson, K., Ashe, D., Carvalho, L., Goodyear, P., Kelly, N., and Parisio, M. (2013a). Processing and visualizing data in complex learning environments. Am. Behav. Sci. 57, 1401–1420. doi: 10.1177/0002764213479368
Thompson, K., Ashe, D., Wardak, D., Yeoman, P., and Parisio, M. (2013b). “Identification of patterns of tool use and sketching practices in a learning by design task,” in To see the world and a grain of sand: Learning across levels of space, time, and scale: CSCL 2013 conference proceedings volume 1 -- full papers & symposia. eds. N. Rummel, M. Kapur, M. Nathan, and S. Puntambekar (Madison, WI: International Society of the Learning Sciences), 478–485.
Thompson, K., Kennedy-Clark, S., Markauskaite, L., and Southavilay, V. (2014). Discovering processes and patterns of learning in collaborative learning environments using multi-modal discourse analysis. Res. Pract. Technol. Enhanc. Learn. 9, 215–240.
Wiley, K., Gerard, L., and Bradford, A. (2018). “Teaching with technology: empowering teachers and promoting equity in science,” in The Oxford handbook of educational psychology. eds. A. O’Donnell, N. C. Barnes, and J. Reeve (online edn, Oxford Academic, 5 Apr. 2018).
Wilson, N . (2022). DTMCPack: Suite of functions related to discrete-time discrete-state Markov chains. R package version 0.1-3. Available at: https://CRAN.R-project.org/package=DTMCPack
Wise, A. F. (2020). Educating data scientists and data literate citizens for a new generation of data. J. Learn. Sci. 29, 165–181. doi: 10.1080/10508406.2019.1705678
Wise, A. F., Rosé, C., and Järvelä, S. E. (2023). Nine elements for robust collaborative learning analytics: a constructive collaborative critique. Intern. J. Comput.-Support. Collab. Learn. 18, 1–9. doi: 10.1007/s11412-023-09389-x
Worsley, M., Anderson, K., Melo, N., and Jang, J. (2021). Designing analytics for collaboration literacy and student empowerment. J. Learn. Anal. 8, 30–48. doi: 10.18608/jla.2021.7242
Yeon, J., Elefteriadou, L., and Lawphongpanich, S. (2008). Travel time estimation on a freeway using discrete time Markov chains. Transp. Res. B Methodol. 42, 325–338. doi: 10.1016/j.trb.2007.08.005
Keywords: visualisation, collaboration analytics, discrete time Markov chains, epistemic network analysis, boundary negotiating objects
Citation: Vasco D, Thompson K, Alhadad S and Juri MZ (2024) Comparing the visual affordances of discrete time Markov chains and epistemic network analysis for analysing discourse connections. Front. Educ. 9:1401996. doi: 10.3389/feduc.2024.1401996
Edited by:
JohnPaul Kennedy, University of South Australia, AustraliaReviewed by:
Simon N. Leonard, University of South Australia, AustraliaEric R. Hamilton, Pepperdine University, United States
Copyright © 2024 Vasco, Thompson, Alhadad and Juri. This is an open-access article distributed under the terms of the Creative Commons Attribution License (CC BY). The use, distribution or reproduction in other forums is permitted, provided the original author(s) and the copyright owner(s) are credited and that the original publication in this journal is cited, in accordance with accepted academic practice. No use, distribution or reproduction is permitted which does not comply with these terms.
*Correspondence: Daniela Vasco, ZC52YXNjb0BncmlmZml0aC5lZHUuYXU=