 Alexandre Chaves Nunes*Josemberg Moura de Andrade
- Laboratory of Evaluation Methods and Techniques, Institute of Psychology, Social and Work Psychology, University of Brasília, Brasilia, Brazil
Introduction: We define cultural capital as a set of assets or resources accumulated over a lifetime through relationships and events in the family environment. We analyze cultural capital under two dimensions: static cultural capital (SCC) and relational cultural capital (RCC). The objective of this study was to verify the effect that cultural capital has on students' academic performance.
Method: The research included the participation of 11,795 students who were classified into four levels of cultural capital, in each of the two dimensions: G1–Critical, G2–Low, G3–Medium, and G4–High. Statistical analyses such as ANOVA, Student's t-test and factorial design showed the impact of cultural capital in the combination of the different groups with the subjects of Portuguese and mathematics.
Results: The results led us to conclude that: (1) cultural capital, in both dimensions, impacts the students' academic performance, both in Portuguese, F(3,11764) = 9.516, with p < 0.001 and η2 = 0.002, F(3,11764) = 42.349, with p < 0.001 and η2 = 0.011, and in mathematics, F(3,11764) = 13,728, with p < 0.001 and η2 = 0.003, and F(3,11764) = 28.138, with p < 0.001 and η2 = 0.007, and; 2. RCC linearly impacts student performance as SCC is increased, F(9,11771) = 1.869, with p = 0.052 and η2 = 0.001.
Conclusion: (1) cultural capital impacts students' academic performance, but most notably in the Portuguese language discipline. (2) The dimensions of cultural capital behave differently and the excess of SCC, without the presence of RCC, impacts the reduction of medium performance. (3) The RCC linearly impacts student performance as the SCC is increased.
1 Introduction
Cultural capital has been the subject of study by many researchers from different areas of knowledge (Jaeger and Karlson, 2018; Mikus et al., 2020; Piotto and Nogueira, 2021; Raudenská and Bašná, 2021). One of the objects of these studies is to know the impact that cultural capital has on students' performance in large-scale evaluative tests (Tramonte and Willms, 2010; Gaddis, 2013; Mikus et al., 2020). This emphasis is justified by the fact that, according to Bourdieu (1998), cultural capital has an explanatory power in student performance almost equal to economic capital.
We define cultural capital as a set of assets or resources accumulated over the course of a lifetime through relationships and events in the family environment.
These assets can be habits built and acquired from the relationship with adults in the home environment (Bandura, 1977; Tan, 2020), or the acquisition of cultural assets, such as school titles, diplomas, knowledge, skills, and competencies, which are acquired throughout the experience and, once somatized, can result in other capitals such as social and economic capital (Bourdieu, 1998).
Cultural capital is conceived of literature in two dimensions: Static Cultural Capital (SCC) and Relational Cultural Capital (RCC). SCC can be understood from all the practical, intentional and intelligent activities that are available to children, even if they are not necessarily the child's own choice. On the other hand, RCC is defined with the communication and culture interactions that take place in the family environment (Tramonte and Willms, 2010). This capital is incorporated throughout the child's experience by listening and observing.
Jaeger and Karlson (2018) argue that the process of transmitting cultural capital can happen from parents to children or through investments and socialization since “much of a child's behavioral repertoire is acquired through identification with the important adults in his live” (Bandura and Huston, 1961, p. 1). This process of modeling children by observing adults in the family environment can be used to reinforce positive personality traits and not stimulate negative traits (Marić et al., 2017; Adriani et al., 2018).
Discovering the effect that cultural capital has on family relationships on student learning will be of great value to educators. Based on this knowledge, guidance may be given to parents and caregivers in order to increase the gain of this capital in family life. In a survey conducted by Raudenská and Bašná (2021), researchers found that part of the construction of a person's cultural capital depends on the environment in which they live (Yu et al., 2022). In another research, carried out by Lee and Bowen (2006), we can observe that the educational involvement of parents is associated with the school performance of their children. The researchers recommend that there be partnerships between the school and families aimed at supporting parents in educational involvement.
Many families are able to perceive that their children's academic performance is related to economic and cultural issues pertinent to the environment they live in, but few are able to associate the relationship between school performance and the family's cultural capital, which is consequently transferred to their children (Yu et al., 2022). The school will hardly be able to interfere in the economic aspects of families, not least because this is a competence of the state. However, the school can create connections with families in order to generate in parents the conception that they are essential in the teaching-learning process. “The view that parents are essential to children's learning is often an implicit assumption in schools. The missing piece is the explicit recognition, particularly in school attitudes and actions, that parents are essential partners” (Christenson, 2004, p. 95).
There are numerous factors that influence student learning. Hattie (2017) presented a list of 150 variables and reported the impact each has on education. To reach this conclusion, the author relied on 800 meta-analyses of 50,000 research articles. This volume of data produced 150,000 effect size analyses, from different surveys that brought together in total more than 240 million students.
In the end, Hattie (2017) classified the variables according to their effect size. Some, he classified as factors that have a high effect size, such as: self-assigned grades/expectations of students with d = 1.44; and Piagetian programs with d = 1.28. Other factors were classified with a medium effect size, such as: domestic environment, with d = 0.52; socioeconomic status with d = 0.52; reduction of disruptive behavior with d = 0.34. And others, with a low effect size, such as: gender with d = 0.12; ethical diversity of students with d = 0.05. The author also presented factors that have negative effects on learning, such as: summer vacation (with d = −0.12) and Retention (with d = −013) (Hattie, 2017).
As seen, many factors had some kind of effect, even if it is considered low. Knowing the effect, and consequently the impact that this factor has on student performance, can be a good guide for school managers and pedagogical staff in decision making. However, although the size of the effect is important, it cannot be the only indicator, since it is necessary to observe the cost or difficulty of implementing a factor in the school environment (Kraft, 2020).
Although the size of the effect is a measure widely used in the research context to measure the magnitude of the difference between two measures (Field, 2020), several researchers have questioned the way the results are interpreted, especially with regard to the educational area (Slavin and Smith, 2009; Cheung and Slavin, 2016; Kraft, 2020; Simpson, 2021). Kraft (2020) argues that the effects may depend on when the results are measured. The researcher says that the effects are usually much greater when the measurement is very close to the period of the intervention performed. And the opposite also happens when searches are carried out over a longer time interval.
In another study, researchers Cheung and Slavin (2016) noticed that research conducted with a smaller sample size tends to have a larger effect size. The researchers justified this fact by arguing that, for the purpose of publication, greater requirements are made regarding the size of the effect, which consequently, almost no studies with small effect size are found in small samples.
Cheung and Slavin (2016) add that the research model is another situation in which the effect size varies. They explain that effects observed from research conducted with standardized tests are smaller than when the tests are not standardized. Another situation that presents differences in effect sizes, which was addressed by the same researchers, is when the interventions carried out in the educational area are made by the researchers (generating a larger effect size) or by the teachers (generating a smaller effect size).
Given the above, the objective of this study is to evaluate the effect that cultural capital has on family interactions on the academic outcome of 5th grade students in a school network present in all five major regions of Brazil. For this, we will adopt the following specific objectives: (a) Measure students' perception of cultural capital and classify them into levels; (b) Compare the performance of students belonging to each level of cultural capital.
2 Method
2.1 Participants
The research had the final participation of 11,795 students of the 5th year of Elementary School from a network of schools with a presence throughout Brazil. Data were collected through a large-scale assessment in order to verify students' performance in the Mathematics and Portuguese Language subjects. This evaluation takes place annually and is an initiative of the school network itself. Accordingly, the sample for this study was obtained by convenience and is not representative of the Brazilian population.
Initially, 18,607 students took the assessment, but only 12,835 students accepted to participate in the research. Of these 12,835 students, 1,040 did not answer all items of the Cultural Capital in Family Interactions instrument, thus being eliminated from the research, leaving 11,795 students. Not all of the 11,795 obtained proficiency in Portuguese and in mathematics due to the fact that some students did not answer the minimum of items stipulated by the educational institution. Thus, 11,787 students had proficiency in Portuguese and 11,776 had proficiency in mathematics. The participating students were allocated to the five geographical macro-regions of Brazil, configured in the following proportions: 41.6% in the Southeast region; 21.6% in the South region, 14.1% in the North region, 13.1% in the Midwest region and 9.6% in the Northeast region.
The participants had the following characteristics: 50.3% were female, 97.4% were aged between 10 and 11 years, 54.7% had studied in the network for at least 4 years, 96.5% said they lived with their mother, 78.8% said they lived with their father, and 76.8% said they lived with their father and mother together, 19.8% said they lived only with their mother, 2.0% said they lived only with their father and 1.5% said they lived neither with their father nor with their mother.
Regarding the parents' education, 46.9% (68.2% of those who knew how to answer) said that the mother had university education (31.1% did not know how to answer) and 39.9% (62.0% of those who knew how to answer) said that the father had university education (35.6% did not know how to answer). Thus, among those who knew how to answer we have the following situation: 51.3% of the students, the father and mother had university education, 28.4% only the father or only the mother had university education, and 20.3% neither the father nor the mother had university education. Asked if they had any religion, 92.6% said they do.
2.2 Instrument
The instrument used for this research was elaborated containing 03 parts: the first part was composed of 46 items of knowledge in Mathematics and Portuguese Language, which the school network did not authorize the disclosure; the second part was composed of 10 sociodemographic items also elaborated by the network that addressed the following variables: sex, age, and time that the student was already studying in the network, religion, if the child lived with the mother, if the child lived with the father, mother's and father's education and on the professional activities of the mother and father; the third and last part was initially composed of 26 items of Cultural Capital in Family Interactions (Nunes and Andrade, 2024), which after going through the process of searching for evidence of validity based on their content and internal structure, had 02 items eliminated, for not having factor loadings higher than 0.4, leaving 24 items. The Kaiser-Meyer-Olkin (KMO) test of 0.88 and the significance of the Bartletts test (p < 0.001) indicated that the data was suitable for the factor analysis technique. These 24 items performed 02 dimensions of cultural capital (RMSEA) of 0.053, TLI 0.935, CFI 0.946, with 11 items referring to Static Cultural Capital (SCC), with Guttman's Lambda-2 of 0.702 and 13 items referring to Relational Cultural Capital (RCC), with Guttman's Lambda-2 of 0.845.
2.3 Data collection procedure
The data collection process took place virtually, via an electronic platform previously tested and used on other occasions by the network. Students accessed, through individual login and password, and were accompanied by teachers and network monitors. To perform the entire test, the students had 240 min, as a maximum time and 30 min as a minimum time. Accompanying the questionnaire was the consent form by which the students could choose to accept or not their participation in the questionnaires.
It is important to clarify that even if the father authorized and the student had completely answered the questionnaire, if his response to the consent form was negative, his records would not be counted in the analyses.
The research was registered with the Research Ethics Committee in Human and Social Sciences (CEP/CHS, as per its Portuguese acronym) under protocol number 5.741.770.
2.4 Data analysis
To perform the data analysis, we first divided the participants into groups according to the score calculated in each dimension of Cultural Capital. The quartiles of each group of scores served as a cutoff point for the groups (Hair et al., 2009; Morettin and Bussab, 2013). Thus, we obtained four groups of respondents, G1, G2, G3 and G4, and G1 is the lowest cultural capital group and G4, the group with the highest cultural capital.
We performed Anovas One-Way between the scores of each dimension of cultural capital and the education of the mother and father to verify if there are differences between the means in each subgroup. Anovas One-Way (Fávero and Belfiore, 2017) were also carried out to test whether the scores of the scores in the assessments of knowledge in mathematics and Portuguese had different means, from a statistical point of view, in the two dimensions of Cultural Capital.
Student's t-test was performed to verify if there was a difference in the means of cultural capital scores between children of different sexes and knowledge assessments between male and female children. Finally, we performed a simple factorial design, which can also be known as factorial ANOVA, to verify the interaction between the independent variables and the effect caused on the dependent variable (Field, 2020).
When conducting parametric analyses, we adopted a robust estimation method known as bootstrapp. This procedure is widely used when there is no certainty as to the satisfaction of the assumptions required in each analysis, especially when the assumption of data normality is not ensured, as well as homoscedasticity. The bootstrapping procedure generates small random subsamples from the actual samples collected, simulating a normal distribution based on the law of large numbers.
To calculate the scores of each dimension of Cultural Capital, to conduct each ANOVA, to perform the Student's t-test and factorial design, we used the Statistical Data Analysis Software (SPSS) 28.0.1.0.
3 Results
The results unveiled the following indicators for homogeneity of variance: Levene's test in the RCC groups in relation to their performance in terms of Portuguese language was F(3,11, 764) = 1.698, p = 0.165 and in relation to their performance in terms of mathematics it was F(3,11, 772) = 2.662, p = 0.046. Levene's test in the SCC groups in relation to their performance in terms of Portuguese language was F(3,11, 764) = 7.413, p < 0.001; and, in mathematics, it was F(3,11,772) = 2.412, p = 0.065.
The mean SCC and RCC scores obtained by the students were M = 2.277, 95% CI BCa [2.265, 2.287], and M = 3.718, 95% CI BCa [3.706, 3.731].
We performed a Student's t-test to verify if there was a difference in the means of the Cultural Capital scores between the sexes. Considering the SCC, male students had a mean of M = 2.271 [2.256, 2.287] while female students had a mean of 2.283 [2.267, 2.299], and the mean difference of −0.012, 95% CI BCa [−0.034, 0.011] was not significant, t(11, 776) = −1.072 with p = 0.284 and represented an effect size of d = −0.020. Regarding RCC, the results also did not indicate a difference between the sexes: male M = 3.719 [3.703, 3.735]; female M = 3.717 [3.699, 3.735]. The mean difference was 0.002, 95% CI BCa [−0.025, 0.025], t(11.776) = 0.118, p = 0.453 and d = 0.002.
We also tested the difference in the performance means in Portuguese and Mathematics of students of different genders. Male students achieved a performance in Mathematics of M = 267.404, 95% CI BCa [266.122, 268.598], while female students achieved a performance in Mathematics of M = 258.042, 95% CI BCa [256.828, 259.239]. The mean difference in Mathematics in favor of male students was 9.363, 95% CI BCa [7.578; 11.089], a significant difference, with t(11.750) = 10.694, p < 0.001 and d = 0.197. In Portuguese, female students performed better, M = 246.134, 95% CI BCa [244.959, 247.394] compared to male students, M = 236.449, 95% CI BCa [235.088, 237.801]. The difference of 9.685 CI BCa [7.883, 11.552] between the means was also significant with t(11.750) = 10.694, p < 0.001 and d = 0.194.
We performed an Anova One-Way test to verify if the SCC and RCC scores showed a difference in the means within the different schooling groups of the parents, taking into account only the students who knew how to answer about the schooling of both parents. Thus, we proceeded with the analysis from three groups of possibilities, regarding the parents' education, namely: father and mother without university education, father or mother with university education, and father and mother with university education.
For the SCC, the results showed that there is an effect on the mean difference between the three parental education groups, with F(2, 6, 752) = 86.762, with p < 001 and η2 = 0.025. Students who claimed to have a father and mother with university education achieved a mean of 2.4411 95% CI BCa [2.421, 2.461]; students who stated that the father or mother has university education had a mean SCC score of 2.323 95% CI BCa [2.298, 2.350]; and students who stated that neither father nor mother has university education achieved a mean SCC score of 2.196 95% CI BCa [2.165, 2.227]. Tukey's post hoc test indicated statistically significant differences between the three groups.
We separately calculated the difference in means between the group of students in which father and mother had university education with the group of students in which father and mother did not have university education. We performed a t-test and found the mean difference in SCC between the two groups of 0.245, 95% CI BCa [0.208, 0.282] with t(4, 835) = 12.730, p < 0.001 and d = 0.406.
For the RCC, the results showed a smaller effect on the mean difference between the parents' education groups, when compared to the SCC, with F(2, 6, 752) = 5.869, with p = 0.003 and η2 = 0.002. Students who claimed to have a parent with university education achieved a mean RCC of 3.859 95% CI BCa [3.838, 3.881]; students who claimed that the parent had university education had mean RCC score of 3.843 95% CI BCa [3.814, 3.873]; and students who stated that neither parent had university education achieved a mean RCC score of 3.788 95% CI BCa [3.753, 3.824]. Tukey's post hoc test indicated a statistically significant difference between the groups in relation to the group of students in which the father and mother did not have university education.
We performed a t-test to verify the mean difference in RCC between the group of students who stated that father and mother had university education with the group of students who stated that father and mother did not have university education. The mean RCC difference between these two groups was 0.071, 95% CI BCa [0.029, 0.112], with p < 0.001 and d = 0.109.
We compared students' performance in the knowledge test in Portuguese language and mathematics, according to the parents' educational group to which the students belonged. The results showed that there were differences between the schooling groups. In Portuguese language, students who stated that neither their father nor mother had university education achieved a mean M = 235.304 95% CI BCa [232.648, 237.810]. Students who stated that either their father or mother had university education achieved a mean M = 244.148 95% CI BCa [242.030, 246.406]. Finally, students in whom fathers and mothers had university education, achieved a mean M = 246.840 95% CI BCa [245.087, 248.534]. ANOVA indicated a significant difference in the mean between the groups, F(2, 6, 736) = 26.034, with p < 0.001 and η2 = 0.008. Tukey's post hoc test identified that the group with less education of father and mother differed from the other two groups.
In mathematics, the results also showed that there are differences between the parents' schooling groups. Students who stated that neither their father nor mother had university education achieved a mean M = 259.505 95% CI BCa [256.875, 262.083]. Students who stated that either their father or mother had university education achieved a mean M = 265.924 95% CI BCa [263.811, 268.113]. And, students in whom fathers and mothers had university education, achieved a mean M = 269.748 95% CI BCa [268.151, 271.388]. Anova presented a statistic that guarantees the presence of differences between the groups, F(2, 6, 736) = 23.374, with p < 0.001, and η2 = 0.007. Tukey's post hoc test indicated that there is a statistically significant difference in the mean of mathematics between the three groups of the parent's education.
We performed a t-test to measure the difference in means in relation to performance in Portuguese and mathematics only between the extreme groups of education of parents: father and mother without university education and father and mother with university education. The mean difference for Portuguese language between the two groups was 11.5362 CI BCa [8.420, 14.897] with p < 0.001 and d = 0.230. The mean difference for mathematics between the two groups was 10.243 CI BCa [7.205, 13.162], with p < 0.001 and d = 0.217.
We divided each dimension of Cultural Capital into four groups and classified students according to their score on the Cultural Capital in Family Interactions instrument. The cutoff points for the construction of the groups were based on the quartiles, and followed the following guidelines: For SCC, 1Q = 1.82; Median = 2.27; 3Q = 2.64. For RCC, 1Q = 3.31; Median = 3.77; 3Q = 4.23. Thus, the students were classified into four groups within each dimension, according to the score obtained. Thus, the groups named according to Table 1.
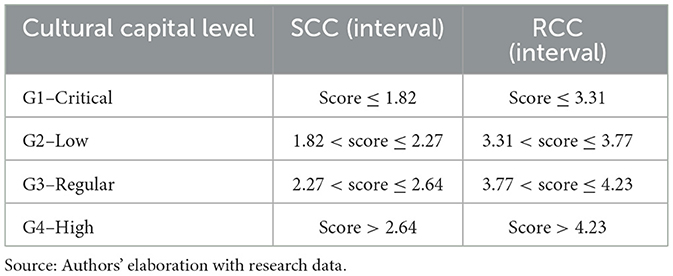
Table 1. Classification of the dimensions of cultural capital according to the score achieved.
We carried out an Anova One-Way to check if there is a difference in performance in the subjects of Portuguese language and mathematics within the 4 groups of each dimension of cultural capital. First, we used the performance in Portuguese as a dependent variable and the SCC as an independent variable. The results of the analysis, F(3, 11, 764) = 9.516, with p < 0.001 and η2 = 0.002, indicated the existence of a difference in the mean Portuguese language between at least one SCC group. To identify which groups differ, we performed a Tukey post hoc test that classified only the “G1–Critical” group as being different from the other groups. The mean performance in Portuguese of the students in each group was: G1–Critical, M = 237.577 95% CI BCa [235.779, 239.233]; G2–Low, M = 241.989 95% CI BCa [240.390, 243.769]; G3–Regular, M = 244.624 95% CI BCa [242.649, 246.609]; G4–High, M = 241.776 95% CI BCa [239.876, 243.666].
Considering performance in mathematics as a dependent variable, we performed the same procedure taking SCC as an independent variable, F(3, 11, 764) = 13,728, with p < 0.001 and η2 = 0.003. The mean performance in Portuguese of the students in each group was: G1–Critical, M = 258.223 95% CI BCa [256.578, 259.920]; G2–Low, M = 263.620 95% CI BCa [262.002, 265.058]; G3–Regular, M = 266.058 95% CI BCa [264.076, 267.934]; and G4–High, M = 263.456 95% CI BCa [261.701, 265.293]. A new post hoc test by Tukey also classified only the G1–Critical group as being different from the other groups.
Using the RCC as an independent variable and the performance in Portuguese as a dependent variable, we performed an Anova One-Way to verify if there was a difference in the performance of Portuguese language between the RCC groups. The results, F(3, 11764) = 42.349, with p < 0.001 and η2 = 0.011, showed a difference between at least one RCC group. In order to identify which group(s) presented a statistically significant difference, we conducted a post hoc Tukey test that identified the following differences between groups: “G1–Critical” students obtained the lowest mean performance in Portuguese, M = 233.942 95% CI BCa [232.314, 235.848]. The students of “G2–Low,”” with a mean of 241.025 CI BCa [239.102, 242.858], and “G3–Regular” with a mean of 243.748 CI 95% BCa [241.989, 245.392] did not present a statistically significant difference between themselves, but higher than the “G1–Critical” group. “G4–High” students had a mean performance of 247.979 95% CI BCa [246.023, 249.837], surpassing the other three groups.
We used the same reasoning to compare students' performance in the mathematics discipline within the RCC groups. Anova One-Way presented a statistic, F(3, 11, 764) = 28.138, with p < 0.001 and η2 = 0.007, which supports the presence of difference in mean performance between groups. Students in the “G1–Critical” group, with a mean in mathematics of 256.441 95% CI BCa [254.770, 258.173] had lower performance than the other groups. However, the mean performance of students in the groups “G2–Low with mean M = 263.347 95% CI BCa [261.705, 264.964], “G3–Regular,” with mean M = 265.471 95% CI BCa [263.750, 267.108], and “G4–High,” with mean M = 266.435 95% CI BCa [264.613, 268.355], showed no statistically significant differences between them.
We conducted factorial designs to verify the effect of the interaction between the SCC and RCC groups on students' performance in the mathematics and Portuguese language assessments. The results found from the interaction between the two dimensions of cultural capital and the Portuguese language discipline, F(9, 11, 771) = 1.869, with p = 0.052 and η2 = 0.001, suggest a closer look at the analysis before considering only the value of statistical significance and accepting the null hypothesis. Table 2 shows the performance of students in Portuguese as a result of crossings between students from different groups of cultural capital in each of the dimensions.
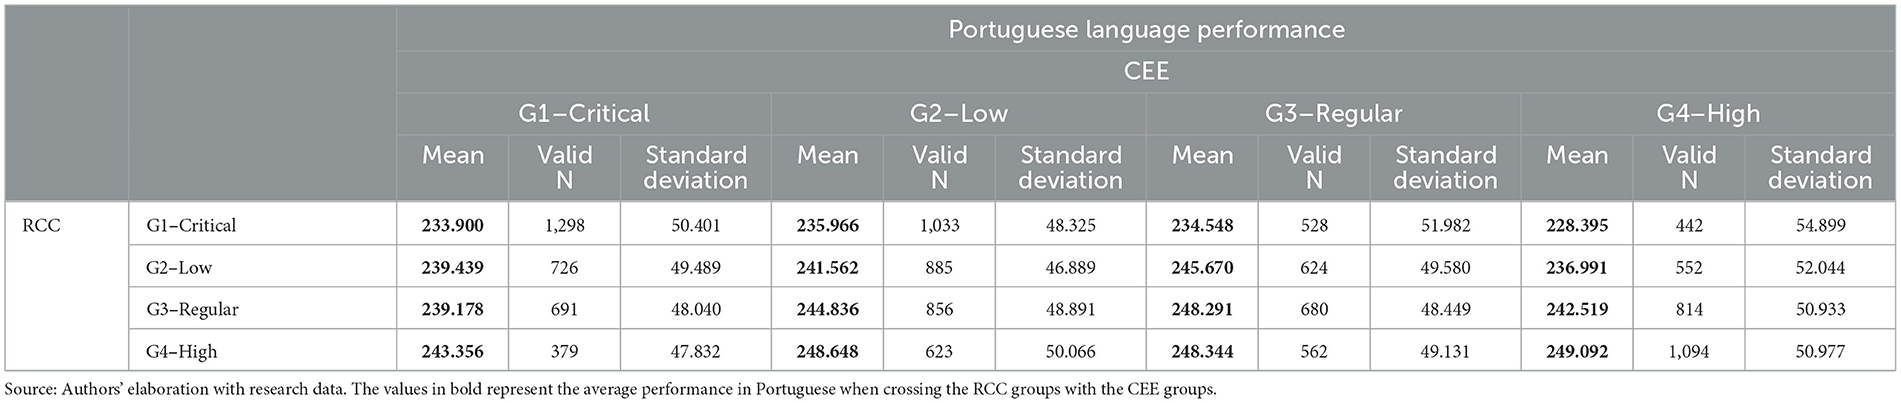
Table 2. Result of crossings between students from different cultural capital groups.
Looking at Table 2, we have the following overview: the columns represent the different groups of the SCC, while the rows represent the different groups of the RCC. Analyzing the data in Table 2, considering the columns (SCC Groups), the means in each row (RCC Groups) tend to increase progressively, as can be better illustrated in Figure 1.
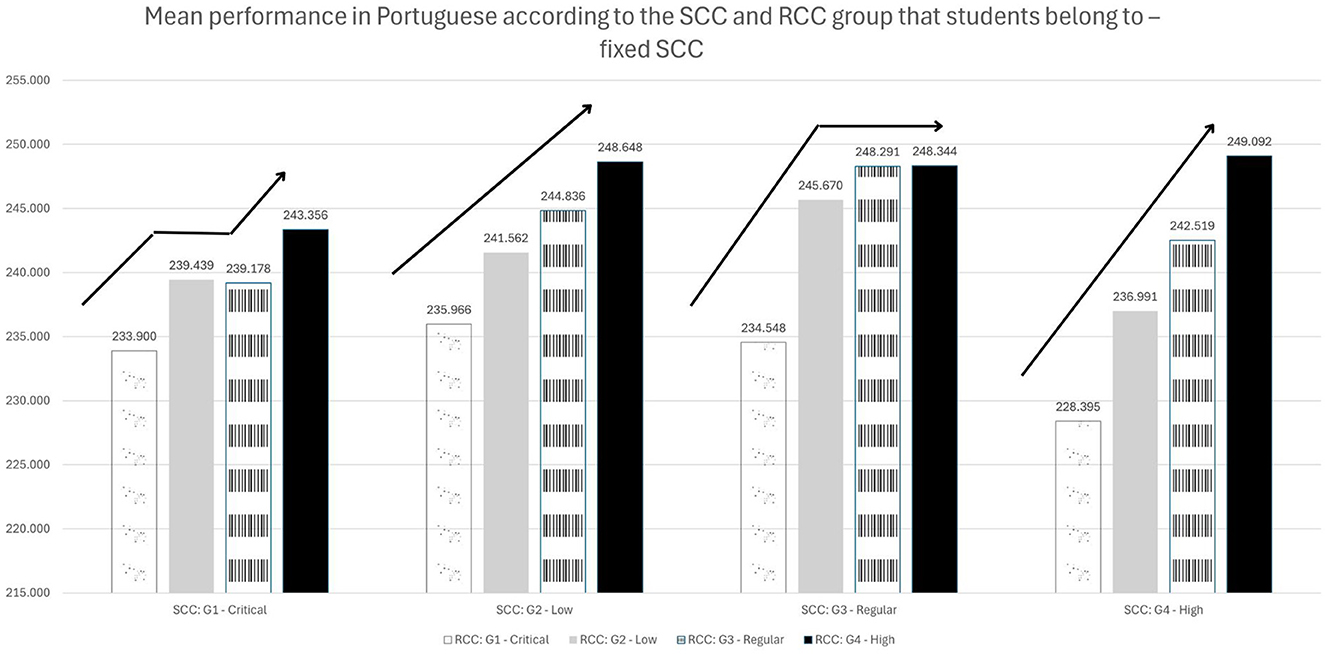
Figure 1. Mean performance in Portuguese according to the group of SCC and RCC that the students belongs to Fixed RCC.
We found that the best mean performance in Portuguese was achieved by students who have high RCC and high SCC, M = 249.092 95% CI BCa [246.088, 252.176], while students who achieved the worst performance are those who have high RCC and critical SCC, M = 228.395 95% CI BCa [223.090, 233.497]. The mean difference between students who performed better and worse in Portuguese was 20.697 95% CI [14.938, 26.456], with p < 0.001 and d = 0.397.
From the data in Table 2, we can also see that within each SCC group, students' performances in Portuguese varied progressively as the RCC level increased. This finding is better perceived from Figure 1, in which it is possible to notice that the variations in student performance are more strongly evidenced in the “G2–Low” and “G4–High” groups of the SCC.
On the other hand, changing the perspective of data observation, that is, failing to fix the SCC and starting to fix the RCC, we noticed another fact that drew attention: when we look at the performance of students in Portuguese within each RCC group, the progressive variation in student performance happens partially when we vary the SCC group. Student performance in the four RCC groups varies progressively between the “G1–Critical” and “G2–Low” SCC groups. However, as the level of SCC increases, this progression is stopped in most groups of RCC. Figure 2 helps to better visualize this information.
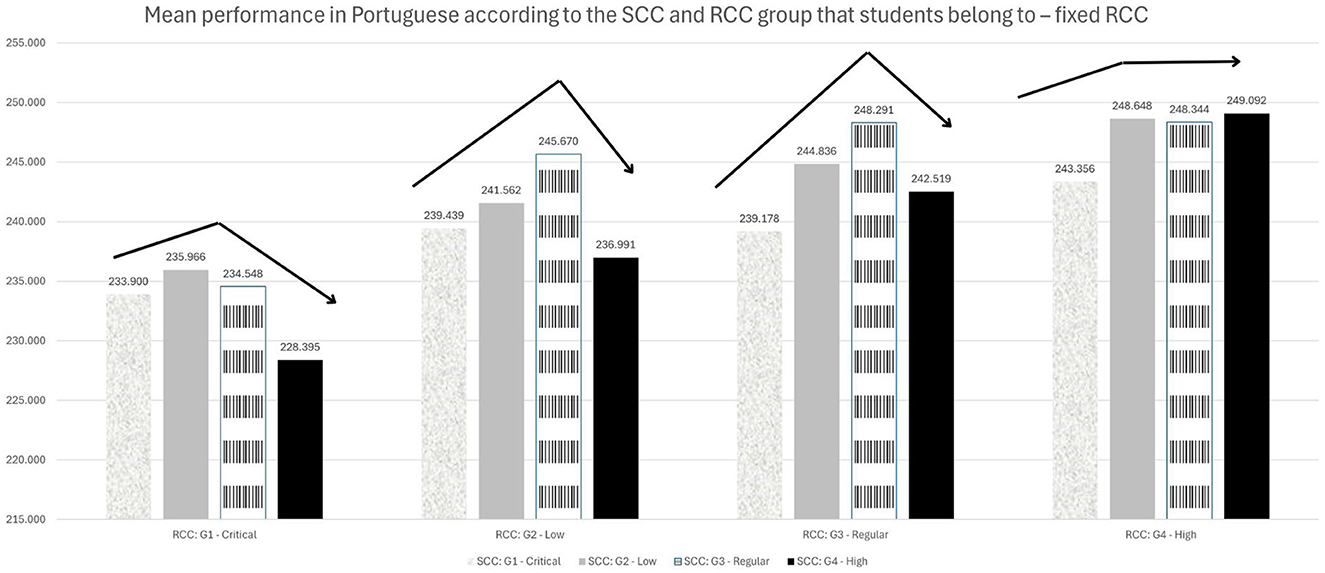
Figure 2. Mean performance in Portuguese according to the group of SCC and RCC that the students belongs to Fixed RCC.
To verify the effect of the interaction between the SCC and RCC groups on students' performance in the mathematics assessments, we conducted another factorial design. The results of the interaction between the two dimensions of cultural capital and the discipline of mathematics were F(9, 11, 771) = 1.587, with p = 0.113 and η2 = 0.001. The significance value far above the expected threshold suggests an absence of interaction.
4 Discussion
The results showed that, on mean, students of different sexes have the same level of cultural capital in any of the dimensions. However, male students performed better in the mathematics assessment, while female students performed better in Portuguese. The results of mathematics and Portuguese language performance confirm previous studies by Stoet and Geary (2013) and Breda and Napp (2019).
As for the parents' education, we divided the sample into three groups: the first group consisted of students in which the father and mother did not have complete university education. The second group consisted of students in which only one of the parents had university education and the third group of students in which the father and mother had university education. The results showed that the higher the parents' education, the higher the level of cultural capital of their children in both dimensions. This result corroborates the study carried out by Šarvajcová and Rybanský (2020). When we compared the parents' schooling, in both extremes (father and mother with university education vs. parents and mother without university education) we noticed that the SCC was more sensitive to this difference in schooling than the RCC. The effect of the difference in schooling on the SCC was 3.7 times greater than the RCC.
We compared the parents' schooling with the students' performance on the Portuguese language and mathematics assessments. Students who reported that both parents did not have university education showed lower performance, both in Portuguese and in mathematics. The difference in mathematics achievement was most marked among the three parent education groups. This relationship between schooling and academic performance agrees with the study by Pires (2015), who, when using data from a large-scale evaluation that takes place in Brazil, known as the National High School Examination (ENEM), realized that the simple fact that one of the parents had university education was already enough to contribute to the differentiation of results between students.
We divided each dimension of Cultural Capital into 4 groups and classified each student in these groups according to their score in each dimension. The groups were “G1–Low,” “G2–Medium,” “G3–Regular,” and “G4–High.” The cutoff point for each group, in each dimension, was determined by the quartiles. It is important to highlight that the dimensions are independent, and thus, the same student can be in one group in the SCC dimension and in another group in the RCC dimension. Thus, all students were classified in some group in each dimension.
We analyzed the mean performance in Portuguese and Mathematics within each group in each dimension of cultural capital. In the SCC, both in Portuguese and in mathematics, the main difference was for the “G1–Critical” group, which performed below the other groups. The other three groups, despite having a numerical difference, were not statistically significant. In the RCC dimension, the groups showed different performance in Portuguese. The students in the “G1–Critical” group performed worse, but contrary to what happened in the SCC, the RCC discriminates against the other groups, so that the greater the amount of relational cultural capital, the better the students' performance in the Portuguese language discipline. In mathematics, the students in the “G1–Critical” group had a lower result than the other three groups. However, although the other groups had numerically different values, they did not present statistically significant differences.
We cross-relate the two dimensions of cultural capital by comparing student performance in the Portuguese language and mathematics subjects. The students who obtained the best performance in Portuguese were those who had high SCC and high RCC. But, the combination that generated the worst performance was when students had high SCC and critical RCC. At first, we could expect that the worst performance would be with students who were allocated in the critical SCC combination with critical RCC. We will return to discuss this subject in a few paragraphs below.
As can be seen in Figure 1, among all students who had the same level of SCC, “G1–Critical,” as the RCC increases, there is an increase in the academic performance of students in Portuguese. This performance happens in all four SCC groups, that is, for a group of students who have the same amount of SCC, the increase in RCC causes an increase in performance in Portuguese, thus highlighting the impact that RCC causes.
Looking at Figure 2, we can see that something different happened when we fixed the RCC and varied the SCC within the same RCC group. For students who are within the same RCC level, increasing SCC does not always result in better performance by these students in Portuguese. Let's take as an example the students who belong to the RCC G1–Critical group. In this group, the performance of the SCC G1–Critical students was 233.9, the performance of the SCC G2–Low students was 236.0, the performance of the SCC G3–Medium students falls to 234.5 and the performance of the SCC G4–High students presents the worst performance of the students in this group, which was 228.4. This happens in all groups in which we fix the RCC and vary the SCC, with the exception of the last fixed group of the RCC.
With this, we realized that having a high SCC value and low RCC value is not good for student performance. Since SCC is more related to culture arising from economic conditions, in most cases this cultural capital needs to be balanced by relational capital. It is known that the parenting practices transmitted and developed by children make a difference in the composition of cultural capital (Šarvajcová and Rybanský, 2020). In a research carried out by Jesus et al. (2022) found that students who maintain a dialogue with their families on various topics tended to obtain better results in reading comprehension. Another study by Pozzobon et al. (2018) presented the result of the intervention of researchers with families whose children presented low performance in a given public school. From the interventions that provided awareness and guidance, the parents of these students changed their relational posture with their children and this resulted in a new academic behavior. This may explain why the worst performance in the Portuguese language was not among the critical SCC groups with critical RCC.
The SCC and RCC are impactful on students' academic performance. However, once the SCC is no longer supported by the RCC, the mean performance of students is not positively affected. On the other hand, when students have a high SCC, an increase in the RCC level reflects significantly on the mean performance of students in the Portuguese language.
5 Conclusion
The objective of this study was to verify the effect that cultural capital has on family interactions on the academic outcome of 5th grade students in a school network in Brazil. A questionnaire was administered to the students along with an assessment of knowledge in Portuguese and mathematics.
Based on Bandura (1977) theory of social learning, in which children learn by observing the adults who serve as a model, we applied an instrument of cultural capital built on two dimensions: Static Cultural Capital (SCC) and Relational Cultural Capital (Nunes and Andrade, 2024). SCC is more related to intentional practices for the acquisition of cultural capital, such as music and language classes, visits to museums, theaters, etc. RCC is associated with exchanges that happen naturally in the family environment, such as discussions, conversations and advice.
Throughout the study, we realized that the two dimensions of cultural capital, SCC and RCC, at their different levels, impact students' performance. We could notice that the level of cultural capital of the students is not related to sex, but has a certain relationship with the parents' schooling, so that there is a great difference in the level of cultural capital of the students when we contrast students in which the parents do not have university education with students in which the students' parents have university education.
We divide each dimension of cultural capital into four groups within each dimension. After this division, we analyzed the mean performance of students in mathematics and Portuguese. The students in group G1–Critical of the SCC dimension had, on mean, a lower performance in Portuguese and mathematics when compared to the other three groups. This shows that having very low cultural capital in the SCC dimension can interfere with students' academic performance.
In the RCC dimension, the difference in the results of the students belonging to each group of this dimension was more expressive. In Portuguese, the groups were better discriminated in terms of income, so that the higher the level of cultural capital, the higher the student's performance. In mathematics, the differentiation was only with the group G1–Critical.
Finally, we compared students' performance by crossing each group of the two dimensions. Although in mathematics the results are not expressive, in Portuguese we can see that the increase in the level of cultural capital impacts students' performance. This was observed when we varied the amount of relational cultural capital within each group of static cultural capital. Portuguese language performance progressively increases within each SCC group as we increase the RCC. On the other hand, we noticed that the inverse analysis, that is, when we vary SCC within each RCC group, students' performance does not follow a remarkably increasing trajectory without RCC also growing.
Thus, we conclude that: (1) Cultural capital impacts students' academic performance, but most notably in the Portuguese language discipline. (2) The dimensions of cultural capital behave differently and the excess of SCC, without the presence of RCC, impacts the reduction of mean performance. (3) The RCC linearly impacts student performance as the SCC is increased.
From the study carried out on the impact of Cultural Capital on students' academic performance, we have realized that success in student academic performance is not just the school's responsibility. The family environment has a good share of contribution in this aspect. Therefore, it is up to the school to create teaching policies that aim to go beyond the walls of the institution and reach the family environment. It is necessary, in many cases, to revive the concept that education is a partnership between family and school and not a transfer from family to school. In this sense, public educational policies are necessary to guide parents regarding the gain of cultural capital, its impact on student performance and the responsibility that each actor has in this scenario.
6 Future studies
We noticed throughout the study that students of different sexes present different mean performance in Portuguese and mathematics. In future studies, it will be interesting to know if, once cultural capital is controlled, students will have the same asymmetry in academic performance.
Another point that may be addressed in future studies is to measure how much students admire their parents in order to have them as models. With this measure, which can be done through a specific instrument for this purpose, it will be possible to establish a correlation between the cultural capital acquired and the affinity with the parents and, later, to verify if there is an impact on the students' learning.
In another study, it will be interesting to carry out a multilevel analysis (Hox et al., 2017), with students as the first level and schools as the second level, in order to analyze the effect of schools' collective cultural capital on student's performance.
It is important underline that, because this is a cross-sectional study, it is not possible to infer cause and effect. It is therefore suggested that studies be carried out using other research designs, such as experimental designs and longitudinal studies.
Data availability statement
The raw data supporting the conclusions of this article will be made available by the authors, without undue reservation.
Ethics statement
The studies involving humans were approved by the Comitê de Ética em Pesquisa - CEP/CHS 5.741.770. The studies were conducted in accordance with the local legislation and institutional requirements. Written informed consent for participation in this study was provided by the participants' legal guardians/next of kin. Written informed consent was obtained from the minor(s)' legal guardian/next of kin for the publication of any potentially identifiable images or data included in this article.
Author contributions
AN: Conceptualization, Data curation, Formal analysis, Investigation, Methodology, Validation, Writing–original draft, Writing–review & editing. JA: Conceptualization, Methodology, Supervision, Writing–review & editing.
Funding
The author(s) declare that no financial support was received for the research, authorship, and/or publication of this article.
Acknowledgments
We would like to thank Adventist Basic Education Assessment Program.
Conflict of interest
The authors declare that the research was conducted in the absence of any commercial or financial relationships that could be construed as a potential conflict of interest.
Publisher's note
All claims expressed in this article are solely those of the authors and do not necessarily represent those of their affiliated organizations, or those of the publisher, the editors and the reviewers. Any product that may be evaluated in this article, or claim that may be made by its manufacturer, is not guaranteed or endorsed by the publisher.
Abbreviations
BCa interval, Bias-corrected and accelerated bootstrap interval; SCC, Static Cultural Capital; RCC, Relational Cultural Capital; CFI, Comparative Fit Index; ENEM, National High School Examination; RMSEA, Root Mean Square Error of Approximation; TLI, Tucker Lewis Index.
References
Adriani, F., Matheson, J. A., and Sonderegger, S. (2018). Teaching by example and induced beliefs in a model of cultural transmission. J. Econ. Behav. Organ. 145, 511–529. doi: 10.1016/j.jebo.2017.11.031
Bandura, A., and Huston, A. (1961). Identification as a process of incidental learning. J. Abnormal Soc. Psychol. 63:311. doi: 10.1037/h0040351
Bourdieu, P. (1998). Capital Cultural, Escuela y Espacio Social (2 edición). México: Siglo XXI editores.
Breda, T., and Napp, C. (2019). Girls' comparative advantage in reading can largely explain the gender gap in math-related fields. Proc. Natl. Acad. Sci. USA. 116, 15435–15440. doi: 10.1073/pnas.1905779116
Cheung, A. C. K., and Slavin, R. E. (2016). How methodological features affect effect sizes in education. Educ. Res. 45, 283–292. doi: 10.3102/0013189X16656615
Christenson, S. L. (2004). The family-school partnership: an opportunity to promote the learning competence of all students. School Psych. Rev. 33, 83–104. doi: 10.1080/02796015.2004.12086233
Fávero, L. P., and Belfiore, P. (2017). Manual de Análise de Dados: Estatística e Modelagem Multivariada com Excel, SPSS e Stata (1ª edição). Rio de Janeiro: LTC Editora.
Gaddis, S. M. (2013). The influence of habitus in the relationship between cultural capital and academic achievement. Soc. Sci. Res. 42, 1–13. doi: 10.1016/j.ssresearch.2012.08.002
Hair, J., Black, W. C., Babin, B. J., Anderson, R. E., and Tatham, R. L. (2009). Análise Multivariada de Dados (6ª edição). Porto Alegre: Bookman.
Hox, J., Moerbeek, M., and van de Schoot, R. (2017). Multilevel Analysis: Techniques and Applications (3ª edition). London: Routledge. doi: 10.4324/9781315650982
Jaeger, M. M., and Karlson, K. (2018). Cultural capital and educational inequality: a counterfactual analysis. Sociol. Sci. 5, 775–795. doi: 10.15195/v5.a33
Jesus, L. C., Braga, C. B. S., Moraes, L. G., Alves, L. M., and Reis, V. O. M. (2022). Family environment resources and reading performance by adolescents. Psicol. Esc. Educ. 26, 1–10. doi: 10.1590/2175-35392022232253t
Kraft, M. A. (2020). Interpreting effect sizes of education interventions. Educ. Res. 49, 241–253. doi: 10.3102/0013189X20912798
Lee, J. S., and Bowen, N. K. (2006). Parent involvement, cultural capital, and the achievement gap among elementary school children. Am. Educ. Res. J. 43, 193–218. doi: 10.3102/00028312043002193
Marić, M., Sakac, M., Raičević, J., Nikolic, S., Vlasta, L., and Saračević, M. (2017). Teachers and social learning as a factor of modern educational competencies. Bulgarian J. Sci. Educ. Policy. 11, 233–245. Available online at: https://www.proquest.com/openview/b39ae05ccb19911fe364a6a479018715/1?pq-origsite=gscholar&cbl=1056402
Mikus, K., Tieben, N., and Schober, P. S. (2020). Children's conversion of cultural capital into educational success: the symbolic and skill-generating functions of cultural capital. Br. J. Sociol. Educ. 41, 197–217. doi: 10.1080/01425692.2019.1677454
Nunes, A. C., and Andrade, J. M. (2024). Cultural capital scale: evidence of validity based on internal structure. Rev. Polit. Gestão Educ. In press.
Piotto, D. C., and Nogueira, M. A. (2021). Um balanço do conceito de capital cultural: contribuições para a pesquisa em educação. Educ. Pesqui. 47:e470100302. doi: 10.1590/s1517-97022021470100302
Pires, A. (2015). Renda familiar e escolaridade dos pais. Educ. Temat. Digit. 17, 523–541. doi: 10.20396/etd.v17i3.8638262
Pozzobon, M., Falcke, D., and Marin, A. H. (2018). Intervenção com famílias de alunos com baixo desempenho escolar. Cienc. Psicol. 12, 87–96. doi: 10.22235/cp.v12i1.1599
Raudenská, P., and Bašná, K. (2021). Individual's cultural capital: Intergenerational transmission, partner effect, or individual merit? Poetics 89:e101575. doi: 10.1016/j.poetic.2021.101575
Šarvajcová, M., and Rybanský, L. (2020). The effect of parental education and parental reading behaviour on family cultural capital of lower and upper secondary school students. Prob. Educ. 78, 612–626. doi: 10.33225/pec/20.78.612
Simpson, A. (2021). Benchmarking a misnomer: a note on “interpreting effect sizes in education interventions”. Educ. Res. 52, 180–182. doi: 10.3102/0013189X20985448
Slavin, R., and Smith, D. (2009). The relationship between sample sizes and effect sizes in systematic reviews in education. Educ. Eval. Policy Anal. 31, 500–506. doi: 10.3102/0162373709352369
Stoet, G., and Geary, D. C. (2013). Sex differences in mathematics and reading achievement are inversely related: within- and across-nation assessment of 10 years of PISA Data. PLoS ONE 8:e57988. doi: 10.1371/journal.pone.0057988
Tan, C. Y. (2020). Family Cultural Capital and Student Achievement Theoretical - Insights from PISA. Singapore: Springer Nature. Kindle. doi: 10.1007/978-981-15-4491-0
Tramonte, L., and Willms, J. D. (2010). Cultural capital and its effects on education outcomes. Econ. Educ. Rev. 29, 200–213. doi: 10.1016/j.econedurev.2009.06.003
Keywords: cultural capital, social learning, school performance, psychology of education, psychometric, evaluation
Citation: Nunes AC and Andrade JM (2024) The impact of cultural capital on school performance. Front. Educ. 9:1389574. doi: 10.3389/feduc.2024.1389574
Received: 21 February 2024; Accepted: 25 June 2024;
Published: 10 July 2024.
Edited by:
Aldo Bazán-Ramírez, Universidad Nacional José María Arguedas, PeruReviewed by:
Wilfredo Bazán-Ramírez, Universidad Nacional Mayor de San Marcos, PeruEduardo Hernández-Padilla, Autonomous University of the State of Morelos, Mexico
Copyright © 2024 Nunes and Andrade. This is an open-access article distributed under the terms of the Creative Commons Attribution License (CC BY). The use, distribution or reproduction in other forums is permitted, provided the original author(s) and the copyright owner(s) are credited and that the original publication in this journal is cited, in accordance with accepted academic practice. No use, distribution or reproduction is permitted which does not comply with these terms.
*Correspondence: Alexandre Chaves Nunes, chavesnunes.alexandre@gmail.com