 Bernadette van Berk
 Ulf Kroehne4
 Charlotte Dignath
- 1Institute of Psychology, Goethe University, Frankfurt am Main, Germany
- 2Center for Research on Education and School Development (IFS), TU Dortmund University, Dortmund, Germany
- 3IDeA Research Center for Individual Development and Adaptive Education of Children at Risk, Frankfurt am Main, Germany
- 4DIPF | Leibniz Institute for Research and Information in Research, Frankfurt am Main, Germany
Assessing self-regulated learning (SRL)—the interplay between monitoring and control behavior—remains challenging, particularly in young learners. The unobtrusive assessment with log data to investigate SRL offers a promising method to deepen the understanding of the SRL process of young students. Despite the significant potential of log data to enhance the measurement of SRL, recent research encounters new challenges of operationalization, transparency, generalizability, validity, and reproducibility. This study introduces an innovative instrument, the digital train track task (TTT), for assessing SRL with log data in young learners, focusing on monitoring and controlling behavior. Log data of 85 primary school students (second to fifth grades, aged 7–13 years) performing one simple and one complex TTT were analyzed. As a novel method, finite state machines (FSM) were applied to extract SRL-related actions and states from the log data. To evaluate and explore the potential of the digital TTT, monitoring, and control behavior during simple and complex tasks were compared, employing frequency-based statistical analysis and transition graphs. Additionally, the log data were multimethodically linked with think-aloud data. The results revealed differences in monitoring and control behavior during the simple and the complex tasks regarding frequency, duration, and transitions between the SRL-related states. Extracted SRL-related states from log data and corresponding think-aloud data showed significant correlations. Adding to the growing body of log data research, this study offers an innovative task to validly assess the metacognitive self-regulation processes of young learners during problem-solving. The transparent, theory-based operationalization of SRL in this study, taking into account recent demands for SRL log data research, allows better reproducibility and transfer and adds to the generalizability of findings from SRL log data research.
1 Introduction
Self-regulation in learning (SRL) is considered an important competence for lifelong learning in a constantly changing and demanding environment (Usher and Schunk, 2018), by enabling learners to proactively regulate their cognitive, metacognitive, and motivational processes, set goals, monitor their progress, and adapt strategies to achieve optimal educational outcomes (Zimmerman, 2000). Consequently, more and more educational researchers are focusing on the promotion of SRL and SRL is receiving increasing attention among school professionals. However, promoting SRL requires an understanding of the individual engagement of students in the SRL process and the recognition of potential deficits in learners. To this end, a valid assessment of SRL that is not only based on the perception of learners, parents, or teachers but also represents learners’ SRL approaches within the process is crucial.
As the research of SRL evolves and new technical possibilities emerge, the assessment of SRL, especially in young learners, has been widely discussed in recent research but remains a challenge (Du et al., 2023; Veenman and van Cleef, 2019). In addition, validity as the central issue in SRL assessment, effectiveness, granularity, and age-appropriateness of SRL assessment methods are also aspects that pose challenges to researchers (Rovers et al., 2019). Moreover, the question arises of how these SRL assessment methods can be simplified and effectively transferred from research to practice application in the long term.
In light of technological development and the potential of learning analytics, considered as the assessment and analysis of diverse learner-produced data to understand and improve learning and learning environments (Khalil and Ebner, 2015), new emerging methods can be used to overcome the current challenges in SRL assessment and deepen the understanding of the complex SRL process (Roll and Winne, 2015; Winne, 2017).
Accordingly, an innovative way to assess SRL as a process is the analysis of log data. Log data have the potential to improve learning science by using it to explore individual learning approaches in detail, predict learning outcomes, and also to guide learning analytics to improve learning processes in real time (Winne, 2020). Despite the significant research using log data to capture SRL, new challenges are emerging that research will need to address (Du et al., 2023; Molenaar, 2014; Roll and Winne, 2015). Current research in the field of SRL using learning analytics is very diverse, using a wide variety of methods to analyze diverse data (van Laer and Elen, 2018; Winne, 2014). Consequently, studies are often difficult to replicate, cannot be transferred to other target groups or learning contexts, and, are, therefore, severely limited in their potential to generalize important findings across different areas (Azevedo, 2014; Du et al., 2023; van Laer and Elen, 2018). Moreover, with the increasing use of digital technologies for educational purposes and assessment, many studies rely on a data-driven analysis of log data to describe the SRL process and neglect the theoretical basis (Reimann et al., 2014; van Laer and Elen, 2018). Therefore, actions and behaviors derived from log data and associated with SRL may not accurately reflect the actual presence of those behaviors.
In response to these deficits, some researchers have already created frameworks and best practice examples for the use of log data in SRL research (Saint et al., 2020b; Siadaty et al., 2016; van Laer and Elen, 2018). Nevertheless, most studies have focused on older students (Perry and VandeKamp, 2000; Viberg et al., 2020) although there is empirical evidence for the early development of SRL and the demand for early promotion (Dignath et al., 2008; Perry et al., 2018; Perry and VandeKamp, 2000). As a consequence, the development of innovative SRL assessment methods with young learners is lagging behind.
This study aims to address current challenges and demands in SRL assessment and introduce an innovative instrument for assessing SRL with log data in young learners. To assess young students’ actual SRL and metacognitive activities in a task-based and procedural manner, we digitized the Train Track Task (TTT) (Bryce and Whitebread, 2012), by augmenting this assessment instrument with log data analyzes. The resulting log data reveal indicators for SRL behavior with a particular focus on monitoring and control. The central contribution of the study is to introduce the digital problem-solving task as an SRL assessment drawing on log data analyses, taking into account the important steps from recent frameworks and protocols for working with this type of data (Saint et al., 2020a; Siadaty et al., 2016; van Laer and Elen, 2018). The presented innovative assessment method aims to create a basis for simple and playful tasks for recording log data to assess SRL in research and is intended to provide a practical application for the diagnosis of SRL by practitioners in the long term.
As a novel approach, finite state machines (FSM) are described and applied to extract SRL-related states from the log data. To evaluate the potential of the digitized TTT to assess complex SRL processes, monitoring and control behavior across a simple and a complex digital TTT are compared.
2 Theoretical background
2.1 SRL and metacognition
When demonstrating self-regulated learning (SRL), students set themselves goals, and select and use strategies or tactics to manage and keep track of their information processing, behavior, use of resources, motivation, and emotions during learning (Winne and Hadwin, 1998; Zimmerman, 2000). SRL cannot be seen as a skill that learners either have or do not have, but rather as a dynamic process learners engage in to achieve their aims (Azevedo, 2009). Numerous studies have shown that SRL is a positive predictor of academic success (Dent and Koenka, 2016) and also of diverse non-academic outcomes (Anthonysamy et al., 2020; Robson et al., 2020). In particular, SRL can be beneficial while working on problem-solving (Stillman and Mevarech, 2010) or in digital learning environments (Broadbent and Poon, 2015). Even if many students face deficits in SRL (Winne, 2005), several studies and meta-analyses highlight that students can be fostered in their SRL (Dignath and Büttner, 2008).
2.1.1 SRL as a dynamic process
Winne and Hadwin’s (1998) conditions, operations, products, evaluations, and standards (COPES) model of SRL explains the dynamic process students engage in while they regulate their learning during a specific task. The model describes a cyclical sequence of phases, starting with task definition and contextual analysis, where students evaluate and orientate themselves in the learning environment and identify task-relevant influencing factors and information (Winne, 2017; Winne and Hadwin, 1998). Relevant factors may include internal influences, such as task-related prior knowledge, and external conditions, such as the technical environment or the specified timeframe for the task. The subsequent phase involves goal setting and strategic planning. In this phase, learners formulate standards for the products of their task performance, according to which they plan their approach (Winne, 2017; Winne and Baker, 2013). The third phase of the COPES model, implementation, describes learners’ actual use of the chosen strategies. In this phase, students consider feedback from diverse sources, such as the learning environment, but also through self-reflection, such as satisfaction with their own performance (Winne, 2017). Following the completion of the task, students evaluate their approach and the effectiveness of their strategy use in a reflective phase (Winne and Hadwin, 1998). The COPES model highlights the iterative nature of self-regulation, as students continuously adapt and refine their approaches in response to feedback and emerging task demands. This iterative process of SRL leads to improved learning outcomes and problem-solving skills over time and is included in most SRL models (Panadero, 2017).
2.1.2 Monitoring and control as key components of SRL
Within this complex SRL process, various metacognitive, cognitive, and motivational strategies come into play (Boekaerts, 1996). One of the most important components of SRL is metacognition (Gascoine et al., 2017). Nelson and Narens (1994) have described metacognition as the interplay of monitoring and control. Monitoring behavior involves the active awareness and assessment of one’s cognitive processes and ongoing tasks. Learners continuously evaluate their understanding, progress, and the strategies they apply during learning or problem-solving activities. Control refers to the strategies and actions taken based on the outcome of the monitoring process. Once individuals become aware of their cognitive states by monitoring, they can implement various control strategies. Control strategies can include adjusting the learning approach or changing study techniques. In essence, control mechanisms are the conscious, goal-directed efforts learners employ to enhance their performance. Learners, for instance, monitor discrepancies between their aims and their actions and use metacognitive control to adapt their behavior to their standards if necessary (Winne and Nesbit, 2009). These theoretical models (Winne and Hadwin, 1998; Winne and Nesbit, 2009) emphasize the dynamic interplay between monitoring and control.
Accordingly, SRL is not necessarily a linear process with a clear order, but rather a repetitive interplay between monitoring and control. Therefore, SRL can be seen as a sequence of events that occur during task performance, which offers a new perspective on metacognition and the whole SRL process (Azevedo, 2014). Based on this assumption, SRL can be interpreted as a successive sequence of states, with a clearly defined start and end point of each state (Winne and Baker, 2013). However, SRL and the occurrence of such events is a partially invisible process. Not all of the SRL activities of learners, in particular cognitive and metacognitive events, are directly visible. The covert nature of SRL can be described as a learner’s dynamic SRL approach consisting of a sequence of observable behavioral events that indicate not directly observable states (van Laer and Elen, 2018). Accordingly, this conceptualization of SRL is based on the assumption that meaningful insights into learners’ latent behavioral states can be gained through a careful examination of ordered observable behavioral events or sequences (Molenaar and Järvelä, 2014). For example, when a learner is rereading the task instruction or the own written product, this could be an observable action or event, indicating metacognitive monitoring, a state difficult to identify without such indicators. However, rereading the own written product can also be interpreted as an indicator for evaluating, which demonstrates that observable actions cannot always be objectively or uniquely assigned to one covert SRL state and highlights the need to take this into account when assessing SRL.
2.2 SRL assessment
To examine the complexity of SRL, identify deficits in SRL, and provide and evaluate effective SRL training, age-appropriate, valid, and reliable measurement tools are crucial. However, the assessment of SRL and metacognition, especially with young learners, is challenging, and the validity and reliability of the variety of instruments have been repeatedly questioned (Veenman and van Cleef, 2019; Winne, 2010). A general distinction in SRL assessment can be made between “online” (event-based) and “offline” (aptitude-based) methods (Veenman and van Cleef, 2019; Veenman et al., 2006). While in offline assessment (e.g., self-report questionnaires, scenario tests), students are asked either before or after performing a learning task to report their learning behavior and strategy use, online measurements (e.g., observational methods, think-aloud, and log data) are conducted during the actual learning process or performance of a task (Reimann et al., 2014; Rovers et al., 2019; Veenman, 2011). Offline methods are, therefore, based on the assumption that SRL is a static aptitude and independent of the direct learning context, whereas online methods capture SRL in a situated event-based manner (Greene and Azevedo, 2010; Winne and Perry, 2000). Even though many different SRL assessment methods have evolved over the last decade, researchers still face various challenges in SRL assessment, such as poor validity, efficiency, and granularity.
2.2.1 Validity of SRL assessment methods
Based on the common agreement to define SRL as a process with different phases (Panadero, 2017), the exclusive use of offline measurements has often been criticized in recent SRL research (Veenman and van Cleef, 2019). The retrospectively reported use of SRL strategies in self-report questionnaires is usually inaccurate and prone to socially desirable responses and to over- or underestimation (Panadero et al., 2016; Roth et al., 2016). Thus, the general validity of self-reports, especially for children, has frequently been questioned (Veenman and van Cleef, 2019; Whitebread et al., 2009). Instead of assessing what students recall or believe to do during learning, online measures attempt to assess what learners actually do while working on a task. Therefore, these methods are considered to be more objective, precise, and valid than offline measures (Greene and Azevedo, 2009; van Halem et al., 2020). However, as event-based measurements are a relatively recent development in SRL research, the psychometric properties of online measures are not yet as well documented as for offline measurements, such as self-reports (McCoy, 2019). Nevertheless, studies show high correlations between online methods and between SRL online assessment and performance, which indicates the validity of these methods (Veenman and van Cleef, 2019).
2.2.2 Applicability of SRL assessment methods
Despite the major concerns regarding validity, offline methods have been the most common assessment method in SRL research for a long time, based on their time-efficient administration. Data from SRL self-report questionnaires and adult ratings can be collected and analyzed easily in large samples (Chen et al., 2015; Gascoine et al., 2017; McCoy, 2019; Veenman, 2011). In contrast, online measurements, such as observations, interviews, or think-aloud protocols, lead to an extensive database of verbal and non-verbal behaviors. The data collection, transcription, and analysis of this data are time consuming (Vandevelde et al., 2015; Veenman and van Cleef, 2019) and need a lot of resources. In addition, some of these methods are intended for laboratory research and are impractical for applied school-based research (Marulis et al., 2016; McClelland and Cameron, 2012). Furthermore, previous research has discussed the potential reactivity of the different assessment methods of metacognition, drawing attention to the relevance of task and person characteristics, and cues (Double and Birney, 2019). A meta-analysis suggests that general think-aloud assessment is non-reactive, but that asking participants to verbalize or explain further details in addition, such as reasons for their behavior or thoughts, is positively reactive (Fox et al., 2011). Nonetheless, both methods are shown to increase task performance time.
2.2.3 Granularity of SRL assessment methods
When comparing and evaluating the validity of different instruments and considering the efficient analysis of SRL data, the granularity of the SRL assessment seems relevant (Bannert et al., 2014; Fan et al., 2022; Molenaar, 2014; Winne, 2010). Offline measures, such as self-reports, assess SRL as a global measure of how an individual usually uses SRL strategies in learning by aggregating learning approaches across learning contexts, episodes, and tasks (Winne and Perry, 2000). In contrast, within online measurements, granularity can vary substantially (Azevedo, 2014; Zhou et al., 2010). Greene and Azevedo (2009) describe the different types of granularity with the help of levels. For example, in think-aloud protocols and log data, students’ specific behaviors and mental processes are recorded, resulting in microlevel data that can also be encoded into macrolevel categories of SRL (Greene and Azevedo, 2009; Siadaty et al., 2016). Coding of log data, for example, can range from milliseconds and smallest mouse movements, which are linked to specific SRL strategies, to the general appearance of SRL behavior, by, for example, clicking on a URL link as a broad indicator for SRL (Winne, 2017).
2.2.4 SRL assessment in young learners
Moreover, assessing SRL in young learners poses a major challenge (Whitebread et al., 2009). Overall, many instruments have been developed for older students. Most offline methods, such as strategy questionnaires, are highly dependent on student’s literacy skills (Perry and VandeKamp, 2000; Whitebread et al., 2009). Being less dependent on language, some online methods, such as observations, are already suitable for preschool age (Veenman and van Cleef, 2019; Whitebread et al., 2009; Winne and Perry, 2000). In addition, think-aloud protocols have also proven to be a practical method for a more objective assessment of SRL strategy use, with young learners (Veenman, 2011). Despite the recent developments in SRL assessment methods, there is still a lack of research on young learners.
Based on the paradigm shift, defining SRL as a series of events resulting in a complex and dynamic process, which develops over time (Molenaar, 2014), online measures seem to be the more valid option to capture SRL (Veenman and van Cleef, 2019). Nevertheless, self-reports are still frequently used because they are the most efficient option. Even if online SRL assessment methods are repeatedly discussed as being more valid, more sensitive to the process nature of SRL, and allow a finer-grained analysis, there is still a lack of instruments that can be administered and analyzed efficiently and in flexible contexts especially with young students. With the increasing technical possibilities, computerized online assessment methods have received growing interest in SRL research (van Laer and Elen, 2018; Winne and Nesbit, 2009). In recent research, various forms of trace data are used to assess SRL, and consequently offer the potential to provide learners directly with feedback on their learning approach. Thus, learning analytics can serve to evaluate and to promote the SRL process.
2.3 SRL and log data
While learners work in any learning environment, they create a large amount of data, whether unconsciously or on purpose, which is described as trace data (Khalil and Ebner, 2015). It can be collected in various ways, for example, in the form of simple notes and text highlighting eye-tracking data, or physical sensors, but also in the form of computerized log data that record detailed information about students’ actions during the learning processes or task performance (Greene and Azevedo, 2010). In line with the idea of learning analytics, where students’ various trace data are used to understand and improve learning processes (Khalil and Ebner, 2015), recent research in the field of SRL attempts to utilize the potential of this diverse data to describe, assess and promote the SRL process of learners (Roll and Winne, 2015). Task-based assessment of SRL with trace data is strongly oriented toward the conceptualization of SRL as a process and attempts to assess the actual regulatory behavior of students during task performance (Winne, 2010; Winne and Perry, 2000). The aim of collecting this type of data is to make students’ not directly observable mental processes during task performance visible to detect SRL (Winne, 2010). Although the terms “trace data” and “log data” are often used synonymously, it can be argued that log data refers more specifically to one type of trace data—individuals timestamped recorded activities in digital environments. Particularly in digital learning environments and tasks, log data have the potential to reliably assess the engagement and interactions of students with the task material (Du et al., 2023). By gathering data automatically and unobtrusively across different settings, log data have the potential to overcome the current challenges of efficient but offline SRL measurement (Fan et al., 2023; Rovers et al., 2019) and can also be collected efficiently in groups (Järvelä et al., 2019). Depending on the digital environment, different types of log data can be collected (Winne and Nesbit, 2009). Interactions with the features of the environment, such as clicks on other buttons or opening a navigation menu, can be used to describe the process. At the same time, the information processing is recorded by, for example, opening, copying, or rephrasing informative sources (Winne and Nesbit, 2009). In combination with time stamps, as another type of log data, these data have the potential to evaluate complex learning processes (Winne and Nesbit, 2009).
Despite the numerous advantages, research using log data to assess SRL faces several challenges: the operationalization of indicators for SRL in log data, developing suitable environments, filtering noises, transparency, validity, and reproducibility (Du et al., 2023; Roll and Winne, 2015; Saint et al., 2022; van Laer and Elen, 2018; Winne and Baker, 2013).
2.3.1 Diversity of subjects and objectives
The actual application areas of log data in SRL research are very diverse. For example, log data are used to assess SRL in reading and writing tasks (e.g., Fan et al., 2022; Rakovic et al., 2022), in the context of hypermedia use (e.g., Kinnebrew et al., 2013) and in broad digital learning environments (e.g., Maldonado-Mahauad et al., 2018; Saint et al., 2020b). Previous research used log data, for instance, to investigate different learning strategies and cluster different SRL approaches of students (e.g., Maldonado-Mahauad et al., 2018; Malmberg et al., 2014; Saint et al., 2020b). Other studies investigated the relation of SRL strategy use assessed with log data and the actual learning outcome (e.g., Maldonado-Mahauad et al., 2018; Rakovic et al., 2022). Using log data, several studies have already investigated the impact of interventions, such as prompting (e.g., Bannert and Reimann, 2012; Siadaty et al., 2016).
2.3.2 Imbalance in the target group
Nevertheless, most of the aforementioned studies investigated SRL among secondary school students (e.g., Kinnebrew et al., 2013; Munshi et al., 2018), university students (e.g., Bannert and Reimann, 2012; Fan et al., 2022; Saint et al., 2020a; Saint et al., 2020b), or adults (e.g., Siadaty et al., 2016), whereas only a few studies have examined the SRL of young learners with the help of log data so far (e.g., Malmberg et al., 2014; Molenaar, 2014). A recent systematic review by Saint et al. (2022) indicated that merely 21% of the reviewed studies using online assessment focused on K–12 students, with only some of those investigating SRL in primary school students or younger children. So far, multimedia learning environments, such as gStudy (Winne et al., 2006) and Betty’s Brain (Biswas et al., 2016) have been used to investigate upper primary school students’ learning processes with different content focus.
2.3.3 Diversity of log data analysis methods
Various methods, such as process mining (e.g., Bannert et al., 2014; Saint et al., 2020b), transition graphs (e.g., Malmberg et al., 2014; Saint et al., 2020a; Siadaty et al., 2016), cluster analysis (e.g., Maldonado-Mahauad et al., 2018), sequence analysis (e.g., Kinnebrew et al., 2013), and network analysis (e.g., Paquette et al., 2021; Saint et al., 2020a), are used to analyze log data to detect SRL. To investigate the methodological potential of log data, only a few studies triangulated log data with different online measurements, such as eye tracking, to analyze the particular value of the various methods (e.g., Fan et al., 2022). Nevertheless, some studies have highlighted the potential of combining log data with other online or offline SRL instruments, such as think-aloud or self-reports (e.g., Fan et al., 2023; Jansen et al., 2020).
2.3.4 Challenges in preprocessing and operationalization
Despite progress in log data research, the structure and preprocessing of raw log data for such analyses are challenging, often not described in detail, and justification for methodological decisions is often neglected (van Laer and Elen, 2018). In the first step, indicators in the form of log events have to be defined as meaningful actions (Zhou et al., 2010). In this context, distinctions from other related constructs, as well as the theoretical explanations, must be taken into account (Winne and Baker, 2013). Generating a sequence of meaningful actions from the raw log data so that each action or sequence of actions corresponds to a strategy used by a learner can be challenging. Non-strategic or irrelevant actions act as noise in the action stream and can lead to misinterpretations. For example, non-strategic actions might be deemed irrelevant, but they can also indicate latent relevant processes in the context of the complex SRL process. In addition, not all actions are unambiguous, which can lead to misinterpretations or subjective dependency of the extracted SRL behavior. Researchers often rely on statistical methods for the temporal and sequential analysis of the log data, but fail to argue theoretically why the sequences identified with the help of sequential analysis are meaningful and explanatory (van Laer and Elen, 2018; Zhou et al., 2010). This leads to a lack of transparency in previous SRL research with log data (van Laer and Elen, 2018) and substantial differences in the quality and type of data, the granularity of SRL is measured and the actual operationalization of SRL (Azevedo, 2014). Overall, the numerous unique learning environments, the lack of transparency in preprocessing log data, and insufficient theoretical foundation make it difficult to replicate the studies and transfer methods and operationalizations.
2.3.5 Demands on log data research
As a reaction, some researchers have started to develop frameworks to guide log data analysis (Saint et al., 2020b; Siadaty et al., 2016; van Laer and Elen, 2018). Three main steps can be distinguished in the work with log data: 1. preprocessing, 2. characterization and operationalization, and 3. analysis. Within these general steps, the recently developed frameworks and protocols (Saint et al., 2020b; Siadaty et al., 2016; van Laer and Elen, 2018) highlight the relevance of theoretical foundation, transparent description, and the preprocessing of the gathered data, followed by defining possible log events in libraries and transforming the data based on defined SRL actions. It is possible to carry out analyses only after having performed these important yet often insufficiently described steps. In addition to the vast potential of the variety of analyses, special attention should, therefore, be paid to data quality and the theory-driven processing of the mass of log data that is easily accessible.
2.4 FSM for processing of log data
SRL is not a linear process but rather an iterative process with potentially repetitive monitoring and control loops (Azevedo, 2009; Molenaar and Järvelä, 2014; Winne, 2014). According to that, this process involves several actions that represent SRL in their sequence and could result in certain metacognitive states during learning (Azevedo, 2014; Winne and Baker, 2013). Specific behavior, for example, typing a text as a memo, could indicate that a learner is in a particular state, for instance, the state of planning or organizing information. Accordingly, events in the log data of learners, for instance, events indicating keystrokes in the memo, can be used as hints (probabilistic) or as evidence (deterministic) that the learner enters a particular state or remains in that specific state until different traceable behavior is observed. The diverse methodological approaches to analyzing log data and extracting possible SRL indicators differ in how transparent the operationalization of the indicators is, that is, how explicitly the observed behavior in digital environments that triggers log events is linked to the high-level inferences created using log data.
2.4.1 Extracting SRL-related states using FSM
In the following, an analytical approach for the reconstruction of deterministic actions and states is briefly described. The strategy aims to make the definition of so-called low-level features explicit and transparent. Low-level features are understood as the elementary pieces of evidence extracted from the log events that either indicate an interpreted action (i.e., traceable behavior that occurs at a particular point in time) or a state (i.e., a temporary section of traceable behavior that starts and ends at identifiable time points in the log event data). Focusing on single events separately is not necessarily sufficient to extract these low-level features and unlock the full potential of information contained in the log event data. To effectively address the context in which events occur (referred to as contextual dependency, see Kroehne and Goldhammer, in press), algorithms, such as FSMs, can be utilized. FSMs are a formal way to define algorithms, which can be used to analyze log data by processing them event by event. These FSM algorithms defined a finite set of theoretically described and observed log events, resulting in states and triggers for transitions (Kroehne and Goldhammer, 2018).
2.4.2 Actions and states as low-level features
To use FSMs, the log data are structured as individual events, and each event combines several information. First of all, a timestamp indicates when the event occurred. Moreover, the log data include a person identifier, indicating the individual participant, and a reference to the element of the computer-based instrument; for example, the task name. In addition, different event types are recorded and defined based on the software used to computerize the assessment content. Beyond that, the log data may include additional event-specific data. Which event-specific data are available depends on the event type. For example, events of type “button click” directly provide the button’s name as an event-specific attribute. Events, such as “button click,” may be interpreted directly, depending, for example, on the name of the clicked button. For instance, a click on a button to reset a task to the initial condition would have the direct interpretation of an action as “Reset.” An action only has a time stamp when it happened but no time duration, although it would be possible to differentiate mouse or touch down and up events. In addition to actions, observed states can be extracted from log data as low-level features. Clicking on button “A” could, for example, open a pop-up window, which is visible until it is closed again via a click on button “B.” The two events of the type “button click” would identify a particular state, “State 1,” with a duration: the time between the two events. In contrast to the previous example of the “Reset” button, not only the click on the button “A” does have a certain interpretation but also the time between these two events (“button click” on “A” and “B”) do have certain interpretations, which represents a certain state as low-level feature.
2.4.3 Differentiating observed states
As the arrows show in Figure 1, differentiating observed states is possible by identifying the transitions between these states with the available log events. For that purpose, events are distinguished by event type (e.g., “button click”), the provided element (e.g., the name of a task), and event-specific attributes (e.g., the name of a clicked button, provided by all events of type “button click”). Since log events typically have time stamps, the decomposition shown in Figure 1 automatically provides time measures for each state visit. The duration time for each occurrence of “State 1” can be calculated by determining the time interval between the timestamps of the “button click” events for button “A” and button “B.” Since potential off-task events that are not logged or not recognized as being relevant may have occurred between these timestamps, it can also be described as the maximum duration time of this state. Figure 1 illustrates that actions become labels for specific transitions and can be used to separate observed states using an FSM. However, the FSM visualized in Figure 1 is only one possible decomposition for a process into observed states based on log events using FSMs.
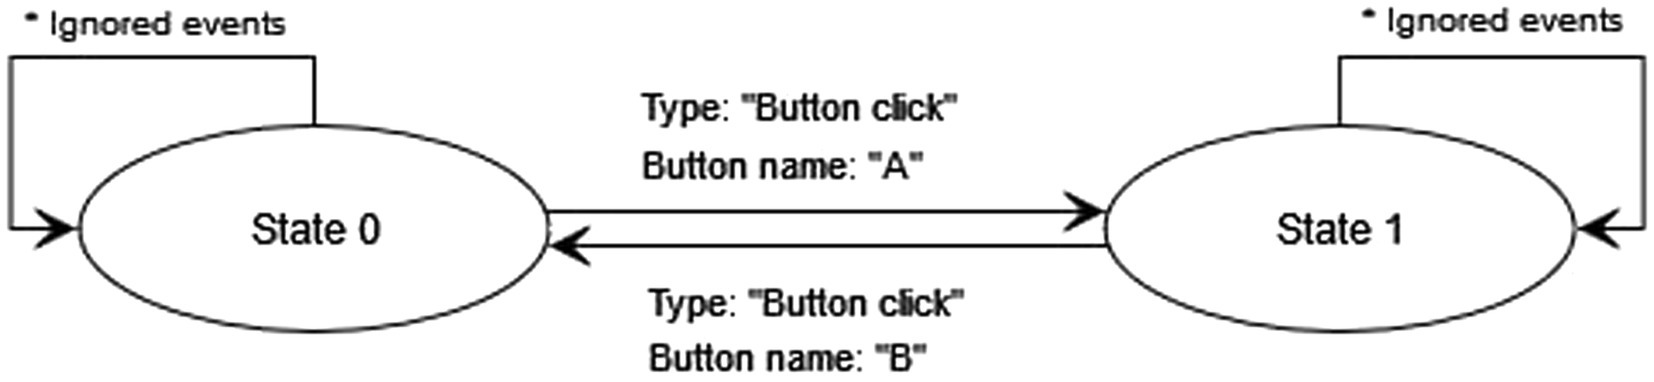
Figure 1. State chart illustrating differentiation of observed states using log events.
2.4.4 Identifying indicators for SRL
Using FSMs allows deriving timed low-level features, that is, states with start and end times for computing the duration, and actions with a single timestamp. Based on these low-level features, process indicators can be extracted as aggregated values of the low-level features. These are variables at the person-by-task level, with one value for each test-taker for each administered task. Depending on the desired process indicator, different low-level features can be extracted using additional FSMs. Not all log events have to be defined as meaningful actions. Log events that are not used to trigger transitions are absorbed by the self-transitions (marked as “*Ignored events” in Figure 1). In addition, the documentation of log data that describes when an event of a particular event type occurs and that provides details about the meaning of all event-specific attributes, the FSM operationalization of low-level features offers the opportunity to achieve transparency concerning log data analyses and the extraction of observed states. It can also help to achieve replicability by providing additional descriptions of the low-level features.
The study aims to introduce the digital TTT as an innovative instrument to assess young students’ SRL. To enable the use of the newly developed task for future learning analytics, the following research questions guide the study:
1. How can monitoring and control be operationalized in the log data and extracted as theoretically defined low-level features?
2. To what extent do the temporally ordered sequences of monitoring and control states extracted from log data differ in the simple TTT and the complex TTT?
3. To what extent do the log data and the think-aloud data show similar frequencies of monitoring and control?
3 Materials and methods
3.1 Sample and procedure
The participating children were recruited throughout Germany for an online study. Due to the coronavirus disease 2019 (COVID-19) pandemic, the whole study was conducted remotely. In total, N = 85 students from the second to the fifth grade, aged between 7 and 13, performed the digital TTT on their private computers at home. The demographic data of six students were missing. The remaining 79 students, of which information was available, were, on average, M = 10.2 years of age (standard deviation [SD] = 1.21), and 49% of the participants were female (see Appendix Table A3). The TTT was implemented in a digital learning platform (moodle). The participating families were informed in advance that they would need a computer with audio output and a mouse to complete the tasks. During the task processing, trained experimenters accompanied the students on the phone, initiated the task, and helped the children if technical difficulties occurred. The experimenters could not directly observe participants’ performance during the task and were explicitly instructed to offer only technical assistance, but no help was extended to solve the task. The children were asked to inform the experimenter when they thought they had finished the task, but they could always stop working on it themselves.
3.2 The digital train track task
Originally, the TTT (Bryce and Whitebread, 2012) was developed as an observational instrument that allows the capturing of young learners’ metacognitive strategy use in verbal and non-verbal behavior with the help of video data. The original TTT and its different age-related tasks have already been validated and tested in several studies with different age groups (Bryce and Whitebread, 2012; Spektor-Levy et al., 2017; Tzohar-Rozen et al., 2021). As an online assessment, the TTT offers numerous advantages. It is independent of language skills, exciting for children, relatively independent of culture and general school performance, and can be varied in difficulty for different age groups (Bryce and Whitebread, 2012; Spektor-Levy et al., 2017). To use this potential in the context of learning analytics, the TTT was adapted and digitized as an innovative method to assess metacognition in primary school students. The digitized TTT can replace resource-intensive video data with log data, which, to some extent, can be processed automatically.
3.2.1 Development and procedure of the digital TTT
As in the original task, the digital TTT requires children to reconstruct a rail circle with a set of train tracks according to a plan. In our study, each child had to solve two different TTTs. The digitized task starts by automatically opening a window that shows students a plan with a shape they have to rebuild. The train tracks are arranged in an unsorted way for each task. With the pointing device (mouse, touchpad, or touch-screen), the tracks can be moved within the playing space. When two tracks are moved close to each other with matching connection spots and in the correct orientation, they automatically connect in the digital TTT. With specific buttons children can rotate the individual train tracks in two directions (clockwise and counterclockwise), can zoom in and out to enlarge the playing space, or take a closer look at a track or their current construction. Moreover, a help button allows the participants to (re)watch the explanatory video for the different features within the digital environment. With the “plan” button, students can reopen the plan showing the shape they have to rebuild at any time while working on the task. The plan and help buttons are presented as so-called modal dialogs (see Kroehne, 2023b), and no interaction with the digitalized TTT was possible while either the “plan” or “help” window was visible on the screen. Finally, participants could jump to the next task or complete the task by clicking the ‘next’ button (see Figure 2).
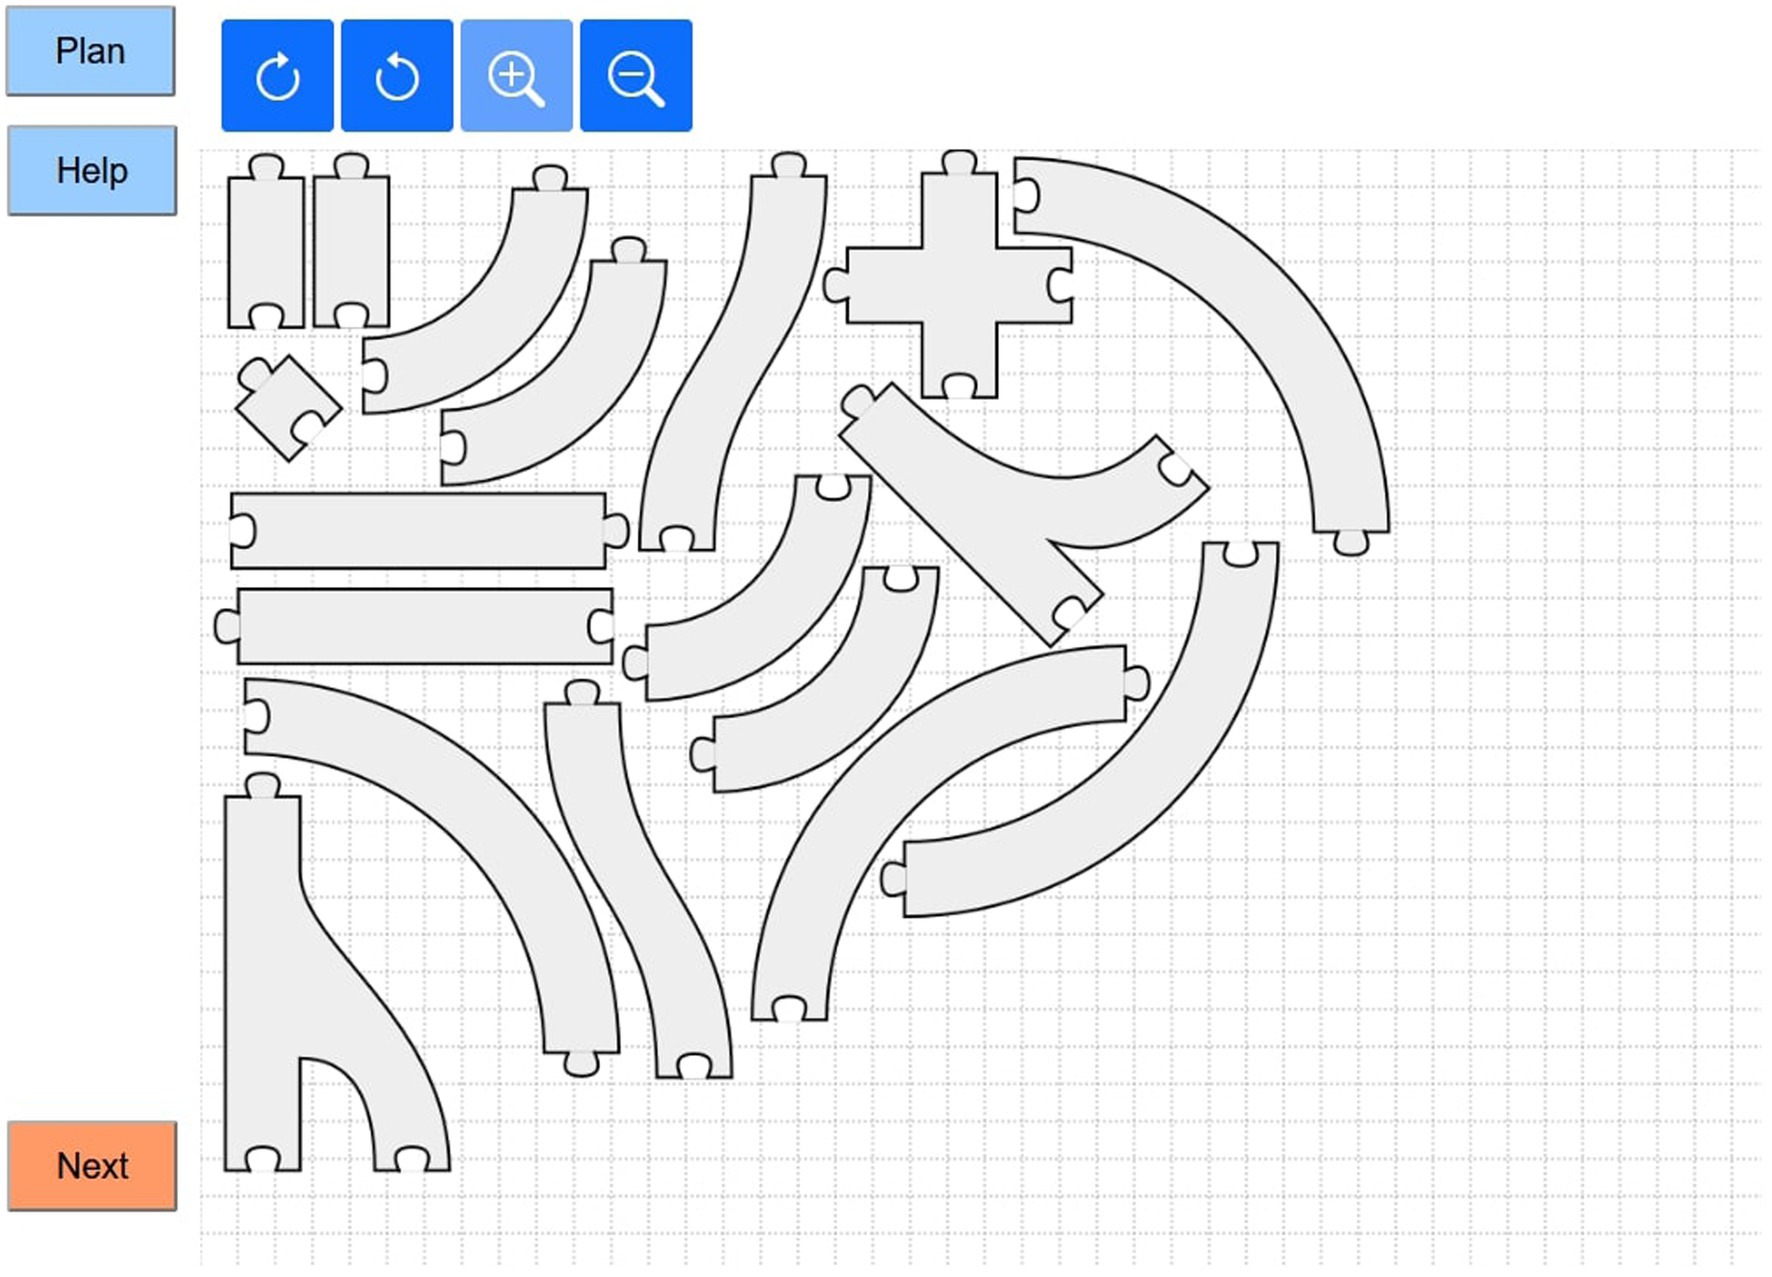
Figure 2. Digital train track task environment.
After closing the plan window to start the task, the experimenter connected via telephone and made the children aware of the help button, which included a video that introduced the different buttons in the digital environment and their functions. As a first task, all students had to rebuild a simple circle shape. Participants received a more complex shape depending on their age in the following task. For this purpose, the shapes already evaluated in other studies (Bryce and Whitebread, 2012; Spektor-Levy et al., 2017) were utilized for the different age groups. Previous research with the TTT as an observational instrument showed that age is related to the development of SRL abilities (Spektor-Levy et al., 2017) and demonstrated individual differences in monitoring and control (Tzohar-Rozen et al., 2021).
3.2.2 Technical setup
The digital TTT was implemented in JavaScript/HTML5 as an extension to be used with the CBA ItemBuilder (Kroehne, 2023b). In addition to the log events provided by the CBA ItemBuilder, the extension was implemented to provide additional replay-complete log data (see Kroehne and Goldhammer, 2018 for a definition) for all interactions within the digital TTT, allowing the creation of animated video replays based on the log event data. Test deployment for online assessment was implemented using the IRTlib Software (Kroehne, 2023a), embedded into a learning management system (moodle) using LTI, with IRTlib functioning as an LTI tool provider serving the CBA ItemBuilder tasks, including the digital TTT according to the study design (i.e., the age-related tasks as shown in Table 1).
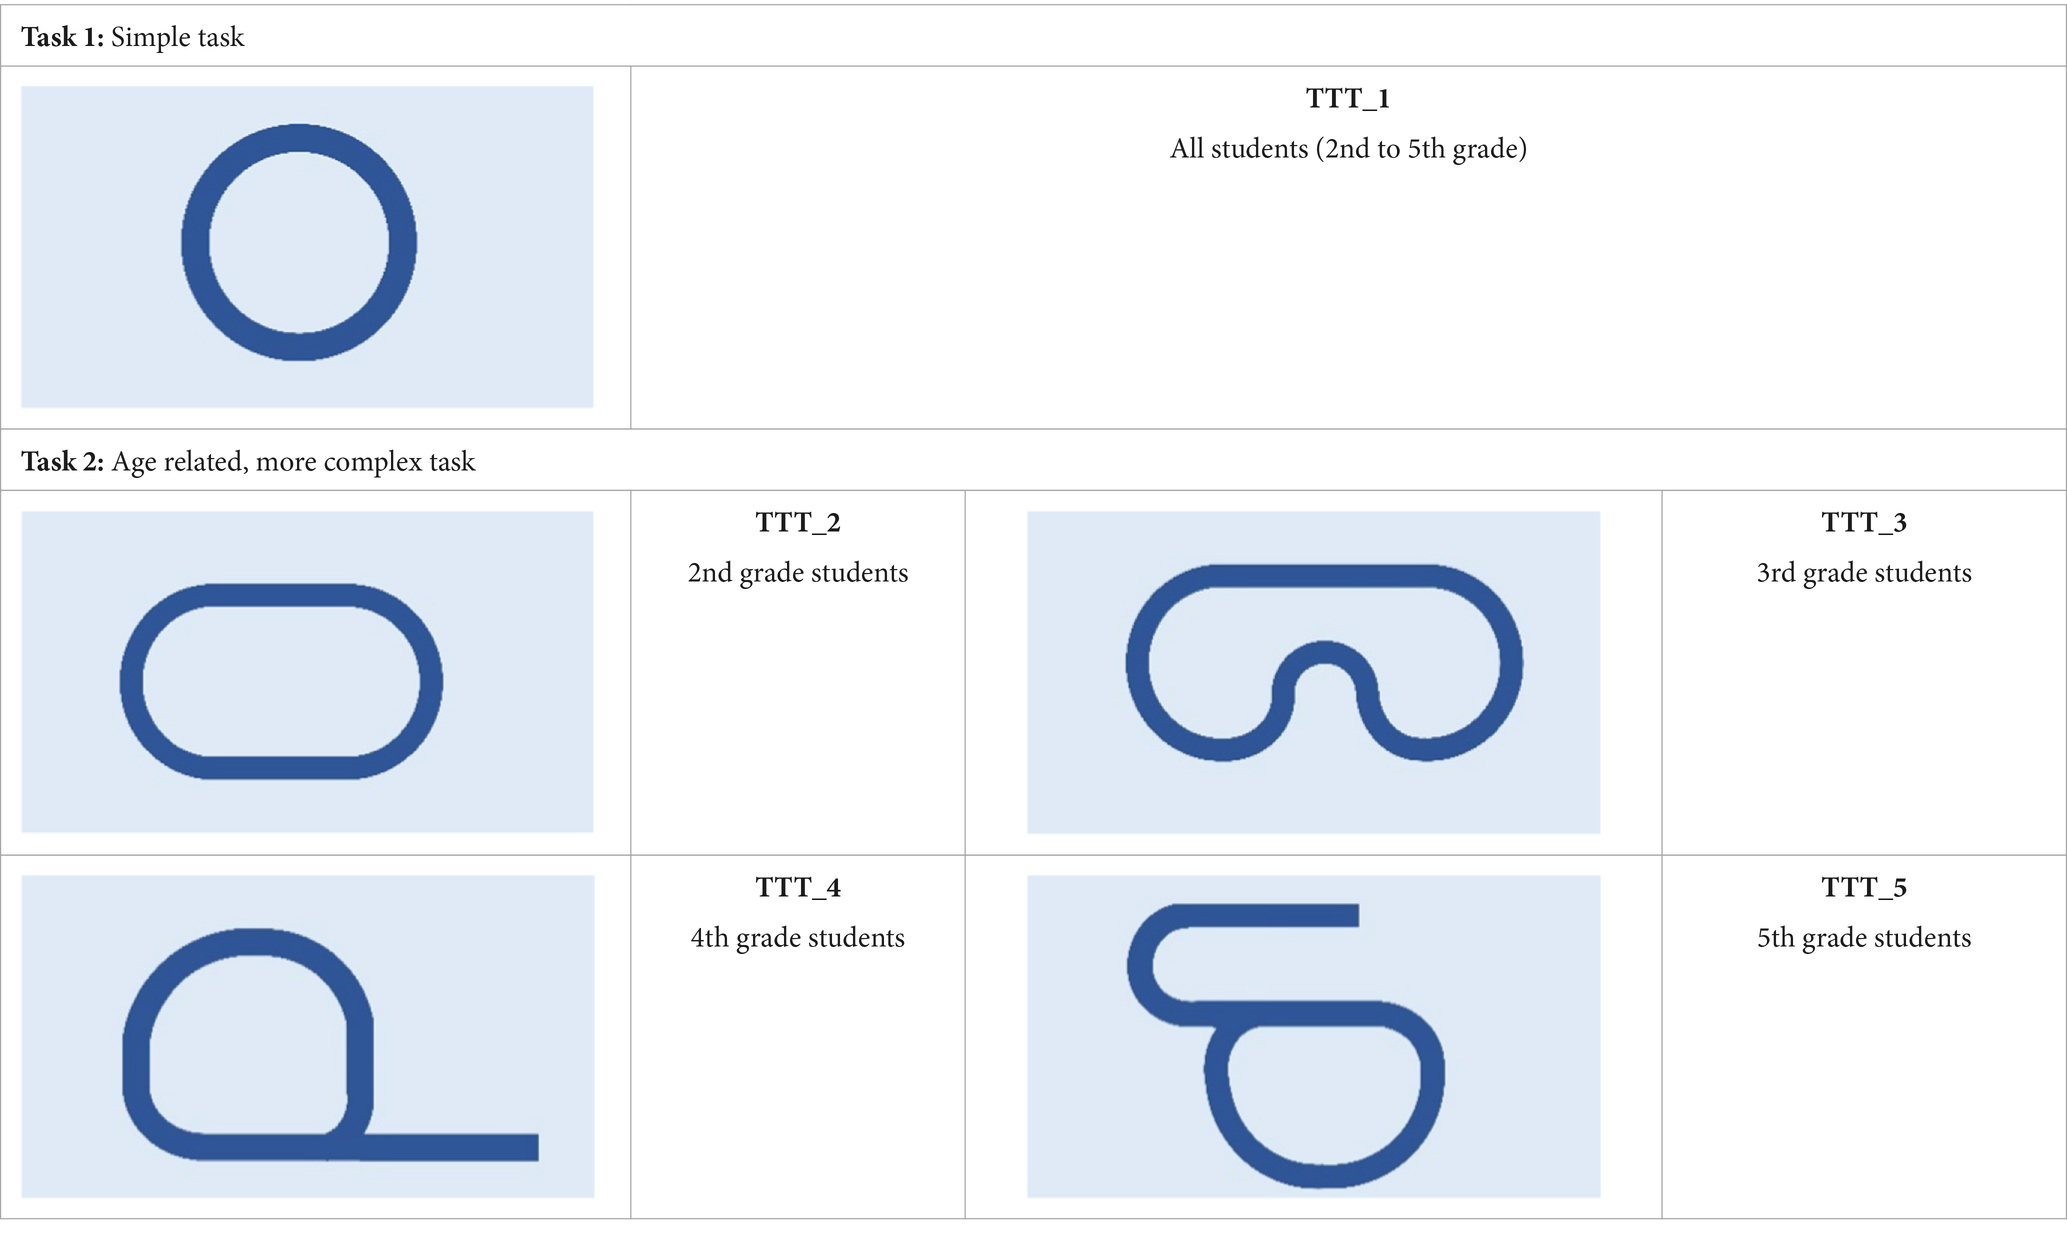
Table 1. Shape plans for the different train track tasks.
3.3 Data
Several researchers in the field of SRL and especially in the current development of log data assessment, have emphasized the advantages of multimethod assessment for validation and evaluation (Saint et al., 2022). To assess metacognitive behavior with various data streams, think-aloud data of students was gathered during the performance of the digital TTT in addition to the log data.
3.3.1 Think-aloud data
Participating children engaged in a think-aloud procedure, where they were asked to verbalize their thoughts, feelings, and actions while performing the TTT. Participants were told once again that the experimenter, who gave the introduction on the phone, could not see what the children were doing. Before working on the task, participating children were trained to think aloud. When students remained silent, experimenters encouraged intensive think aloud with short standardized prompts, such as “please keep on thinking aloud.” Due to COVID-19 social distancing practices children’s think aloud was recorded via telephone and subsequently transcribed. Transferring think-aloud to a remote procedure is an innovative approach, nevertheless, some researchers have already suggested the benefits of this novel approach from the participants’ perspective (Alhejaili et al., 2022).
To identify indicators of monitoring and control, Bryce and Whitebread (2012) developed a coding scheme for analyzing observational data. Codes have extended the existing coding scheme from think-aloud research (Greene and Azevedo, 2009; Vandevelde et al., 2015) as well as by inductive codes to capture metacognition as comprehensively and fine-grained as possible. Three coders were trained in an extensive training followed by an iterative coding process. In this process, sequences of audio data were discussed to achieve a shared understanding of the different codes and to develop potential inductive codes if necessary. Metacognitive statements were coded regularly. This implies that if a child made multiple statements about, for example, discovering errors during task execution, each statement was coded individually unless they were consecutive and referred to the same mistake within the same sentence. This led to a substantial overall agreement (Fleiss Kappa κ = 0.70) for all operationalized metacognitive behaviors coded in the think aloud. Table 4 describes all codes, definitions, and examples of think-aloud protocols.
3.3.2 Log data
The raw log data were provided by the IRTlib software as JSON files in a proprietary format containing a data structure for each raw log event. Log events from three different sources (the deployment software/LTI tool provider IRTlib, the CBA ItemBuilder tasks, and the digital TTT embedded as an extension) were combined in postprocessing into a flat and sparse log data table (see Kroehne et al., submitted for publication) using LogFSM. After processing, all log events contain the core attributes (in which timestamps, event types, element name/task IDs), and additional event-specific attributes for events of a particular type. Event-specific attributes contain precise information on the moved track, coordinates of the moved tracks (start and end coordinates), directions of the rotations, connections between tracks, and a list of the track types in connected track groups were stored per individual and task. The data are sorted by anonymized ID and timestamps. In total, we obtained 19,867 log events for all 85 participants and all tasks. Table 3 shows the average performance time between the start event and the click on the “NEXT” button to end the task and the number of log events per task. Three children did not perform the simple TTT due to technical problems. No information was deleted from the database, as all log events appeared relevant. Cases with very short or very long processing times, as outliers, were also not removed, as it was assumed that these children either had finished the task very quickly or had taken a long time to complete it.
3.4 Analysis
To introduce the digitized TTT and make it available for future research in the field of learning analytics, the analyses, and the detailed descriptions are guided by recent frameworks for log data research in the field of SRL (Järvelä et al., 2019; Roll and Winne, 2015; Saint et al., 2020b; Siadaty et al., 2016; van Laer and Elen, 2018; Winne, 2020). In the first step, the structure of the data was described. The SRL models introduced at the beginning (Nelson and Narens, 1994; Winne and Hadwin, 1998) served as the theoretical basis for the following analyses. The think-aloud and log data analyses are based on the assumption of SRL as a process in various alternating and repeating phases. A distinction was made between three broad phases described in the COPES model (Winne, 2014; Winne and Hadwin, 1998) and overlapping with other common SRL models (Panadero, 2017); namely, orientation, performance, and reflection. Based on the model of Nelson and Narens (1994), we distinguished between monitoring and control at the macrolevel and integrated different strategies and states at the microlevels. First, the think-aloud data were transcribed and coded as described above. In the second step, metacognitive behavior that may occur in the digitized TTT was operationalized using available log event data. Metacognitive states were described based on the theoretical model and the think-aloud data coding scheme. An action and a state library were defined, and actions and states were described. In the third step, actions and states were extracted as low-level features using algorithms formalized as FSM. After preprocessing, differences between the simple and complex tasks and relations between log data and think aloud were analyzed.
4 Results
4.1 Operationalizing SRL
Instead of a statistical approach, a theory-based approach based on previous research was chosen to operationalize potential indicators for metacognitive behavior in the log data. The coding schemes developed based on previous research and the think-aloud data served as the basis for the theory-driven identification of indicators of monitoring and control states in the log data of the digitized TTT. This approach was applied based on the assumption that SRL processes consist of a sequence of observable behavioral events and underlying unobservable states (van Laer and Elen, 2018). This procedure aimed to reduce the potential for misinterpretation of log events and to extract meaningful log events that reflected real-world metacognition.
4.1.1 Derivation of meaningful events in log data
In the first step, all possible log events within the digital environment were explored, and meaningful actions were identified. The initial raw log data were made usable with the help of a video replay. The video replay visualizes the log data of an individual, showing the start and end positions of train track movements, rotations, and zooming, and lists the log events of the buttons. To explore the log data, video replays of 10 participants were recorded. Participants with different task processing times were selected, including some participants with particularly long task performance times and high metacognitive scores in think-aloud coding, to investigate complex behavior and possibly less stringent monitoring and control behavior. ELAN computer software (version 6.7) (Max Planck Institute for Psycholinguistics and The Language Archive, 2023; Lausberg and Sloetjes, 2009) was used to explore and analyze the selected cases. In this first step, a team of at least two trained research assistants separately coded one video and the underlying log data in an inductive manner and commented in ELAN which actions and metacognitive states could be derived from observable events or sequences of events. These preliminary indicators were discussed, and initial operationalization for the metacognitive codes of the think-aloud coding scheme was developed. This procedure was iteratively repeated for 10 participants for 20 tasks. Meaningful actions were extracted, and definitions for metacognitive states and transitions were reviewed, adapted, and optimized until a set of operationalized indicators was obtained. In addition, identified indicators were compared interindividually to review if the present sequence could be interpreted differently in the log data of other individuals. Using video replay and extensive inductive exploration and development of indicators of metacognitive behavior, consistent with previous research and theory, an attempt was made to avoid misinterpretation of the raw log data. In addition, indicators were chosen that required minimal interpretation to remain as close as possible to participants’ actual behavior and reduce subjective judgments. In total, 14 distinguished meaningful actions were defined based on the log events action library. These relevant actions were based on clicks on the different buttons, rotations, movements, and the associated changes in the existing track connections.
During the data exploration with the help of the video replay, the frequency of same events occurring directly one after the other was also determined as a meaningful sequence of actions and indicator for transitions to the different states. Therefore, count indicators were generated in addition to the 14 actions listed above, which are based on the initial events and the resulting connections. Count indicators were created for (a) the actions listed above, (b) the use of the individual tracks, and (c) directions of rotation. If the same event type occurred several times in succession (e.g., move_minus), the count always increased by one. If a different action was executed within a sequence, the count started again at one. For (b) the individual tracks, a count indicator was created according to the same pattern, which counts how often the same track was used in succession. And (c) a count indicator was created for the direction of the rotations, counting how often the participant rotated the track in the same direction in direct succession.
The administration of a particular task always starts with the plan window open; hence, the action “PLAN_CLOSE” is the first action expected for each test-taker. As described above, the actions represent indicators for possible transitions into different metacognitive states. Based on the think-aloud data coding scheme, the state library shown in Table 2 was developed. The state library includes eight metacognitive states on the microlevel, which are assigned to monitoring and control on the macrolevel. In addition, three neutral, technical states are defined.
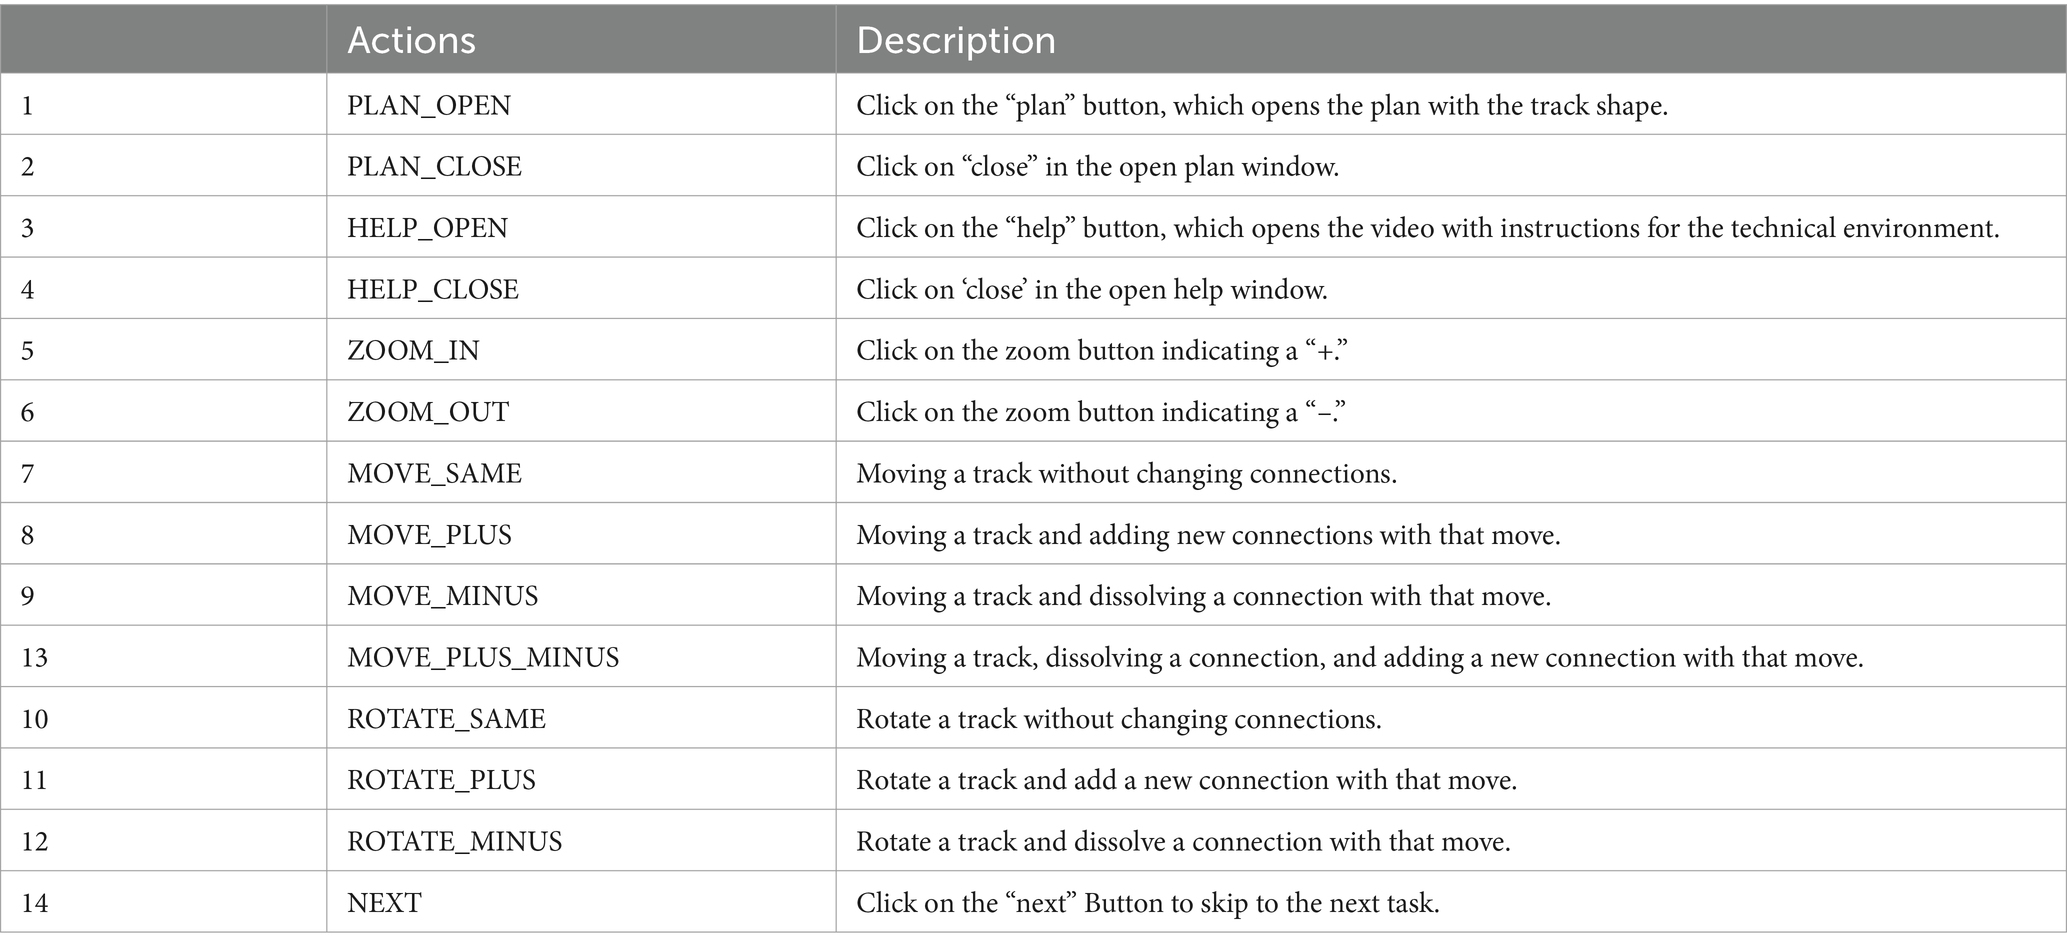
Table 2. Action library.
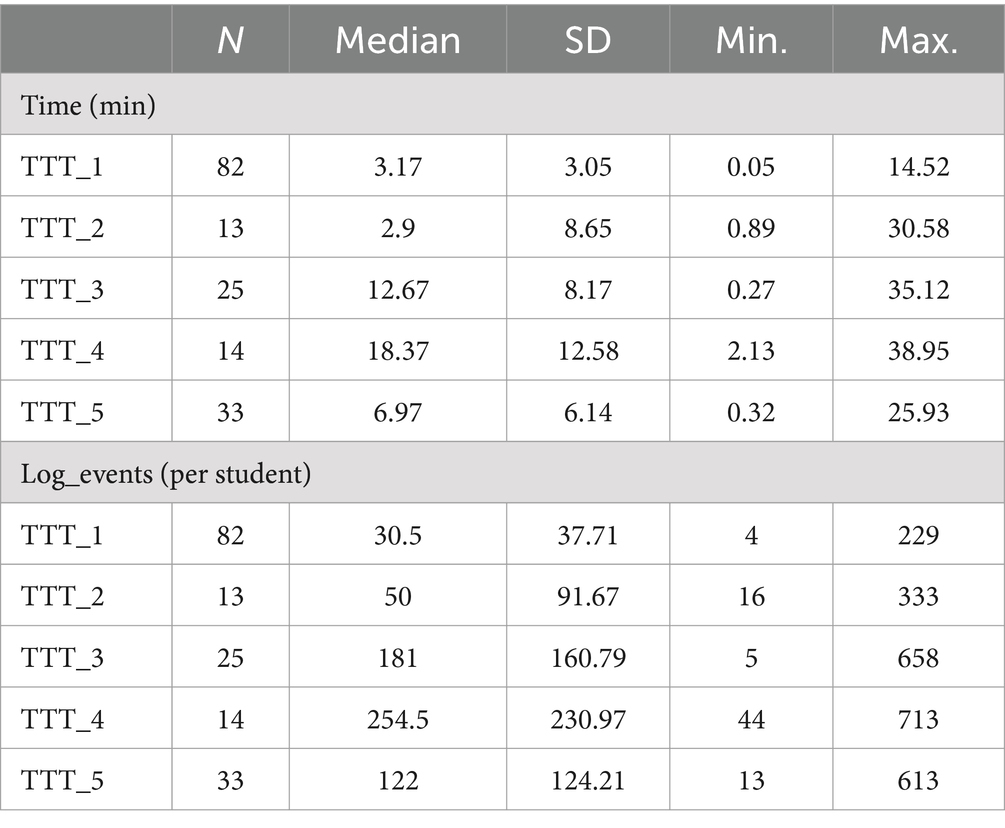
Table 3. Total performance time and the number of log events per task.

Table 4. State library/coding scheme to extract metacognitive states from log data and think-aloud data.
4.1.2 Feature extraction using LogFSM
To extract metacognitive features from the log data using FSM, we utilized the LogFSM R package (Kroehne and Goldhammer, 2018). The automated processing of log events implemented in the R package LogFSM processes the event data for each test-taker event by event, changing the observed state if a transition is defined for a particular event type (and possible event-specific additional attributes), and remains in the identical (current) observed state if no transition is defined. To extract the low-level features from the log data, an algorithm was defined based on the action and state libraries (Tables 2 , 4). Actions were defined as triggers for transition in and out of defined states representing the microlevel metacognition codes. In total, 11 states were defined and extracted with the help of LogFSM, whereby eight states are SRL related. Two states are technical and describe the task processing (startstate and endstate). In contrast, the construction state describes the continuous task performance in which monitoring and control behavior is not identified based on the defined indicators.
4.2 Differences between the simple and the complex task
Based on the definition of SRL as a dynamic process (Winne and Hadwin, 1998) and previous research (Iiskala et al., 2004; Malmberg et al., 2014). It is assumed that students adapt their metacognitive behavior to the task type and difficulty. Guided by the second research question, to investigate to what extent the monitoring and control states extracted from the log data differ in the simple TTT and the complex, age-related TTT analyses based on the frequency, duration, and sequential occurrence of the metacognitive states in the log data were conducted. First, the frequencies and duration of the different states are compared between the two task types. To consider the process nature of SRL, in a second step, transition graphs were used to explore and visualize differences in the process of the simple versus the complex task.
4.2.1 Comparison based on frequency and duration
To examine monitoring and control behavior variations between simple and complex digital TTT, we performed a descriptive statistical analysis, investigating differences in the frequency, duration, and associated proportions of each metacognitive state. With the help of the LogFSM, the total frequency and duration of each state for each participant were extracted. The frequency of each state was determined by counting its total occurrences. State duration represents the cumulative minutes students spent in the state, calculated based on the timestamp information. Since the frequency and duration data were not normally distributed, we report the mean, median, and 25th and 75th percentile values. To compare the differences between the two tasks, Wilcoxon signed-rank tests (with Bonferroni correction) were conducted for pairwise comparison.
The Wilcoxon signed-rank test revealed significant differences in the frequencies in the metacognitive states between the two tasks (see Table 5). The negative Z-value indicates a consistent and significant increase in the occurrence of most of the states during the performance of the complex digital TTT. However, the SEEKING_HELP and the TECHNICAL_ORIENTATION, operationalized by clicking on the help button in different phases of the SRL process, occurred significantly less when working on the complex task. This seems reasonable, as the complex task was carried out directly after the simple task, and the children were, therefore, already familiar with the technical functions. The Wilcoxon signed-rank test on differences about the relative frequencies also showed significant differences across all states. However, analyzes revealed a change in the direction for SEARCH_SORT_MAKESPACE and the neutral CONSTRUCTION state. Although, overall, these states occurred more frequently while the students were working on the complex task, they were more frequent in the simple task in relation to the total number of states. This indicates the sensitivity of the digital TTT to measure differences in monitoring and controlling the behavior of young students during simple and more complex tasks.
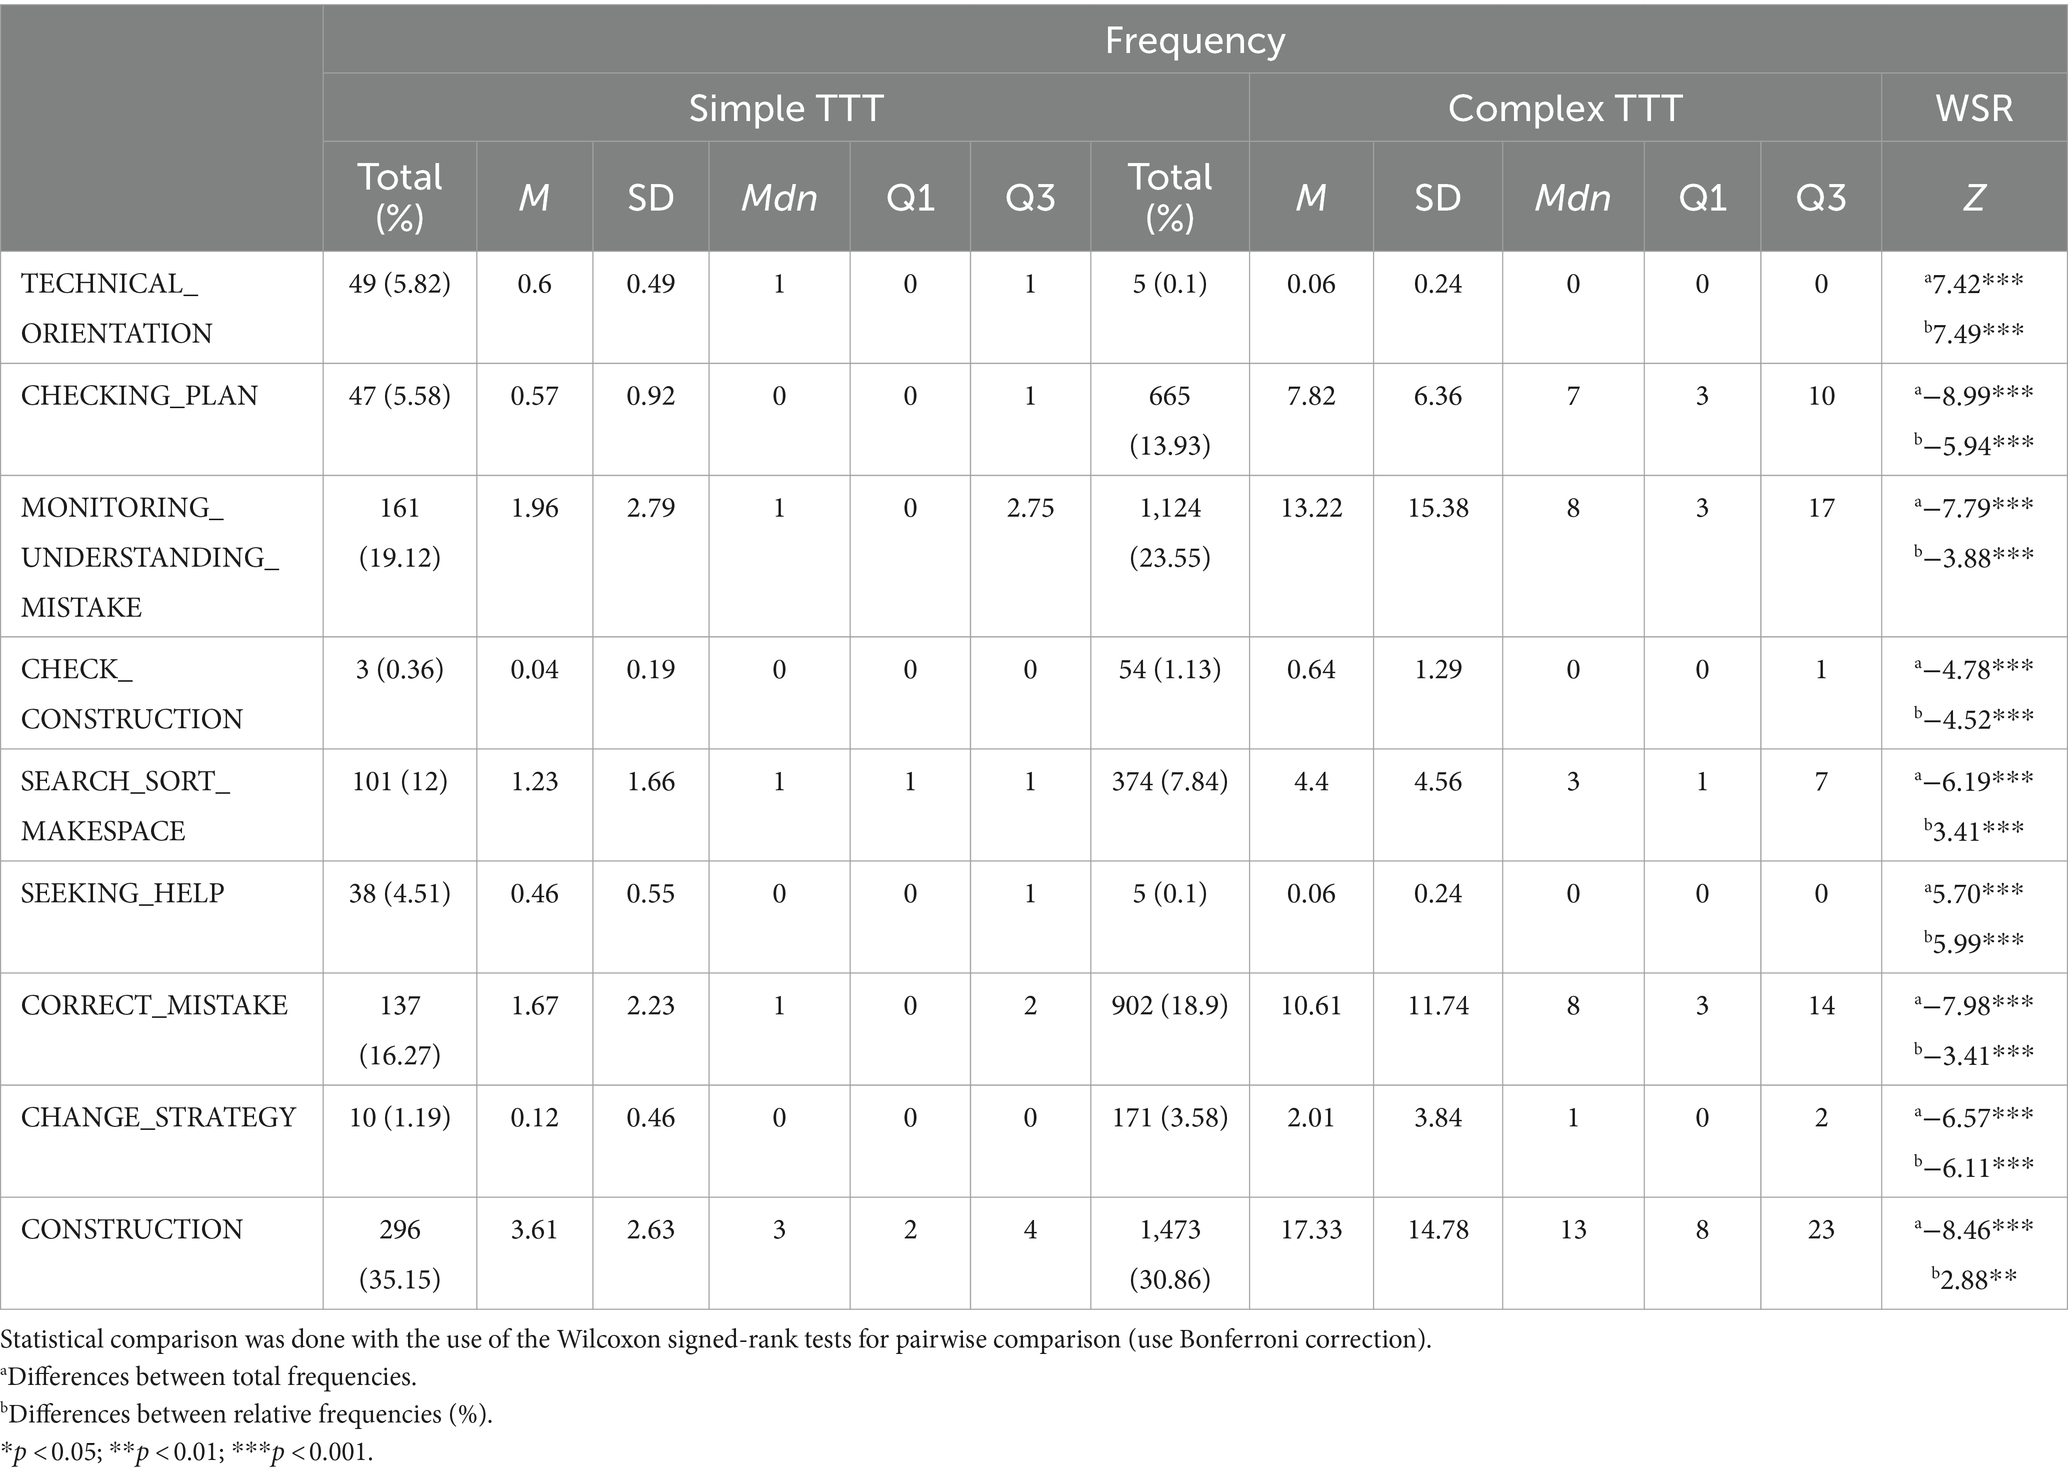
Table 5. Descriptive statistics of the frequencies of metacognitive state entries extracted from the log data.
In addition, Wilcoxon signed-rank tests also demonstrated a significant increase in duration in the states CHECKING_PLAN, MONITORING_UNDERSTANDING_MISTAKE, CHECK_CONSTRUCTION, SEARCH_SORT_MAKESPACE, CORRECT_MISTAKE, CHANGE_STRATEGY and CONSTRUCTION in the complex task compared to the simple task. Moreover, the duration comparison showed that the children also spent more time in the states TECHNICAL_ORIENTATION and SEEKING_HELP during the simple task than during the complex task. The comparison of the proportional time spent in the different states between the two task types also revealed significant differences across nearly all of the metacognitive states, with the same pattern as in the comparison of the total duration. However, this analysis reveals a different pattern regarding the state SEARCH_SORT_MAKESPACE. In relation to the total duration, the participating children spent almost the same proportion of time searching, sorting, or making space in the two task types.
As Table 6 illustrates, even the comparison of simple metrics, such as the proportional durations, gives valuable insights into the SRL process and shows that children spend a higher percentage of time looking at the plan, monitoring, and correcting mistakes in the complex task. These findings underscore task-specific variations in children’s metacognitive behavior and the potential of the introduced digitized TTT to measure such differences.
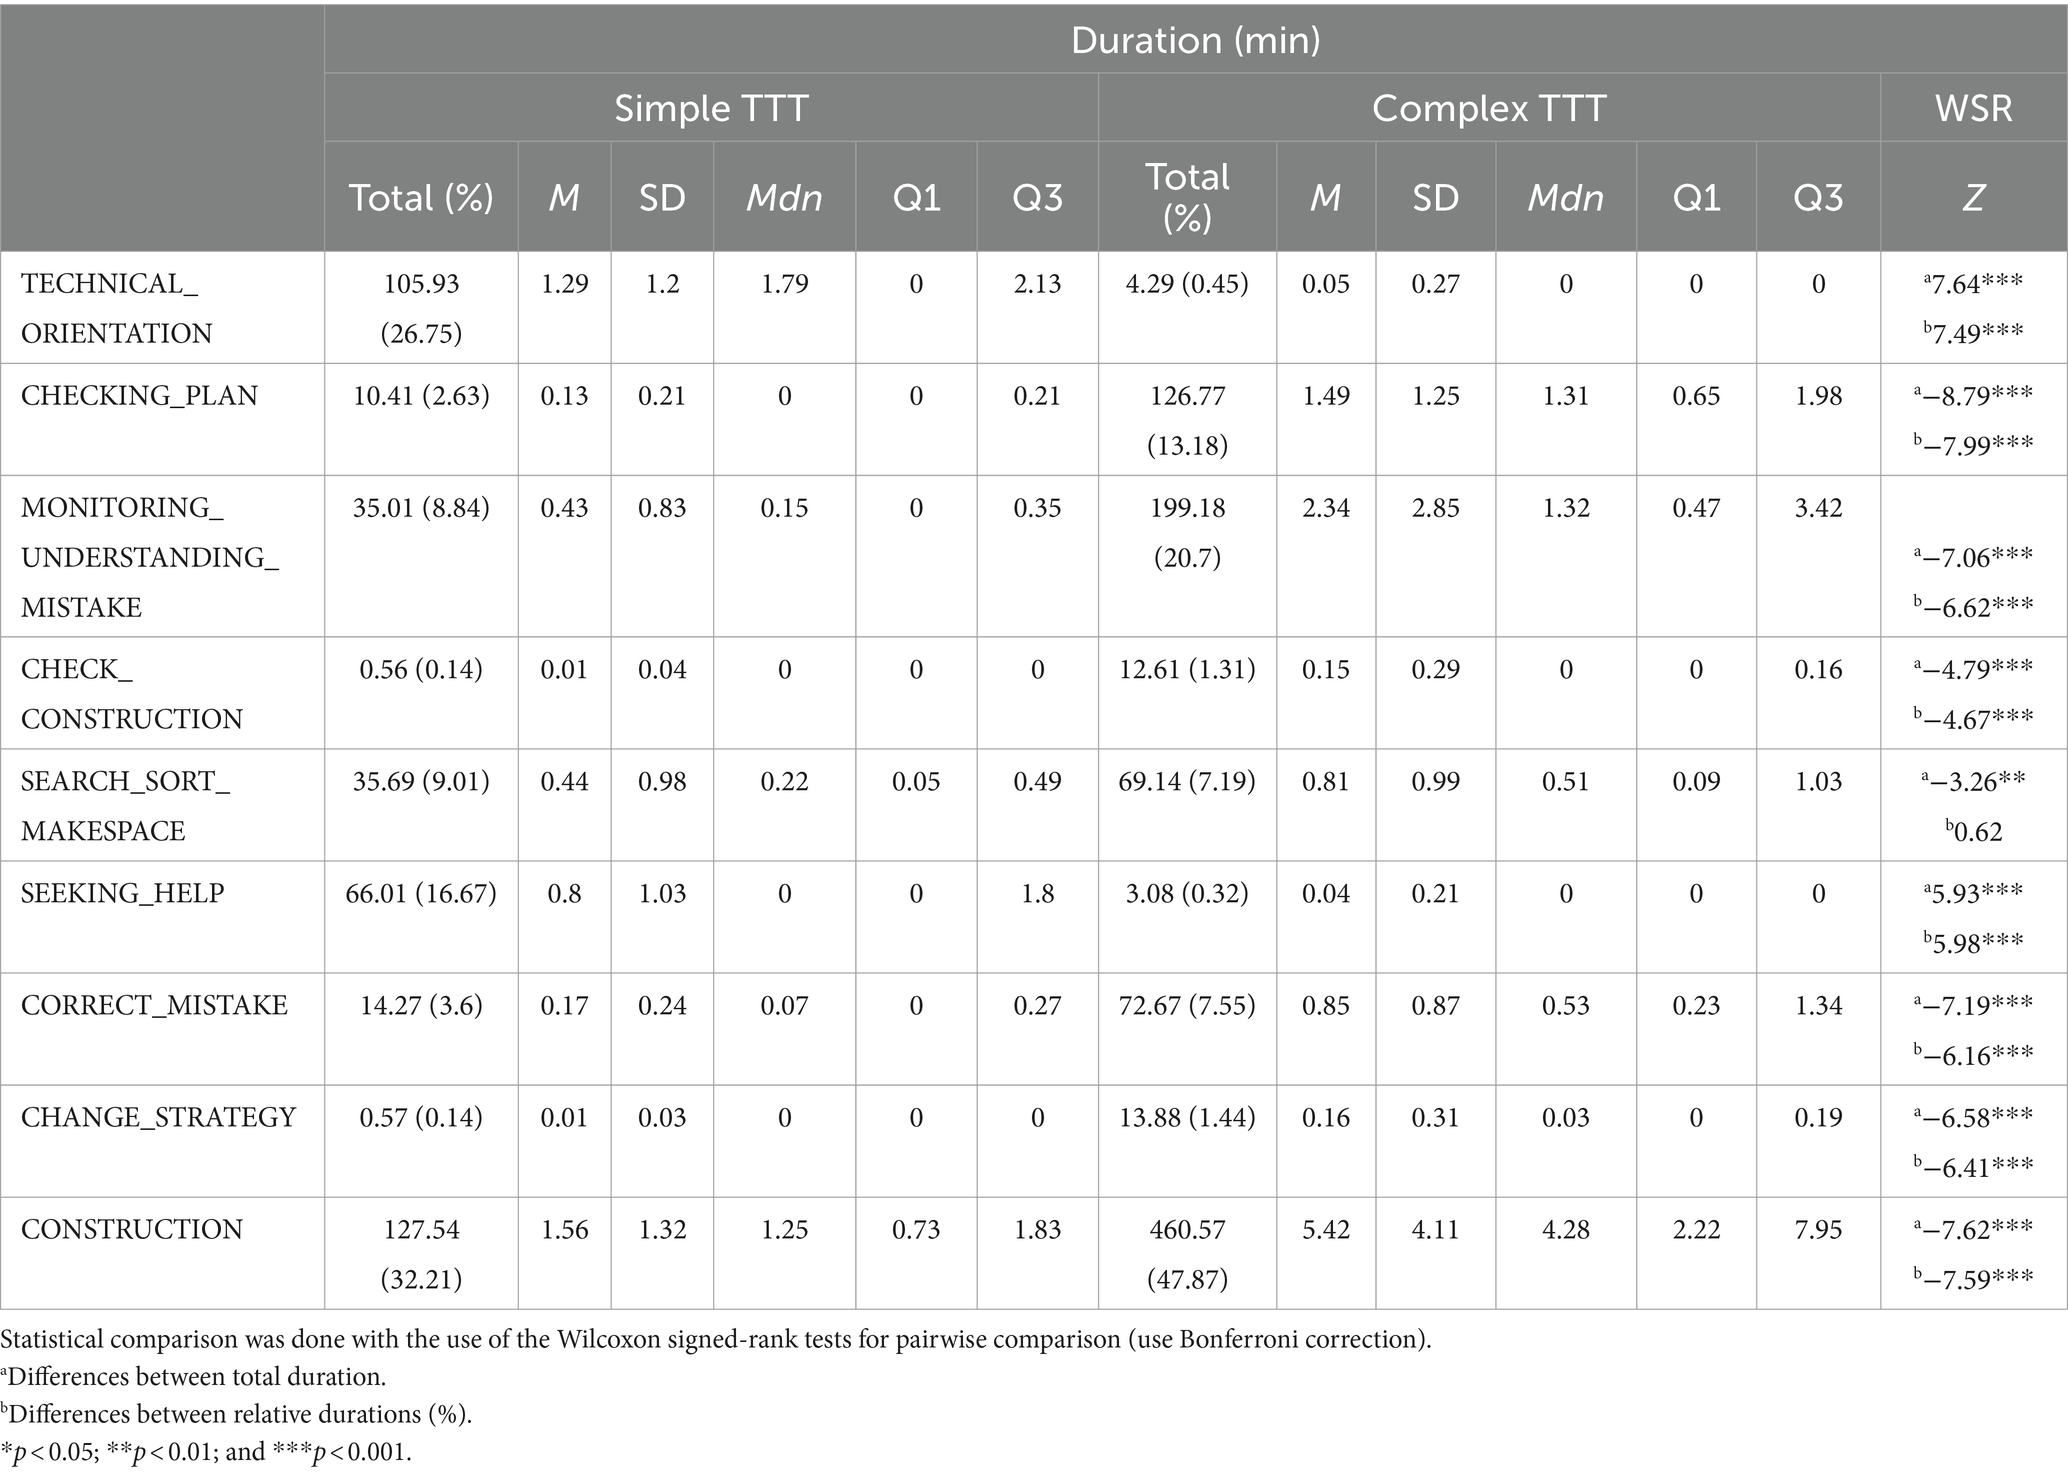
Table 6. Descriptive statistics of the durations in the metacognitive states extracted from the log data.
4.2.2 Comparison based on transition
Transition graphs were utilized to investigate differences in the sequential characteristics of the metacognitive processes during the simple and the complex TTT. They provide a helpful visualization to explore the data and identify meaningful patterns. DigrammeR package in R was used to create the generic visualization of the LogFSM results. The graph nodes were defined as the states, while transitions, displayed by arrows, showed the empirically observed transitions. The indicated weight of the path relates to the proportion (the transition frequency divided by the total number of all transitions from this state). Accordingly, the sum of all outgoing paths from one state node is 1.0. However, rounding the independent probabilities for the transition paths may result in an inaccuracy of 1% for the sum of all transitions (0.99 or 1.01 instead of 1).
As the frequency and the duration analyses are already suggested, the transition graph of the simple TTT shows the relevance of the states TECHNICAL_ORIENTATION in the orientation phase and SEEKING_HELP during task performance (see Figure 3). In more than half of the cases, participating children opened the help video at the beginning of the task performance, while in 34% of the total transitions, children changed directly to the CONSTRUCTION state after starting the task performance. The simplicity of the shape is demonstrated by the fact that only 25% of the participants reopened the plan after TECHNICAL_ORIENTATION at the beginning of the task; only 7% did so directly after starting, and merely 8% of the transition from CONSTRUCTION led to CHECKING_PLAN. Moreover, the transition graph shows that, in most cases, CORRECT_MISTAKE directly followed the MONITORING_UNDERSTANDING_MISTAKE state (83%). Interestingly, a third of the transitions from CHECK_CONSTRUCTION led to the end state. This could be an indicator for evaluating the own task performance, by, for example, comparing the own construction to the shape plan before finishing the task.
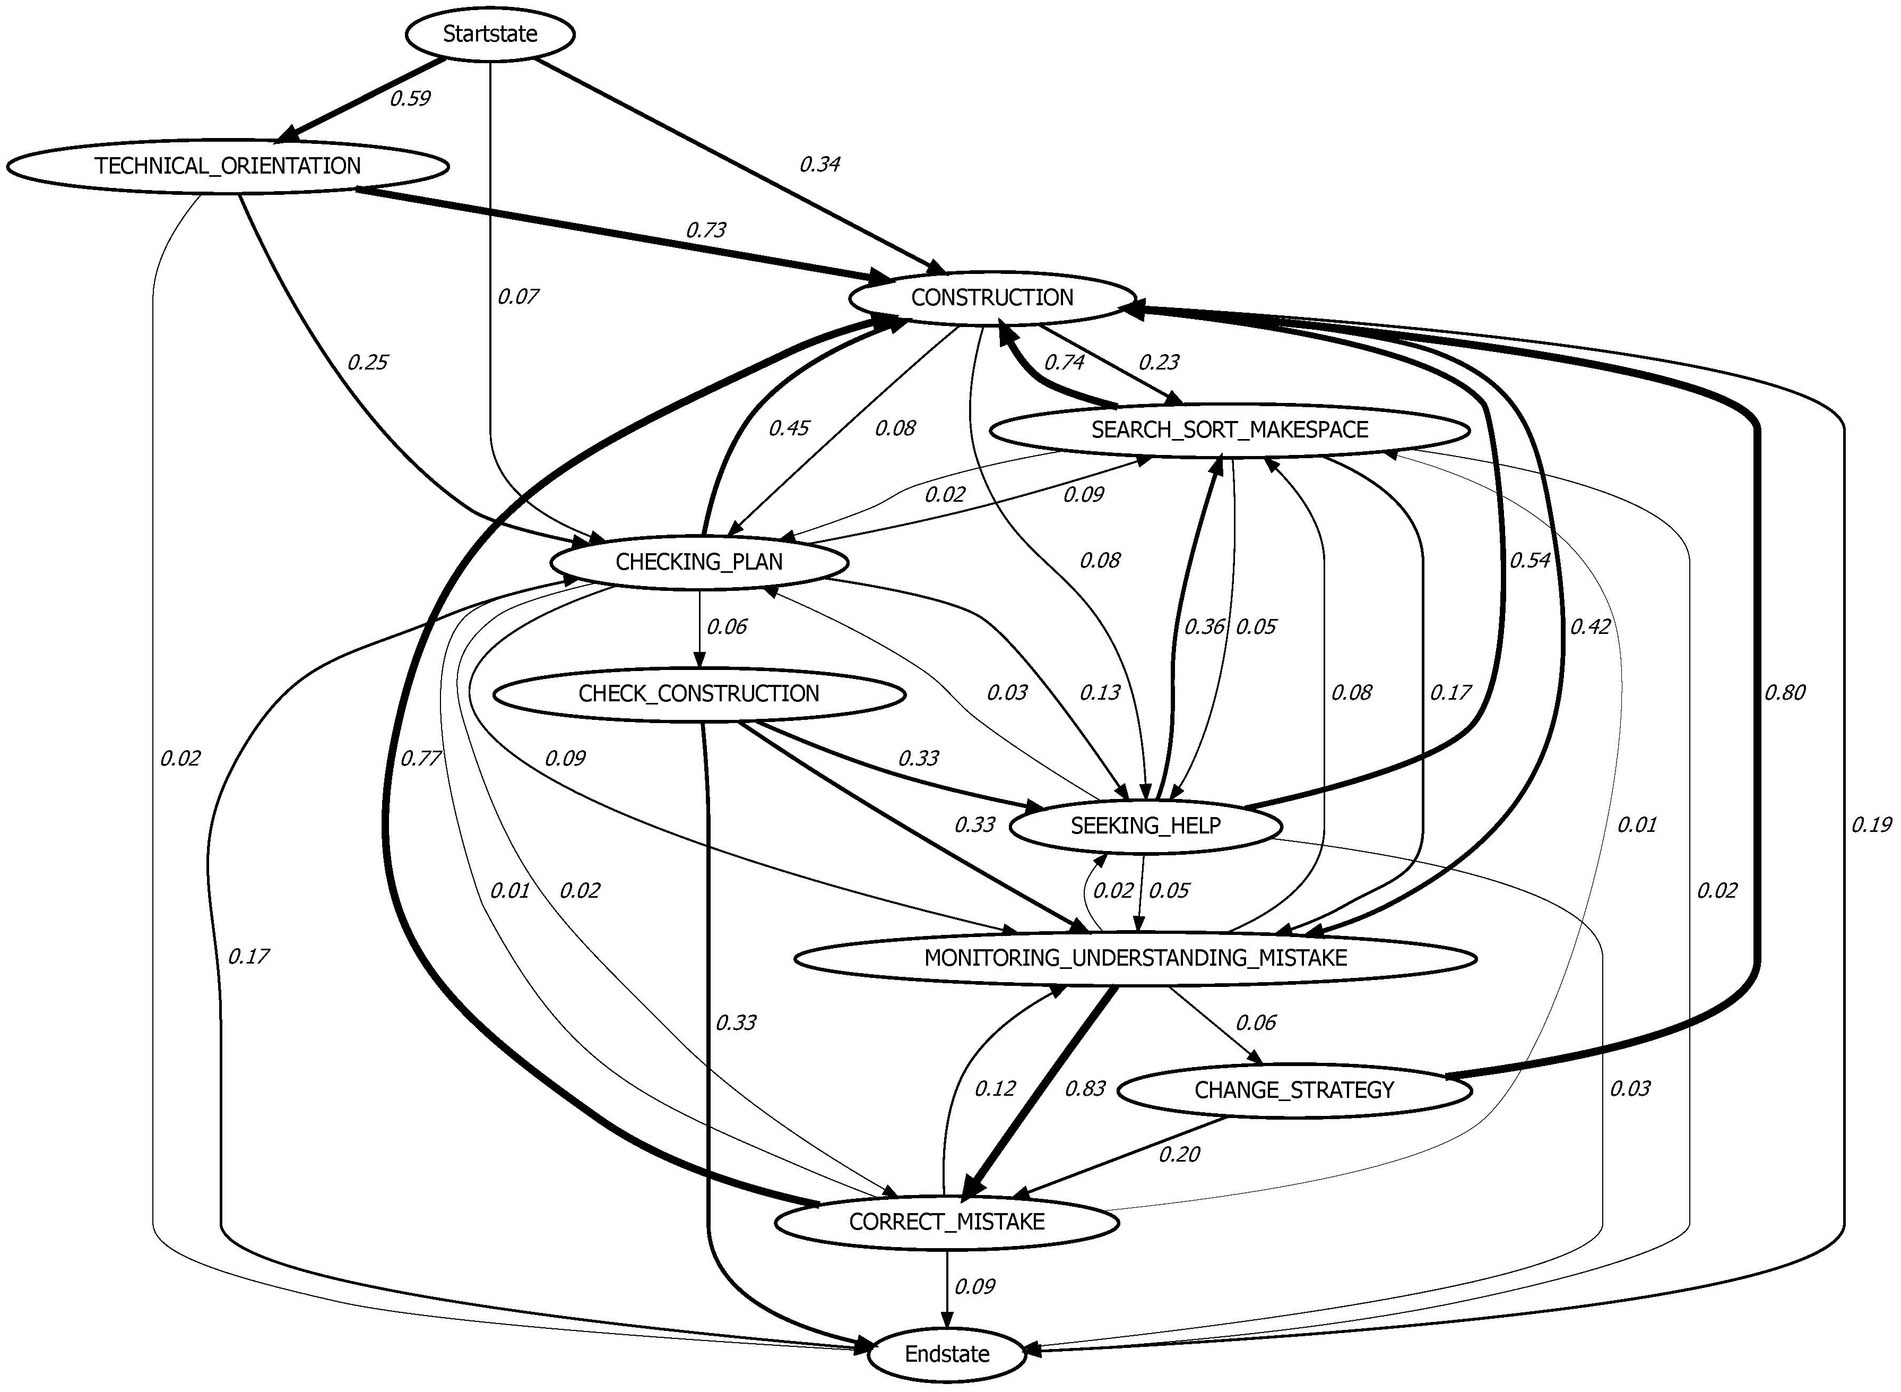
Figure 3. Transition graph simple TTT.
Compared to the simple TTT, most children directly transferred to the CONSTRUCTION state after the start of the complex TTTs (see Figure 4). However, 40% of all transitions from the start state in the complex TTTs lead to CHECKING_PLAN, which suggests that the given shape was indeed more difficult in this task (see Figure 4). Compared to the simple task (42%), participating children changed more often from CONSTRUCTION state to MONITORING_UNDERSTANDING_MISTAKE in the complex tasks (50%). This also applies to the transition from CHECKING_PLAN to MONITORING_UNDERSTANDING_MISTAKE. While in the simple task, only 9% of the transition from the CHECKING_PLAN state leads to the MONITORING_UNDERSTANDING_MISTAKE state, this appears in 19% of the cases in the complex tasks. The transition graph of the complex TTTs visualizes the higher proportion of monitoring and control loops in these complex tasks compared to the simple digitized TTT.

Figure 4. Transition graph complex TTTs.
4.3 Relations log data and think-aloud data
To evaluate the potential of the digital TTT to assess metacognitive behavior, relations between the monitoring and control behavior extracted from the log data and the think-aloud data were investigated. To that end, frequency scores of the different extracted metacognitive states coded in the log data and the think-aloud data were compared, and correlation analyses were carried out. The frequency distributions provide a simple count-based measure of metacognitive behavior in the two data streams. The analysis of Wilcoxon signed-rank tests and correlative analysis of this simple metric emphasizes the practical value while also showing their limitation.
A comparison of the average frequencies with which metacognitive behavior is extracted from the two data streams showed that most states of metacognitive behavior appeared more often in the log data than in the think-aloud data (see Appendix Tables A1, A2). Results of Wilcoxon signed-rank (see Appendix Table A1) show significant differences in all metacognitive behaviors, in addition to CHECK_CONSTRUCTION and SEEKING_HELP. Although some operationalization in the log data of metacognitive behavior could be questioned (e.g., change strategy as a more complex behavior), the code CHECKING_PLAN, for example, shows a very specific and clearly defined operationalization (click on the “PLAN” button). Removing train tracks from an existing construction, as an indicator for MONITORING_UNDERSTANDING_MISTAKE in the log data, also provides a rather unambiguous interpretation. The differences, therefore, suggest incomplete reports of monitoring and control in the think aloud.
Despite differences in the frequencies, the validity of the extraction of the states SEARCH_SORT_MAKESPACE (r = 0.25, p < 0.05), CORRECT_MISTAKE (r = 0.38, p < 0.01), CHANGE_STRATEGY (r = 0.44, p < 0.01), CHECKING_PLAN (r = 0.62, p < 0.01) and MONITORING_UNDERSTANDING_MISTAKE (r = 0.62, p < 0.01) in the log data is strengthened by significant correlations between the two data streams (see Appendix Table A2). However, different findings emerge for the three states TECHNICAL_ORIENTATION, CHECK_CONSTRUCTION, and SEEKING_HELP. As indicators for TECHNICAL_ORIENTATION clicks on the “help” button at the beginning of the task (log data) and the coding of statements on task exploration and technical exploration at the beginning of the task (think aloud) were related. The think-aloud data showed more statements on average, and no significant correlation was found for TECHNICAL_ORIENTATION (r = 0.07, p > 0.05) between these two assessment methods. This suggests that there might be more actions in the log data, which indicate task orientation and which have not yet been defined in the FSM or that it might be difficult to find indicators for students’ task orientation based on the exclusive log data. The non-significant correlation between CHECK_CONSTRUCTION (r = 0.18, p > 0.05) extracted from the log data and the think-aloud data highlights challenges in the operationalization of this state. Compared to all states, CHECK_CONSTRUCTION was coded least frequently in the think-aloud protocols and also appeared rather rarely in the log data. It seems possible that this state is generally more difficult to operationalize and, therefore, does not provide a good indicator for monitoring. SEEKING_HELP also occurred rather rarely. In this context, the various ways of seeking help by children during think aloud were reduced to asking adults for help or non-directed seeking help. Nevertheless, the non-significant correlation (r = 0.09, p > 0.05) is intelligible, as in the think-aloud protocols, different strategies for seeking help are involved. Appendix Table A2 replays the mean, standard deviation, and correlation coefficients of all states extracted in the two data streams.
5 Discussion
The aim of this study was to introduce the digital TTT as an innovative instrument to assess young students’ SRL in a multimethod way by drawing on think-aloud and log data. So far, only a few studies have analyzed log data from young learners on SRL (Saint et al., 2022).
Based on the models of Winne and Hadwin (1998) and Nelson and Narens (1994) and previous research with the original TTT and think-aloud research (Bryce and Whitebread, 2012; Vandevelde et al., 2015), an action and a state library were developed to extract metacognitive behavior from the log data. Unlike earlier studies that mainly examined cognitive strategies such as reading and note-taking based on log data (Malmberg et al., 2014; Munshi et al., 2018) to infer metacognitive processes (Kinnebrew et al., 2013), our study operationalized direct indicators of metacognitive behavior.
We found that similar metacognitive behaviors could be extracted from the digitized TTT as in studies with the original observational task (Bryce and Whitebread, 2012; Spektor-Levy et al., 2017; Tzohar-Rozen et al., 2021). Based on the pure log data, several of the monitoring behaviors also investigated in previous observation research could be operationalized (e.g., technical orientation, checking plan, check construction, and monitoring mistakes), whereas some monitoring strategies (e.g., checking own, self-questioning, and comment) (Bryce and Whitebread, 2012) were difficult to directly extract from the log data. In addition, it was possible to operationalize and extract some of the control behavior assessed with the initial observational TTT (Bryce and Whitebread, 2012) for the analysis of log data.
However, a comparison of the developed state library with previous studies using the original TTT (Bryce and Whitebread, 2012) and other log data studies (Bannert et al., 2014; Saint et al., 2020a) shows that the current digital implementation of the TTT does not allow for any direct indicators of planning, as an important SRL strategy. Our findings, in line with previous researchers (Roll and Winne, 2015; van Laer and Elen, 2018), underline the challenges to operationalize and extract all aspects of the complex SRL process. The extracted states in this study mainly belong to the orientation and performance phase of the common SRL models. This is in line with previous research and reviews like Viberg et al. (2020) pointing out that there is research from the field of learning analytics missing related to the evaluation and reflection phase. Nevertheless, it seems possible to extract reflective and evaluation behavior from the TTT log data in future research, based on the states extracted in this study; for example, by using additional FSMs or other statistical analysis methods. All in all, the operationalized monitoring and control states in this study show consistency with metacognitive behavior identified in other SRL log data research across diverse digital learning environments (Bannert et al., 2014; Du et al., 2023). Overall, log FSM proved to be a helpful tool for defining the indicators for state transitions and extracting the operationalized metacognitive states from the log data.
In the comparative analysis of the extracted metacognitive states in the simple and the complex TTT, significant differences emerged. These differences indicate that the digitized TTT has the potential to sensitively measure various SRL processes in young students, for example, depending on the difficulty of the tasks. The analysis revealed that children exhibited monitoring and control behavior, both in total and relatively more frequently, during the complex TTT. This aligns with previous findings regarding differences in task performance (Iiskala et al., 2004) and gives new insights into intra-individual differences in students’ strategy use investigated by other researchers (Malmberg et al., 2014). In addition to the comparison of frequency and duration, simple transition graphs were used to explore the sequential occurrence of monitoring and control. Even if this is a rather simple, explorative analysis of the SRL process, the comparison of the two graphs already provides insights into the different metacognitive processes during simple and complex tasks, suggesting a greater relevance of monitoring and checking the plan during the performance process of complex TTT. As already demonstrated in other studies (Saint et al., 2020a; Siadaty et al., 2016), transition graphs have proven to be an insightful method for comparing and identifying differences in SRL processes.
The significant correlations between the think-aloud data and the log data regarding a variety of operationalized metacognitive states support the validity of the digital TTT. However, the non-significant relation between TECHNICAL_ORIENTATION, CHECK_CONSTRUCTION, and SEEKING_HELP extracted in the log data and the think-aloud data suggests that the operationalization of these states does not yet align well in the different datasets. Overall, the findings are consistent with previous studies that combined think-aloud and log data, indicating both overlaps and potential for complementarity (Fan et al., 2023).
5.1 Limitations and future directions
While the present study contributes valuable and innovative insights into the assessment of SRL in young learners, it is important to acknowledge limitations that may impact the interpretation and generalizability of the findings. The study’s sample size was relatively small, limiting the generalizability of the findings. Future research with larger samples could strengthen the comprehensive understanding of SRL processes in young learners. Moreover, the focus of the study was on primary school students, which may restrict the applicability of the findings to older age groups. Investigating SRL with the log data of the digitized TTT in a wider age range, for example, secondary school students or preschool children could elucidate developmental trajectories and differences in metacognitive abilities across different stages of childhood and adolescence. The rationale for the design of the different tasks was based on previous research using the TTT as an observation method and the track circles already evaluated in these studies (Spektor-Levy et al., 2017). However, the average performance time and the average log events of the five different tasks indicate that the digital TTT may not have reached an adjusted level of difficulty for each age group, in particular the 5th graders. Future research is needed to further evaluate the difficulty levels of different digital TTT tasks and the age-appropriate assessment of SRL with digital TTT.
Despite the advantages of a simple and replicable task, the digital TTT may not fully capture the complexity of real-world learning situations. Even if a meta-analysis has strengthened the non-reactivity of think aloud (Fox et al., 2011), standardized short prompts were used, and efforts were made to ensure the validity and reliability of the measurement of the digitized TTT; inherent limitations, such as uncontrolled environmental variables, may affect the accuracy of the data collected.
Future research could employ additional measures (such as eye tracking) and evaluate the digital TTT in a more controlled surrounding to strengthen the robustness of the findings, in particular, the interpretation of log events into real-world metacognitive behavior. In addition, further research is needed to investigate the effects of the different modes of think aloud (face-to-face vs. remote/telephone).
Furthermore, as a limitation, this study did not include an assessment of participants’ cognitive resources, such as cognitive load, which have been shown to be relevant in the context of SRL and metacognition (e.g., Wang and Lajoie, 2023). In addition, participants’ spatial reasoning (e.g., Rimbatmojo et al., 2017), executive functions (e.g., Roebers, 2017), verbal and non-verbal cognitive abilities (e.g., Bohlmann et al., 2015; Tzohar-Rozen et al., 2021) might impact students’ cognitive load during the performance of the digital TTT and also the assessed metacognitive behavior with the recorded log data. Future studies and replications should, therefore, integrate the assessment of these constructs to control for cognitive abilities and provide an accurate explanation of inter- and intra-individual differences in SRL measured with the digital TTT.
In addition, collaborating with educators and implementing the use of digital TTT in school to assess and promote SRL could bridge the gap between theory and practice. The analyses presented here aimed to introduce and evaluate the task but did not take into account the full potential of additional data streams, such as the corresponding think-aloud data, to elucidate influences, such as beliefs or external circumstances on the SRL approach during task processing. As argued by several researchers, the exclusive use of online measures may be missing possible explanatory context factors or reasons for the observed behavior (Fryer and Dinsmore, 2020; Winne, 2010, 2020). Given the challenge that actions recorded with log events might not be unambiguous (Roll and Winne, 2015), the exclusive use of log data from the digital TTT to explore its potential to measure SRL cannot guarantee the absence of misinterpretations of log events. Even though a comprehensive approach was used to extract the most objective indicators of metacognitive behavior, some operationalized log events might not represent metacognitive states in reality, or some actual metacognitive behaviors of students were missed altogether. Further data triangulation, with additional data streams, such as think aloud, will offer insights into the underlying beliefs, strategies, reasons, and external factors influencing individuals’ problem-solving approaches. This strengthens the need for multimethod research to further explore the influence of additional factors, which are hard to assess with log data solely (Fryer and Dinsmore, 2020; Winne, 2020).
5.2 Implications and applications
The research using log data to assess SRL is currently experiencing rapid development. While technology now enables easy and efficient collection of log data, an increasing number of analytical methods are being explored, providing exciting insights into the complex SRL process. However, as with most SRL assessment methods, there has been a strong focus on older students in current log data research (Saint et al., 2022). The present study offers an innovative method for capturing SRL using log data already created by young learners. The application of FSMs for the extraction of SRL-related states presented in this study is only a first, simplified approach that can be further extended. For example, additional states can be extracted by using further FSMs that build on each other. Future research using FSM for SRL research could, therefore, contribute to a better representation of the interconnected SRL processes. Additionally, by transparently presenting the task, providing a methodological approach for simple extraction of metacognitive states using FSM, and making the task available for interested researchers, we provide a replicable assessment method.
The task has the potential to be supplemented by more complex tasks for older students, thus capturing developments in metacognitive abilities beyond elementary school. Refined operationalization or additional technical features (e.g., additional buttons) can also allow an even finer-grained analysis of SRL processes. As pointed out by a review of Viberg et al. (2020), there is still research missing on implementing learning analytics to support students’ SRL. The digital TTT has the potential to advance the SRL assessment of young students and provide a digital environment for transferable research. Future automatic real-time evaluation of task performances could also be made useful for teachers to identify SRL deficits. The task also offers the potential to implement direct feedback, thus promoting children’s metacognition (e.g., reminding them to check the plan or to review the construction again) in line with learning analytics. Moreover, the task has the potential to be applied in various flexible contexts, at home, at school, or in laboratory research with additional promising measurements such as eye tracking.
The study presents an innovative task to assess SRL, particularly metacognitive behavior, of young students with the help of log data. The development of the digital TTT and the transparent and clear operationalization for the corresponding log data are promising tool for uncovering patterns of SRL in log data. It shows the transformative potential of learning analytics in the field of SRL assessment.
Data availability statement
The raw data supporting the conclusions of this article will be made available by the authors, without undue reservation.
Ethics statement
The studies involving humans were approved by the Ethics Commission of the DIPF Leibniz Institute for Education Research and of the IDeA Research Center. The studies were conducted in accordance with the local legislation and institutional requirements. Written informed consent for participation in this study was provided by the participants' legal guardians/next of kin.
Author contributions
BB: Conceptualization, Formal analysis, Investigation, Methodology, Project administration, Writing – original draft, Writing – review & editing. UK: Software, Writing – review & editing. CD: Conceptualization, Funding acquisition, Methodology, Project administration, Supervision, Writing – review & editing.
Funding
The author(s) declare that financial support was received for the research, authorship, and/or publication of this article. This work was supported by the Deutsche Forschungsgemeinschaft (DFG, German Research Foundation [Grant No. 429624323]). The article was funded by the Open Access Publication Fund of Goethe University Frankfurt am Main.
Acknowledgments
We gratefully acknowledge the technical implementation of the digital TTT and the video replay for the corresponding log data of Felix Wagner. We would like to thank Donna Bryce for providing supervision on the development of the digital TTT.
Conflict of interest
The authors declare that the research was conducted in the absence of any commercial or financial relationships that could be construed as a potential conflict of interest.
Publisher’s note
All claims expressed in this article are solely those of the authors and do not necessarily represent those of their affiliated organizations, or those of the publisher, the editors and the reviewers. Any product that may be evaluated in this article, or claim that may be made by its manufacturer, is not guaranteed or endorsed by the publisher.
Supplementary material
The Supplementary material for this article can be found online at: https://www.frontiersin.org/articles/10.3389/feduc.2024.1388202/full#supplementary-material
References
Alhejaili, A., Wharrad, H., and Windle, R. (2022). A pilot study conducting online think aloud qualitative method during social distancing: benefits and challenges. Healthcare 10, 1–12. doi: 10.3390/healthcare10091700
Anthonysamy, L., Koo, A.-C., and Hew, S.-H. (2020). Self-regulated learning strategies and non-academic outcomes in higher education blended learning environments: a one decade review. Educ. Inf. Technol. 25, 3677–3704. doi: 10.1007/s10639-020-10134-2
Azevedo, R. (2009). Theoretical, conceptual, methodological, and instructional issues in research on metacognition and self-regulated learning: a discussion. Metacogn. Learn. 4, 87–95. doi: 10.1007/s11409-009-9035-7
Azevedo, R. (2014). Issues in dealing with sequential and temporal characteristics of self- and socially-regulated learning. Metacogn. Learn. 9, 217–228. doi: 10.1007/s11409-014-9123-1
Bannert, M., and Reimann, P. (2012). Supporting self-regulated hypermedia learning through prompts. Instr. Sci. 40, 193–211. doi: 10.1007/s11251-011-9167-4
Bannert, M., Reimann, P., and Sonnenberg, C. (2014). Process mining techniques for analysing patterns and strategies in students’ self-regulated learning. Metacogn. Learn. 9, 161–185. doi: 10.1007/s11409-013-9107-6
Biswas, G., Segedy, J. R., and Bunchongchit, K. (2016). From design to implementation to practice a learning by teaching system: Betty’s brain. Int. J. Artif. Intell. Educ. 26, 350–364. doi: 10.1007/s40593-015-0057-9
Boekaerts, M. (1996). Self-regulated learning at the junction of cognition and motivation. Eur. Psychol. 1, 100–112. doi: 10.1027/1016-9040.1.2.100
Bohlmann, N. L., Maier, M. F., and Palacios, N. (2015). Bidirectionality in self-regulation and expressive vocabulary: comparisons between monolingual and dual language learners in preschool. Child Dev. 86, 1094–1111. doi: 10.1111/cdev.12375
Broadbent, J., and Poon, W. L. (2015). Self-regulated learning strategies & academic achievement in online higher education learning environments: a systematic review. Internet High. Educ. 27, 1–13. doi: 10.1016/j.iheduc.2015.04.007
Bryce, D., and Whitebread, D. (2012). The development of metacognitive skills: evidence from observational analysis of young children’s behavior during problem-solving. Metacogn. Learn. 7, 197–217. doi: 10.1007/s11409-012-9091-2
Chen, P. P., Cleary, T. J., and Lui, A. M. (2015). Examining parents' ratings of middle-school students' academic self-regulation using principal axis factoring analysis. School Psychol. Quart. 30, 385–397. doi: 10.1037/spq0000098
Dent, A. L., and Koenka, A. C. (2016). The relation between self-regulated learning and academic achievement across childhood and adolescence: a meta-analysis. Educ. Psychol. Rev. 28, 425–474. doi: 10.1007/s10648-015-9320-8
Dignath, C., Buettner, G., and Langfeldt, H.-P. (2008). How can primary school students learn self-regulated learning strategies most effectively? A meta-analysis on self-regulation training programmes. Educ. Res. Rev. 3, 101–129. doi: 10.1016/j.edurev.2008.02.003
Dignath, C., and Büttner, G. (2008). Components of fostering self-regulated learning among students. A meta-analysis on intervention studies at primary and secondary school level. Metacogn. Learn. 3, 231–264. doi: 10.1007/s11409-008-9029-x
Double, K. S., and Birney, D. P. (2019). Reactivity to measures of metacognition. Front. Psychol. 10:2755. doi: 10.3389/fpsyg.2019.02755
Du, J., Hew, K. F., and Liu, L. (2023). What can online traces tell us about students’ self-regulated learning? A systematic review of online trace data analysis. Comput. Educ. 201:104828. doi: 10.1016/j.compedu.2023.104828
Fan, Y., Lim, L., van der Graaf, J., Kilgour, J., Raković, M., Moore, J., et al. (2022). Improving the measurement of self-regulated learning using multi-channel data. Metacogn. Learn. 17, 1025–1055. doi: 10.1007/s11409-022-09304-z
Fan, Y., Rakovic, M., van der Graaf, J., Lim, L., Singh, S., Moore, J., et al. (2023). Towards a fuller picture: triangulation and integration of the measurement of self-regulated learning based on trace and think aloud data. J. Comput. Assist. Learn. 39, 1303–1324. doi: 10.1111/jcal.12801
Fox, M. C., Ericsson, K. A., and Best, R. (2011). Do procedures for verbal reporting of thinking have to be reactive? A meta-analysis and recommendations for best reporting methods. Psychol. Bull. 137, 316–344. doi: 10.1037/a0021663
Fryer, L. K., and Dinsmore, D. L. (2020). The promise and pitfalls of self-report. Frontline Learn. Res. 8, 1–9. doi: 10.14786/flr.v8i3.623
Gascoine, L., Higgins, S., and Wall, K. (2017). The assessment of metacognition in children aged 4-16 years: a systematic review. Rev. Educ. 5, 3–57. doi: 10.1002/rev3.3077
Greene, J. A., and Azevedo, R. (2009). A macro-level analysis of SRL processes and their relations to the acquisition of a sophisticated mental model of a complex system. Contemp. Educ. Psychol. 34, 18–29. doi: 10.1016/j.cedpsych.2008.05.006
Greene, J. A., and Azevedo, R. (2010). The measurement of learners’ self-regulated cognitive and metacognitive processes while using computer-based learning environments. Educ. Psychol. 45, 203–209. doi: 10.1080/00461520.2010.515935
Iiskala, T., Vauras, M., and Lehtinen, E. (2004). Socially-shared metacognition in peer learning? Hell. J. Psychol. 1, 147–178. doi: 10.1016/j.learninstruc.2010.05.002
Jansen, R., van Leeuwen, A., Janssen, J., and Kester, L. (2020). A mixed method approach to studying self-regulated learning in MOOCs: combining trace data with interviews. Frontline Learn. Res. 8, 35–64. doi: 10.14786/flr.v8i2.539
Järvelä, S., Järvenoja, H., and Malmberg, J. (2019). Capturing the dynamic and cyclical nature of regulation: methodological progress in understanding socially shared regulation in learning. Int. J. Comput.-Support. Collab. Learn. 14, 425–441. doi: 10.1007/s11412-019-09313-2
Khalil, M., and Ebner, M. (2015). Learning analytics: principles and constraints. Proceedings of world conference on educational multimedia, VA: AACE. 1326–1336.
Kinnebrew, J. S., Loretz, K. M., and Biswas, G. (2013). A contextualized, differential sequence mining method to derive students’ learning behavior patterns. J. Educ. Data Mining 5, 190–219. doi: 10.5281/zenodo.3554617
Kroehne, U. (2023a). IRTlib documentation: software for the administration and delivery of computer-based assessments. Frankfurt am Main, Germany: DIPF.
Kroehne, U. (2023b). Open computer-based assessment with the CBA ItemBuilder. Frankfurt am Main, Germany: DIPF.
Kroehne, U., and Goldhammer, F. (2018). How to conceptualize, represent, and analyze log data from technology-based assessments? A generic framework and an application to questionnaire items. Behaviormetrika 45, 527–563. doi: 10.1007/s41237-018-0063-y
Lausberg, H., and Sloetjes, H. (2009). Coding gestural behavior with the NEUROGES--ELAN system. Behav. Res. Methods 41, 841–849. doi: 10.3758/BRM.41.3.841
Maldonado-Mahauad, J., Pérez-Sanagustín, M., Kizilcec, R. F., Morales, N., and Munoz-Gama, J. (2018). Mining theory-based patterns from big data: identifying self-regulated learning strategies in massive open online courses. Comput. Hum. Behav. 80, 179–196. doi: 10.1016/j.chb.2017.11.011
Malmberg, J., Järvelä, S., and Kirschner, P. A. (2014). Elementary school students’ strategic learning: does task-type matter? Metacogn. Learn. 9, 113–136. doi: 10.1007/s11409-013-9108-5
Marulis, L. M., Palincsar, A. S., Berhenke, A. L., and Whitebread, D. (2016). Assessing metacognitive knowledge in 3–5 year olds: the development of a metacognitive knowledge interview (McKI). Metacogn. Learn. 11, 339–368. doi: 10.1007/s11409-016-9157-7
Max Planck Institute for Psycholinguistics and The Language Archive. (2023). ELAN (version 6.7) [computer software]. Max Planck Institute for Psycholinguistics, the language archive. Available at: https://archive.mpi.nl/tla/elan (Accessed September 08, 2024).
McClelland, M. M., and Cameron, C. E. (2012). Self-regulation in early childhoodd: improving conceptual clarity and developing ecologically valid measures. Child Dev. Perspect. 6, 136–142. doi: 10.1111/j.1750-8606.2011.00191.x
McCoy, D. C. (2019). Measuring young children's executive function and self-regulation in classrooms and other real-world settings. Clin. Child. Fam. Psychol. Rev. 22, 63–74. doi: 10.1007/s10567-019-00285-1
Molenaar, I. (2014). Advances in temporal analysis in learning and instruction. Frontline Learn. Res. 6, 15–24. doi: 10.14786/flr.v2i4.118
Molenaar, I., and Järvelä, S. (2014). Sequential and temporal characteristics of self and socially regulated learning. Metacogn. Learn. 9, 75–85. doi: 10.1007/s11409-014-9114-2
Munshi, A., Rajendran, R., Ocumpaugh, J., Biswas, G., Baker, R. S., and Paquette, L. (2018). “Modeling learners' cognitive and affective states to scaffold SRL in open-ended learning environments” in Proceedings of the 26th conference on user modeling, adaptation and personalization. eds. T. Mitrovic, J. Zhang, L. Chen, and D. Chin (Singapore, Singapore: ACM), 131–138.
Nelson, T., and Narens, L. (1994). “Why investigate metacognition?” in Metacognition: knowing about knowing. eds. J. Metcalfe and A. P. Shimamura (Cambridge, UK: The MIT Press), 1–25.
Panadero, E. (2017). A review of self-regulated learning: six models and four directions for research. Front. Psychol. 8:422. doi: 10.3389/fpsyg.2017.00422
Panadero, E., Klug, J., and Järvelä, S. (2016). Third wave of measurement in the self-regulated learning field: when measurement and intervention come hand in hand. Scand. J. Educ. Res. 60, 723–735. doi: 10.1080/00313831.2015.1066436
Paquette, L., Grant, T., Zhang, Y., Biswas, G., and Baker, R. (2021). “Using epistemic networks to analyze self-regulated learning in an open-ended problem-solving environment” in Advances in quantitative ethnography - second international conference, ICQE 2020, proceedings. eds. A. R. Ruis and S. B. Lee (Springer International Publishing), 185–201.
Perry, N. E., Hutchinson, L. R., Yee, N., and Määttä, E. (2018). “Advances in understanding young Children’s self-regulation of learning” in Handbook of self-regulation of learning and performance. eds. D. H. Schunk and J. A. Greene (Oxfordshire, UK: Routledge), 457–472.
Perry, N. E., and VandeKamp, K. J. O. (2000). Creating classroom contexts that support young children's development of self-regulated learning 夽. Int. J. Educ. Res. 33, 821–843. doi: 10.1016/S0883-0355(00)00052-5
Rakovic, M., Fan, Y., van der Graaf, J., Singh, S., Kilgour, J., Lim, L., et al. (2022). “Using learner trace data to understand metacognitive processes in writing from multiple sources” in LAK22: 12th international learning analytics and knowledge conference. eds. A. F. Wise, R. Martinez-Maldonado, and I. Hilliger (New York, USA: ACM), 130–141.
Reimann, P., Markauskaite, L., and Bannert, M. (2014). E-Research and learning theory: what do sequence and process mining methods contribute? Br. J. Educ. Technol. 45, 528–540. doi: 10.1111/bjet.12146
Rimbatmojo, S., Kusmayadi, T. A., and Riyadi, R. (2017). Metacognition difficulty of students with visual-spatial intelligence during solving open-ended problem. J. Phys. Conf. Ser. 895:012034. doi: 10.1088/1742-6596/895/1/012034
Robson, D. A., Allen, M. S., and Howard, S. J. (2020). Self-regulation in childhood as a predictor of future outcomes: a meta-analytic review. Psychol. Bull. 146, 324–354. doi: 10.1037/bul0000227
Roebers, C. M. (2017). Executive function and metacognition: towards a unifying framework of cognitive self-regulation. Dev. Rev. 45, 31–51. doi: 10.1016/j.dr.2017.04.001
Roll, I., and Winne, P. H. (2015). Understanding, evaluating, and supporting self-regulated learning using learning analytics. J. Learn. Anal. 2, 7–12. doi: 10.18608/jla.2015.21.2
Roth, A., Ogrin, S., and Schmitz, B. (2016). Assessing self-regulated learning in higher education: a systematic literature review of self-report instruments. Educ. Assess. Eval. Account. 28, 225–250. doi: 10.1007/s11092-015-9229-2
Rovers, S. F. E., Clarebout, G., Savelberg, H. H. C. M., Bruin, A. B. H.De, and van Merriënboer, J. J. G. (2019). Granularity matters: comparing different ways of measuring self-regulated learning. Metacogn. Learn., 14, 1–19. doi: 10.1007/s11409-019-09188-6
Saint, J., Fan, Y., Gašević, D., and Pardo, A. (2022). Temporally-focused analytics of self-regulated learning: a systematic review of literature. Comput. Educ. Artif. Intell. 3:100060. doi: 10.1016/j.caeai.2022.100060
Saint, J., Gašević, D., Matcha, W., Uzir, N. A., and Pardo, A. (2020a). “Combining analytic methods to unlock sequential and temporal patterns of self-regulated learning” in Proceedings of the tenth international conference on learning analytics & knowledge. eds. C. Rensing and H. Drachsler (ACM), 402–411.
Saint, J., Whitelock-Wainwright, A., Gasevic, D., and Pardo, A. (2020b). Trace-SRL: a framework for analysis of microlevel processes of self-regulated learning from trace data. IEEE Trans. Learn. Technol. 13, 861–877. doi: 10.1109/TLT.2020.3027496
Siadaty, M., Gasevic, D., and Hatala, M. (2016). Trace-based micro-analytic measurement of self-regulated learning processes. J. Learn. Anal. 3, 183–214. doi: 10.18608/jla.2016.31.11
Siadaty, M., Gašević, D., and Hatala, M. (2016). Measuring the impact of technological scaffolding interventions on micro-level processes of self-regulated workplace learning. Comput. Hum. Behav. 59, 469–482. doi: 10.1016/j.chb.2016.02.025
Spektor-Levy, O., Basilio, M., Zachariou, A., and Whitebread, D. (2017). Young children's spontaneous manifestation of self-regulation and metacognition during constructional play tasks. Teach. Coll. Rec. Voice Scholar. Educ. 119, 1–28. doi: 10.1177/016146811711901314
Stillman, G., and Mevarech, Z. (2010). Metacognition research in mathematics education: from hot topic to mature field. ZDM 42, 145–148. doi: 10.1007/s11858-010-0245-x
Tzohar-Rozen, M., Waisel, T., and Shamir, A. (2021). Self-regulated learning skills and the quality of execution of construction tasks: a comparison between young children at risk for specific learning disorders and typically developing peers. Metacogn. Learn. 16, 833–853. doi: 10.1007/s11409-021-09266-8
Usher, E. L., and Schunk, D. H. (2018). “Social cognitive theoretical perspective of self-regulation” in Educational psychology handbook series. Handbook of self-regulation of learning and performance. eds. D. H. Schunk and J. A. Greene. Second ed (Abingdon, UK: Routledge; Taylor & Francis), 19–35.
van Halem, N., van Klaveren, C., Drachsler, H., Schmitz, M., and Cornelisz, I. (2020). Tracking patterns in self-regulated learning using students’ self-reports and online trace data. Frontline Learn. Res. 8, 140–163. doi: 10.14786/flr.v8i3.497
van Laer, S., and Elen, J. (2018). Towards a methodological framework for sequence analysis in the field of self-regulated learning. Frontline Learn. Res. 228–249, 228–249. doi: 10.14786/flr.v6i3.367
Vandevelde, S., van Keer, H., Schellings, G., and van Hout-Wolters, B. (2015). Using think-aloud protocol analysis to gain in-depth insights into upper primary school children's self-regulated learning. Learn. Individ. Differ. 43, 11–30. doi: 10.1016/j.lindif.2015.08.027
Veenman, M. V. J. (2011). Alternative assessment of strategy use with self-report instruments: a discussion. Metacogn. Learn. 6, 205–211. doi: 10.1007/s11409-011-9080-x
Veenman, M. V. J., and van Cleef, D. (2019). Measuring metacognitive skills for mathematics: students’ self-reports versus on-line assessment methods. ZDM 51, 691–701. doi: 10.1007/s11858-018-1006-5
Veenman, M. V. J., van Hout-Wolters, B. H. A. M., and Afflerbach, P. (2006). Metacognition and learning: conceptual and methodological considerations. Metacogn. Learn. 1, 3–14. doi: 10.1007/s11409-006-6893-0
Viberg, O., Khalil, M., and Baars, M. (2020). “Self-regulated learning and learning analytics in online learning environments” in Proceedings of the tenth international conference on learning analytics & knowledge. eds. C. Rensing and H. Drachsler (ACM), 524–533.
Wang, T., and Lajoie, S. P. (2023). How does cognitive load interact with self-regulated learning? A dynamic and integrative model. Educ. Psychol. Rev. 35:69. doi: 10.1007/s10648-023-09794-6
Whitebread, D., Coltman, P., Pasternak, D. P., Sangster, C., Grau, V., Bingham, S., et al. (2009). The development of two observational tools for assessing metacognition and self-regulated learning in young children. Metacogn. Learn. 4, 63–85. doi: 10.1007/s11409-008-9033-1
Winne, P. H. (2005). A perspective on state-of-the-art research on self-regulated learning. Instr. Sci. 33, 559–565. doi: 10.1007/s11251-005-1280-9
Winne, P. H. (2010). Improving measurements of self-regulated learning. Educ. Psychol. 45, 267–276. doi: 10.1080/00461520.2010.517150
Winne, P. H. (2014). Issues in researching self-regulated learning as patterns of events. Metacogn. Learn. 9, 229–237. doi: 10.1007/s11409-014-9113-3
Winne, P. H. (2017). “Learning analytics for self-regulated learning” in Handbook of learning analytics. eds. C. Lang, G. Siemens, A. Wise, and D. Gasevic (Society for Learning Analytics Research (SoLAR)), 241–249.
Winne, P. H. (2020). Construct and consequential validity for learning analytics based on trace data. Comput. Hum. Behav. 112:106457. doi: 10.1016/j.chb.2020.106457
Winne, P. H., and Baker, R. S. (2013). The potentials of educational data mining for researching metacognition, motivation and self-regulated learning. J. Educ. Data Mining 5, 1–8. doi: 10.5281/zenodo.3554619
Winne, P. H., and Hadwin, A. F. (1998). “Studying as self-regulated learning” in The educational psychology series. Metacognition in educational theory and practice. eds. A. C. Graesser, D. J. Hacker, and J. Dunlosky (Hillsdale, USA: LEA).
Winne, P. H., and Nesbit, J. C. (2009). “Supporting self-regulated learning with cognitive tools” in The educational psychology series. Handbook of metacognition in education. eds. D. J. Hacker, J. Dunlosky, and A. C. Graesser (Abingdon, UK: Routledge), 259–277.
Winne, P. H., Nesbit, J. C., Kumar, V., Hadwin, A. F., Lajoie, S. P., Azevedo, R., et al. (2006). Supporting self-regulated learning with gStudy software: the learning kit project cognition and learning. Tech. Inst. Cognit. Learn. 3, 105–113.
Winne, P. H., and Perry, N. E. (2000). “Measuring self-regulated learning” in Handbook of self-regulation. handbook of selfregulation. eds. M. Boekaerts, P. R. Pintrich, and M. Zeidner (Washington, USA and London, UK: Elsevier; Academic Press), 531–566.
Zhou, M., Xu, Y., Nesbit, J. C., and Winne, P. H. (2010). “Sequential pattern analysis of learning logs” in Handbook of educational data mining. eds. C. Romero, S. Ventura, M. Pechenizkiy, and R. S. Baker (Boca Raton, Florida, USA: CRC Press), 65–78.
Keywords: self-regulated learning, metacognition, log data, primary school students, SRL assessment
Citation: van Berk B, Kroehne U and Dignath C (2024) On the right track: decoding self-regulated learning in young students’ log data with the digital train track task. Front. Educ. 9:1388202. doi: 10.3389/feduc.2024.1388202
Edited by:
Malgorzata Korolkiewicz, University of South Australia, AustraliaReviewed by:
Samuel Fowler, University of South Australia, AustraliaJohnPaul Kennedy, University of South Australia, Australia
Copyright © 2024 van Berk, Kroehne and Dignath. This is an open-access article distributed under the terms of the Creative Commons Attribution License (CC BY). The use, distribution or reproduction in other forums is permitted, provided the original author(s) and the copyright owner(s) are credited and that the original publication in this journal is cited, in accordance with accepted academic practice. No use, distribution or reproduction is permitted which does not comply with these terms.
*Correspondence: Bernadette van Berk, dmFuYmVya0Bwc3ljaC51bmktZnJhbmtmdXJ0LmRl