 Wangqiong Ye
 Rolf V. Olsen
 Sigrid Blömeke†
- Faculty of Educational Sciences, Centre for Educational Measurement, University of Oslo, Oslo, Norway
Teacher quality, teaching quality, school resources, and school climate are commonly identified as protective factors in the academic resilience literature. Variables reflecting these four concepts were applied in a latent profile analysis across 36 education systems participating in the Trends in International Mathematics and Science Study 2019. The best-fitting model suggested four different latent profiles of protective factors. A three-step BCH method with an auxiliary regression model was adopted to investigate the influence of education expenditure on academic resilience across the profiles. Education expenditure promoted academic resilience in a profile characterized by low mathematics resources and another profile with low teaching quality and school climate. Education expenditure had no significant influence in the remaining two profiles characterized by very low and high levels of classroom and school protective factors, respectively. Moreover, countries were classified into six cultural groups representing education systems sharing similarities in language, history, or geography. Within each group, there was a certain degree of consistency in the distribution of profiles. Conclusions are drawn for strategies to promote academic resilience.
1 Introduction
Educational inequalities are a concern in many countries across the globe. With the increasing availability of data from international large-scale assessments (ILSAs), a growing number of studies have examined how to promote “academic resilience,” a term that refers to succeeding “against the odds.” Academic resilience describes students’ capacity to perform well despite having a disadvantaged background (OECD, 2011). The critical question is what characterizes malleable features of the school contexts that are positively related to such academic resilience (Agasisti et al., 2018) and whether it would be possible to increase these features by increasing education expenditure.
The growing utilization of ILSAs data offers researchers valuable insights into the protective factors derived from students’ individual characteristics, family backgrounds, and learning environments. Moreover, it presents a significant opportunity to examine the role of these protective factors in fostering academic resilience across countries (e.g., Cheung, 2017). However, when exploring academic resilience across countries, three primary concerns emerge.
First, researchers examining protective factors across nations usually explore their overall influences by either analyzing one pooled data set or multiple single-country data sets. The former approach usually ignores country-specific characteristics (e.g., Agasisti et al., 2018). The latter often employs a single model to investigate the influence of protective factors within individual countries, leading to results that are challenging to generalize (e.g., Erberer et al., 2015).
Second, the operationalization of academic resilience is problematic in many studies, as shown by Ye et al. (2021). International comparison studies often utilize a fixed performance threshold to operationalize academic resilience, which refers to a single score used to denote exceptional educational achievement across all participating nations. This approach fails to consider the wide variations in average academic achievement across countries and may result in an inadequate understanding of what it means to be a high achiever in countries at the lower end of the achievement scale.
Third, multilevel modeling was usually adopted to explore the relationships between academic resilience and protective factors. Researchers frequently explored numerous protective factors and solely reported the relationship between academic resilience and protective factors without delving into interactions (e.g., Vicente et al., 2021). Consequently, the intricate relationships and nonlinear associations among these protective factors were often overlooked. To address this issue, some researchers (e.g., Koirikivi et al., 2021) utilized latent class analysis to examine multiple protective factors, aiming to identify distinct classes of resilience resources. These identified classes were subsequently examined with external variables using a three-step method. However, this method is not without limitations, either. Specifically, when the external variable (e.g., outcome) is included in the final stage, the latent class variable may experience substantial shifts in membership, thereby rendering the results invalid (Asparouhov and Muthén, 2014b).
These problems call for a more suitable conceptualization of academic resilience and a more comprehensive evaluation of protective factors across countries. The current study employs data from 8th graders, teachers, and principals within 36 education systems participating in the Trends in International Mathematics and Science Study (TIMSS) 2019. As compared to other ILSAs, the sampling design of TIMSS allows for directly linking student and teacher data. Moreover, the grade 8 population, as compared to the grade 4 population in TIMSS, has much more robust information on students’ home backgrounds. The study aims to identify resilient students and to analyze how profiles of protective factors vary across nations with state-of-the-art methods avoiding the problematic issues identified above. Moreover, the variability across countries is used to explore how these profiles of protective factors reflect educational expenditure.
1.1 Academic resilience
Resilience refers to positive adaptation despite adversity (Luthar, 2006). Depending on the measurement method, studies utilize certain adverse characteristics to define risk; hence positive adaptations refer to outcomes better than expected. Protective factors, which facilitate resilience, are a fundamental research topic in the field (Tudor and Spray, 2017).
When resilience is explored in education, positive adaptations usually focus on students’ academic performance (OECD, 2011), while risks are defined in various ways (Martin and Marsh, 2008). Studies on academic resilience went through two periods and demonstrated different patterns: before and after using ILSAs data. In the first period, researchers treated problematic relationships with parents or discrimination as student risks (Wayman, 2002) while emphasizing individual protective factors such as persistence (Martin and Marsh, 2008). Studies focused on aspects associated with students and their families, such as students’ attitudes toward school and family academic support (Wayman, 2002).
With the development of ILSAs, standardized information about students’ knowledge and skills became available across countries. Accordingly, studies investigating academic resilience in an international comparative context have become frequent since the 2010s. ILSAs also came with composite measures of students’ socio-economic home background, such as PISA’s economic, social and cultural status (ESCS). Thus many studies adopted a low level of SES to define risk. Moreover, with a growing awareness that schools can compensate for risks such as a disadvantaged home background, emphasis was placed on malleable institutional factors such as school resources, school climate, and teaching styles and strategies (Agasisti et al., 2018).
These malleable school inputs are widely discussed with education expenditure, including government expenditure on education as a percentage of GDP, to gain insights into how education systems operate (Hanushek and Woessmann, 2017). Such discussions contribute to the development of educational policies aimed at enhancing educational equality and quality through careful resource allocation and management, such as teacher training (Vegas and Coffin, 2015). Importantly, since disadvantaged students often come from low-SES families, resources provided by schools can mitigate risks, highlighting the crucial impact of strategic resource allocation and spending on their social mobility. However, despite the extensive discussion on school inputs such as teacher quality, the influence of education expenditure on academic resilience remains less explored (Agasisti and Longobardi, 2014).
Data used in this period usually included one country or more, and naturally, researchers started wondering whether the protective factors’ impact varies across countries. With the help of ILSAs data, international comparisons became more accessible. However, due to variations in economic development, cultures, and educational policies, researchers face significant challenges when defining and operationalizing academic resilience as a unitary concept across countries. In studies that utilize ILSAs data, a relative threshold is typically employed to define risk (e.g., bottom 1/3 of SES within-country), and a fixed cut-off on the scale of educational achievement is used to determine positive adaptation (e.g., a score of 475 defined to be the lower bound of the achievement level labeled as “intermediate” in the TIMSS studies). This approach may lead to overestimating the proportion of resilient students in high-achieving countries and underestimating it in low-achieving countries, which may not accurately reflect the quality of support provided to their disadvantaged students. This study, therefore, adopted a relative threshold to determine high educational performance, as Ye et al. (2021) suggested, to better reflect the pool of academically resilient students in each country.
1.2 Factors promoting academic resilience
1.2.1 School characteristics
Research on academic resilience is deeply rooted in the fields of psychology and sociology (Aburn et al., 2016). Hence, the protective factors most frequently studied reflected either within-person traits/states or characteristics reflecting the level of society. Accordingly, research on resilience did not until recently to a large extent reflect the potential of the teacher, and other resources proximal to the instructional context, as potential protective factors facilitating resilience. For example, extra-curricular activities were found to promote resilience for adolescents experiencing behavioral or mental health difficulties (Sun and Stewart, 2007).
The state of research changed with Borman and Overman (2004), who thoroughly examined protective factors related to core school characteristics in the United States. Borman and Overman emphasized school inputs, such as school resources (free-lunch legibility, availability of instructional resources, class size), teacher quality (years of experience), curriculum and instructional quality (clear goals, monitoring student progress), and school climate (safe and orderly environment). Their research revealed that characteristics of a supportive school community, including a safe and orderly environment, positive teacher-student relationships, and support for family involvement, were the most influential factors in promoting academic resilience.
The emphasis on malleable school factors was further underscored when ILSAs data was applied to study resilience. Using Italian data from PISA 2009, Agasisti and Longobardi (2014) focused on school-level characteristics. The study found that school factors associated with teachers were generally significant in predicting resilience, including the availability of teaching resources, the proportion of qualified teachers, the teacher-student ratio, and teacher shortage.
Erberer et al. (2015) employed TIMSS 2011 data from 28 countries to investigate the relationships between academic resilience and school characteristics. They studied teachers’ beliefs that students can do well in mathematics, the percentage of disadvantaged students, schools’ emphasis on academic success, safety and discipline, and shortages in educational resources on instruction. The associations between school factors and resilience were found to vary across education systems, with the most robust and consistent predictor being the beliefs held by teachers (e.g., their confidence in students doing well in math).
Utilizing combined data from PISA 2012 and 2015, Agasisti et al. (2018) examined the associations between academic resilience and various school-level factors. The factors included school learning climate (disciplinary climate, percentage of students skipping school days, extra-curricular activities), school resources (computer-student ratio, class size, average school SES), and school leadership. Only the computer-student ratio was not significantly associated with academic resilience.
García-Crespo et al. (2021) used data from the Progress in International Reading Literacy Study (PIRLS) 2016 to investigate student resilience in reading, emphasizing teachers’ influences. These included teachers’ formal education level and specialization, the school’s emphasis on academic success, a safe and orderly school environment, teacher-student interaction, teachers’ job satisfaction, classroom instructional limitations due to student attributes, reading strategies and techniques, homework tracking, and selection of reading materials. Findings showed that effective classroom management, a safe and orderly school environment, and teaching methods were the top predictors of academic resilience. In a follow-up study, García-Crespo et al. (2022) used TIMSS 2019 data and investigated teaching-related variables in mathematics and science. Schools’ emphasis on academic success and a safe and orderly climate predicted academic resilience across domains.
To sum up, four core characteristics of educational quality in schools were widely discussed in the literature using data from ILSAs: teacher quality, teaching quality, school climate, and school resources. The indicators of these were often positively related to academic resilience. However, it is essential to note that using ILSAs data to investigate academic resilience has resulted in varying research focus areas due to distinct sample designs in different ILSAs. For example, the PISA data does not associate students with their teachers because students were randomly selected from sample schools (OECD, 2020). Thus, studies using PISA data to explore teacher factors tend to examine them at the school level, for example, the proportion of qualified teachers in a school (Jin et al., 2022). This has limited the depth of knowledge regarding the influence of teachers and teaching quality on academic resilience.
1.2.2 Education expenditure
As a significant determinant of school inputs, education expenditure reflects the necessary financial resources for schools to establish a conducive learning environment, enhance teacher quality, and provide adequate school resources. Although education expenditure was found to have a limited direct average influence on student achievement (Hanushek and Woessmann, 2017), it may help disadvantaged students perform better.
Agasisti and Longobardi (2014) employed PISA 2009 OECD data to investigate school factors related to teachers (e.g., teacher shortage) in conjunction with education expenditure and institutional characteristics. They found that education expenditure, the number of teaching hours per year, teachers’ average salary after 15 years of experience, and the age at which students were first grouped by ability were positively related to resilience.
Following these outcomes, Agasisti et al. (2014) explored the association between the percentage of resilient students and two types of education expenditures: education spending as a fraction of (a) government expenditure and (b) GDP. Their study revealed that the former was associated with higher academic resilience in OECD countries. However, the latter was found to function in a compensatory manner, with a slightly negative association observed for richer countries but a positive one for poorer countries.
Agasisti and Longobardi (2017) extended their inquiry into the relationship between education spending as a part of government expenditure and the presence of academic resilience in the OECD context by scrutinizing the data from five PISA cycles (2000–2012). Their findings revealed that education expenditure as a percentage of government spending might assist disadvantaged students, but the magnitude and direction of this association could be contingent on a country’s level of economic development. Specifically, it was observed as beneficial in poorer nations but unfavorable in richer ones.
Vicente et al. (2021) employed PISA data from 2003 to 2018 to investigate the influence of individual factors (e.g., self-confidence), school factors (e.g., school SES, class size), and country-level factors (e.g., education expenditure per student, the ratio of teacher salary and GDP) on academic resilience. Their research revealed that, in the case of poorer countries, education expenditure per student is a significant predictor for academic resilience, whereas, for richer nations, teacher salary can contribute to enhanced academic performance among disadvantaged students.
To sum up, based on studies of PISA data, academic resilience seems to correlate positively with education expenditure, particularly in poorer countries. Furthermore, these studies suggest that the efficacy of expenditure depends on the allocation and utilization of funds. The interrelationships among education expenditure, core teaching and teacher characteristics, and academic resilience remain inadequately understood due to the constraints imposed by PISA data. Specifically, the inability to establish a direct linkage between students and their teachers limits studies utilizing PISA data to scrutinize resilience solely at the school level. As a result, the complexity and nuances of teacher-related factors have not been fully explored in the literature.
1.3 General versus country-specific influences of protective factors
As mentioned in the introduction, studies exploring protective factors enhancing academic resilience across countries can be distinguished by two trends: (1) examination of general influences using pooled data and (2) comparative analyses across a few selected countries. The former approach produced more significant results across studies due to a larger sample size but was less context-specific, while findings from the latter were often challenging to generalize. Additionally, the results from both approaches could vary considerably based on the levels and covariates included in the analysis.
1.3.1 Examination of general influences using pooled data
Using pooled data from OECD PISA 2009, Agasisti and Longobardi (2014) established the significance of education expenditure to academic resilience, which was confirmed and expanded upon in their subsequent research (Agasisti et al., 2014). Their research on school-level factors, such as the influence of the computer-student ratio on resilience, was consistent across studies based on pooled data.
However, associations between academic resilience and protective factors differed when various covariates and levels were considered in the analysis. The significant association between education expenditure and school-level factors diminished when educational systems’ characteristics were considered in the model (Agasisti et al., 2014). Similar observations were made regarding the hierarchical level of analysis utilized in the model. The significant connections between academic resilience and school-related variables, such as extra-curriculum activities, were no longer evident upon incorporating country-level factors, such as education expenditure, into the model (Agasisti and Longobardi, 2014).
Including multiple countries’ data from ILSAs in one pooled dataset may contribute to the complexity of interpreting results, as the substantial differences in cultural and educational contexts may significantly impact the assessment outcome. For instance, the proportion of teachers who have completed bachelor’s or postgraduate degrees is highly variable, ranging from 100% in Canada to 1% in Saudi Arabia (Mullis et al., 2020). Therefore, pooled data analysis may fail to account for these contextual differences accurately, and the significance of the findings may be obscured or misinterpreted.
1.3.2 Comparative analyses across countries
Considering the heterogeneity among nations, some researchers investigated academic resilience country by country or in a few selected countries only. Erberer et al. (2015) examined protective factors in 28 education systems participating in TIMSS 2011. Their findings indicated that factors at the individual level, such as students’ academic aspirations, demonstrated greater consistency than school-level factors, such as the school’s emphasis on academic success. García-Crespo et al. (2021) conducted a series of studies comparing protective factors across countries and found inconsistent results. For example, school discipline was significantly related to academic resilience in only eight out of twenty-three countries.
Given the inconsistent outcomes of studies exploring protective factors across countries, some researchers have opted to limit their investigations to countries with shared characteristics such as culture, language, geographic location, or levels of economic development. Cheung et al. (2014) studied the influence of individual factors, namely, enjoyment of reading, diversity of reading materials, and metacognitive awareness of reading strategies, on reading resilience across four East Asia economies. The study yielded consistent results across countries for all three variables. Subsequently, Cheung (2017) reported consistent results concerning mathematics learning variables across five education systems in East Asia. Nevertheless, Sandoval-Hernández et al. (2016) reported inconsistent results when analyzing individual and school-level characteristics in five East Asian economies. For example, students’ valuing of mathematics was a predictor of academic resilience in three out of five education systems, whereas school emphasis on academic success was significant in only one country.
Meanwhile, some researchers also compared protective factors between countries with notable cultural and economic differences. Ni et al. (2020) compared elementary students’ resilience in China and the United States. They found considerable country differences in individual resilience-promoting characteristics like self-control. Gabrielli et al. (2022) investigated protective factors between Southern European and North-western countries. They found that school-level factors like extra-curricular activities were not significantly related to academic resilience in the former group, but the opposite was found in the latter.
Özcan and Bulus (2022) extended the research on academic resilience by comparing the influences of protective factors between individualist and collectivist cultures. Their study revealed significant disparities in the influences of individual characteristics, such as the self-concept of reading. However, negligible variations were observed concerning school-level resilience-promoting factors such as disciplinary climate.
1.4 Methodological challenges
Compared to studies employing pooled data, research utilizing country-specific data faces more difficulties concerning the methodologies applied in the analyses. ILSAs data like TIMSS typically involve a sample size of approximately 4,000 students per country, with a comparatively lower representation of disadvantaged students (Mullis and Martin, 2017). Smaller sample sizes decrease not only statistical power but also the flexibility of the effect size, which can result in the study being unable to detect a significant difference or correlation between variables, even if one is present (Anderson et al., 2017).
Given the hierarchical structure of schools, researchers commonly construct a baseline logistic regression model that includes individual-level variables and subsequently introduces classroom or school-level factors (Agasisti et al., 2018). However, the relationships among covariates may differ across countries, resulting in issues with model convergence (Chung et al., 2013). Consequently, multilevel modeling investigations often fail to explore interactions and primarily report the connections between protective factors and academic resilience. As a result, the interdependence among covariates across different hierarchical levels and its influence on the relationship between protective factors and academic resilience are frequently overlooked in these studies (e.g., García-Crespo et al., 2022).
To address these methodological challenges, Putwain and Daly (2013) adopted cluster analysis and examined factors related to academic resilience across groups of students. Subsequently, Collie et al. (2017) expanded on this method by utilizing analysis of variance to establish associations between clusters of resilience and students’ motivation.
The progress in statistical techniques has enabled researchers to establish the relationship between latent class membership and external variables. One approach that has gained widespread use in recent years is the three-step approach proposed by Asparouhov and Muthén (2014a). This approach involves estimating the latent class measurement model and subsequently examining the association between the latent class variable and the auxiliary variables. Boutin-Martinez et al. (2019) and Koirikivi et al. (2021) employed latent class analysis to identify distinct profiles of resilience-related factors, taking into account covariates and using the three-step method to explore auxiliary variables.
However, empirical studies have suggested that the three-step method may not fully address the issue of shifting classes,1 particularly when the entropy2 value is low and there is a significant disparity in the variances of the distal outcome across classes (Bakk et al., 2013). To address this problem, Asparouhov and Muthén (2014b) proposed the BCH3 method, which avoids shifts in latent class in the final stage to which the three-step method is susceptible. Despite the potential advantages of the BCH method, no resilience-related studies have yet, to the best of our knowledge, utilized this method.
1.5 The present study
In this study, country-specific characteristics are taken into account as relative thresholds for risks and positive adaptations are employed to define academic resilience. Taking advantage of the TIMSS design, in which students are nested in classrooms, we examine teacher and school characteristics previously documented as promising protective factors.
Using latent profile analysis (LPA), this study investigates protective factors patterns by grouping the observed classroom and school characteristics into distinct profiles of resilience resources, to help improve our understanding of how such resources may work differently across cultures. Adopting the BCH method, we further examined the extent to which profiles are associated with academic resilience and education expenditure via auxiliary regression models. Specifically, we address the following research questions:
1. How many distinct profiles of resilience resources, characterized by teacher quality, teaching quality, school climate, and school resources, can be identified in the sample?
2. Do the profiles of resilience resources exhibit identifiable cultural patterns across diverse nations?
3. To what extent do the identified latent profiles predict academic resilience?
4. To what extent does the association between education expenditure as a percentage of Gross Domestic Product (GDP) and academic resilience vary across profiles?
2 Methods
2.1 Sample and procedure
To better understand teachers’ impact on academic resilience, we utilized TIMSS 2019 data, in which one or more intact classes were selected from randomly sampled schools via a two-stage stratified cluster sampling design (Mullis and Martin, 2017). The unprocessed data comprises 1.33 teachers per school,4 with the majority of schools having only one teacher. In order to optimize a parsimonious model, one single teacher was randomly selected from schools represented by more than one teacher. T-tests were subsequently employed to compare teacher-related variables between the original and the modified dataset with only one teacher per school. Except for teachers’ educational level and specialization in Finland, and teachers’ educational specialization in Chinese Taipei, no other statistically significant differences were detected in the remaining items that were tested (details see Supplementary Tables S1–S5).
Following the appropriate treatment of 11 variables5 employed for latent profile identification and the random selection of one teacher per school, this study applied relative thresholds to define disadvantaged students within each education system. The final sample used for the present study thus comprises eighth-grade disadvantaged students (N = 54,748) and their mathematics teachers (n = 6,798) and principals (k = 6,798) from 36 educational systems participating in TIMSS 2019 Mathematics. Analyses were thereby conducted on this sub-sample of disadvantaged students and their teachers and principals.
2.2 Measures
2.2.1 Academic resilience
This study adopted relative thresholds for risk and positive adaptation.6 Low SES (bottom 1/3 within-country) was used to define risk, and high mathematics performance (top 1/3 within-country) was used for positive adaptation. The Home Educational Resource (HER) scale of TIMSS 2019, based on students’ answers about home possessions and parents’ highest level of education, was used to indicate students’ SES. A higher score refers to a higher level of SES (see Supplementary Table 6).
The publicly available data sets from TIMSS represent students’ achievement by five plausible values (PVs) where students’ achievement scores are conditioned on all available background data (Mullis and Martin, 2017). This study used all five plausible values in mathematics, following Rubin (1987) rules. After identifying disadvantaged students as specified above, those with high performance were defined as resilient (1); otherwise, as non-resilient (0). Consequently, the five plausible values were converted into five binary numbers that each assumed a value of either 1 or 0. These five binary numbers were used as dependent outcomes in the last step of the analysis. In Mplus software, this is achieved by specifying “TYPE = IMPUTATION” in the data command.
With relative performance thresholds of 561.88 and 414.08, the United States and South Africa exhibited the lowest and highest occurrence of resilient students, respectively (Figure 1).
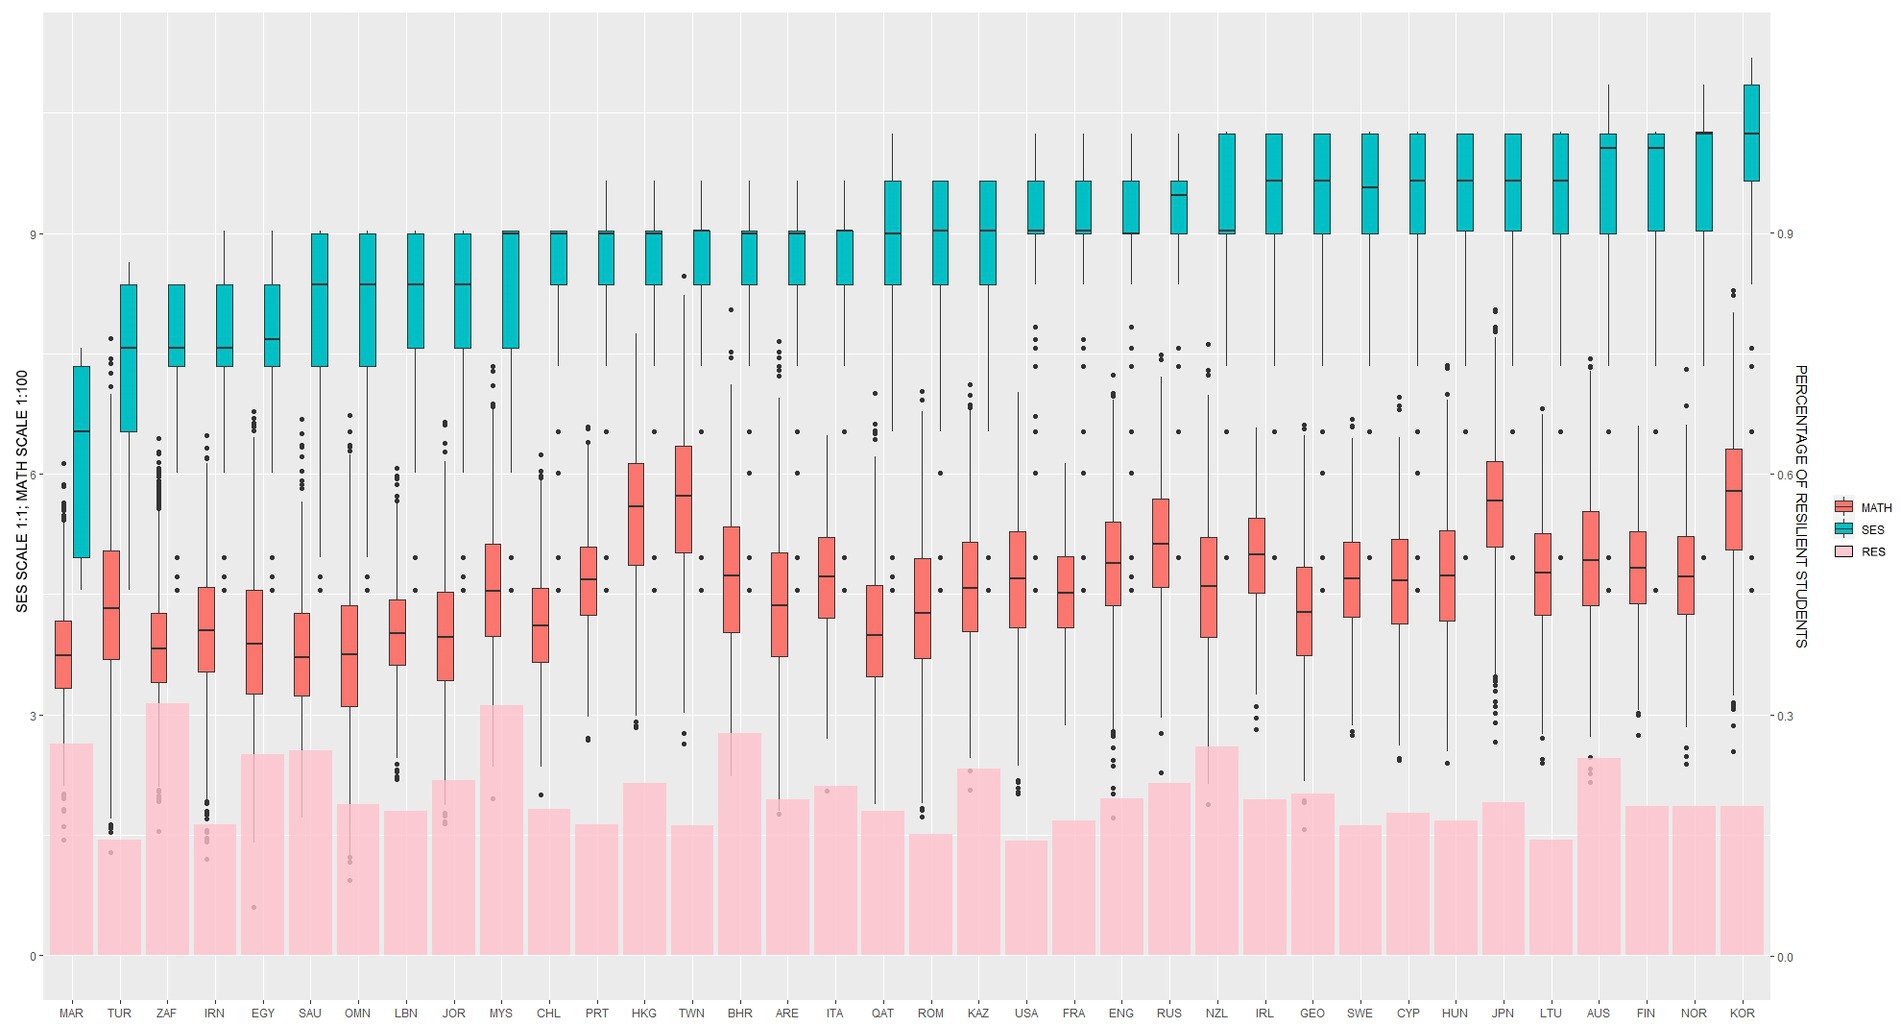
Figure 1. SES, mathematics performance, and percentage of resilience in disadvantaged students across 36 education systems. SES, social-economic status; RES, percentage of resilient students; MATH, mathematics performance/100.
2.2.2 Teacher quality
This study assessed teacher quality by their highest level of education attained and classification of which subject or field was their major field of study. Teachers were asked to report their highest level of formal education completed on a scale ranging from 1 (did not complete upper secondary education) to 7 (Doctor or equivalent level), with a higher score indicating a higher level of educational attainment. Regarding the majors of the teachers, we used the variable, “Teachers Majored in Mathematics and Mathematics Education,” provided by the TIMSS data set. The scale of this variable ranges from 1 (major in mathematics and mathematics education) to 5 (no formal education in mathematics beyond upper secondary), which was reversed in our study such that a higher score denotes a stronger formal background in mathematics and education (Table 1).
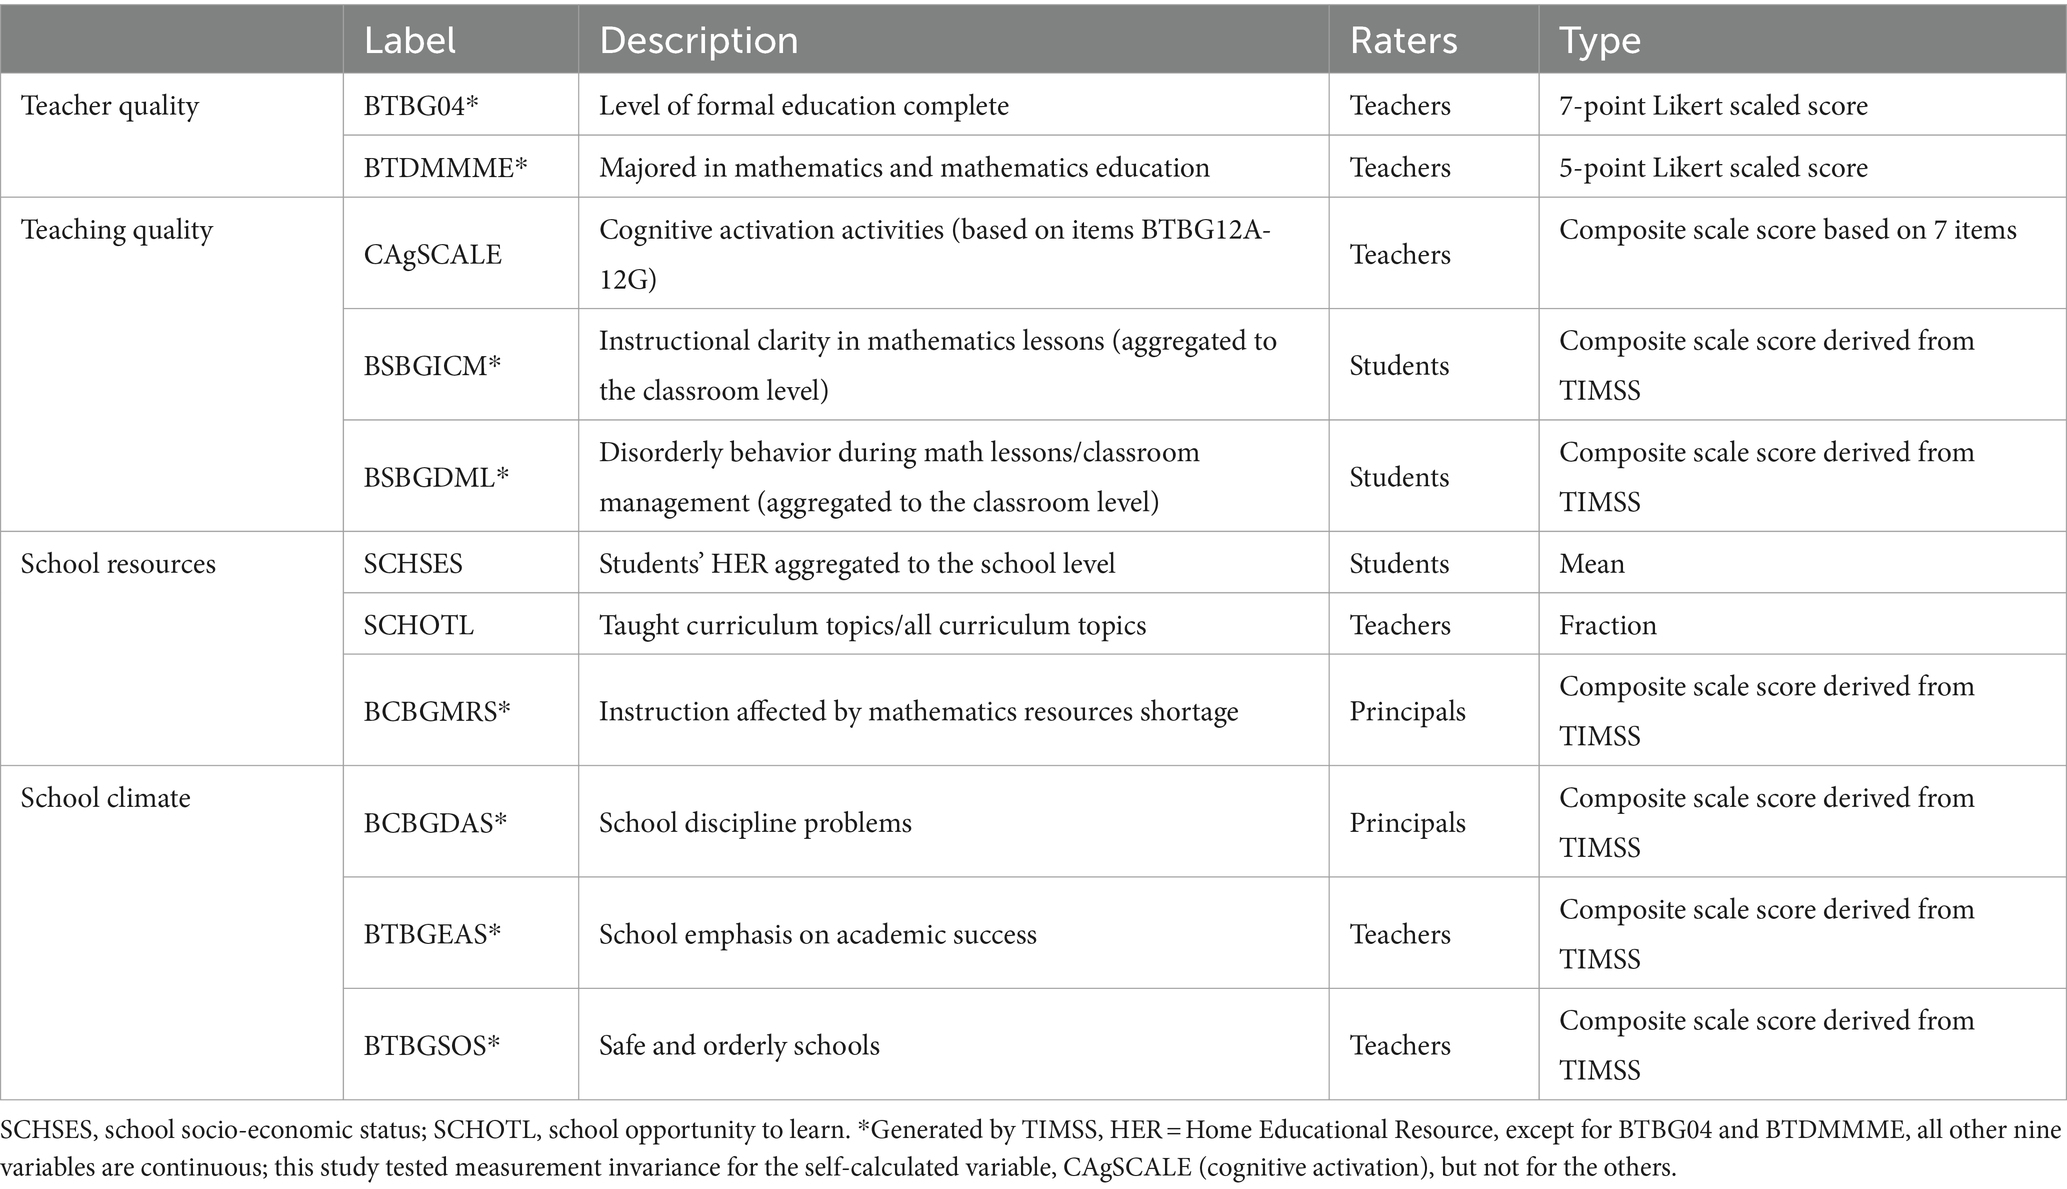
Table 1. Summary of classroom and school protective factors (11 items).
2.2.3 Teaching quality
This study scrutinized three teaching quality dimensions: cognitive activation, instructional clarity, and classroom management (Blömeke et al., 2016). Cognitive activation was evaluated through teachers’ responses to “How often do you do the following in teaching this class.” Seven items were rated on a four-point Likert scale, with examples including “related the lesson to students’ daily lives.” Given the involvement of numerous educational systems in the present study, we utilized relaxed fit indices to assess measurement invariance for cognitive activation (Nagengast and Marsh, 2014). Specifically, we relied on changes in the Comparative Fit Index (CFI) below 0.01 and changes in the Root Mean Square Error of Approximation (RMSEA) at or below 0.015. With ΔCFI = 0.00 and ΔRMSEA = 0.014, scalar invariance was established. Subsequently, we constructed a scale (α = 0.780) based on these items, with a higher score reflecting greater levels of cognitive activation.
For instructional clarity and classroom management, this study employed two TIMSS scales based on student responses, which were subsequently aggregated to the classroom level for appropriate modeling purposes. The scale of Instructional Clarity in Mathematics Lessons comprised seven items, including statements such as “My teacher is easy to understand,” with a higher score denoting higher levels of instructional clarity. The scale of Disorderly Behavior During Mathematics Lessons, consisting of six items, such as “there is disruptive noise,” was used as a measure of classroom management, with a higher score indicating fewer incidents of disorderly behavior. Composite scores for these two scales generated by TIMSS were used in the analysis.
2.2.4 School resources
Three aspects of school resources were investigated: mathematics resources as reported by principals, school SES as a proxy of overall school resources, and opportunity to learn (OTL) mathematics as reported by teachers for the target class.
TIMSS’s composite scale score of the Instruction Affected by Mathematics Resources Shortage, which was derived from five items such as “Library resources relevant to mathematics instruction,” was used to measure mathematics resources. A higher score indicates that mathematics instruction is less impacted by resource shortage. School SES was created on students’ HER scores, aggregated to the school level. School OTL, which measures the extent to which students have access to high-quality curriculum, was based on teachers’ responses to 22 topics related to Numbers, Algebra, Geometry, and Data and Probability. If the teacher indicated that the specific topic, for instance, “Simple linear equations” was “Mostly taught before this year” or “Mostly taught this year,” the topic was regarded as taught. The number of topics taught divided by the total number of 22 topics was used as a measure of OTL.
2.2.5 School climate
This study examined three aspects of school climate: discipline, schools’ emphasis on academic success (SEAS), and a safe and orderly environment.
The composite scale score on School Discipline Problems was derived from principals’ answers on 11 items such as “Absenteeism,” with a higher score indicating a lower incidence of disciplinary problems. The other two composite scale scores—SEAS and Safe and Orderly School—were based on teachers’ responses. A higher score indicates a higher level of academic emphasis or a safer and more orderly climate. The SEAS scale was derived from 14 items such as “Teachers’ expectation for student achievement.” The Safe and Orderly School scale was based on eight items such as “I feel safe at this school.” All three composite scale scores were developed by TIMSS and designed to provide comparable measures across countries.
2.2.6 Education expenditure
This study adopted the Government Expenditure on Education (% of GDP) data from the World Bank, calculated by dividing total government expenditure for all levels of education by GDP. In the analyses, averages of government expenditure on education from 2016 to 2018, 3 years before TIMSS 2019, were employed, ranging from 2.26 to 7.87%. By averaging the data over 3 years, we can reduce the impact of year-to-year fluctuations and obtain a more stable and reliable measure for education expenditure. Saudi Arabia and the three Nordic countries, Norway, Sweden, and Finland, ranked highest in education expenditure.
2.3 Statistical analyses
Data was prepared using the R Software version 4.0.2 (R Core Team, 2019). Analyses were conducted using Mplus version 8.8 (Muthén and Muthén, 2017), and missing data were handled with the full information maximum likelihood. Maximum likelihood estimation with robust standard errors (MLR) was used for latent profile analyses. TIMSS 2019 data are available from the International Association for the Evaluation of Education Achievement (IEA) database at https://timss2019.org/international-database/. Education expenditure data can be downloaded from the World Bank website at https://data.worldbank.org/indicator/SE.XPD.TOTL.GD.ZS.
Asparouhov and Muthén (2014a) proposed a three-step method to establish a connection between latent classes and external variables while considering measurement errors. This method involves: (1) identifying latent classes; (2) classifying memberships (calculating the average classification error for each identified class); and (3) linking the identified classes with external variables. To address issues related to shifting class membership, Asparouhov and Muthén (2014b) further developed the BCH method. This method closely resembles the three-step approach but differs in the second step, where the classification error is calculated for each individual.
The present study employs latent profile analysis (LPA) to identify multiple unobserved latent homogenous profiles. To investigate the influence of education expenditure on academic resilience across these profiles, we adopted a BCH method, which allows for linkage between the profiles and covariates, as well as with distal outcomes (Asparouhov and Muthén, 2014b).
Figure 2 provides the conceptual model employed in the current study. The 11 school and classroom characteristics used as indicators in Step 1 were employed to identify the optimal latent profile model. In Step 2, individual classification errors were computed, and the inverse logits of these error rates were used as BCH weights in the next step (Boutin-Martinez et al., 2019). In Step 3, education expenditure and academic resilience were incorporated into the model as the covariate and the distal outcome, respectively.
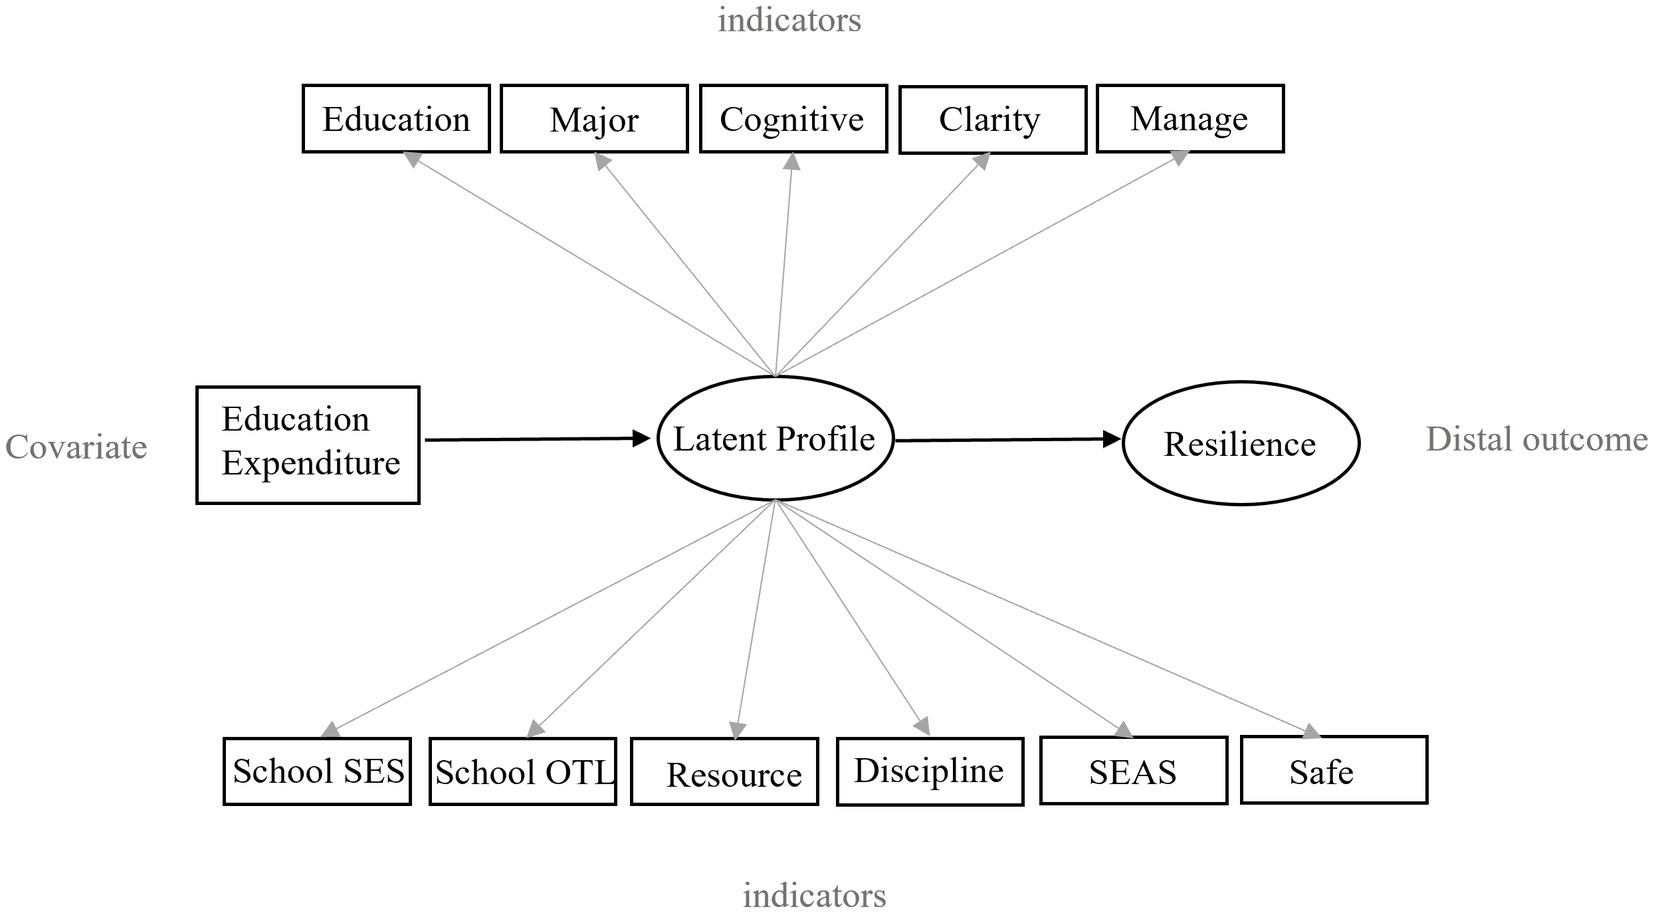
Figure 2. Conceptual model of the latent profile analysis and auxiliary regression. SES, socio-economic status; OTL, opportunity to learn; SEAS, school’s emphasis on academic success.
Based on preliminary analyses and theoretical considerations, covariances among these 11 items were also included in the latent profile analysis (LPA). Four models were assessed to determine the suitable LPA model. Model 1 assumed equal variances across profiles and fixed covariances to zero. Model 2 entailed equal variances and covariances across profiles. Model 3 involved freely estimated variances and equal covariances across profiles. Lastly, Model 4 allowed both freely estimated variances and covariances across profiles.
Comparisons across models of the following fit indices were used to decide the appropriate number of latent profiles: the Akaike Information Criterion (AIC), the Bayesian Information Criterion (BIC), the sample-size adjusted BIC (SABIC), the Lo–Mendell–Rubin likelihood ratio test (LMR), and the bootstrap likelihood ratio test (BLRT). Besides, we also considered parsimony and theoretical meaningfulness (Nylund et al., 2007).
After identifying the latent profiles of resilience resources, two auxiliary binary logistic regressions were performed using BCH weights derived from Step 2. The first regression examined the relationship between academic resilience and identified profiles, while the second regression incorporated the covariate variable, namely education expenditure, to assess the influence of education expenditure on academic resilience across profiles. Given that the BCH setting is not applicable in Mplus for multilevel design, we specified “TYPE = COMPLEX” and “CLUSTER = SCHOOLID” in the command to account for the hierarchical structure of students nested within schools.
Considering the covariances between school characteristics in LPA allows us to identify latent profiles that reflect the complex dimensions of school characteristics, while also being sensitive to the contextual differences across countries. Furthermore, examining education expenditure as an auxiliary variable via the BCH method enriches our understanding of its impact on academic resilience across different settings.
3 Results
3.1 Research question 1: profiles of resilience resources
3.1.1 Identifying profiles of resilience resources
Eleven classroom and school protective factors were used as latent profile indicators. In the following, we refer to these as resilience resources. Four distinct model configurations, each characterized by differing covariances and variances, were employed to determine the optimal LPA model. Model 1 exhibited entropy values of approximately 0.6, indicating a relatively low level of classification quality and suggesting inadequate fit of the model to the observed data (Wang et al., 2017). Models 3 and 4 had convergence problems when the profile numbers increased. This issue is common with less restrictive LPA models with many free parameters that may lead to unstable solutions (Bauer, 2022). Therefore, Model 2, which assumed equal variances and covariances across profiles, was chosen as the preferred model.
As the number of profiles increased, the AIC, BIC, and SABIC values decreased according to the LMR and BLRT tests (see Table 2). The decline in statistical significance was not evident in the five-profile model, indicating that the four-profile solution provides the optimal fit for the data, despite the two-profile model having the highest entropy value. Differences in entropy were limited, though. The smallest profiles in all models were smaller than 5%, ranging from 0.809 to 1.765%. Still, for the four-profile model, the smallest profile had 104 schools, higher than the recommended 50 units (Weller et al., 2020). We also found that the smallest group in the four-profile model made reasonably conceptual sense. Therefore, the model with four profiles was chosen as both supported by model fit statistics and conceptual considerations.
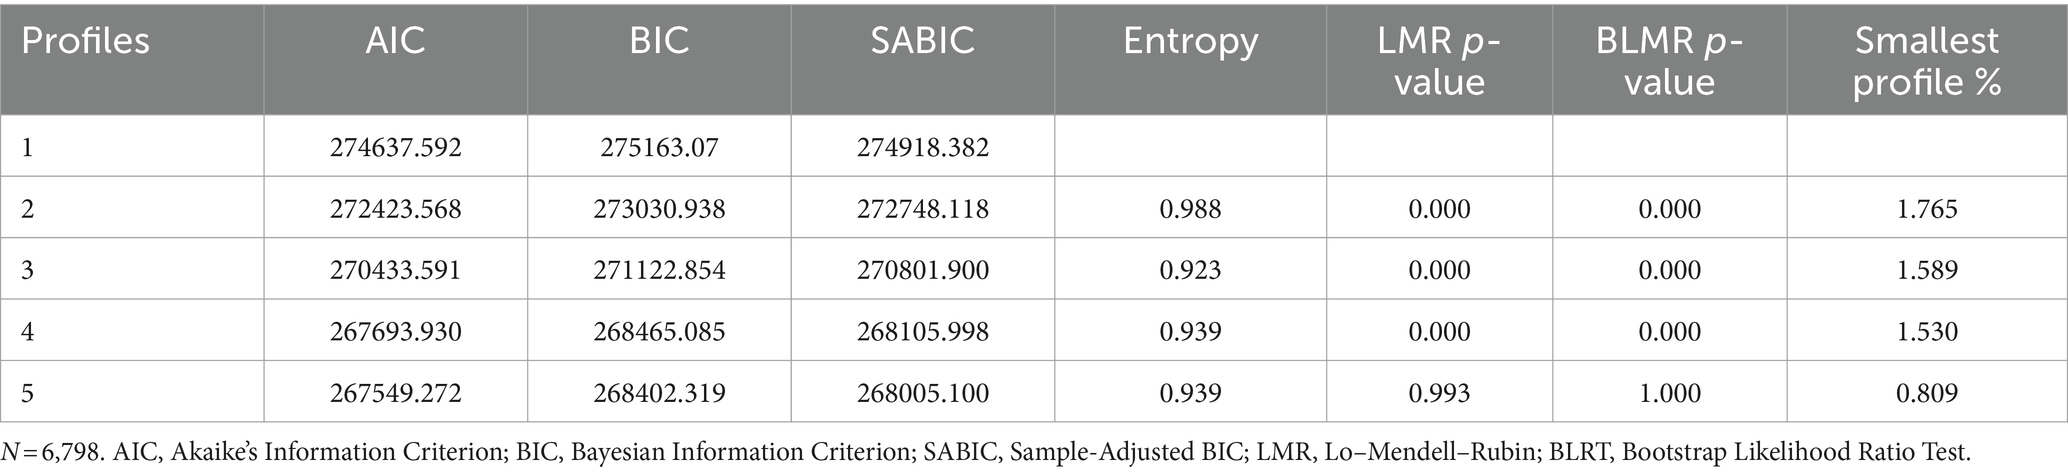
Table 2. Model fit indices for latent profile analyses.
3.1.2 Description of the four profiles of resilience resources
Figure 3 presents the latent profiles of the four groups across the 11 resilience resources, with the y-axis representing the standardized value for these resources. As commonly experienced in such latent profile analysis, one group represents those with low values across the indicators, while another group represents a profile with overall high average values across the indicators. In our case, profile 1, stands out as substantially different from the other three profiles with extremely low scores on all resilience resources. In contrast, profile 4 represents a group of students with overall high values across all 11 resilience resources. The two other profiles also had overall relatively high values for many resources but with some substantially lower values for some indicators.
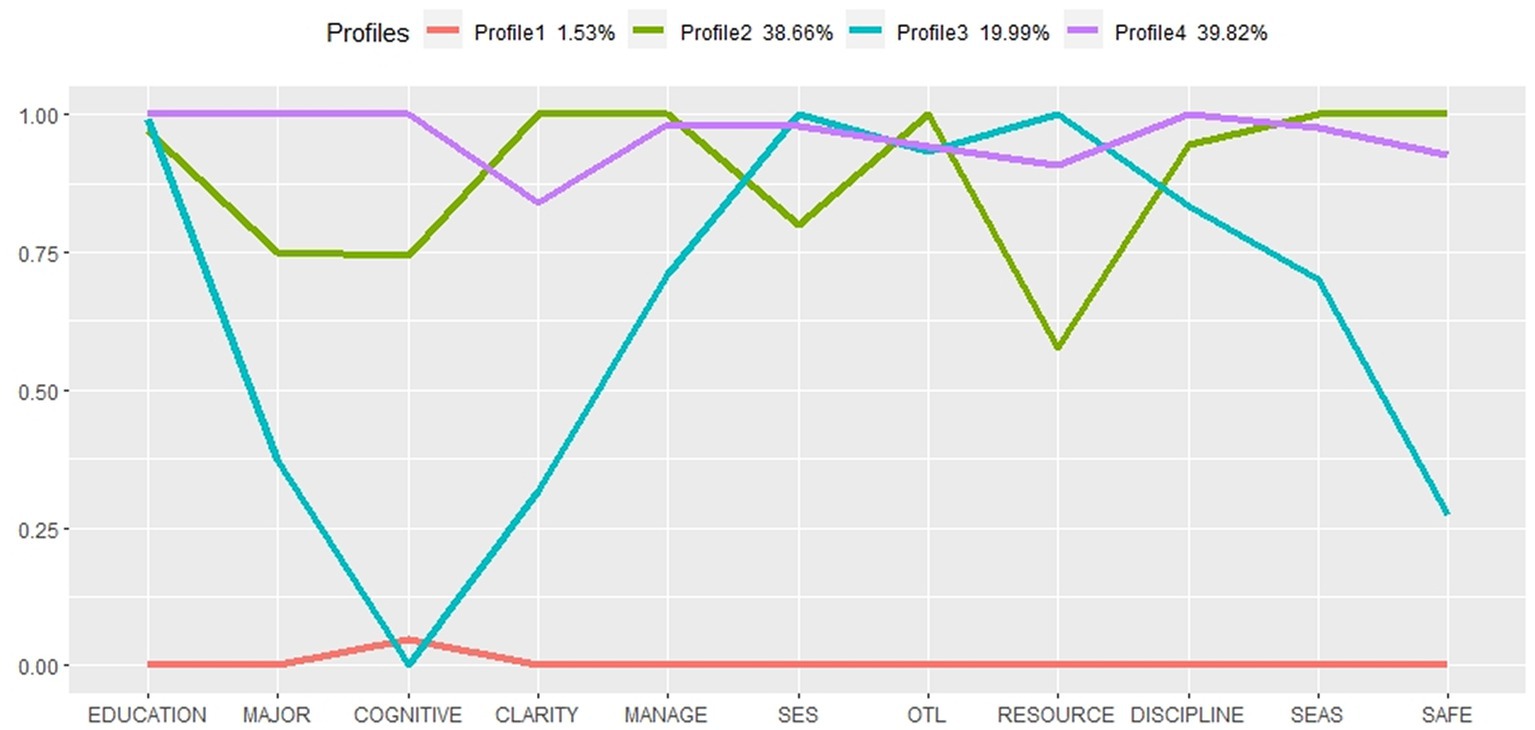
Figure 3. Plots of four latent profiles. SES, socio-economic status; OTL, opportunity to learn; SEAS, school’s emphasis on academic success.
In the following more detailed descriptions for each of the profiles are provided. Profile 1 had the lowest group size (1.53%), characterized by the lowest levels of teacher quality, teaching quality (instructional clarity and classroom management), school resources, and school climate. Hence, this profile was labeled “Vulnerable.” It should also be noted that in addition to being a rather small group, this profile is also mostly defined by one country (Morocco, see Figure 4). Hence, this profile appears partly as being an outlier in the solution.
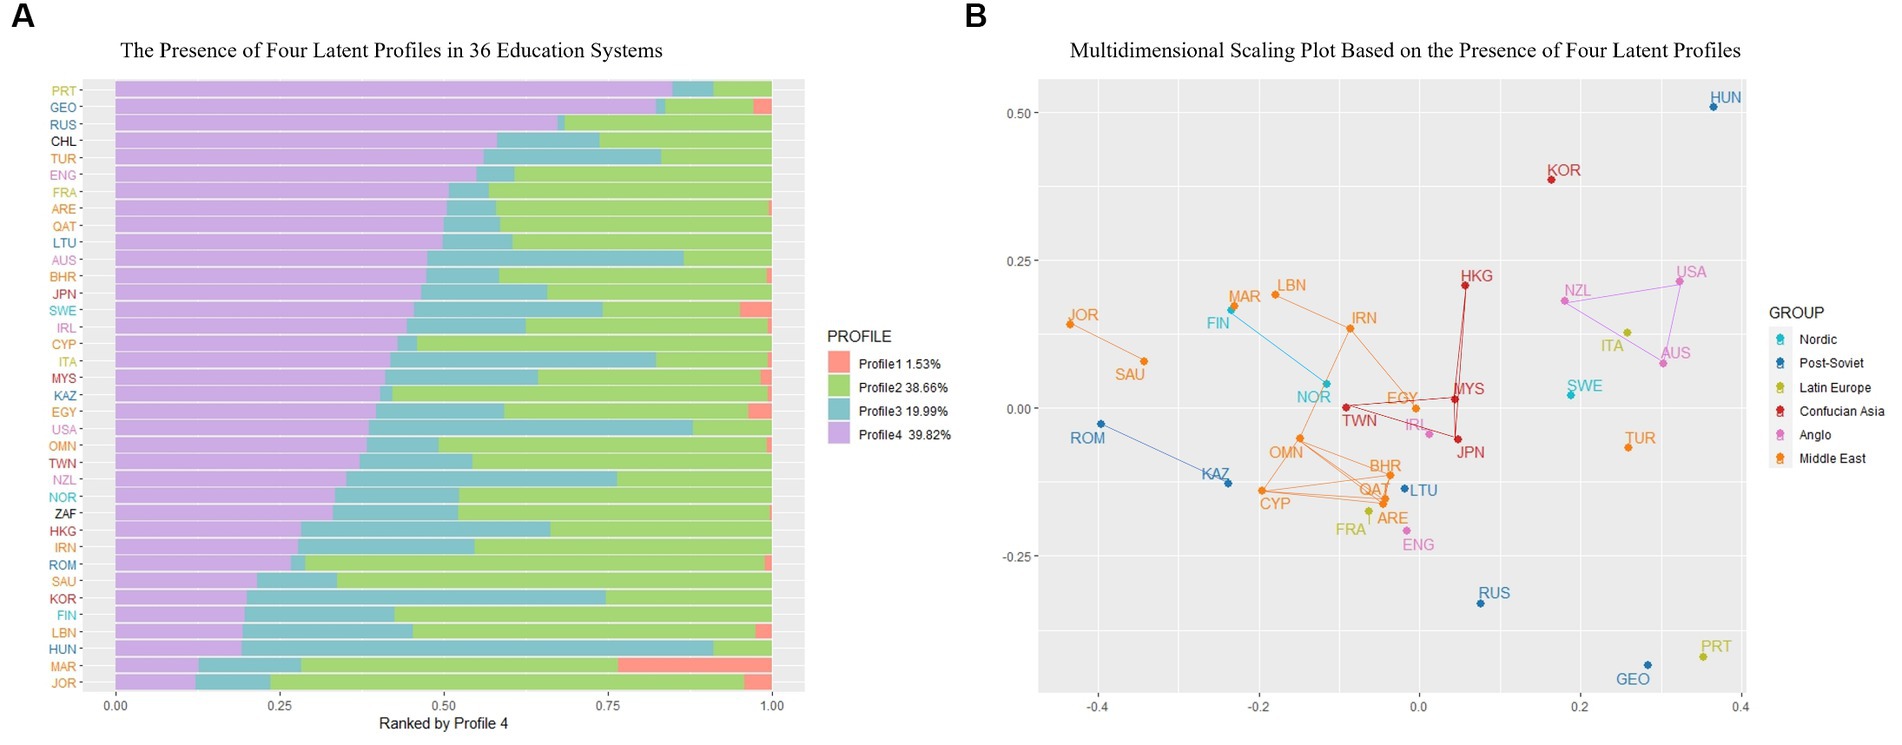
Figure 4. (A) The presence of four latent profiles in 36 education systems. (B) Multidimentional scaling plot based on the presence of four latent profiles. For education system codes, see Table 3. In plot (B), lines between economies indicate no statistically significant difference.
Profile 2 was the second-largest group (38.66%). Schools in this profile demonstrated high teaching quality, as evidenced by high instructional clarity and good classroom management. They also had a positive school climate, with the highest ratings for safe and orderly climate and schools’ emphasis on academic success. However, it ranked relatively low in mathematics resources but provided nevertheless a lot of OTL. This profile was named “Effective Teaching and Positive Climate.”
Profile 3, with a group size of 19.99%, was characterized by a high level of school resources, including the highest school SES and mathematics resources. However, it had a low level of teaching quality, characterized by the lowest level of cognitive activation and relatively lower levels of instructional clarity and classroom management. Fewer teachers in Profile 3 had a major in mathematics and education. Furthermore, the school climate received relatively low ratings across all indicators, encompassing disciplinary measures, the school’s emphasis on academic success, as well as safety and orderly climate. The profile was denoted as “Resource-Heavy, Quality-Light.”
Profile 4 had the largest group size (39.82%). Teachers in this profile exhibited the highest level of teacher quality on both education level and subject-specific major, and a high level of teaching quality on all other indicators, cognitive activation, instructional clarity, and classroom management. Schools in this profile also had a good school climate and ranked high on school resources, including school SES, OTL, and mathematics resources. For brevity, this profile was named “Well-Supported Schools.”
3.2 Research question 2: cultural patterns in resilience resources profiles across countries
Schools characterized by a vulnerable profile (Profile 1) were found in 23.53% of the schools in Morocco, 4.90% in Sweden, and 4.35% in Jordan.7 The prevalence of the profile in the other countries, excluding the 21 out of 36 economies where Profile 1 was absent, ranged from 0.41 to 3.66% (see Figure 4A).
The frequency of Profile 2, characterized by effective teaching and a favorable school environment, varied across countries, with Jordan exhibiting the highest proportion of schools (72.17%), followed by Romania (70.11%) and Saudi Arabia (66.33%). In contrast, the United States (12.06%), Hungary (8.90%), and Portugal (8.97%) demonstrated the lowest proportions of schools classified as Profile 2.
The profile labeled “Resource-Heavy, Quality-Light” (Profile 3) exhibited a lower average prevalence across nations (19.99%). Among the economies studied, the highest proportion was observed in Hungary (71.92%), followed by South Korea (54.82%) and the United States (49.42%). In contrast, Romania (2.17%), Kazakhstan (1.89%), Georgia (1.42%), and Russia (1.02%) had the lowest prevalence of Profile 3.
The “Well-Supported schools” (Profile 4) were most prevalent in Portugal at 84.83%, Georgia at 82.27%, and Russia at 67.35%. Conversely, the lowest presence was observed in Hungary (19.18%), Morocco (12.61%), and Jordan (11.30%).
As depicted in Figure 4A, the share of these four profiles displayed substantial variation across nations. Nonetheless, when cultural differences were taken into account, certain patterns emerged. This study categorized 34 education systems into six groups based on geographic and cultural considerations (see Table 3). We adopted a broader definition for the Middle East group, including countries in the Middle East and North Africa (Akkari, 2004). The Confucian Asia group included East and Southeast Asian education systems belonging to the Confucian cultural sphere (Huang and Chang, 2017). All countries in the Anglo group are developed nations, predominantly English-speaking, and once British colonies (Ashkanasy et al., 2002). The Latin Europe group included three Western or Southern European countries in which Romance languages are predominant. Three countries in the Nordic group share an egalitarian idea that the education system should provide access and opportunities for all (Frønes et al., 2020). The post-Soviet group includes six countries that used to be dominated by or part of the Soviet Union. Since Chile and South Africa were culturally and geographically different from these clusters, they were not included in any of the groups.

Table 3. Cultural groups.
The two-dimensional Figure 4B was constructed using the four profiles present in each economy. The ggplot2 package in R (Wickham et al., 2016) was utilized to generate a multidimensional scaling plot, a statistical technique employed to present complex, high-dimensional data in a lower-dimensional space, while preserving the original distances or similarities as much as possible. In Figure 4B, closer proximity between economies indicated greater similarity in their four profiles. The present study utilized Fisher’s exact test to evaluate the similarities within cultural groups. The lines in Figure 4B indicated no statistically significant difference between the economies compared. We discuss our results, therefore, within cultural groups.
Seven Middle East countries were found to have Profile 1 schools, which were observed in only 15 economies. Except for Turkey, Middle East countries demonstrated a relatively high prevalence of Profile 2, roughly 40% or greater. In contrast, Profile 3 was less prevalent, ranging from 27.04 to 7.52%. Profile 4 formed two distinct clusters characterized by higher and lower percentages. The latter cluster comprised Jordan, Morocco, Lebanon, and Saudi Arabia, most classified as low-SES countries. Fisher’s exact test results indicate no significant differences among Oman, Bahrain, United Arab Emirates, Qatar, and Cyprus (p = 0.577). In contrast, Turkey and Morocco exhibited significant differences from the other Middle East countries.
Profile 1 was absent in Confucian Asia, except for Malaysia. Profile 2 had a similar prevalence (around 34%) in Hong Kong, Malaysia, and Japan, with Chinese Taipei having a higher prevalence and South Korea having a lower prevalence. Profile 3 was more prevalent in South Korea (54.82%) and Hong Kong (37.90%), while the other three had lower proportions (< 23.21%). Profile 4 was less common in South Korea (19.88%) and Hong Kong (28.23%) but more common in the other three systems (> 37.06%). Fisher’s test results showed no statistically significant differences among Malaysia, Japan, and Chinese Taipei (p = 0.381) or between Malaysia, Japan, and Hong Kong (p = 0.056). However, South Korea was significantly different from the other Confucian Asia economies.
Except for Ireland, Profile 1 was not found in Anglo countries. The prevalence of Profile 2 was relatively lower in Anglo countries than in other groups, with the United Kingdom (39.34%) and Ireland (36.91%) having moderate representation. Profile 3 had a lower presence in Ireland (18.12%) and the United Kingdom (5.74%) but higher shares in the other three (>38.93%). Profile 4 had moderate to high representations in Anglo countries, ranging from 35.11 to 54.92%. In this group, Fisher’s test results found no significant differences among New Zealand, the United States, and Australia (p = 0.104).
For the Latin Europe group, no cultural pattern was identified. Profile 1 was found in Italy but not the other two. Portugal and Italy had low shares of Profile 2, but France had a relatively high proportion (43.15%). Profile 3 had a higher presence in Italy (40.52%) but lower in the other two (< 6.21%). All three countries had a moderate to high share of Profile 4, ranging from 41.83 to 84.83%.
Among Nordic countries, Sweden showed significant differences compared to Norway and Finland. Regarding resilience resource profiles, Sweden exhibited a unique pattern with the presence of Profile 1, a relatively low proportion of Profile 2 (20.98%), and a relatively high ratio of Profile 4 (45.45%), respectively, as compared to the other two countries. Fisher’s test results also supported this finding. Norway and Finland were not significantly different (p = 0.082).
Profile 1 was present in Georgia, Kazakhstan, and Romania. Profile 2 had a higher share in Kazakhstan (57.23%) and Romania (70.11%), a moderate presence in Russia and Lithuania (around 30%), and a low share in Georgia and Hungary (< 13.48%). Except for Hungary (71.92%), Profile 3 had the lowest presence in Post-Soviet countries, ranging from 1.02 to 2.17%. Profile 4 had high shares in Georgia (82.27%) and Russia (67.35%), moderate shares in Lithuania and Kazakhstan (around 40%), and relatively low shares in Romania and Hungary (about 20%). Within this group, the distribution of the profiles for Romania and Kazakhstan was not statistically different (p = 0.071).
3.3 Research question 3: relationship between academic resilience and identified profiles
Following the completion of Steps 1 and 2, this study initially conducted an auxiliary logistic regression analysis, regressing the distal outcome of academic resilience on the four identified profiles. The purpose of this analysis was to investigate how these profiles predict academic resilience.
In the regression analysis examining the association between latent profiles and the binary outcome of academic resilience, the odds ratios were obtained from the Mplus output. These odds ratios were then utilized to calculate the corresponding probabilities of being resilient across the different latent profiles (see Table 4), enabling a more accessible interpretation of the results. The probability estimates for students being resilient in Profiles 1, 2, and 3 were calculated as 0.221, 0.213, and 0.206, respectively. In contrast, the probability of students being resilient in Profile 4, referred to as “Well-Supported Schools,” was estimated to be 0.281. We further tested probabilities across profiles via model constraint. The results revealed that the probability of being resilient in Profile 4 was significantly higher than the probabilities observed in the other three profiles (p = 0.000).
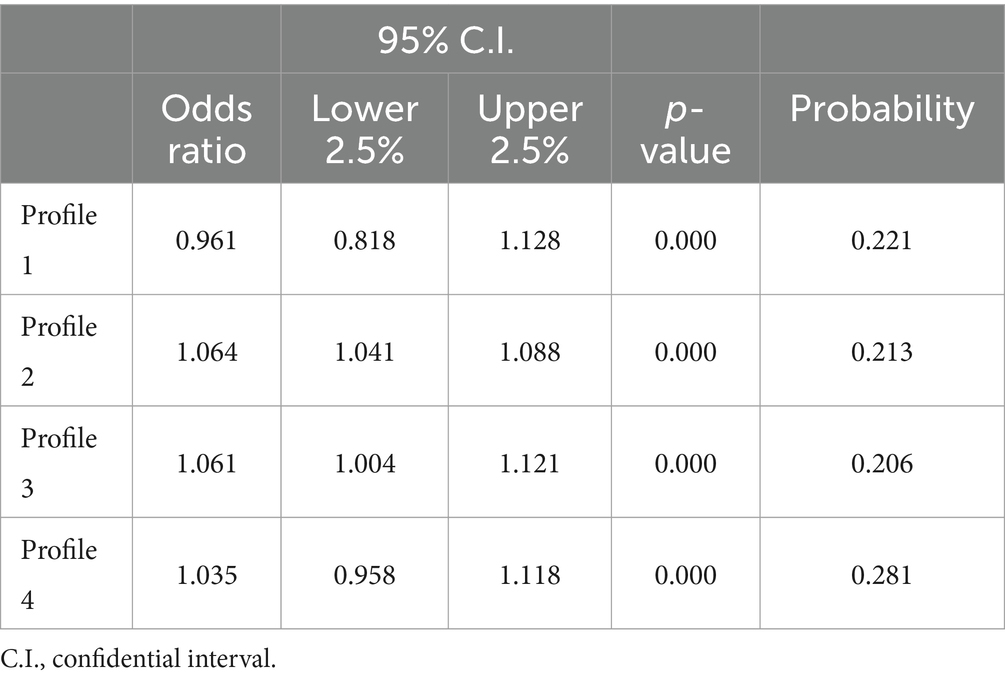
Table 4. Relationship between four latent profiles and academic resilience.
3.4 Research question 4: relationship between academic resilience and education expenditure across profiles
Subsequently, we introduced the covariate, namely education expenditure, into the auxiliary logistic regression, investigating its association with academic resilience across profiles. Positive associations were observed between academic resilience and education expenditure in profiles 2, 3, and 4, with statistically significant relationships found only in profiles 2 (p = 0.000) and 3 (p = 0.037). In contrast, Profile 1 exhibited a negative but non-significant association (p = 0.627) between education expenditure and academic resilience.
Profile 1, denoted as “Vulnerable,” displayed an odds ratio of 0.961 (95% CI [0.818, 1.128]). Profile 2, labeled as “Effective Teaching and Positive Climate,” demonstrated an odds ratio of 1.064 (95% CI [1.041, 1.088]), signifying a 6.4% higher likelihood of resilience with a one-unit increase in education expenditure. Profile 3, termed “Resource-Heavy, Quality-Light,” exhibited an odds ratio of 1.061 (95% CI [1.004, 1.121]), indicating a 6.1% higher likelihood of resilience with a one-unit increase in education expenditure. Profile 4, referred to as “Well-Supported Schools,” yielded an odds ratio of 1.035 (95% CI [0.958, 1.118]) (Table 5).
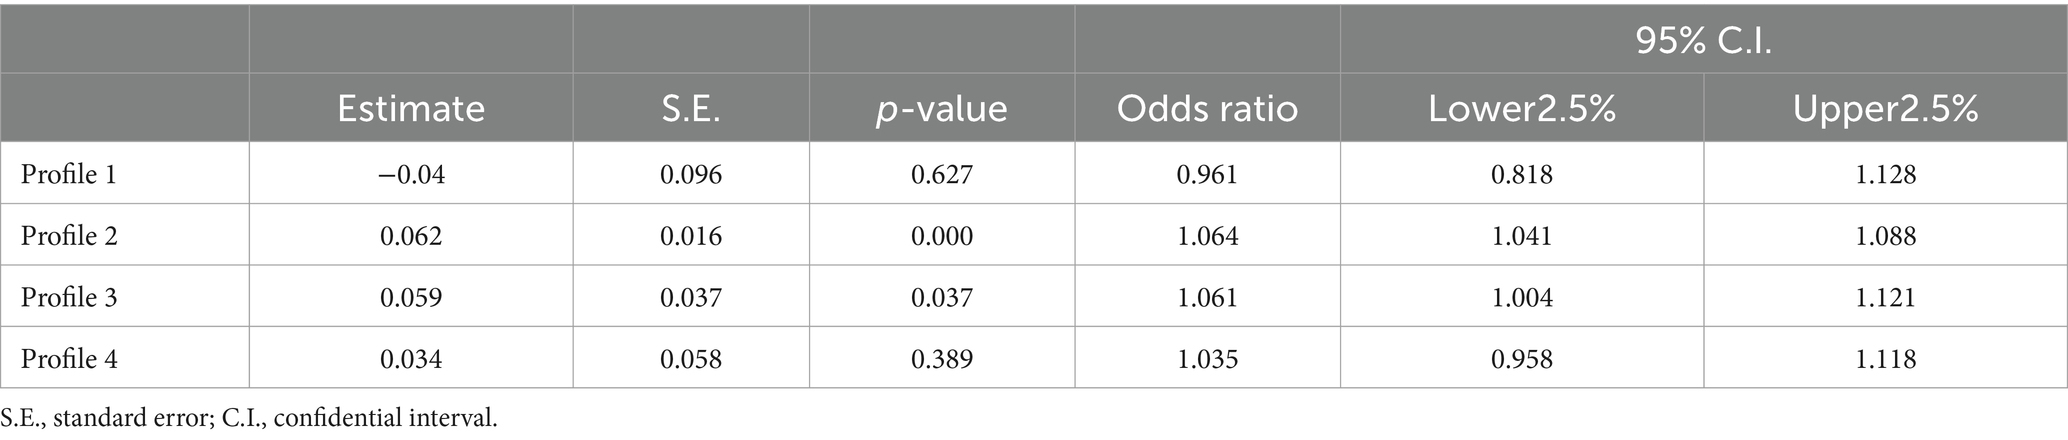
Table 5. Relationship between education expenditure and academic resilience.
4 Discussion
Prior research has identified classroom and school characteristics as predictors of academic resilience. However, certain technical and practical constraints, such as the design of ILSAs and limited access to SES data, have led to a lack of exploration regarding the influential role of these characteristics, including teacher and teaching quality, school resources, and school climate, in predicting academic resilience. Moreover, it has been an open question whether it is possible to identify cultural patterns in such protective factors.
Scholars have dedicated attention to investigating the impact of education expenditure, particularly in countries with limited resources. However, research on the effectiveness of education expenditure in relation to school inputs has been sparse in resilience studies, and there remains a dearth of knowledge regarding the allocation and utilization of funds. Additionally, concerns have been raised regarding the validity of operationalizations of academic resilience, which may impede the generalization of findings across studies.
This study was designed to examine whether profiles of resilience resources exist across different countries, whether cultural patterns can be identified, and whether education expenditure promotes academic resilience within these identified profiles.
4.1 Profiles of resilience resources
This study employed latent profile analysis (LPA), a less commonly utilized approach in the field, to investigate protective factors associated with academic resilience from four key perspectives: teacher quality, teaching quality, school resources, and school climate. By incorporating the covariances among 11 items representing these perspectives, the study accounted for country-specific characteristics in identifying latent profiles of resilience resources. While direct relationships among these protective factors were not established through LPA, several patterns can be observed between them.
One interesting characteristic of the four profiles is that where the teacher quality (particularly when their specializations are more related to mathematics) is high, the three indicators of teaching quality also are high. This is consistent with findings from previous studies that teacher quality and teaching quality are associated (Blömeke et al., 2016).
Another notable characteristic observed in the four profiles is the co-occurrence of low teaching quality, encompassing cognitive activation, instructional clarity, and classroom management, with a correspondingly low school climate. Specifically, indicators reflecting the school’s emphasis on academic success, as well as the climate of order and safety, exhibit lower levels when teaching quality is diminished. This phenomenon can be partially elucidated by the findings of Gore et al. (2022), who discovered that differences in teaching quality are less a reflection of teacher capabilities than of challenging circumstances. A better school climate may mitigate disturbances during class, thereby enabling teachers to focus on improving teaching interactions rather than classroom management.
Prior research has established a positive association between school resources and teaching quality (Hill et al., 2015). Schools with better resources were also known to attract and retain qualified teachers. However, the current study reveals a contrasting pattern wherein profiles characterized by greater school resources, encompassing school socio-economic status (SES), school opportunities to learn (OTL), and mathematics resources, do not consistently exhibit higher levels of teacher quality and teaching quality. This finding may be attributed to educational equity policies that seek to redistribute accomplished teachers to socioeconomically disadvantaged schools.
As mentioned above, profiles characterized by higher levels of school climate display correspondingly higher levels of teacher quality and teaching quality. Notably, the most substantial differences are observed in the indicator assessing a safe and orderly climate, which can be explained by the fact that a safe and orderly support teachers emotionally, socially, and academically.
As previously indicated, profiles characterized by higher levels of school climate exhibit correspondingly higher levels of teacher quality and teaching quality. It is noteworthy that the most pronounced disparities are observed in the indicator measuring a safe and orderly climate. This observation can be attributed to the notion that a safe and orderly climate serves as a supportive environment for teachers, fostering their emotional well-being, social interactions, and academic endeavors (García-Crespo et al., 2021).
It is worth noting that the presence of these four latent profiles vary significantly across countries. Interventions such as aiming at improving teacher quality for Profile 2 schools should take into account the existence of other profiles within the country.
4.2 Cultural patterns in resilience resources profiles across countries
Previous research has assumed that countries sharing similar backgrounds tend to exhibit similarities in academic resilience and have consequently explored protective factors across various countries, including East Asian countries (Cheung et al., 2014) and Southern European countries (Gabrielli et al., 2022). However, there is a dearth of empirical studies investigating the underlying reasons for this assumption. To address this gap, the current study examined the presence of four identified profiles of resilience resources across six distinct cultural groups.
Consistent with prior investigations, several of the examined cultural groups demonstrated certain cultural similarities. Specifically, five out of twelve Middle East countries, four out of five Confucian Asian economies, three out of five Anglo countries, two out of three Nordic countries, and two out of six Post-Soviet countries exhibited no significant differences in their respective profiles of classroom and school protective factors.
However, noteworthy differences were also observed within these cultural groups, particularly among Middle East and Post-Soviet countries. Specifically, the presence of Profile 4, labeled as “Well-Supported Schools,” exhibited distinct proportions in two clusters in Middle East countries, one characterized by higher SES and the other characterized by lower SES. These differences may be partially attributed to variations in economic development, suggesting that the observed disparities in the prevalence of Profile 4 could be influenced by economic factors.
4.3 Academic resilience and profiles of resilience resources
Consistent with a substantial body of prior research (Agasisti et al., 2018; García-Crespo et al., 2022), this study revealed a similar pattern whereby students in profiles characterized by higher levels of resilience resources, including teacher quality, teaching quality, school resources, and school climate, exhibited a correspondingly higher likelihood of academic resilience. In particular, students in Profile 4, distinguished by the highest ratings across nearly all indicators pertaining to the four perspectives of resilience resources, demonstrate the highest probability of exhibiting resilience.
However, an interesting finding emerged where students belonging to Profile 1, denoted by the lowest level of resilience resources, displayed the second highest probability of exhibiting resilience. This phenomenon can be attributed to the operationalization of academic resilience employed in this study, which adopted relative thresholds for performance. Notably, Profile 1 predominantly consisted of students from Morocco, a country characterized by the lowest mean SES among the 36 educational systems in our sample (see Figure 1). Despite this, Morocco demonstrated a relatively high prevalence of resilient students, ranking within the top five among the 36 education systems studied.
4.4 Academic resilience and education expenditure
Consistent with prior investigations (Agasisti and Longobardi, 2017), our analysis revealed significant positive associations between education expenditure and academic resilience for two out of four profiles. Within Profile 2, characterized by low mathematics resources, and Profile 3, characterized by low teaching quality and school climate, a positive and statistically significant association was observed between education expenditure and academic resilience. This finding suggested that promoting academic resilience through these specific factors is plausible.
However, the influence of education expenditure on academic resilience was found to be statistically non-significant in Profile 4, characterized as “Well-Supported Schools.” This observation can be attributed to the already high quality of the schools within this profile, suggesting that additional education expenditure did not result in further improvements in academic resilience. An alternative explanation could be that the education expenditure allocated within this profile was directed toward educational aspects not captured by ILSAs, such as initiatives aimed at promoting student well-being or investments in music and arts education.
In Profile 1 (“Vulnerable”), the relationship between education expenditure and academic resilience exhibited a negative but statistically non-significant association. Although not reaching statistical significance, this negative association provides insights into potential disparities in the distribution of education resources within education systems including Profile 1 schools. Further empirical investigations are warranted to substantiate this assumption and deepen our understanding of resource allocation dynamics in these contexts.
5 Limitations
With an emphasis on profiling resilience resources among disadvantaged students, this study exclusively scrutinized the teacher and school-related information pertaining to this subgroup. It is important to note that this limited scope may not comprehensively represent overall school inputs, particularly in countries characterized by significant income distribution disparities.
Moreover, disadvantaged students were identified based on those who remained in school. Yet, it should be acknowledged that some of the most vulnerable students may already have dropped out of school and are not included in the sampling frame. For example, 37.83 and 2.27% 15-year-old population are not included in the sampling for PISA 2018 in Jordan and Singapore, respectively (OECD, 2019). The application of relative thresholds for risk and positive adaptation yields relatively higher proportions of resilient students in low-SES countries, which could be partially explained by lower coverage of the target population in those countries. Interpreting these findings requires careful consideration, particularly in low-and middle-income countries where student dropout rates are notably high.
To explore classroom factors associated with students’ academic resilience, we used the data from the TIMSS study, in which students are nested in a classroom. Given parsimonious model considerations, classroom and school factors were incorporated both at the school level in this study. Nonetheless, it is important to note that teacher quality in Finland and Taipei exhibited notable disparities between the raw data and the data utilized in this study. Consequently, careful scrutiny is necessary when interpreting the results of these two education systems, particularly concerning teacher education levels and majors.
It should be noted that using the BCH method in this study has methodological limitations that preclude the application of multilevel modeling, including multilevel LPA. While schools were specified as the cluster to address the nesting structure of students and schools, treating education expenditure as a school-level variable does not capture the variances that may exist across schools. Besides, when accounting for various variances and covariances in identifying latent profiles, models struggled to converge, thereby hindering a comprehensive understanding of the relationships between indicators.
Although this paper examined the government expenditure on education (%GDP), no information was known about how funds were utilized. It is plausible that some countries may allocate funds to expand the scope of education, including areas such as music and arts, which are not typically evaluated by ILSAs. It’s recommended that future research more thoroughly examine the specifics of how funds for education are distributed. Besides, we adopted the mean of 2016 to 2018 to measure education spending, which may not accurately reflect the change across time. Moreover, it took time for protective factors to influence the outcome. Future studies are encouraged to explore protective factors longitudinally. For example, conducting interventions targeting on improving teachers’ content knowledge, and analyzing their effects across time may help to identify a more nuanced understanding of the mechanism that contribute to academic resilience.
6 Conclusion
This study found that profiles with teachers more likely to have a major in mathematics and education tend to have favorable teaching qualities. Furthermore, a higher level of teaching quality was observed in profiles with more favorable school climates. However, school resources were not necessarily associated with teacher quality, teaching quality, and school climate in these identified profiles. The presence of these identified four latent profiles varied across cultures. Several cultural patterns were found, which confirms the assumption that similar countries may be more alike in academic resilience. Profiles with higher level of resilience resources tended to predict academic resilience. The varied associations between education expenditure and academic resilience across profiles underscore the significance of contextual factors in supporting disadvantaged students. For instance, providing a dependable avenue for accessing resources might constitute a crucial prerequisite for assisting disadvantaged students in vulnerable schools. Alternatively, in Well-Supported Schools, factors such as effective teaching might be more influential in supporting disadvantaged students. These findings underscore the importance of tailoring interventions and policies to specific contexts and demand greater attention to the complexity of promoting academic resilience in schools.
Data availability statement
Publicly available datasets were analyzed in this study. This data can be found at: https://timss2019.org/international-database/.
Author contributions
WY: Writing – original draft, Writing – review & editing. RO: Writing – original draft, Writing – review & editing. SB: Writing – original draft, Writing – review & editing.
Funding
The author(s) declare that financial support was received for the research, authorship, and/or publication of this article. This research was partly supported by a grant from the European Union’s Horizon 2020 Research and Innovation Programme under the Marie Skłodowska-Curie grant agreement no. 765400, “Outcomes and Causal Inference in International Comparative Assessments (OCCAM).”
Conflict of interest
The authors declare that the research was conducted in the absence of any commercial or financial relationships that could be construed as a potential conflict of interest.
Publisher’s note
All claims expressed in this article are solely those of the authors and do not necessarily represent those of their affiliated organizations, or those of the publisher, the editors and the reviewers. Any product that may be evaluated in this article, or claim that may be made by its manufacturer, is not guaranteed or endorsed by the publisher.
Supplementary material
The Supplementary material for this article can be found online at: https://www.frontiersin.org/articles/10.3389/feduc.2024.1368642/full#supplementary-material
Footnotes
1. ^The introduction of external variables into the regression analysis may result in alterations to the probability of individuals being assigned to specific latent classes.
2. ^Entropy is an index for model-based classification accuracy, with higher values indicating more precise assignment of individuals to latent profiles. Generally, a value close to 1 is ideal and above 0.8 is acceptable.
3. ^Named after Bolck, Croon, and Hagenaars who developed this method.
4. ^The TIMSS data encompass one or more classrooms per school, with some instances involving multiple math teachers per school. However, the majority of the unprocessed data in our study consist of one classroom per school and one math teacher per classroom.
5. ^Students’ ratings on teaching quality (classroom management and instructional quality) were aggregated to the classroom level, and teachers’ ratings on school’s emphasis on academic success and safe and orderly climate were aggregated to the school level.
6. ^Most of the variables used in this paper have composite scale scores in TIMSS, which the technical report confirms are comparable. We conducted measurement invariance tests on the remaining scores.
7. ^Classification for each school was based on its most likelihood of membership.
References
Aburn, G., Gott, M., and Hoare, K. (2016). What is resilience? An integrative review of the empirical literature. J. Adv. Nurs. 72, 980–1000. doi: 10.1111/jan.12888
Agasisti, T., Avvisati, F., Borgonovi, F., and Longobardi, S. (2018). Academic resilience: what schools and countries do to help advantaged students succeed in PISA. OECD Education Working Papers 167. doi: 10.1787/e22490ac-en
Agasisti, T., and Longobardi, S. (2014). Inequality in education: can Italian disadvantaged students close the gap? J. Behav. Exp. Econ. 52, 8–20. doi: 10.1016/j.socec.2014.05.002
Agasisti, T., and Longobardi, S. (2017). Equality of educational opportunities, schools’ characteristics and resilient students: an empirical study of EU-15 countries using OECD-PISA 2009 data. Soc. Indic. Res. 134, 917–953. doi: 10.1007/s11205-016-1464-5
Agasisti, T., Longobardi, S., and Regoli, A. (2014). Does public spending improve educational resilience? A longitudinal analysis of OECD-PISA data. Working papers 3, Società Italiana di Economia Pubblica.
Akkari, A. (2004). Education in the Middle East and North Africa: the current situation and future challenges. Int. Educ. J. 5, 144–153,
Anderson, S. F., Kelley, K., and Maxwell, S. E. (2017). Sample-size planning for more accurate statistical power: a method adjusting sample effect sizes for publication bias and uncertainty. Psychol. Sci. 28, 1547–1562. doi: 10.1177/0956797617723724
Ashkanasy, N. M., Trevor-Roberts, E., and Earnshaw, L. (2002). The Anglo cluster: Legacy of the British empire. J. World Bus. 37, 28–39. doi: 10.1016/S1090-9516(01)00072-4
Asparouhov, T., and Muthén, B. (2014a). Auxiliary variables in mixture modeling: three-step approaches using Mplus. Struct. Equ. Model. Multidiscip. J. 21, 329–341. doi: 10.1080/10705511.2014.915181
Asparouhov, T., and Muthén, B. (2014b). Auxiliary variables in mixture modeling: using the BCH method in Mplus to estimate a distal outcome model and an arbitrary secondary model. Mplus Web Notes 21, 1–22,
Bakk, Z., Tekle, F. B., and Vermunt, J. K. (2013). Estimating the association between latent class membership and external variables using bias-adjusted three-step approaches. Sociol. Methodol. 43, 272–311. doi: 10.1177/0081175012470644
Bauer, J. (2022). “A primer to latent profile and latent class analysis” in Methods for researching professional learning and development: challenges, applications and empirical illustrations (Cham: Springer International Publishing), 243–268.
Blömeke, S., Olsen, R. V., and Suhl, U. (2016). “Relation of student achievement to the quality of their teachers and instructional quality” in Teacher quality, instructional quality and student outcomes. eds. T. Nilsen and J. E. Gustafsson (Cham: Springer International Publishing), 21–50.
Borman, G. D., and Overman, L. T. (2004). Academic resilience in mathematics among poor and minority students. Elem. Sch. J. 104, 177–195. doi: 10.1086/499748
Boutin-Martinez, A., Mireles-Rios, R., Nylund-Gibson, K., and Simon, O. (2019). Exploring resilience in Latina/o academic outcomes: a latent class approach. J. Educ. Stud. Placed Risk 24, 174–191. doi: 10.1080/10824669.2019.1594817
Cheung, K. C. (2017). The effects of resilience in learning variables on mathematical literacy performance: a study of learning characteristics of the academic resilient and advantaged low achievers in Shanghai, Singapore, Hong Kong, Taiwan and Korea. Educ. Psychol. 37, 965–982. doi: 10.1080/01443410.2016.1194372
Cheung, K. C., Sit, P. S., Soh, K. C., Ieong, M. K., and Mak, S. K. (2014). Predicting academic resilience with reading engagement and demographic variables: Comparing Shanghai, Hong Kong, Korea, and Singapore from the PISA perspective. Asia-Pac. Educ. Res. 23, 895–909. doi: 10.1007/s40299-013-0143-4
Chung, Y., Rabe-Hesketh, S., Dorie, V., Gelman, A., and Liu, J. (2013). A nondegenerate penalized likelihood estimator for variance parameters in multilevel models. Psychometrika 78, 685–709. doi: 10.1007/s11336-013-9328-2
Collie, R. J., Ginns, P., Martin, A. J., and Papworth, B. (2017). Academic buoyancy mediates academic anxiety’s effects on learning strategies: an investigation of English- and Chinese-speaking Australian students. Educ. Psychol. 37, 947–964. doi: 10.1080/01443410.2017.1291910
Erberer, E., Stephens, M., Mamedova, S., Ferguson, S., and Kroeger, T. (2015). Socioeconomically disadvantaged students who are academically successful: examining academic resilience cross-nationally. IEA Policy Brief series, 5, Available at: https://www.iea.nl/sites/default/files/2019-04/IEA_policy_brief_Mar2015.pdf
Frønes, T. S., Pettersen, A., Radišić, J., and Buchholtz, N. (2020). “Equity, equality and diversity in the Nordic model of education—contributions from large-scale studies,” in Equity, equality and diversity in the Nordic model of Education. eds. T. S. Frønes, A. Pettersen, J. Radišić, and N. Buchholtz (Springer International Publishing), 1–10.
Gabrielli, G., Longobardi, S., and Strozza, S. (2022). The academic resilience of native and immigrant-origin students in selected European countries. J. Ethn. Migr. Stud. 48, 2347–2368. doi: 10.1080/1369183X.2021.1935657
García-Crespo, F. J., Fernández Alonso, R., and Muñiz, J. (2021). Academic resilience in European countries: the role of teachers, families, and student profiles. PLoS One 16:e0253409. doi: 10.1371/journal.pone.0253409
García-Crespo, F. J., Fernández Alonso, R., and Muñiz, J. (2022). Academic resilience in mathematics and science: Europe TIMSS-2019 data. Psicothema 34, 217–225. doi: 10.7334/psicothema2021.486
Gore, J., Jaremus, F., and Miller, A. (2022). Do disadvantaged schools have poorer teachers? Rethinking assumptions about the relationship between teaching quality and school-level advantage. Aust. Educ. Res. 49, 635–656. doi: 10.1007/s13384-021-00460-w
Hanushek, E. A., and Woessmann, L. (2017). “School resources and student achievement: a review of cross-country economic research” in Cognitive abilities and educational outcomes: a festschrift in honour of Jan-eric Gustafsson, 149–171.
Hill, H. C., Blazar, D., and Lynch, K. (2015). Resources for teaching: examining personal and institutional predictors of high-quality instruction. AERA Open 1:233285841561770. doi: 10.1177/2332858415617703
Huang, M. H., and Chang, S. H. (2017). Similarities and differences in east Asian Confucian culture: a comparative analysis. OMNES 7, 1–40. doi: 10.15685/omnes.2017.01.7.2.1
Jin, S. L., Fang, G. B., Cheung, K. C., and Sit, P. S. (2022). Factors associated with academic resilience in disadvantaged students: An analysis based on the PISA 2015 B-S-J-G (China) sample. Front. psychol. 13. doi: 10.3389/fpsyg.2022.84646
Koirikivi, P., Benjamin, S., Hietajarvi, L., Kuusisto, A., and Gearon, L. (2021). Resourcing resilience: educational considerations for supporting well-being and preventing violent extremism amongst Finnish youth. Int. J. Adolesc. Youth 26, 553–569. doi: 10.1080/02673843.2021.2010578
Luthar, S. S. (2006). “Resilience in development: a synthesis of research across five decades” in Developmental psychopathology, vol 3: risk, disorder, and adaptation. eds. D. Cicchetti and D. J. Cohen. 2nd ed (New York: Wiley), 739–795.
Martin, A. J., and Marsh, H. W. (2008). Academic buoyancy: towards an understanding of students' everyday academic resilience. J. Sch. Psychol. 46, 53–83. doi: 10.1016/j.jsp.2007.01.002
Mullis, I. V. S., and Martin, M. O. (Eds.) (2017). TIMSS 2019 assessment frameworks : Boston College, TIMSS & PIRLS International Study Center Available at: http://timssandpirls.bc.edu/timss2019/frameworks/.
Mullis, I. V. S., Martin, M. O., Foy, P., Kelly, D. L., and Fishbein, B. (2020). TIMSS 2019 international results in mathematics and science : Boston College, TIMSS & PIRLS International Study Center Available at: https://timssandpirls.bc.edu/timss2019/international-results/.
Muthén, L. K., and Muthén, B. O. (2017). Mplus user’s guide. 8th Edn. Los Angeles, CA: Muthén & Muthén.
Nagengast, B., and Marsh, H. (2014). Motivation and engagement in science around the globe: testing measurement invariance with multigroup structural equation models across 57 countries using PISA 2006. In L. Rutkowski, M. Daviervon, and D. Rutkowski (Eds), Handbook of international large-scale assessment: background, technical issues, and data analysis. Boca Raton, FL: Chapman & Hall/CRC Press, 317–344.
Ni, H., Li, C., Li, B., and Xi, H. (2020). Elementary students’ perceptions of classroom resilience-promoting factors in China and the United States. Int. J. Sch. Educ. Psychol. 8, 62–73. doi: 10.1080/21683603.2018.1523030
Nylund, K. L., Asparouhov, T., and Muthén, B. O. (2007). Deciding on the number of classes in latent class analysis and growth mixture modeling: a Monte Carlo simulation study. Struct. Equ. Model. Multidiscip. J. 14, 535–569. doi: 10.1080/10705510701575396
OECD (2011). Against the odds: Disadvantaged students who succeed in school. Paris: OECD Publishing.
OECD (2020). “Sampling” in PISA 2018 technical report. Available at: https://www.oecd.org/pisa/pisa-for-development/pisafordevelopment2018technicalreport/PISA_D_Chapter_04_Sampling.pdf
Özcan, B., and Bulus, M. (2022). Protective factors associated with academic resilience of adolescents in individualist and collectivist cultures: evidence from PISA 2018 large scale assessment. Curr. Psychol. 41, 1740–1756. doi: 10.1007/s12144-022-02944-z
Putwain, D. W., and Daly, A. L. (2013). Do clusters of test anxiety and academic buoyancy differentially predict academic performance? Learn. Individ. Differ. 27, 157–162. doi: 10.1016/j.lindif.2013.07.010
R Core Team (2019). R: a language and environment for statistical computing. Vienna: R Foundation for Statistical Computing Available at: https://www.R-project.org/.
Sandoval-Hernández, A., and Bialowolski, P. (2016). Factors and conditions promoting academic resilience: A TIMSS-based analysis of five Asian education systems. Asia Pac. Educ. Rev. 17, 511–520. doi: 10.1007/s12564-016-944
Sun, J., and Stewart, D. (2007). Age and gender effects on resilience in children and adolescents. Int. J. Ment. Health Promot. 9, 16–25. doi: 10.1080/14623730.2007.9721845
Tudor, K. E., and Spray, C. M. (2017). Approaches to measuring academic resilience: a systematic review. Int. J. Res. Stud. Educ. 7, 41–61. doi: 10.5861/ijrse.2017.1880
Vegas, E., and Coffin, C. (2015). When education expenditure matters: an empirical analysis of recent international data. Comp. Educ. Rev. 59, 289–304. doi: 10.1086/680324
Vicente, I., Pastor, J. M., and Soler, Á. (2021). Improving educational resilience in the OECD countries: two convergent paths. J. Policy Model 43, 1149–1166. doi: 10.1016/j.jpolmod.2021.09.007
Wang, M. C., Deng, Q., Bi, X., Ye, H., and Yang, W. (2017). Performance of the entropy as an index of classification accuracy in latent profile analysis: a Monte Carlo simulation study. Acta Psychol. Sin. 49, 1473–1482. doi: 10.3724/SP.J.1041.2017.01473
Wayman, J. C. (2002). The utility of educational resilience for studying degree attainment in school dropouts. J. Educ. Res. 95, 167–178. doi: 10.1080/00220670209596587
Weller, B. E., Bowen, N. K., and Faubert, S. J. (2020). Latent class analysis: a guide to best practice. J. Black Psychol. 46, 287–311. doi: 10.1177/0095798420930932
Wickham, H., Chang, W., and Wickham, M. H. (2016). Package ‘ggplot2’. Create elegant data visualisations using the grammar of graphics. Version 2, 1–189, Available at: http://ggplot2.org
Keywords: academic resilience, teacher quality, teaching quality, school resources, school climate, education expenditure
Citation: Ye W, Olsen RV and Blömeke S (2024) More money does not necessarily help: relations of education expenditure, school characteristics, and academic resilience across 36 education systems. Front. Educ. 9:1368642. doi: 10.3389/feduc.2024.1368642
Edited by:
Cheng Yong Tan, The University of Hong Kong, Hong Kong SAR, ChinaReviewed by:
Michael D. Broda, Virginia Commonwealth University, United StatesSonia Salvo-Garrido, University of La Frontera, Chile
Copyright © 2024 Ye, Olsen and Blömeke. This is an open-access article distributed under the terms of the Creative Commons Attribution License (CC BY). The use, distribution or reproduction in other forums is permitted, provided the original author(s) and the copyright owner(s) are credited and that the original publication in this journal is cited, in accordance with accepted academic practice. No use, distribution or reproduction is permitted which does not comply with these terms.
*Correspondence: Rolf V. Olsen, ci52Lm9sc2VuQGNlbW8udWlvLm5v
†ORCID: Wangqiong Ye, https://orcid.org/0000-0001-9629-8427
Rolf V. Olsen, https://orcid.org/0000-0002-9621-4083
Sigrid Blömeke, https://orcid.org/0000-0001-6068-4932