 Constanze Schadl
 Anke Lindmeier
- 1Department of Education, Faculty of Mathematics and Computer Science, Friedrich Schiller University Jena, Jena, Germany
- 2Department of Subject-Specific Education Research, Faculty of Humanities, Social Sciences, and Theology, Friedrich-Alexander-Universität Erlangen-Nürnberg, Nuremberg, Germany
Fractions are a relevant yet complex topic of school mathematics. Fortunately, educational research issued rich knowledge of central concepts and associated difficulties for students. Using this knowledge for monitoring learning and formative assessment could support students’ learning process. However, access to apt evidence-based tests is restricted, and paper-based testing limits their practical usability. The digital adaptation of paper-based tests may address these challenges due to affordances like automated test scoring. Further, digital tests may facilitate repeated test use necessary for monitoring and formative activities. The present contribution focuses on fraction subconstruct knowledge and informal fraction knowledge and is part of a systematic research effort to transform paper-based tests into a digital format. With two cross-sectional studies in Grades 6 (N = 233) and 5 (N = 271), each with three measurement points, we investigated the psychometric properties of adapted digital parallel tests regarding their suitability for repeated testing. The internal structure of the adapted digital tests proved to be comparable to that of the original paper-based tests in many, but not all, aspects. Parallel tests were found to be sufficiently parallel. The findings for the two focused constructs support that systematic efforts lead to usable tools for students’ fraction learning. The discussion considers how this supports the transformation of research findings to support the adoption of formative assessment.
1 Introduction
Diagnosing student learning is a key to adaptive instruction, especially in areas where students often struggle (Black and Wiliam, 2004), such as fraction learning (Obersteiner et al., 2013; Vamvakoussi et al., 2011; Van Dooren et al., 2015). Prior studies allow to synthesize sophisticated cognitive models of how students’ understanding of fractions develops (Hansen et al., 2015; Schadl and Ufer, 2023a, 2023b; Vukovic et al., 2014; Ye et al., 2016). For example, prior studies showed the relevance of prerequisites like proportional reasoning or multiplying and dividing whole numbers. While assessment instruments based on these models were developed in the past, the (often paper-based) research instruments have limited practical usability.
The advent of digital assessment offers new opportunities to apply ideas of evidence-based assessment (e.g., from the context of special education, Deno, 2003) more broadly, including in general mathematics education. However, transferring tests from paper to digital formats presents challenges. For instance, paper-based formats may not directly translate to digital formats, potentially affecting the tests’ psychometric properties. Accordingly, test developers must newly investigate the properties of the adapted tests, especially regarding practical needs, for instance, their suitability for repeated measurement.
This contribution reports the digital adaptation of tests for assessing components of fraction knowledge based on an evidence-based model: Fraction subconstruct knowledge (FSK) and informal fraction knowledge (IFK). For both, a long and two parallel short tests were constructed from prior, paper-based tests. The main goal is to evaluate the tests’ psychometric quality, compared to the prior tests. Aspects of validity, reliability, and parallel testing were considered. The study is part of a systematic effort to translate research findings into usable instructional tools, integrating assessment approaches previously considered separately.
2 Toward digital evidence-based assessment of learning based on cognitive models
Owing to the importance of diagnostics in teaching and learning contexts (Black and Wiliam, 2004), standardized assessments have gained interest as tools to diagnose and monitor students’ learning (Fuchs, 2004). Standardized assessments follow different approaches. Curriculum-based measurement (CBM), for instance, relies on frequently assessing basic skills, like mathematics, using broad, generic outcome measures to monitor progress across different curricular content effectively (Christ et al., 2008; Deno, 2003; Foegen et al., 2007). In contrast, assessments building on learning trajectories (LT) address specific (mathematical) contents and aim to represent an individual’s proficiency level with finer granularity regarding the specific contents (Harris et al., 2022).
Despite conceptual differences, CBM and LT-based assessment approaches have similarities in building on theoretically and empirically sound cognitive models of the learning objectives. However, both approaches’ intended uses and benefits differ and are rarely combined (see Confrey et al., 2020). CBM aims to monitor learning longitudinally, for example, to detect intervention effects in special education. As it requires highly sensitive instruments for a wide variety of learners, the tests often focus on a narrow set of “robust indicators” (Deno, 2003; Fuchs, 2004). Students with learning difficulties benefit from CBM (Fuchs, 2004), whereas the findings in the context of general education are inconsistent (Espin et al., 2018; Foegen et al., 2007). In contrast, LT-based approaches focus on diagnosing and relating prior knowledge with learning outcomes and were hence considered appropriate for complex topics in general education (Alonzo and Elby, 2019; Graf and Arieli-Attali, 2015; Harris et al., 2022). Especially in fields like mathematics education, where learning cumulatively builds on prior knowledge, LT-based assessment that considers proficiency levels and students’ readiness for further learning may support teachers in adjusting instructional decisions to individual needs (Confrey et al., 2017). However, LT-based assessments must provide efficient short tests for the different components of the underlying cognitive model (Alonzo and Elby, 2019). To benefit from both approaches, combining CBM and LT-based approaches may merit special attention in general mathematics education. In addition, the recent advances in digital technologies give rise to the hope that evidence-based assessments can be made broadly accessible via digital tools.
A systematic effort to develop assessment tools requires three not necessarily consecutive stages, as proposed by Fuchs (2004) for CBM and adapted to include LT-based approaches by Schadl and Lindmeier (2025). Stage 1 requires identifying relevant components of the content-specific cognitive model of learning and developing tests with sufficient psychometric quality. Stage 2 requires investigating the appropriateness of the tests to detect learning progress based on the cognitive model (e.g., suitability for repeated testing, predictive power of prior knowledge tests). Stage 3 should address the practical usability of assessments. We follow this roadmap for the development of digital instruments to monitor fraction learning, focusing in this report on stage 1 and stage 2 research for two components of the underlying cognitive model.
3 A cognitive model for fraction learning
Cross-sectional and longitudinal research has revealed that fraction knowledge is essential for later mathematical learning (e.g., Barbieri et al., 2021; Siegler et al., 2012; Torbeyns et al., 2015). At the same time, students (McMullen and Van Hoof, 2020; Vamvakoussi and Vosniadou, 2010) and even adults often face challenges when dealing with fractions (Vamvakoussi et al., 2012). Prior theoretical and practical research allows the synthesis of an elaborate cognitive model that relates components of fraction learning outcomes with mathematical prerequisites (e.g., Schadl 2020; Schadl and Ufer, 2023b). This model can be used as an “underlying scale” to monitor student learning for formative assessment.
Different conceptions of fractions and their learning were proposed (e.g., part-whole view: Behr et al., 1983; Jiang et al., 2021; conceptual and procedural knowledge: Rittle-Johnson et al., 2001; magnitude view: Siegler et al., 2011). Our study builds on the part-whole view, as this approach emphasizes the different representations of fractions that contribute to students’ deep understanding of fractions. Specifically, Schadl (2020) describes desired outcomes of fraction learning with three components: FSK, fraction arithmetic skills, and fraction word problem-solving skills.
Fraction learning is also known to build on a range of prerequisites, especially different components of prior mathematical knowledge (e.g., Schadl and Ufer, 2023b; Stelzer et al., 2019; Ye et al., 2016), among them skills to multiply and divide whole numbers, proportional reasoning, but also IFK. Studies detail how different components predict later learning (e.g., Schadl and Ufer, 2023b) and imply that different forms of instructional support (e.g., remedial intervention for central prerequisites) may promote students’ fraction learning in the long term. Recent research (Schadl and Ufer, 2023a) could even describe relations between prior knowledge and outcome components beyond linear relations based on item-response-theory (IRT) scaled proficiency levels.
3.1 Fraction subconstruct knowledge (FSK) as a central outcome of fraction learning
FSK refers to knowledge of particular interpretations of fractions, namely the interpretation of part-whole relations, ratios, operators, quotients, and measures. Schadl (2020) used data from a paper-based study of N = 751 sixth- and seventh-grade students to describe FSK based on IRT methods through proficiency levels. The different fraction representations were found to differentiate between proficiency levels. Particularly, representations as part-whole relations were demarcated from the others as ratios, operators, quotients, and measures. In addition, the degree of situational pre-structuring was impacting difficulty. Students on proficiency level 1 were able to deal with part-whole relations in structured situations, including structured models with equal parts. Level 2 required knowledge to be applied in less or non-structured situations that may require the production of equal parts. Furthermore, knowledge regarding fractions in terms of representing ratios, operators, quotients, and measures in structured situations indicated level 2. Dealing with less and non-structured situations in different representations, for instance, evaluating statements regarding more answer options, was required on level 3. Finally, level 4 required more complex knowledge of the different fraction representations, particularly regarding ratios, operators, and measures.
3.2 Informal fraction knowledge (IFK) as a central prerequisite for fraction learning
Following the part-whole approach, Schadl and Ufer (2023b) suggested IFK as a central prerequisite for fraction learning. The systematic introduction of fractions is usually part of mathematics education in German Grade 6. However, in earlier grades, students typically acquire IFK, which refers to knowledge about simple fractions that are common ( , , ) or at least accessible (e.g., , ) for students (Schadl and Ufer, 2023b). It has to be noted that this knowledge is not systematically taught as fraction knowledge in German primary schools yet relies on everyday contact with fractions, primarily in measurement contexts (e.g., hour = 30 min). Schadl and Ufer (2023b) demonstrated that IFK is a relevant predictor of fraction learning outcomes.
Schadl (2020) described IFK proficiency levels using data from 718 fourth- to sixth-graders working on paper-based tests. The numerical material and the degree of prestructuring proved to be relevant factors. Dealing with fractions such as one half, one quarter, and three-quarters was less demanding for students than dealing with the fractions one-third and two-thirds. Moreover, strongly structured situations that do not require structuring by the students, such as partitioning a whole into equal parts, were characterized as less demanding; slightly or non-structured situations were characterized as relatively demanding. Schadl (2020) used these proficiency levels to describe the relations between IFK and outcomes of fraction learning beyond linear relations in detail. The results showed that particularly students proficient in dealing with unfamiliar fractions and / or slightly or non-structured situations are likely to master higher fraction demands after the systematic introduction of fractions.
4 Research summary
Figure 1 provides a simplified outline of the cognitive model that summarizes previous research on fraction learning. This model informs about structure (of prerequisites and learning outcomes) and proficiency levels of fraction learning based on a part-whole approach. Moreover, it covers predictive relations between components of prior mathematical knowledge and fraction outcomes, which provides an ideal starting point for evidence-based formative assessment combining CBM and LT-based approaches.
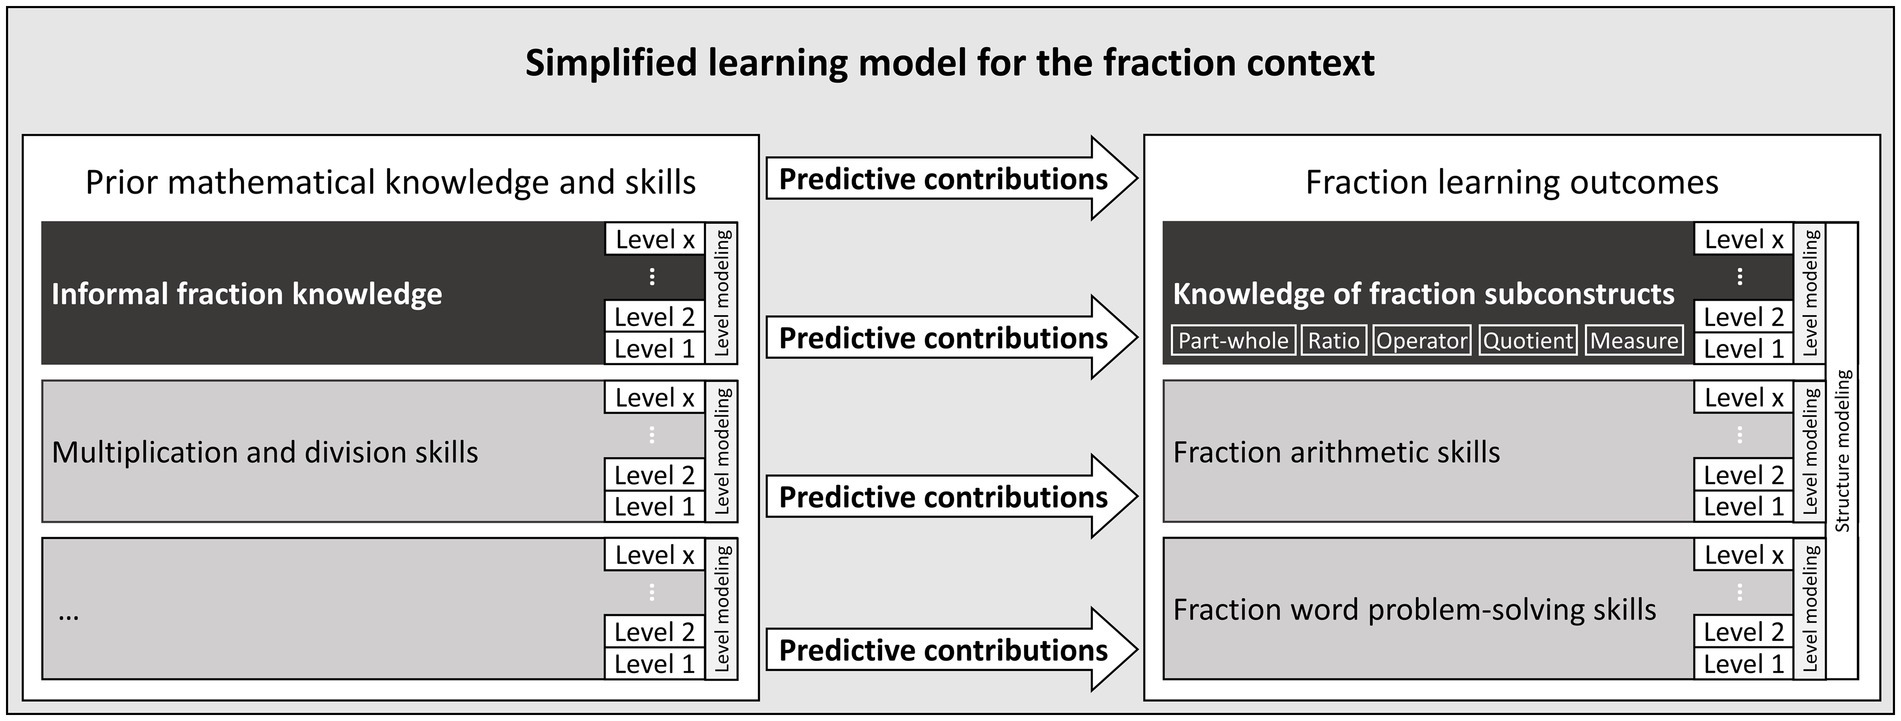
Figure 1. Simplified outline of the cognitive model for fraction learning, relating components of prior knowledge with outcomes.Note: Components include proficiency levels. Black components are focal in this contribution.
Prior test instruments from research are typically not suited for use in instructional practice due to several reasons. First, the tests are often paper-based and hence need considerable resources in scoring and scaling, including research expert knowledge. Second, efficient parallel tests for repeated measurement to monitor learning are typically not available. Consequently, the rich research knowledge about student fraction learning can not be used to support student learning efficiently. However, as argued, digital test instruments may be a means to address this problem, especially if they provide automated scoring and support teachers in diagnostic processes, for instance, by informing them about students’ proficiency levels. Prior tests may be digitized for this purpose. However, this also comes with new challenges: First, item and answer formats of paper-based tests may not be easily transferred to digital formats as problems when entering solutions could occur, particularly for open task formats. Second, prior studies might have indicated needs for improvement, for example, if tests did not cover the full range of proficiencies. Finally, adapted digital tests may possess psychometric qualities different from the original ones or may not meet the practical needs, for instance, in terms of length. So, test developers must newly investigate the properties of the adapted tests regarding the specific intended uses.
In a recent study, Schadl and Lindmeier (2025) examined the psychometric properties of digitized tests for different arithmetic skills in the context of fraction learning. This contribution reports on the digital adaptation of two tests and is part of a systematic effort to transform research findings into usable digital tools for mathematics teaching.
5 The present study
We presented an evidence-based cognitive model for fraction learning that seems suited to develop digital tests mathematics teachers can use to monitor fraction learning. This report focuses on the development of digitized tests for two components of fraction learning (FSK: learning outcome; IFK: prerequisite). Prior paper-based tests were adapted to meet the demands of the intended use for monitoring learning, resulting in three digital parallel tests (one long and two short tests) per construct. Two studies following the same rationale were conducted to answer research questions (RQ) related to the tests’ psychometric quality (reliability, difficulty), validity (replicability of level modeling), and the empirical investigation of the parallelism of tests.
RQ1: Are the adapted digital tests sufficiently reliable? Do they discriminate between students’ abilities in the target population?
RQ2: Which proficiency levels can be described based on digitized tests? Are—as an aspect of validity—these levels similar to those derived using prior (paper-based) tests?
RQ3: Can the long and short tests per construct be considered parallel tests as intended to be suitable for repeated testing to monitor fraction learning? Specifically: Are items intended to be parallel of similar difficulty? Are students assigned to similar proficiency levels based on the different tests?
As we adapted highly reliable paper-based tests (Cronbach’s alpha >.8) for both constructs (Schadl, 2020; Schadl and Ufer, 2023b), we assumed high reliabilities for the digitized tests. We assumed item and test difficulties to be similar to the paper-based settings, with differences most likely appearing owing to the adapted task formats (see method section for further details). Regarding the proficiency levels, we expected the same aspects to be decisive for the levels, supporting content validity. Regarding the parallel tests, we expected the items and tests intended to be parallel to have similar difficulties. In addition, we expected most students to be assigned to similar proficiency levels by all tests per construct.
6 Methods
6.1 Design of the studies
We conducted two studies with different samples of students following the same rationale. We administered the three digital tests in each study (IFK in Grade 5; FSK in Grade 6) at three measurement points. We used a long test of approximately 45 min for the first measurement and short tests of approximately 20 min for the second and third measurements. The time frame in both studies was about three weeks, with roughly one week between two measurement points, and students were not instructed on fractions during this time. The first study on FSK in Grade 6 took place from June 2022 to July 2022. Formal instruction on fractions was completed at this point so that students could be considered representative of the target population for fraction outcome measures. The second study on IFK in Grade 5 took place from October 2022 to January 2023. Students had not yet encountered formal fraction instruction so they could be considered representative of the target population for fraction prior knowledge measures. We briefly introduced the fraction term in study 2 in each test. All tests were administered in a whole-class setting, either in computer rooms or on tablets. The items per test were randomized using the Levumi online platform (Mühling et al., 2019). We obtained approval from the responsible authorities and the principals of all participating schools and ethical approval from the commission responsible for certifying ethical clearance at our university.
6.2 Samples
The total sample of study 1 (Grade 6, 12-year-olds) consisted of N = 233 students (48.9% female, 51.1% male) from nine German classes in Thuringia and Saxony preparing for higher education (Gymnasium). Of the students, 221 (48.4% female) worked on the long test, and 213 (48.4% female) and 216 students (47.2% female) worked on the first and second short tests, respectively; 193 (47.2% female) worked on all three FSK tests. Dropouts occurred because of non-participation at single measurement points. Preliminary analyses with a subsample have been presented in conference proceedings (Schadl and Lindmeier, 2023).
The total sample of study 2 (Grade 5, 11-year-olds) comprised 271 students (53.9% female, 46.1% male) from 16 German classes in Thuringia, of which three classes were in a comprehensive school and 13 classes prepared for higher education (Gymnasium). Of the students, 215 (57.7% female) worked on the long test, 221 (51.6% female) worked on the first short test, and 222 (50.5% female) on the second short test. Of the students, 147 (51.7% female) worked on all three IFK tests, with dropouts due to illnesses not uncommon for this time of the year.
6.3 Instruments
6.3.1 Study 1: FSK
We followed Schadl and Ufer (2023b) and operationalized FSK as understanding fractions as representing part-whole relations, ratios, operators, quotients, and measures. We adapted paper-based tests to assess knowledge related to these subconstructs in a digital setting and prepared three parallel tests (one with 36 items and two with 21 items). Examples of the test items are presented in Table 1. For all constructs, we considered items that were strongly structured (see part-whole and operator subconstructs in Table 1), slightly structured (see tasks with some answer options regarding quotient and measure subconstructs in Table 1), and non-structured (see ratio subconstruct in Table 1, no answer options given). Each test included four kinds of assessment items (so-called “subtypes”) for the part-whole and three subtypes for the other subconstructs.
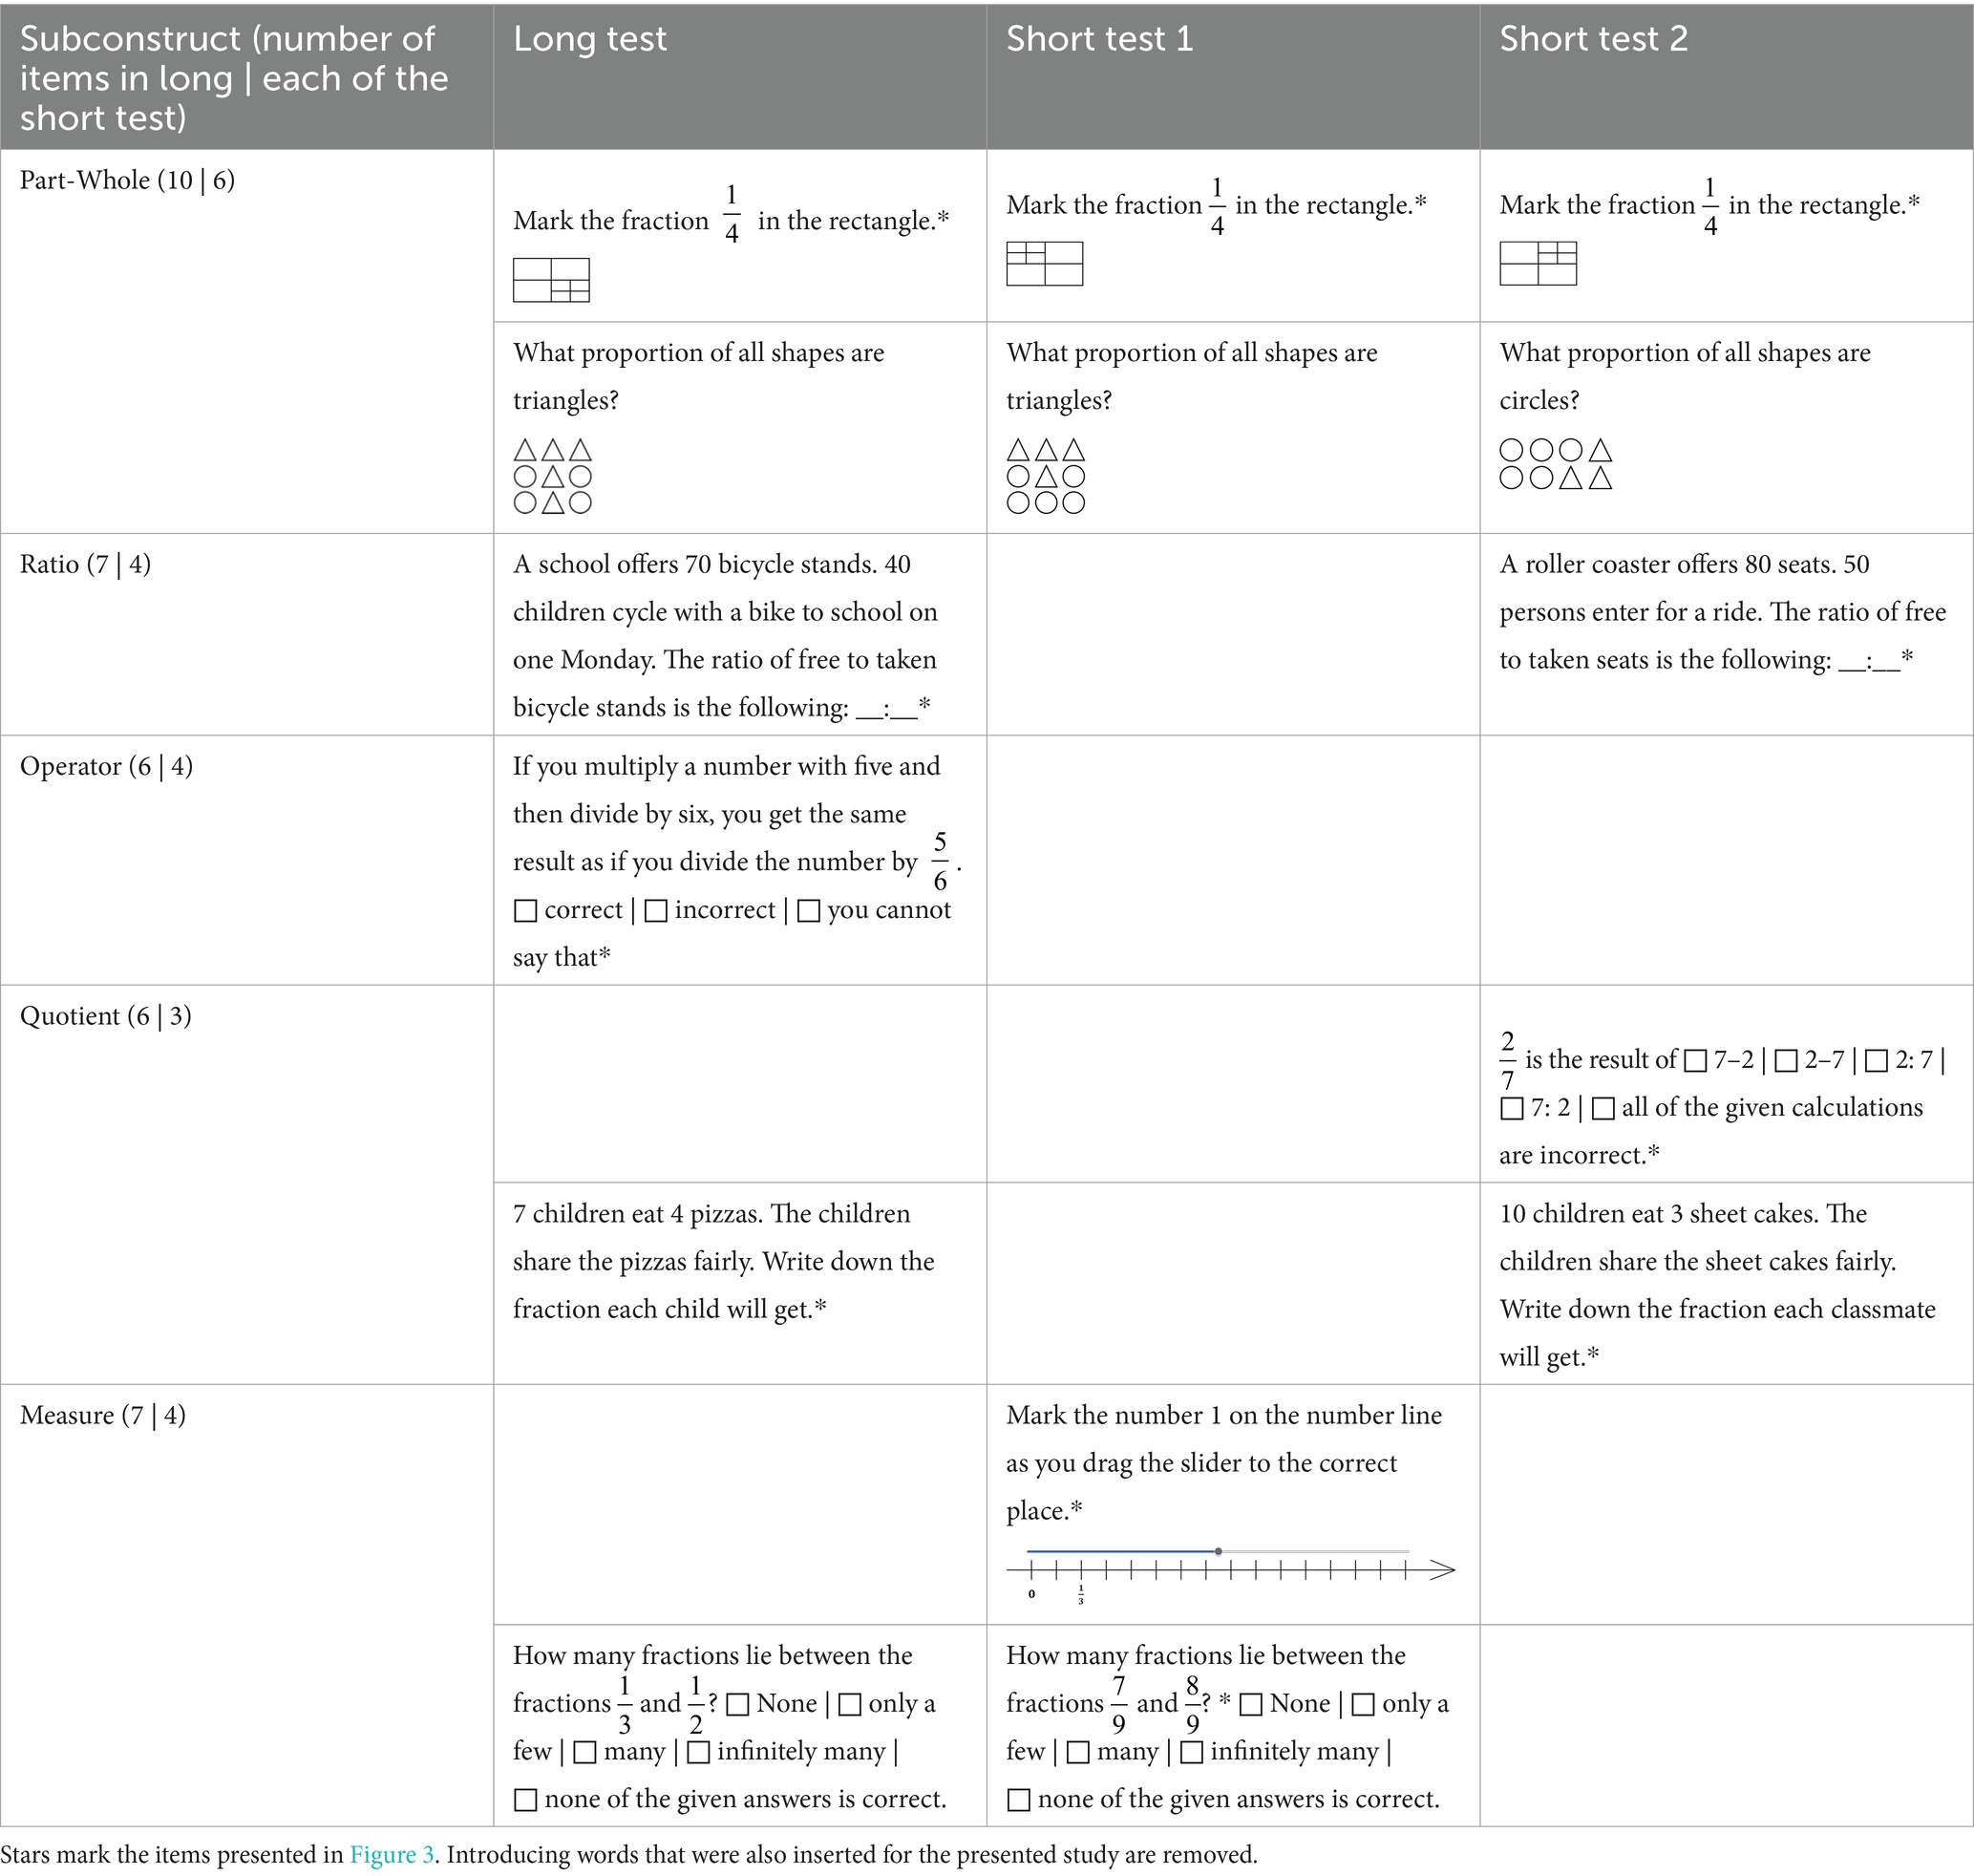
Table 1. Exemplary test items to assess FSK with parallelized graphical representations, numerical symbols, and text modules.
Tasks of subtype 1 for most subconstructs (except the measure subconstruct) required checking the correctness of fraction statements, as can be seen for the operator subconstruct in Table 1. Regarding the measure subconstruct, subtype 1 required placing numbers (number one or fractions) on number lines. Subtype 2 required the judgment of slightly structured fraction statements with more answer options. Subtype 2 differed only for the part-whole subconstruct, which required determining parts in graphical representations (see part-whole subconstruct in Table 1). Subtype 3 was specific for each subconstruct. This subtype required shading parts, identifying ratios, using the inverse operation for the operator subconstruct, dealing with partitive and quotative situations for the quotient subconstruct (see Table 1), and naming the fractions marked on number lines. Subtype 4 demanded the determination of the whole.
For the parallelization of the test, we systematically varied the items. For example, we manipulated graphical representations (for strong parallelization, see rectangles in the first row of Table 1; for slighter parallelization, see representations of triangles and circles for both short tests in the second row). Furthermore, we parallelized the numerical symbols, as seen for the slightly structured items for the measure subconstruct in Table 1, and the text using text modules. Therefore, regarding the ratio subconstruct in Table 1, we replaced the school with a roller coaster, bicycle stands with seats, taken bicycle stands with persons entering, days with a ride, and so on.
Beyond these aspects, digitization required adapting paper-based formats, as problems students could face when entering solutions should be removed. Consequently, we replaced open task formats with closed ones based on students’ responses from the paper-based setting. For example, the paper-based test did not include answer options for the sample task presented in Table 1 for the measure subconstruct. In addition, we supported the students in entering fractions by providing a simplified equation editor, where applicable. Furthermore, the digital tests were intended to capture a broader proficiency range than the original paper-based tests.
6.3.2 Study 2: IFK
We operationalized IFK as knowledge about simple fractions such as , , , and less-known fractions such as and , which are acquired before fractions are systematically introduced in German Grade 6. The digitized tests included the task types identifying simple fractions and word problems with four subtypes per task type (see Table 2 for exemplary items), and they were adapted from Schadl and Ufer (2023b).
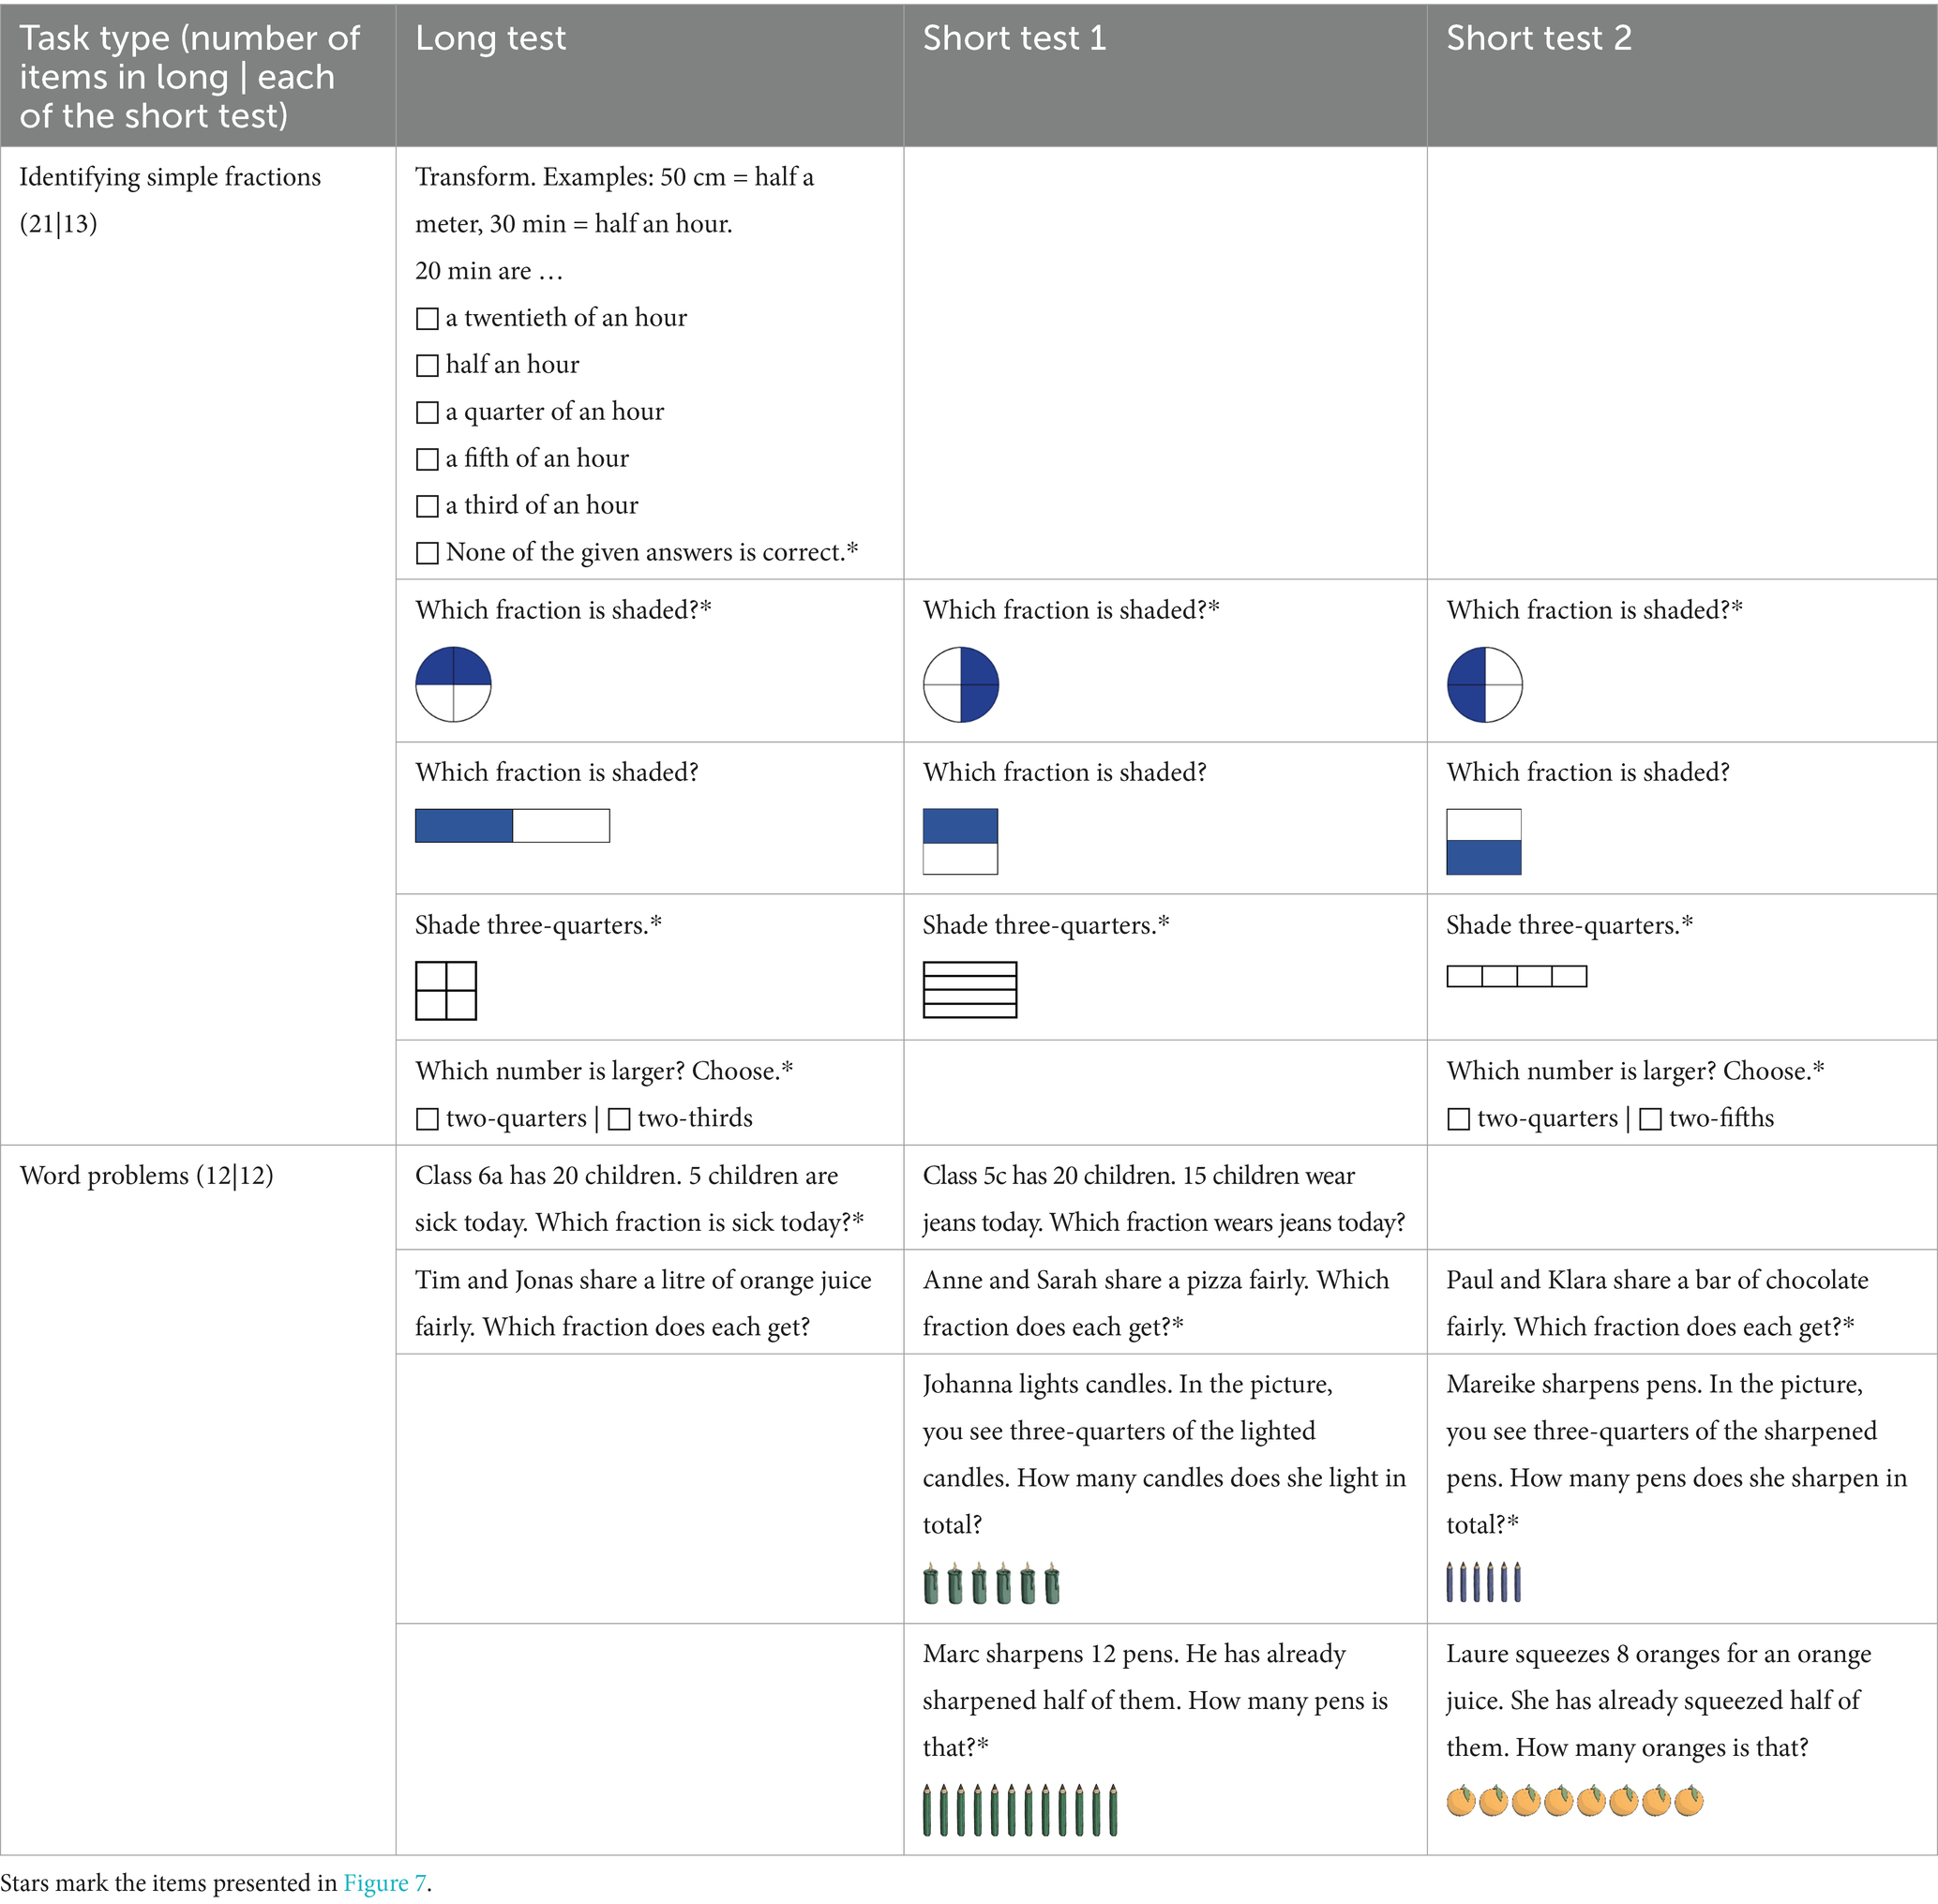
Table 2. Exemplary test items to assess IFK with parallelized graphical representations, numerical material, and text modules.
Subtype 1 required unit conversion to identify simple fractions, such as converting minutes into hours or vice versa. In contrast to the paper-based setting, this subtype was presented in a closed format with six answer options. Subtype 2 required determining simple parts shaded in continuous models, presented as circles or rectangles divided into equal parts. Subtype 3 required shading simple parts in continuous models, presented as rectangles divided into equal parts. Subtype 4 required determining the larger of two simple fractions.
Regarding word problems, subtypes 1 and 2 required determining simple parts, while subtypes 3 and 4 required determining quantities in situations, including graphical representations. Regarding determining simple parts, subtype 1 required forming a part from two natural numbers. Subtype 2 focuses on fair sharing (e.g., chocolate sharing). Regarding the determination of quantities, subtype 3 required determining the whole, and in reverse, subtype 4 required determining the part with the given whole. All graphical representations were presented in rows with equal distances between the objects. Although graphical representations had to be used to solve the problems of subtype 3, this was not necessarily required for subtype 4.
For test parallelization, we systematically varied the numerical material, graphical representations, and relevant text modules. For digitization, we primarily removed open task formats. The long test consisted of 33 items (21 items to identify simple fractions and 12 word problems), and both short tests of 25 items, with 13 items requiring the identification of simple fractions and 12 word problems.
6.4 Data analysis
6.4.1 Treatment of missing data
The MCAR test by Little indicated data were missing completely at random in both the Grade 6 (χ2(453, N = 233) = 390.3, p = .985) and Grade 5 (χ2(800, N = 271) = 812.3, p = .373) samples (Little, 1988; Peugh and Enders, 2004). To use the maximum information available, we estimated missing data through multiple imputation (five imputation samples) based on IBM SPSS’s implementation of Markov chain Monte Carlo techniques (Rubin, 1987, 1996). As we worked with binary variables, the final analyses based on the pooled dataset included the imputed value 0 if the averaged imputed values of the five imputation samples were smaller than 0.5 and the imputed value 1 if the averaged values were larger than 0.5. Hence, analyses base on the total sample of N = 233 sixth and N = 271 fifth graders.
6.4.2 Item-response-theory (IRT)-based methods
The dichotomous Rasch model (Rasch, 1960), as implemented in ConQuest 2.0 (Wu et al., 2007), was applied. This model scales the difficulties of digital tests, represented as item estimates, and students’ performance per test, represented as person estimates, based on IRT methods. Goodness-of-level modeling was explored using standard fit indices such as reliability (Field, 2014; Rost, 2004), item discrimination (Fisseni, 1997; Kelava and Moosbrugger, 2012), and infits (weighted fits). Reliabilities larger than 0.7 (George and Mallery, 2003) or 0.6 (Hair et al., 1998), primarily positive item discrimination (Kelava and Moosbrugger, 2012), and infits in a range from 0.5 to 1.5 (Linacre, 2002; Wright and Linacre, 1994) or in a tighter range from 0.7 to 1.3 (Bond and Fox, 2013) imply acceptable fits. A Wright-Map (Wilson, 2011) allows the joint visualization of item and person estimates with simple tasks and low-performing students visualized further down, and complex tasks and high-performing students further up. If both estimates are the same for a person and an item, the probability of the person answering the item correctly is 50%.
6.4.3 Bookmark method
The bookmark method (Mitzel et al., 2001) is commonly applied to determine test proficiency levels. Item estimates from IRT analyses are used to order items from low to high in a booklet, and experts are asked to identify clusters of items of similar demands and use bookmarks to separate them, which yields proficiency levels. Characterizations based on these demands are derived for each proficiency level, yet overlaps of levels in single cases may occur, as item estimates show statistical variation. As the present study was based on previous paper-based studies (Schadl, 2020; Schadl and Ufer, 2023b), factors influencing item difficulties for FSK and IFK were well-known, and items were designed accordingly. Hence, no external experts were needed to determine item demands. We used the averages of the highest (lower level) and smallest (higher level) item estimates as boundary scores for neighboring levels (see Dimitrov, 2022).
6.4.4 Graphical model tests
For RQ3, graphical model tests based on bivariate scatter plots were used. Specifically, plots were used to compare estimated item difficulties for parallel items and person ability estimates, including proficiency level assignments gained from the parallel tests.
6.4.5 Differential item functioning analyses
Beyond graphical model tests, we conducted differential item functioning (DIF) analyses to investigate parallelism on the item level (Riley, 2011). Specifically, we investigated whether items that were intended to be parallel and administered in the different tests were indeed not affected by differences in item difficulties. Wu et al. (1998) consider items affected if |DIF-estimate| > 2 × DIF-estimate standard error. Alternatively, the half-logit rule identifies affected items by |DIF-estimate| > 0.5 logits (Draba, 1977). More specifically, the relation |DIF-estimate| ≥ 0.43 logits identifies light-to-moderate and |DIF-estimate| ≥ 0.64 logits moderate-to-strong differences (Tristán, 2006). Özdemir (2015) advises carefully examining items with possible parameter differences for plausible explanations, as different criteria may lead to different results. DIF analyses were run for intended parallel (triples of) items across all tests using ConQuest 2.0 (Wu et al., 2007) so that 22 (FSK) and 18 (IFK) items were investigated for DIF.1
Depending on the research question, we used two different analytical approaches. First, we used all data per construct across the three parallel tests, so also across points of measurement. This can be considered reasonable because the three measurement points were within three weeks of instruction on fractions; therefore, we did not expect changes in students’ abilities. This cross-sectional perspective on parallel tests can be considered to equate the tests with a common-person strategy (e.g., Yu and Osborn-Popp, 2005). We used it to investigate the tests’ psychometric quality per construct (RQ1), as the basis for level modeling with the bookmark method (RQ2), and as an approach for inspecting the parallelism of tests (RQ3). For the latter, we conducted graphical model tests with corresponding bivariate scatter plots showing the item estimates per test based on the common IRT-scaling across tests plotted against each other and calculated the Pearson correlation to test the strength of the association. Second, we used the data per construct per test for the questions of psychometric quality that referred to the single tests (RQ1). Regarding RQ3, the graphical model tests based on this approach show the person estimates per test plotted against each other. Where applicable, we compared the findings of both approaches to check for consistency of results across analytical approaches (RQ1, RQ3).
7 Results
The results of the two studies are reported separately and have the same rationale. The first part answers the RQ regarding FSK (study 1), and the second answers those regarding IFK (study 2).
7.1 Study 1: FSK
Regarding the 78 FSK items and RQ1, we observed largely acceptable-to-good fits judged by internal consistencies (Cronbach’s α = .85; WLE-reliability = .85), item discrimination (.02 < rpoint-biserial < .55), and infits from 0.84 to 1.16 (Bond and Fox, 2013; Field, 2014; Linacre, 2002; see Supplementary Table A1 for corresponding fits for the tests).
7.1.1 Replication of proficiency levels
The Wright-Map in Figure 2 visualizes the digitized items of all three tests ordered according to the explored subconstructs and test affiliation and highlights the subtypes with numbers. Selected items from this map are shown in Figure 3.
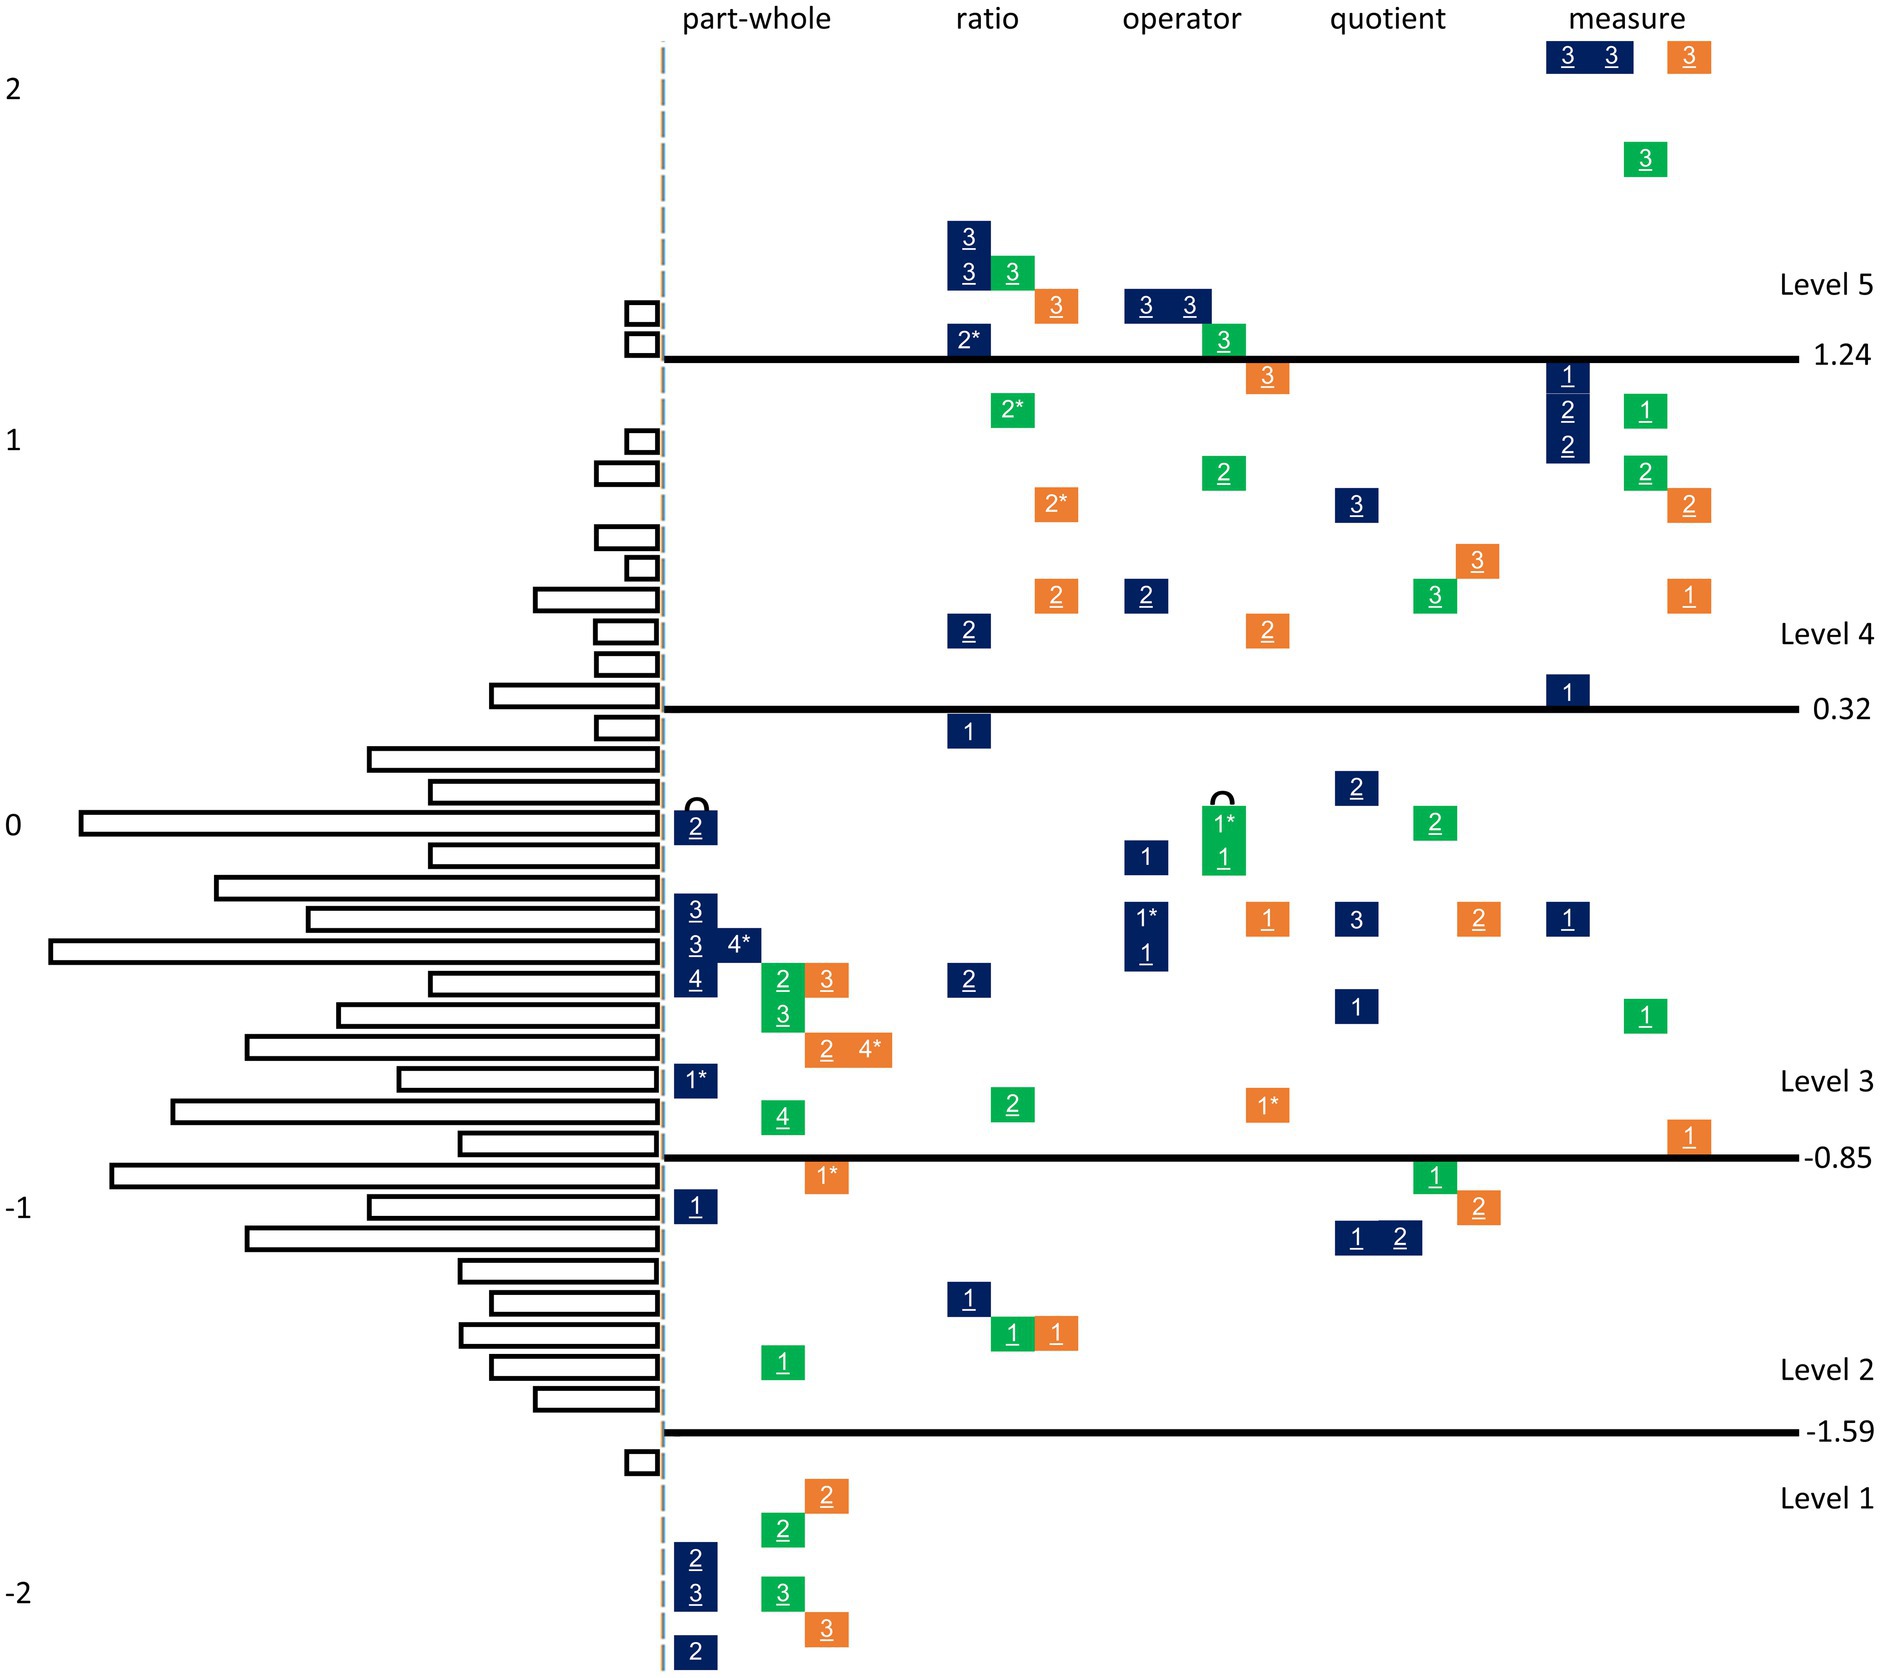
Figure 2. IRT-based proficiency levels visualized in a Wright-Map for FSK assessed in Grade 6.Note: Item estimates based on common IRT-scaling across tests. The blue colored boxes represent items from the long test, green colored boxes items from the first, and orange colored boxes those from the second short test. Numbers 1, 2, 3, and 4 in boxes represent the subtypes. Parallelized items refer to the same subtype within one task type and one level and can be identified by underlinings or, in case of possible occurring misleadings, by stars. In single cases, parallelized items occur within one test. The little curve on items shows items identified by DIF analyses.
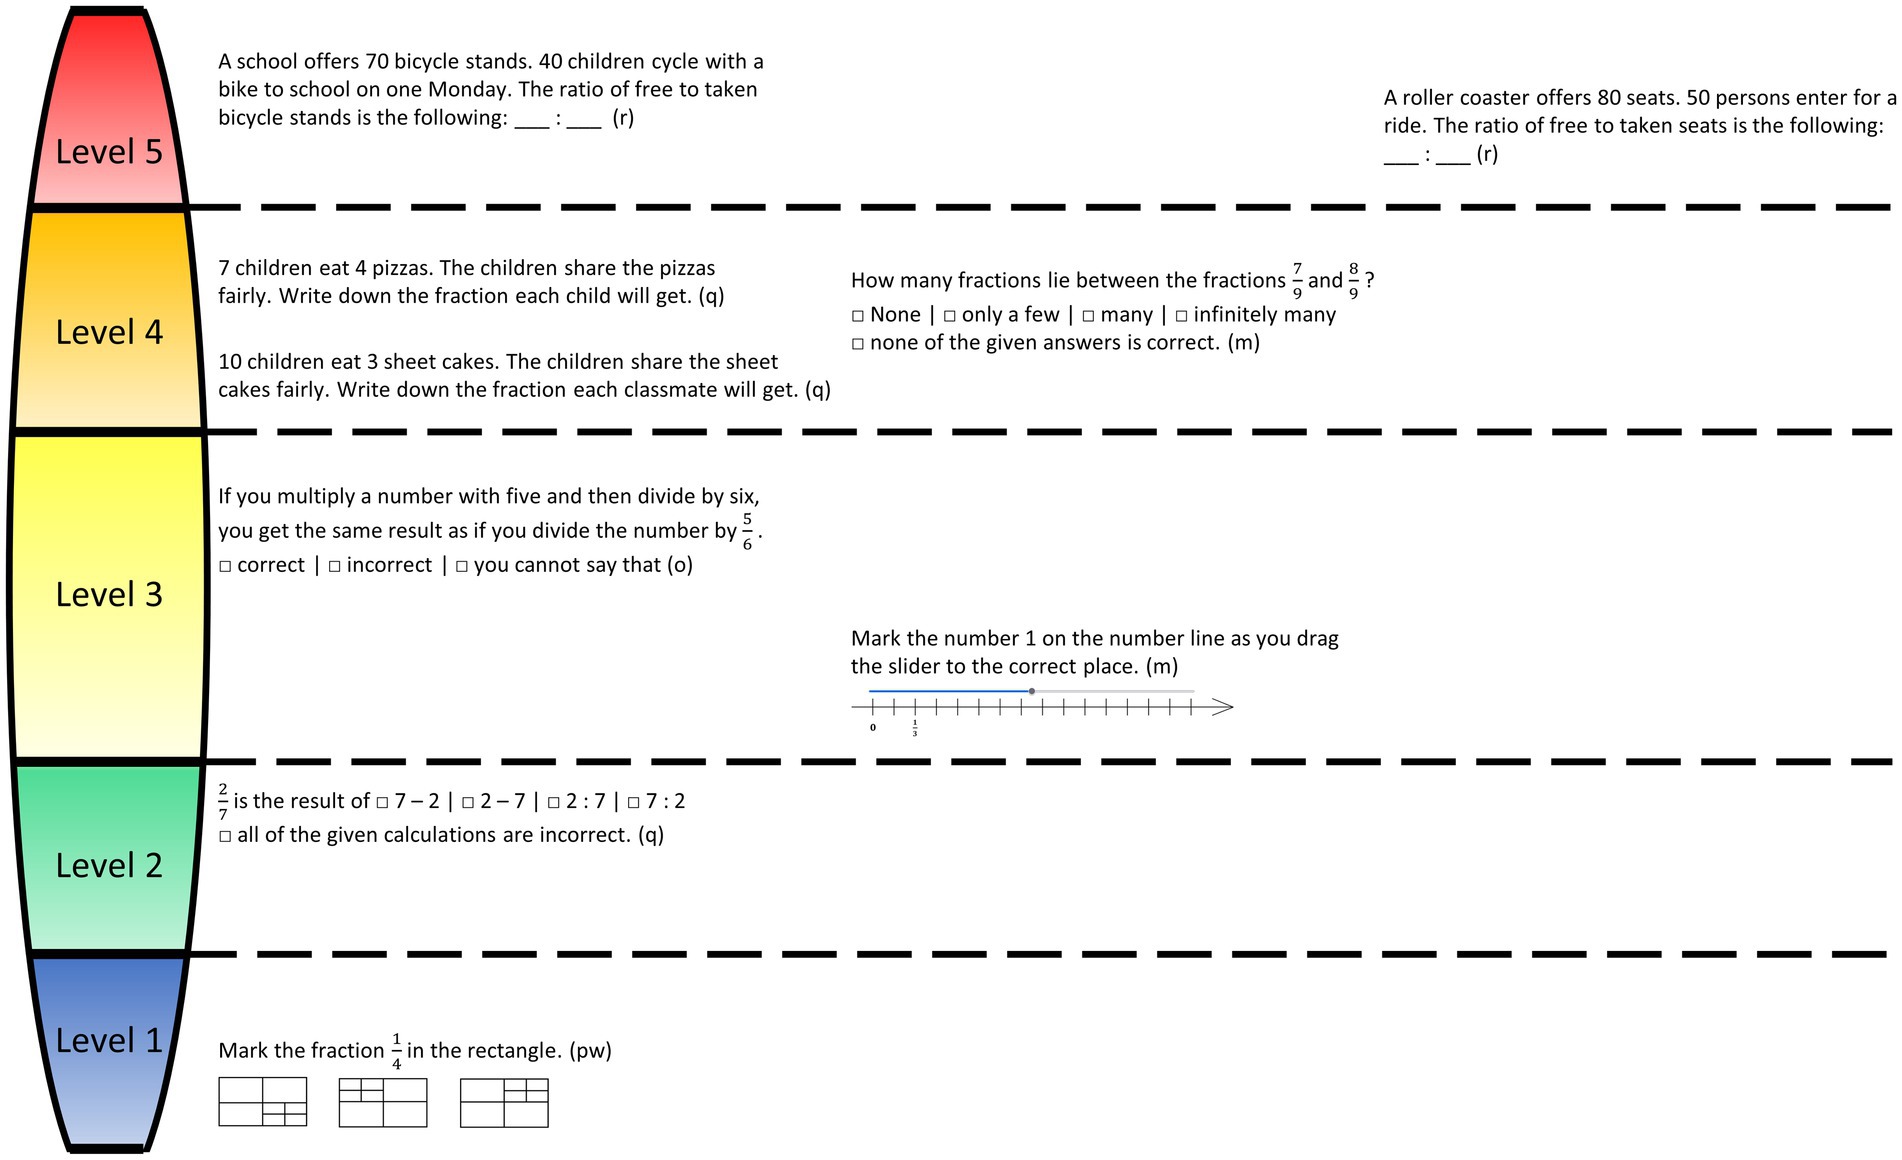
Figure 3. Item examples visualizing proficiency levels of FSK ordered from low to high.Note: Letters in parentheses represent the corresponding fraction knowledge subconstructs part-whole (pw), ratio (r), operator (o), quotient (q), and measure (m).
Level 1. Determining parts in strongly structured graphical representations (part-whole subconstruct). Level 1 describes the part-whole subconstruct in strongly structured task formats for subtypes 2 and 3. Typical tasks require determining parts in strongly structured graphical representations such as identifying parts in models, including triangles and circles, or shading one quarter of a rectangle.
Level 2. Evaluating fraction statements for the subconstructs part-whole, ratio, and quotient as correct or incorrect. Level 2 is characterized by judging statements about part-whole relations, ratios, and quotients, primarily for subtype 1, using the restricted answer option (correct vs. incorrect). The quotient subconstruct also includes tasks that require judging slightly structured statements with more answer options.
Level 3. Evaluating a range of fraction statements and specific subtypes for the part-whole, (quotient), and measure subconstruct. Level 3 describes the evaluation of fraction statements in a range of situations regarding ratio, operator, and quotient subconstructs. Furthermore, it describes specific subtypes of the part-whole, (quotient), and measure subconstructs. In Level 3, the statements from the preliminary level refer to the operator subconstruct (subtype 1) or are more complex, as they require comparing ratios with fractions. Moreover, regarding the quotient and ratio subconstructs, typical tasks require the judgment of fraction statements from several answer options, including equivalent fractions for the quotient subconstruct. Regarding specific subtypes, Level 3 primarily includes subtypes 2, 3, and 4 of the part-whole subconstruct. Whereas subtype 4 occurs for the first time at this level, subtype 2 and 3 tasks are less structured compared to Level 1, as the whole has to be identified before determining the parts (subtype 2), or as the models are not divided into equal parts (subtype 3). Regarding the quotient subconstruct, tasks require determining a fairly shared whole. Regarding the measure subconstruct, number lines require locating number one at the correct location.
Level 4. Evaluating fraction statements for the ratio, operator, and measure subconstruct out of several answer options and specific subtypes for the quotient and measure subconstruct. Level 4 is primarily characterized by the evaluation of statements from several answer options (subtype 2). This refers to the ratio, operator, and measure subconstruct. Regarding the ratio subconstruct, these tasks require identifying ratios based on given numbers or using ratios, whereas tasks at the preliminary level require comparing ratios. Regarding the quotient subconstruct, the tasks of subtype 3 require determining fair shares. Regarding the measure subconstruct, tasks require placing fractions on number lines.
Level 5. Non-structured task formats for the ratio, operator, and measure subconstruct. Level 5 primarily comprises non-structured task formats (subtype 3) for the ratio, operator, and measurement subconstructs. Therefore, typical tasks require identifying ratios using an inverse operation or naming fractions marked on number lines.
In summary, the FSK proficiency levels describe the demands for the part-whole subconstruct and structured situations at lower levels. In contrast, higher levels require interpreting fractions beyond part-whole relations as ratios, operators, quotients, or measures, primarily in non-structured situations. In this context, interpreting fractions as quotients seems more accessible to most students than other interpretations, such as ratios. Hence, as the demand to translate between the part-whole subconstruct and other fraction subconstructs and more or less structured situations seems to generate task difficulty in the digital setting, the proficiency levels are similar to those from the paper-based setting, which supports the tests’ validity (RQ2) (Schadl, 2020). However, when adapting the test, we included easier items. The bookmark method differentiates the lowest level of the part-whole subconstruct such that basic knowledge of part-whole relations is characteristic of the lowest level in the digital setting.
7.1.2 Test parallelism
Regarding RQ3 for FSK, we observed similar total test scores averaged beyond all subconstructs for the long (M = 0.40, SD = 0.15) and short tests (Mshort-test-1 = 0.43, SDshort-test-1 = 0.15; Mshort-test-2 = 0.43, SDshort-test-2 = 0.16), indicating similar test difficulties. Similar test scores across the three digital tests were also reported for the subconstructs (see Supplementary Table A2). All graphical model tests in Figure 4 show strong correlations (Cohen, 1988), indicating that most sixth graders were assigned to similar proficiency levels independent of the test. DIF analysis confirmed this finding. Although these analyses identify two items with DIF estimates larger than twice their standard errors (see items marked with a curve in Figure 2), one for the part-whole (DIF estimate = 0.271; standard error = 0.112), and one for the operator subconstruct (DIF estimate = 0.323; standard error = 0.112), these items are not considered problematic based on the half-logit rule and its fine-grained classification. Furthermore, the plots in Figure 5 indicate that parallel items are of similar difficulty. So, both analytical approaches indicate the long and both short tests to be parallel.

Figure 4. Graphical model tests for stability of ability estimates and proficiency level assignment FSK.Note: Each scatter plot shows the person estimates as obtained by two of the three parallel FSK tests plotted against each other. Person estimates based on separate IRT-scalings per test. pp = person parameter/person estimates. long = long test. short1 = first short test. short2 = second short test. r = correlation.
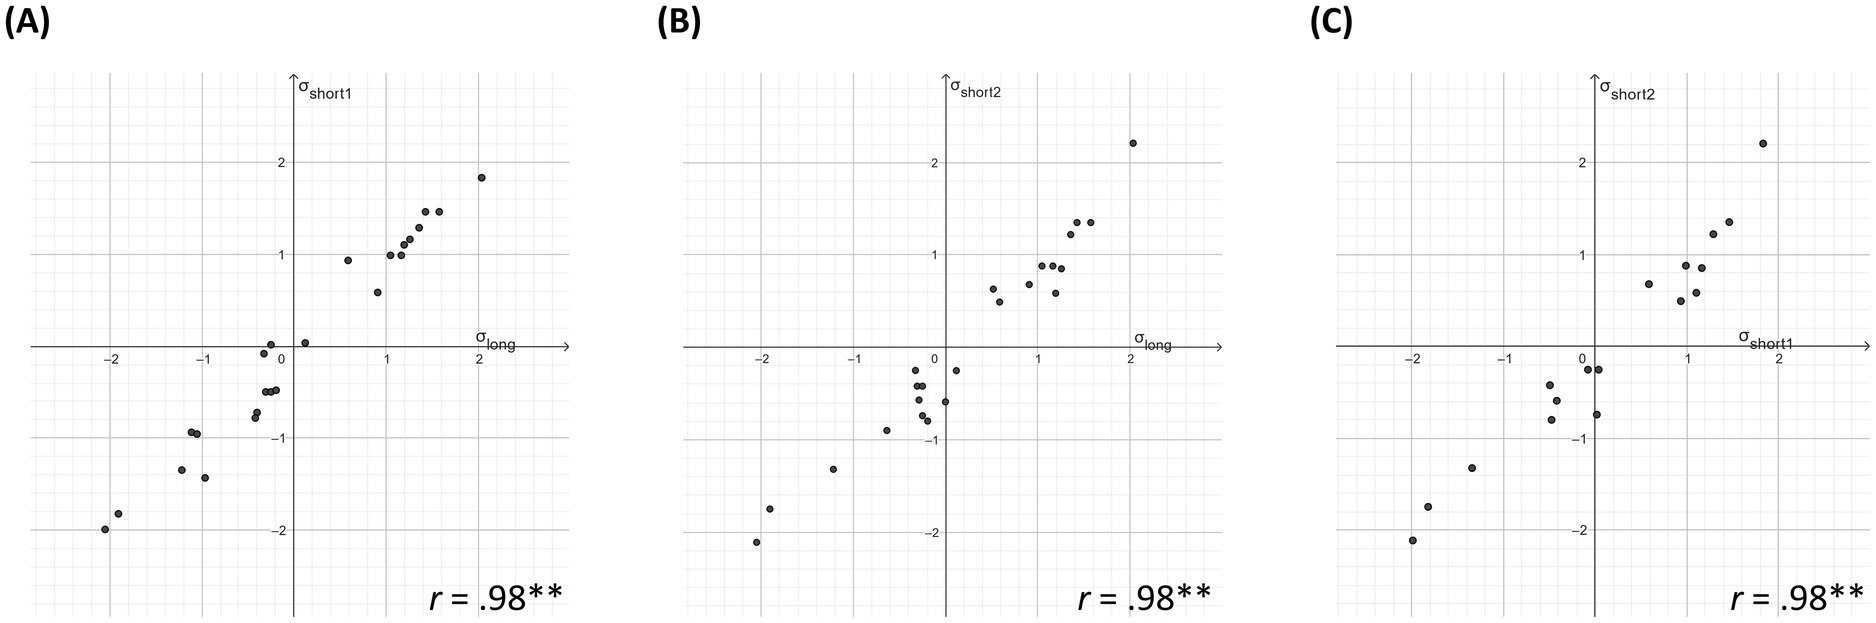
Figure 5. Graphical model tests for parallelism of item difficulties FSK.Note: Each scatter plot shows the item estimates of parallel items as obtained by two of the three parallel FSK tests plotted against each other. Item estimates based on common IRT-scaling across tests. σ = item difficulty/item estimates. long = long test. short1 = first short test. short2 = second short test. r = correlation.
7.2 Study 2: IFK
Regarding RQ1, we observed largely acceptable-to-good fits for the total 83 IFK items as shown by internal consistencies (Cronbach’s α = .93; WLE-reliability = .93), item discrimination (.04 < rpoint-biserial < .58), and infits from 0.84 to 1.23 (Bond and Fox, 2013; Field, 2014; Linacre, 2002; see Supplementary Table A3 for corresponding fits for the tests).
7.2.1 Replication of proficiency levels
Figure 6 shows the items from all three digital tests ordered according to task type and test affiliation and presents the subtypes with numbers. Figure 7 shows the order of selected items in each level.
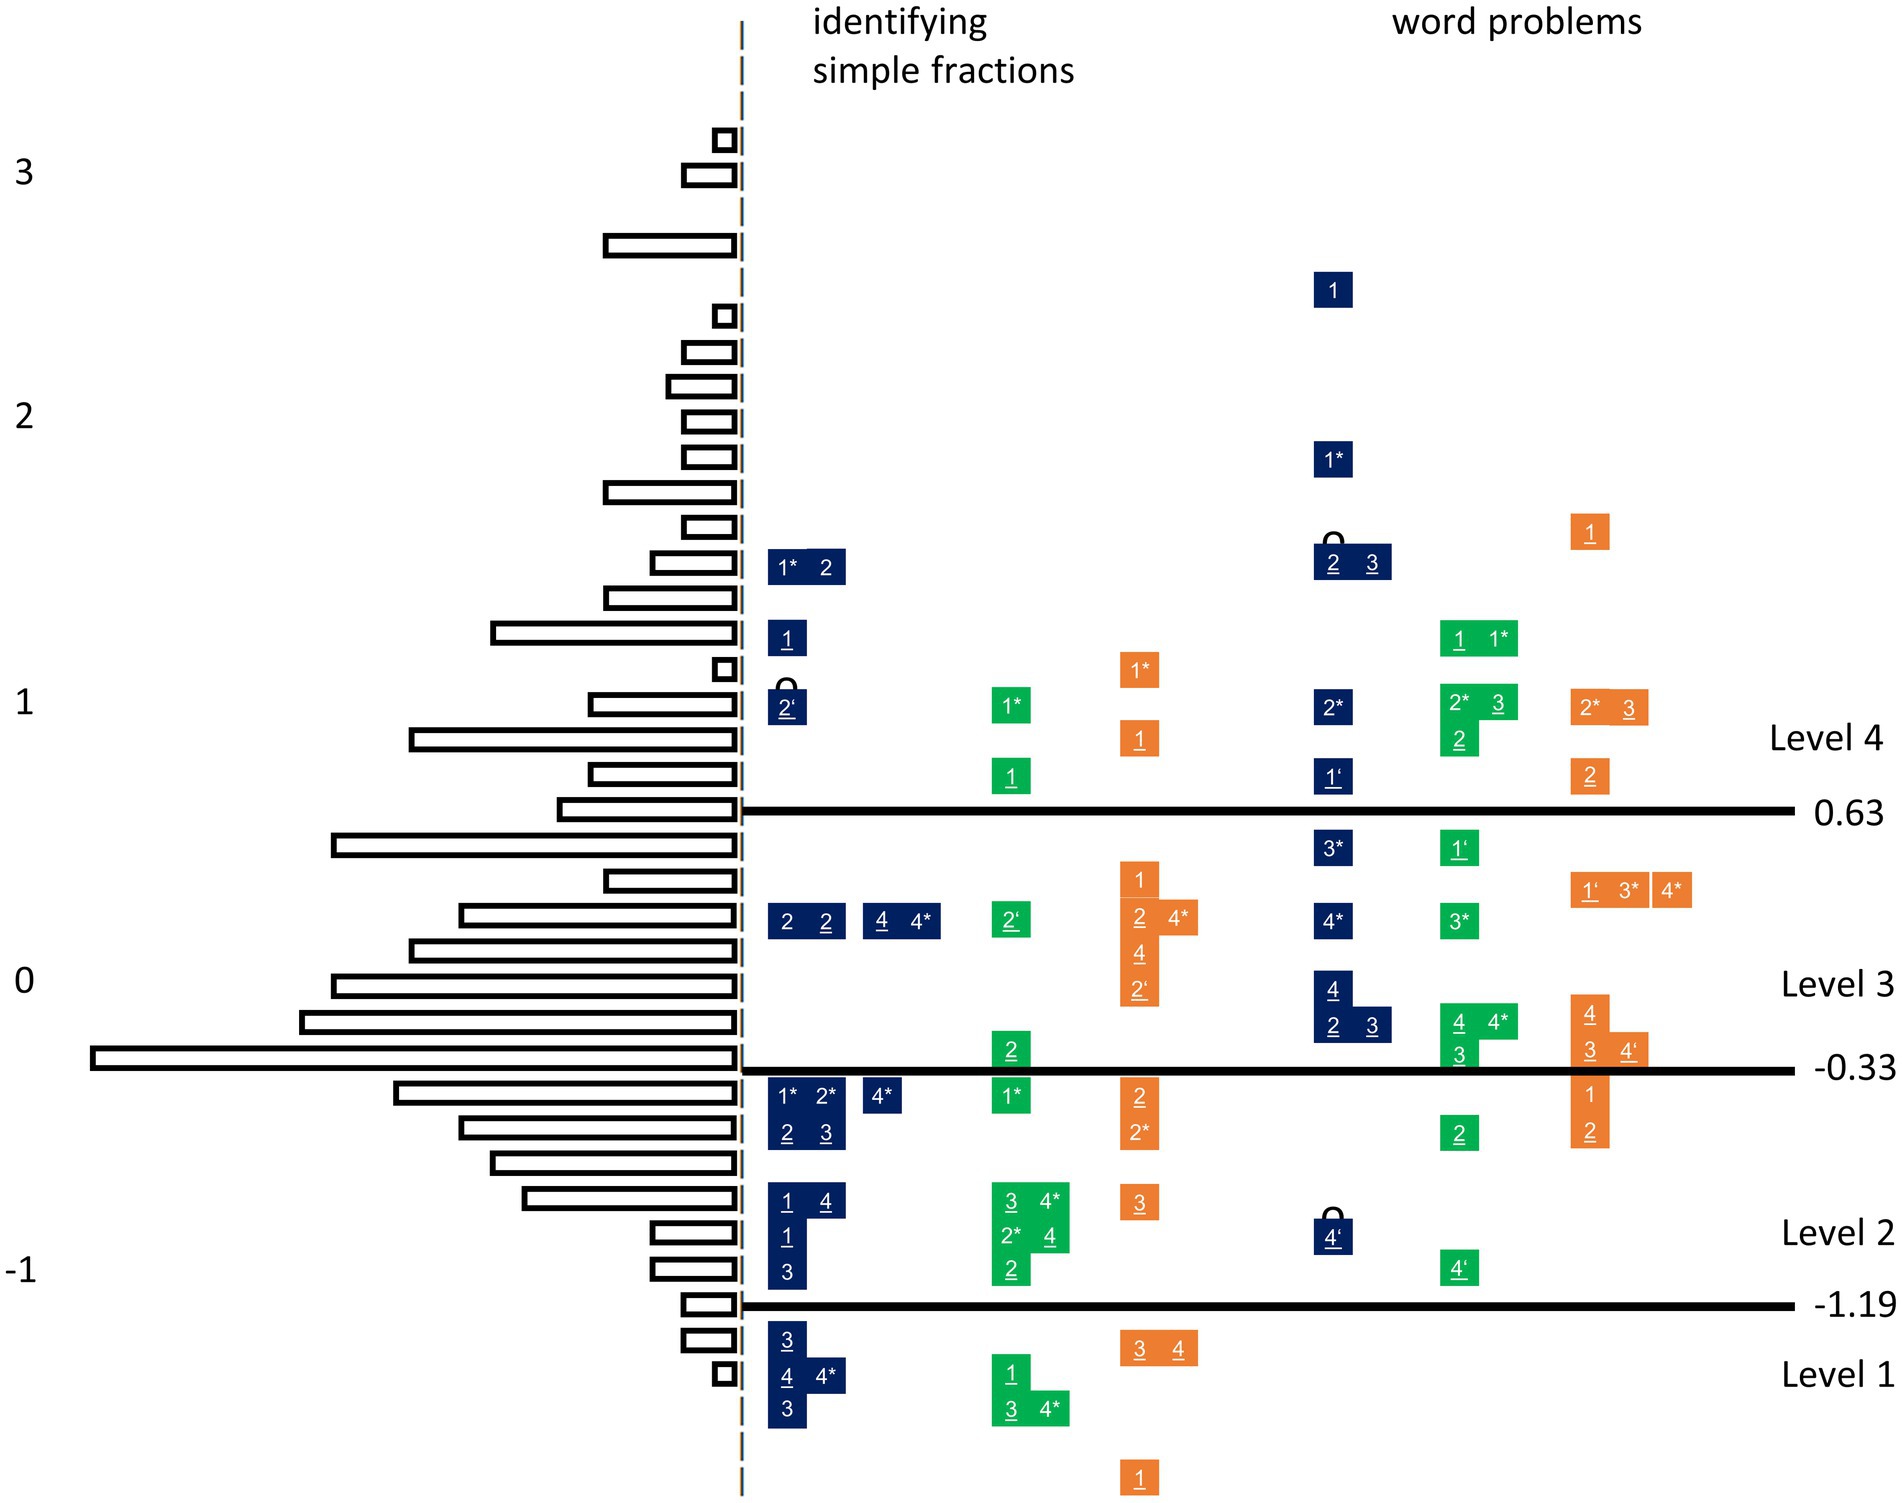
Figure 6. IRT-based proficiency levels visualized in a Wright-Map for IFK assessed in Grade 5.Note: Item estimates based on common IRT-scaling across tests. Numbers 1, 2, 3, and 4 in boxes represent the subtypes. Parallelized items refer to the same subtype within one task type and one level and can be identified by underlinings or, in case of possible occurring misleadings, by stars. In single cases, parallelized items occur within one test. The little curve on items shows items identified by DIF analyses.
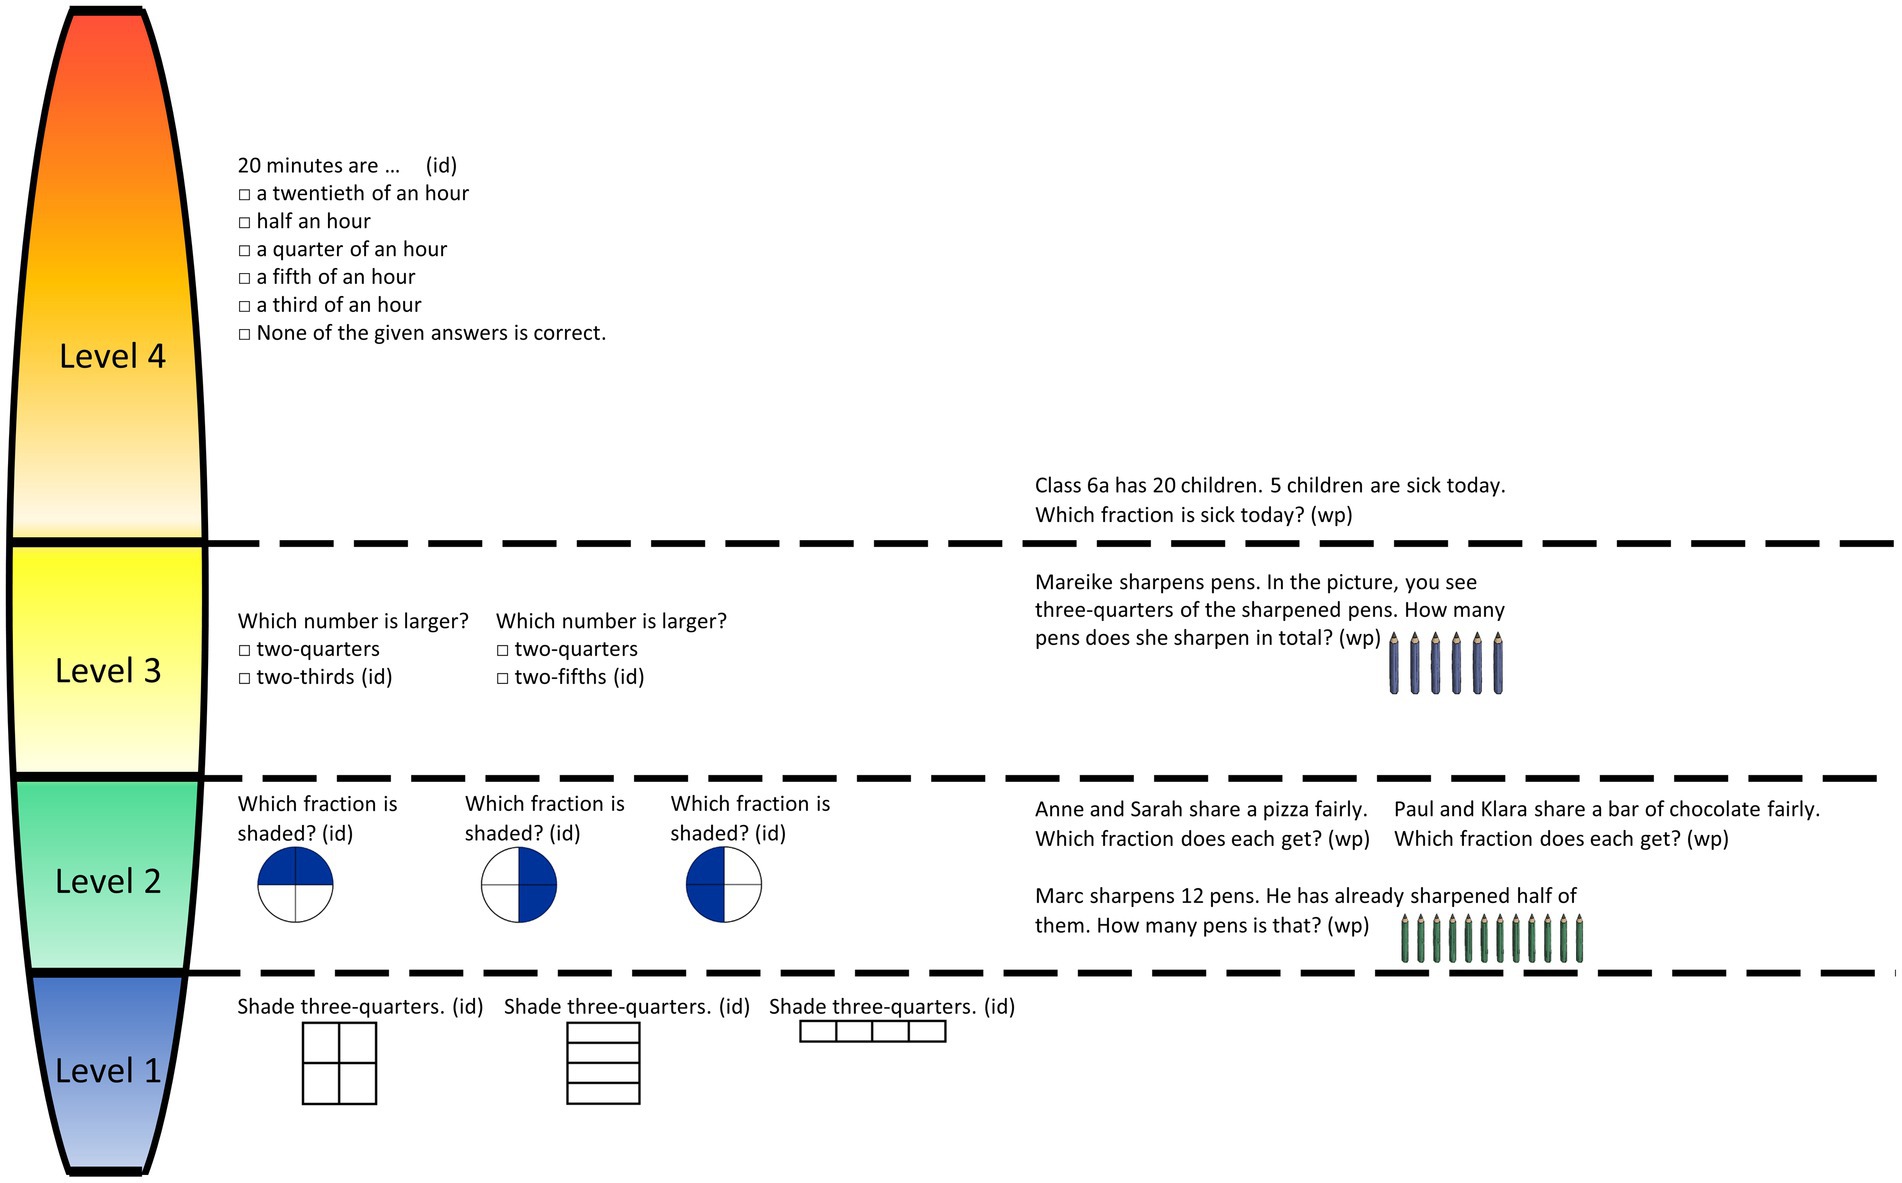
Figure 7. Items examples visualizing proficiency levels of IFK ordered from low to high.Note: Letters in parentheses represent the task types identifying simple fractions (id) and word problems (wp).
Level 1. Identifying simple fractions in ordinary situations. Level 1 describes the identification of simple fractions in ordinary situations. Typical tasks refer to subtypes 1, 3, and 4. Regarding unit conversion (subtype 1), tasks refer to customary time units, such as one quarter or three-quarters of an hour, with conversions required in both directions, that is, converting hours into minutes and vice versa. Subtype 3 tasks require or shading cycles in continuous models. Regarding subtype 4, tasks can be solved with quasi-cardinal ideas or require comparing with one quarter or three-quarters.
Level 2. Identifying simple fractions with more flexibility and dealing with one half in different types of word problems. In Level 2, simple fractions can be identified more flexibly with tasks referring to subtypes 1, 2, 3, and 4. Regarding unit conversion, tasks require converting the time units from the preliminary level to the other way around or referring to length units beyond the preliminary level, again referring to and . Subtype 2 tasks require determining of shaded areas in a circular or rectangular model. Regarding subtype 3, the tasks require shading and of the rectangular models. Regarding size comparison, either the component-wise comparison of nominators and denominators is erroneous or tasks require comparison of or against . Characteristic tasks require dealing with in different types of word problems. Therefore, subtype 1 tasks require forming out of two given natural numbers. Regarding subtype 2, a whole, such as a chocolate bar or pizza, is fairly shared between two persons. For subtype 4, the half must be determined from a given whole.
Level 3. Identifying simple fractions in more difficult situations and determining quantities with the given part or whole beyond dealing with one half. Level 3 describes the identification of simple fractions in more difficult situations, with characteristic tasks referring to subtypes 2 and 4. Subtype 2 tasks require determining or that is shaded in rectangular models or in a circular model. This open task format exceeds the preliminary level by . Regarding subtype 4, tasks require comparing or with the less ordinary fractions, such as , , or , with the parts that largely include the same numerators. Such situations might be more difficult because the same nominators may plausibly trigger the misleading use of component-wise comparisons of denominators more often than in the case of unequal nominators, as in the preliminary level. Furthermore, regarding word problems, Level 3 describes the determination of quantities with a given part or whole beyond dealing with . Typical tasks refer to subtypes 3 and 4. Regarding subtype 3, graphical representations represent or , and the whole subtype must be determined. If graphical representations represent , the demand proves to be easier than if is provided. For subtype 4, either or must be determined from the given whole beyond the preliminary level.
Level 4. Converting time or length units including one-third, two-thirds, or one-fifth, dealing with ordinary parts in more difficult situations, and dealing with less ordinary parts in different types of word problems. Level 4 describes unit conversion with fewer ordinary parts for identifying simple fractions. Therefore, tasks primarily refer to subtype 1, including , , and when converting time or length units. Regarding word problems, this level describes dealing with ordinary parts such as , , or in more complex situations, and dealing with less ordinary parts such as or in different types of word problems, with tasks at this level referring to subtypes 1, 2, and 3. Regarding subtype 1, typical tasks require either forming out of two given natural numbers or identifying two solutions for ordinary parts, such as , , or . Regarding subtype 2, a fair share is achieved among three persons, and the part shared is either the whole or . Regarding subtype 3, the graphical representations represent , and the whole must be determined.
In summary, the IFK proficiency levels from the digital setting describe particular ordinary parts, such as in lower levels concerning both types of tasks, and less ordinary parts, such as at higher levels. This is consistent with the paper-based setting and supports the tests’ validity (RQ2) (Schadl, 2020). Demands requiring identifying simple fractions prove to be easier than those requiring dealing with simple fractions in different types of word problems. Contrary to the paper-based setting and consistent with the expanded item subtypes, the digital tests cover a broader proficiency range over four levels.
7.2.2 Test parallelism
To answer RQ3 for IFK, similar total test scores, averaged across both task types, can be observed for the long (M = 0.54, SD = 0.18) and both short tests (Mshort-test-1 = 0.58; SDshort-test-1 = 0.20; Mshort-test-2 = 0.55, SDshort-test-2 = 0.22). We also observed similar test scores for both task types beyond the three tests (see Supplementary Table A4). Furthermore, strong correlations (Cohen, 1988) in all graphical model tests in Figure 8 provide evidence that most fifth graders showed similar proficiencies beyond the three tests. This was largely confirmed by the DIF analyses, indicating three items to be affected by DIF (see items marked with a curve in Figure 6): one for simple fraction identification (DIF-estimate = 0.391; standard error = 0.112) and two word problems (|DIF-estimates| of 0.247 and 0.420 with standard errors of 0.119 each). These items show DIF estimates larger than twice their standard error, but they were not considered to show DIF based on the half-logit rule and its fine-grained classification. Furthermore, the strong correlations shown in Figure 9 indicate parallel items with similar difficulty. So, both analytical approaches indicate that the long and both short tests are parallel.
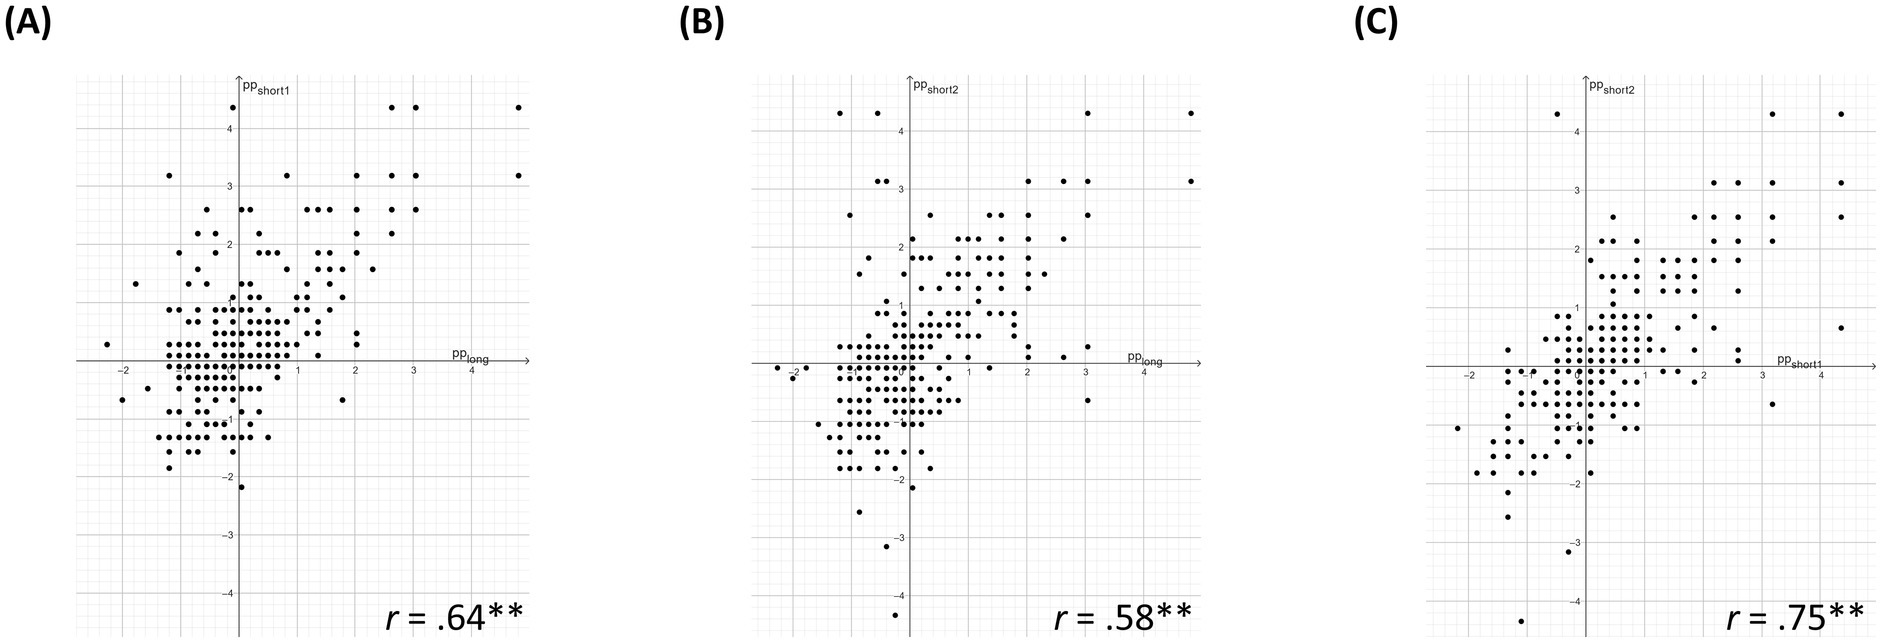
Figure 8. Graphical model tests for stability of ability estimates and proficiency level assignment IFK.Note: Each scatter plot shows the person estimates as obtained by two of the three parallel IFK tests plotted against each other. Person estimates based on separate IRT-scalings per test. pp = person parameter/person estimates. long = long test. short1 = first short test. short2 = second short test. r = correlation.
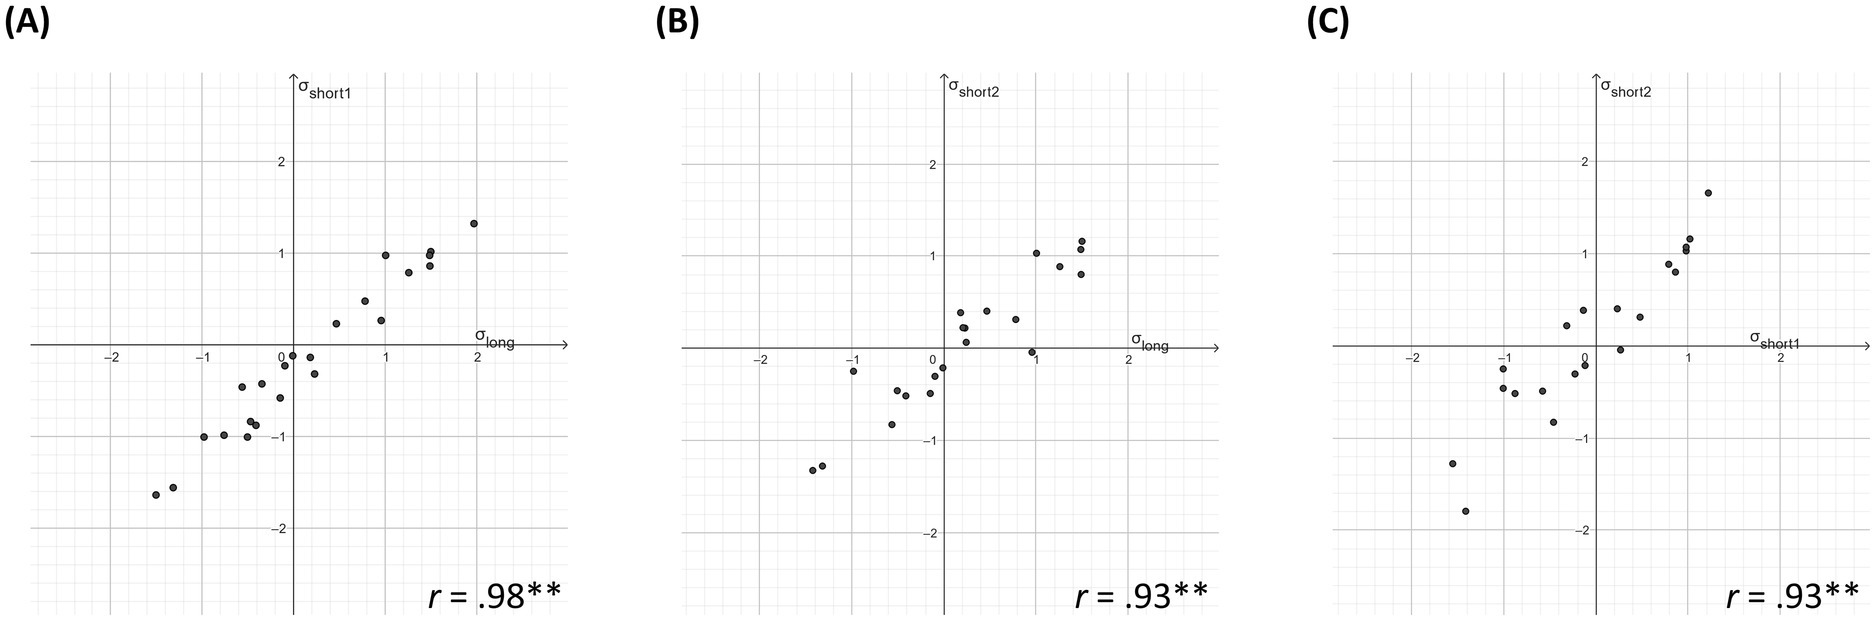
Figure 9. Graphical model tests for parallelism of item difficulties IFK.Note: Each scatter plot shows the item estimates of parallel items as obtained by two of the three parallel IFK tests plotted against each other. Item estimates based on common IRT-scaling across tests. σ = item difficulty/item estimates. long = long test. short1 = first short test. short2 = second short test. r = correlation.
8 Discussion
Fraction learning was found to be challenging yet highly relevant for later mathematical development; hence, supporting its learning, for instance, through formative assessment, is indispensable. Merging CBM and LT-based approaches to monitor learning seems promising as prior research provides a good base to derive a sophisticated cognitive model of fraction learning (e.g., Schadl and Ufer, 2023a, 2023b). This model allows us to answer questions about the structure of fraction knowledge and skills, central predictors, and the hierarchical organization of the outcomes and prerequisites of fraction learning. Although these results regarding fraction learning are highly important and can support mathematics teachers in monitoring students’ fraction learning, they are still restricted to paper-based testing requiring high resources. Thus, the findings have not found their way into practice so far. To close this gap, we systematically investigate the development of digital assessments and merge the advantages of CBM and LT-based assessments. In addition to Schadl and Lindmeier (2025), we present digital parallel tests for the FSK and IFK that explore the psychometric quality of repeated test use for monitoring digital fraction learning.
8.1 Replication of proficiency levels with digitized tests
Regarding the hierarchical organization, FSK and IFK can be described as low to high. The IRT-scaled results revealed that both digitized tests are suitable for assessing a broad proficiency range (RQ1). Confirming the tests’ validity, we observed several similarities to previous paper-based proficiency level models (Schadl, 2020), particularly regarding the central criteria for level characterization (RQ2). Thus, the part-whole subconstruct and structured situations primarily characterize lower FSK levels. In contrast, fraction interpretations such as ratios, operators, quotients, and measures, primarily in unstructured situations, define higher FSK levels. This is consistent with previous literature indicating that several students acquire well-developed ideas about the part-whole subconstruct (e.g., Gabriel et al., 2013; Pantziara and Philippou, 2012), primarily in typically structured situations (Ciosek and Samborska, 2016), which is more pronounced than other fraction interpretations (e.g., Charalambous and Pitta-Pantazi, 2007). Prior studies have consistently shown that most students struggle with measure interpretation (Charalambous and Pitta-Pantazi, 2007; Pantziara and Philippou, 2012), particularly with the interpretation of density (e.g., McMullen and Van Hoof, 2020; Van Hoof et al., 2015). That this interpretation was less demanding in our study could be due to the closed response format with more answer options. Among the fraction interpretations as ratios, operators, quotients, and measures, our results indicate that the quotient interpretation is the most accessible for sixth graders. This is inconsistent with the findings of Charalambous and Pitta-Pantazi (2007), who provided evidence for the relative ease of ratio interpretation. This inconsistency may be attributed to cultural diversity (Jiang et al., 2017).
Regarding the IFK level model, consistent with Padberg (2002) and Schadl (2020), we observed that simple fractions, such as one half, were more familiar to several students than fractions like one-third or two-thirds, for example. This could be plausibly explained by the fact that the fifth graders in our study had encountered simple fractions in prior education at most in the context of measures. Furthermore, it can be assumed that these students have dealt with more familiar fractions, such as one half, more often in everyday life (e.g., half an hour, half a pizza) than with less familiar simple fractions. Identifying simple fractions seems less challenging than solving word problems involving simple fractions, consistent with prior findings that reading comprehension is related to mathematics achievement (e.g., Akbasli et al., 2016).
Despite the similarities between digital- and paper-based settings, we detected some differences, particularly regarding the number of levels. This resulted from our intention to assess both constructs as broadly as possible in a digitized setting. Moreover, we adjusted some task formats for digitization to offer students age-appropriate access to the test materials and avoid expected problems, such as entering fractions, when working on digitized tests.
8.2 Test parallelism
Regarding RQ3, the intended parallel tests for FSK and IFK proved to show sufficient parallelism and, hence, to be suitable for repeated testing to monitor fraction learning. This was indicated by the similar test scores for the total scores and those for different task types. Additionally, this was supported by different model tests that indicated the long and short tests to be of similar difficulty and students to be assigned to similar levels independent of whether they worked on the long or one of the short tests. The parallel items were also unremarkable regarding DIF, considering different detection criteria. As neither different fraction interpretations nor simple fractions were taught during data collection, we expected students’ proficiencies to remain stable. Small deviations were expected due to situation-related and largely uncontrollable aspects (e.g., student timetables) or statistical variation. However, it cannot be ruled out that working on the tests itself was a learning opportunity for the students. In summary, these results seem promising for the intended formative assessment purposes in fraction learning.
8.3 Limitations and further research efforts
Our purpose is to investigate whether digital assessments merging the advantages of CBM and LT-based assessments can be a way to transform research findings into usable tools for mathematics teaching. Thus far, we have digitized tests for different prerequisites and outcomes of fraction learning (e.g., Schadl and Lindmeier, 2025) and primarily explored questions regarding their psychometric quality. Future research efforts arise from these studies’ open questions and limitations. For instance, studies have to investigate the predictive power of the IFK measure and the practical usability of the FSK measure to monitor learning (cf. Fuchs, 2004; Schadl and Ufer, 2023a, 2023b). In this context, other prerequisites and learning outcomes should also be considered according to the underlying cognitive model of fraction learning. To address these limitations, future studies must replicate the results for IFK and FSK based on larger samples and triangulate them with further measures. Here, the corresponding tests might show the same length, with each item having parallelized items, so biased items could be explored based on larger datasets.
Our tests included a range of task types, although fewer task types are typically associated with psychometric advantages, such as the tests emerging as highly reliable and sensitive. However, from a mathematics education perspective, the variety of task types is necessary because of the complexity of the content, where different types of tasks are supposed to span a broad proficiency range from low to high levels (Peck et al., 2021). Nevertheless, shortening the tests might be required to attain efficient tests, which should be verified by further evidence. However, for the intended purposes, instruments’ standardization must be carefully weighed against the contents’ complexity (Christ et al., 2008). Therefore, shortening might be advised for tests of prerequisites rather than fraction learning outcomes.
Finally, it is to be emphasized that German curricula consider systematic fraction introduction in Grade 6 (12-year-olds) and that IFK is usually acquired earlier. Thus, our findings regarding the structure and proficiency levels of IFK might have to be systematically reevaluated, especially for the use in educational systems that thematize systematic fraction introduction earlier or with a different approach. Despite these limitations, the studies show that it is possible to transform the prior research based on fraction learning into evidence-based digital tests. So, there is hope that formative assessment based on learning monitoring will become more accessible to teachers.
Data availability statement
The raw data supporting the conclusions of this article will be made available by the authors upon reasonable request, without undue reservation.
Ethics statement
The studies involving humans were approved by the Ethics Committee of the Faculty of Social and Behavioural Sciences at the Friedrich Schiller University Jena (approval number: FSV 22/094). The studies were conducted in accordance with the local legislation and institutional requirements. Written informed consent for participation in this study was provided by the participants’ legal guardians/next of kin.
Author contributions
CS: Conceptualization, Data curation, Formal analysis, Investigation, Methodology, Project administration, Software, Validation, Visualization, Writing – original draft, Writing – review & editing. AL: Funding acquisition, Supervision, Validation, Writing – original draft, Writing – review & editing.
Funding
The authors declare that financial support was received solely for covering the article processing charges. The authors acknowledge support by the German Research Foundation Projekt-Nr. 512648189 and the Open Access Publication Fund of the Thueringer Universitaets- und Landesbibliothek Jena.
Acknowledgments
The administration of test materials was supported by the Levumi team, which provided the online platform Levumi (www.levumi.de). The authors used Grammarly Pro to improve the language and readability during the preparation of this study. After using this service, the authors reviewed and edited the content as needed.
Conflict of interest
The authors declare that the research was conducted in the absence of any commercial or financial relationships that could be construed as a potential conflict of interest.
Publisher’s note
All claims expressed in this article are solely those of the authors and do not necessarily represent those of their affiliated organizations, or those of the publisher, the editors and the reviewers. Any product that may be evaluated in this article, or claim that may be made by its manufacturer, is not guaranteed or endorsed by the publisher.
Supplementary material
The Supplementary material for this article can be found online at: https://www.frontiersin.org/articles/10.3389/feduc.2024.1367942/full#supplementary-material
Footnotes
1. ^DIF analyses are often used to investigate whether items are affected by DIF for certain groups, e.g., female vs. male students. In our application, we subjected item triples of intended parallel items to the DIF analyses with groups corresponding to the different tests/measurement points. Hence, if item DIF had been observed, it would indicate that the items intended to be parallel were of different difficulties.
References
Akbasli, S., Sahin, M., and Yaykiran, Z. (2016). The effect of reading comprehension on the performance in science and mathematics. J. Educ. Pract. 7, 108–121.
Alonzo, A., and Elby, A. (2019). Beyond empirical adequacy: learning progressions as models and their value for teachers. Cogn. Instr. 37, 1–37. doi: 10.1080/07370008.2018.1539735
Barbieri, C., Young, L., Newton, K., and Booth, J. (2021). Predicting middle school profiles of algebra performance using fraction knowledge. Child Dev. 92, 1984–2005. doi: 10.1111/cdev.13568
Behr, M., Lesh, R., Post, T., and Silver, E. (1983). “Rational number concepts” in Acquisition of Mathematics Concepts and Processes. ed. M. Landau (New York, NY: Academic Press), 91–125.
Black, P., and Wiliam, D. (2004). The formative purpose: assessment must first promote learning. Yearbook Nat. Soc. Stu. Educ. 103, 20–50. doi: 10.1111/j.1744-7984.2004.tb00047.x
Bond, T., and Fox, C. (2013). Applying the Rasch model: Fundamental measurement in the human sciences. London: Psychology Press.
Charalambous, C., and Pitta-Pantazi, D. (2007). Drawing on a theoretical model to study students’ understandings of fractions. Educ. Stud. Math. 64, 293–316. doi: 10.1007/s10649-006-9036-2
Christ, T., Scullin, S., Tolbize, A., and Jiban, C. (2008). Implications of recent research: curriculum-based measurement of math computation. Assess. Eff. Interv. 33, 198–205. doi: 10.1177/1534508407313480
Ciosek, M., and Samborska, M. (2016). A false belief about fractions - what is its source? J. Math. Behav. 42, 20–32. doi: 10.1016/j.jmathb.2016.02.001
Cohen, J. (1988). Statistical power analysis for the behavioral sciences. New York, NY: Lawrence Erlbaum Associates.
Confrey, J., Gianopulos, G., McGowan, W., Shah, M., and Belcher, M. (2017). Scaffolding learner-centered curricular coherence using learning maps and diagnostic assessments designed around mathematics learning trajectories. ZDM 49, 717–734. doi: 10.1007/s11858-017-0869-1
Confrey, J., Toutkoushian, E., and Shah, M. (2020). Working at scale to initiate ongoing validation of learning trajectory-based classroom assessments for middle grade mathematics. J. Math. Behav. 60:100818. doi: 10.1016/j.jmathb.2020.100818
Deno, S. (2003). Developments in curriculum-based measurement. J. Spec. Educ. 37, 184–192. doi: 10.1177/00224669030370030801
Dimitrov, D. (2022). The response vector for mastery method of standard setting. Educ. Psychol. Meas. 82, 719–746. doi: 10.1177/00131644211032388
Draba, R. (1977). The identification and interpretation of item bias. Chicago, IL: University of Chicago.
Espin, C., Chung, S., Foegen, A., and Campbell, H. (2018). “Curriculum-based measurement for secondary-school students” in Handbook of response to intervention and multi-tiered Systems of Support (pp. 291–315). eds. P. Pullen and M. Kennedy (London: Routledge).
Foegen, A., Jiban, C., and Deno, S. (2007). Progress monitoring measures in mathematics: A review of the literature. J. Spec. Educ. 41, 121–139. doi: 10.1177/00224669070410020101
Fuchs, L. (2004). The past, present, and future of curriculum-based measurement research. Sch. Psychol. Rev. 33, 188–192. doi: 10.1080/02796015.2004.12086241
Gabriel, F., Coché, F., Szucs, D., Carette, V., Rey, B., and Content, A. (2013). A componential view of children's difficulties in learning fractions. Front. Psychol. 4:715. doi: 10.3389/fpsyg.2013.00715
George, D., and Mallery, P. (2003). SPSS for windows step by step: A simple guide and reference. 11.0 update. Boston, MA: Allyn & Bacon.
Graf, E., and Arieli-Attali, M. (2015). Designing and developing assessments of complex thinking in mathematics for the middle grades. Theory Pract. 54, 195–202. doi: 10.1080/00405841.2015.1044365
Hair, J., Anderson, R., Tatham, R., and Black, W. (1998). Multivariate data analysis. Hoboken, NJ: Prentice-Hall.
Hansen, N., Jordan, N., Fernandez, E., Siegler, R., Fuchs, L., Gersten, R., et al. (2015). General and math-specific predictors of sixth-graders’ knowledge of fractions. Cogn. Dev. 35, 34–49. doi: 10.1016/j.cogdev.2015.02.001
Harris, L., Adie, L., and Wyatt-Smith, C. (2022). Learning progression-based assessments: a systematic review of student and teacher uses. Rev. Educ. Res. 92, 996–1040. doi: 10.3102/00346543221081552
Jiang, R., Li, X., Fernández, C., and Fu, X. (2017). Students’ performance on missing-value word problems: a cross-national developmental study. Eur. J. Psychol. Educ. 32, 551–570. doi: 10.1007/s10212-016-0322-9
Jiang, Z., Mok, I., and Li, J. (2021). Chinese students' hierarchical understanding of part-whole and measure subconstructs. Int. J. Sci. Math. Educ. 19, 1441–1461. doi: 10.1007/s10763-020-10118-1
Kelava, A., and Moosbrugger, H. (2012). “Deskriptivstatistische Evaluation von Items (Itemanalyse) und Testwertverteilungen” in Testtheorie und Fragebogenkonstruktion (Cham: Springer), 75–102.
Linacre, J. (2002). What do infit and outfit, mean-square and standardized mean? Rasch Measur. Trans. 16:878.
Little, R. (1988). A test of missing completely at random for multivariate data with missing values. J. Am. Stat. Assoc. 83, 1198–1202. doi: 10.1080/01621459.1988.10478722
McMullen, J., and Van Hoof, J. (2020). The role of rational number density knowledge in mathematical development. Learn. Instr. 65:101228. doi: 10.1016/j.learninstruc.2019.101228
Mitzel, H., Lewis, D., Patz, R., and Green, D. (2001). “The bookmark procedure: psychological perspectives” in Setting performance standards: Concepts, methods, and perspectives. ed. G. Cizek (Mahwah, NJ: Lawrence Erlbaum Associates), 249–281.
Mühling, A., Jungjohann, J., and Gebhardt, M. (2019). “Progress monitoring in primary education using Levumi: a case study” in CSEDU 2019: Proceedings of the 11th international conference on computer supported education. eds. H. Lane, S. Zvacek, and J. Uhomoibhi (Rome: SCITEPRESS - Science and Technology Publications), 137–144.
Obersteiner, A., Van Dooren, W., Van Hoof, J., and Verschaffel, L. (2013). The natural number bias and magnitude representation in fraction comparison by expert mathematicians. Learn. Instr. 28, 64–72. doi: 10.1016/j.learninstruc.2013.05.003
Özdemir, B. (2015). A comparison of IRT-based methods for examining differential item functioning in TIMSS 2011 mathematics subtest. Procedia. Soc. Behav. Sci. 174, 2075–2083. doi: 10.1016/j.sbspro.2015.02.004
Padberg, F. (2002). Anschauliche Vorerfahrungen zum Bruchzahlbegriff zu Beginn der Klasse 6. Praxis Mathematik Schule 44, 112–117.
Pantziara, M., and Philippou, G. (2012). Levels of students’ “conception” of fractions. Educ. Stud. Math. 79, 61–83. doi: 10.1007/s10649-011-9338-x
Peck, F., Johnson, R., Briggs, D., and Alzen, J. (2021). Toward learning trajectory-based instruction: a framework of conceptions of learning and assessment. Sch. Sci. Math. 121, 357–368. doi: 10.1111/ssm.12489
Peugh, J., and Enders, C. (2004). Missing data in educational research: a review of reporting practices and suggestions for improvement. Rev. Educ. Res. 74, 525–556. doi: 10.3102/00346543074004525
Rasch, G. (1960). Probabilistic models for some intelligence and attainment tests. Copenhagen: The Danish Institute for Educational Research.
Riley, B. (2011). Considering large group differences in ability in DIF analysis. Rasch Measur. Trans. 25:1326.
Rittle-Johnson, B., Siegler, R., and Alibali, M. (2001). Developing conceptual understanding and procedural skill in mathematics: an iterative process. J. Educ. Psychol. 93, 346–362. doi: 10.1037/0022-0663.93.2.346
Rubin, D. (1996). Multiple imputation after 18+ years. J. Am. Stat. Assoc. 91, 473–489. doi: 10.1080/01621459.1996.10476908
Schadl, C. (2020). Individuelle Lernvoraussetzungen für den Erwerb des Bruchzahlkonzepts: Strukturanalysen und Untersuchung der längsschnittlichen Prädiktivität. Münster: Waxmann.
Schadl, C., and Lindmeier, A. (2023). “Digital monitoring of fraction learning: adapting a test for knowledge of fraction subconstructs” in Proceedings of the 46th conference of the International Group for the Psychology of mathematics education, Vol. 4. eds. M. Ayalon, B. Koichu, R. Leikin, L. Rubel, and M. Tabach (Amsterdam: PME), 155–162.
Schadl, C., and Lindmeier, A. (2025). Preparing for digital learning monitoring in the fraction context: Assessment of students’ prior knowledge according to evidence-based cognitive models. Int. J. Sci. Math. Educ. doi: 10.1007/s10763-024-10531-w
Schadl, C., and Ufer, S. (2023a). Beyond linearity: using IRT-scaled level models to describe the relation between prior proportional reasoning skills and fraction learning outcomes. Child Dev. 94, 1642–1658. doi: 10.1111/cdev.13954
Schadl, C., and Ufer, S. (2023b). Mathematical knowledge and skills as longitudinal predictors of fraction learning among sixth-grade students. J. Educ. Psychol. 115, 985–1003. doi: 10.1037/edu0000808
Siegler, R., Duncan, G., Davis-Kean, P., Duckworth, K., Claessens, A., Engel, M., et al. (2012). Early predictors of high school mathematics achievement. Psychol. Sci. 23, 691–697. doi: 10.1177/0956797612440101
Siegler, R., Thompson, C., and Schneider, M. (2011). An integrated theory of whole number and fractions development. Cogn. Psychol. 62, 273–296. doi: 10.1016/j.cogpsych.2011.03.001
Stelzer, F., Richard's, M., Andrés, M., Vernucci, S., and Introzzi, I. (2019). Cognitive and maths-specific predictors of fraction conceptual knowledge. Educ. Psychol. 41, 172–190. doi: 10.1080/01443410.2019.1693508
Torbeyns, J., Schneider, M., Xin, Z., and Siegler, R. (2015). Bridging the gap: fraction understanding is central to mathematics achievement in students from three different continents. Learn. Instr. 37, 5–13. doi: 10.1016/j.learninstruc.2014.03.002
Tristán, A. (2006). An adjustment for sample size in DIF analysis. Rasch Measur. Trans. 20, 1070–1071.
Vamvakoussi, X., Christou, K., Mertens, L., and Van Dooren, W. (2011). What fills the gap between discrete and dense? Greek and Flemish students’ understanding of density. Learn. Instr. 21, 676–685. doi: 10.1016/j.learninstruc.2011.03.005
Vamvakoussi, X., Van Dooren, W., and Verschaffel, L. (2012). Naturally biased? In search for reaction time evidence for a natural number bias in adults. J. Math. Behav. 31, 344–355. doi: 10.1016/j.jmathb.2012.02.001
Vamvakoussi, X., and Vosniadou, S. (2010). How many decimals are there between two fractions? Aspects of secondary school students’ understanding of rational numbers and their notation. Cogn. Instr. 28, 181–209. doi: 10.1080/07370001003676603
Van Dooren, W., Lehtinen, E., and Verschaffel, L. (2015). Unraveling the gap between natural and rational numbers. Learn. Instr. 37, 1–4. doi: 10.1016/j.learninstruc.2015.01.001
Van Hoof, J., Vandewalle, J., Verschaffel, L., and Van Dooren, W. (2015). In search for the natural number bias in secondary school students’ interpretation of the effect of arithmetical operations. Learn. Instr. 37, 30–38. doi: 10.1016/j.learninstruc.2014.03.004
Vukovic, R., Fuchs, L., Geary, D., Jordan, N., Gersten, R., and Siegler, R. (2014). Sources of individual differences in children’s understanding of fractions. Child Dev. 85, 1461–1476. doi: 10.1111/cdev.12218
Wu, M., Adams, R., and Wilson, M. (1998). ACER ConQuest: Generalized item response modelling software manual. Camberwell, VIC: ACER Press.
Wu, M., Adams, R., Wilson, M., and Haldane, S. (2007). ACER ConQuest Version 2. Generalised Item Response Modelling Software. Camberwell, VIC: ACER Press.
Ye, A., Resnick, I., Hansen, N., Rodrigues, J., Rinne, L., and Jordan, N. (2016). Pathways to fraction learning: numerical abilities mediate the relation between early cognitive competencies and later fraction knowledge. J. Exp. Child Psychol. 152, 242–263. doi: 10.1016/j.jecp.2016.08.001
Keywords: psychometric quality, learning progress, (informal) fraction knowledge, digital assessment, IRT-scaling
Citation: Schadl C and Lindmeier A (2025) Searching for efficient and informative instruments to digitally monitor fraction learning: putting tests for fraction subconstruct knowledge and informal fraction knowledge on the test bench. Front. Educ. 9:1367942. doi: 10.3389/feduc.2024.1367942
Edited by:
Gavin T. L. Brown, The University of Auckland, New ZealandReviewed by:
Eduardo Hernández-Padilla, Autonomous University of the State of Morelos, MexicoHabiddin Habiddin, State University of Malang, Indonesia
Copyright © 2025 Schadl and Lindmeier. This is an open-access article distributed under the terms of the Creative Commons Attribution License (CC BY). The use, distribution or reproduction in other forums is permitted, provided the original author(s) and the copyright owner(s) are credited and that the original publication in this journal is cited, in accordance with accepted academic practice. No use, distribution or reproduction is permitted which does not comply with these terms.
*Correspondence: Constanze Schadl, Y29uc3RhbnplLnNjaGFkbEB1bmktamVuYS5kZQ==
†ORCID: Constanze Schadl, orcid.org/0000-0001-9345-5976
Anke Lindmeier, orcid.org/0000-0002-2819-4375