 Nurullah Eryilmaz
- Department of Education, University of Bath, Bath, United Kingdom
This study examines the substantive impact of educational reforms on school and classroom organization worldwide, noting that many reforms have been more rhetorical than practical in enhancing educational quality. It highlights the crucial role of school principals in driving changes to improve student learning, despite the challenges of implementing reforms that have historically not led to significant increases in student achievement. Focusing on the General Education Quality Improvement Programme (GEQIP) in Ethiopia as a case study, this research aims to assess the extent of reform implementation across schools by identifying variations in the level of implementation. Through a quantitative approach using school principal surveys, the study employs a range of methodological strategies—including principal component analysis (PCA), confirmatory factor analysis (CFA), hierarchical cluster analysis, and K-means cluster analysis—to develop scales and indicators that classify schools into high or low categories of policy implementation. The findings reveal a partial and uneven implementation of GEQIP across Ethiopian schools, with notable disparities in reform adoption levels. This paper concludes by discussing the effectiveness of the methodologies used to categorize schools based on reform implementation and the implications of these findings for the successful execution of educational reforms in Ethiopia and similarly situated contexts. The study underscores the necessity of devising targeted strategies to assist principals and schools in fully achieving the goals of educational reforms.
1 Introduction
The Programme for International Student Assessment (PISA) is one of the most well-known educational assessments, which is designed to measure the performance of school systems worldwide. As a result of the release of the PISA results in 2001, many countries were prompted to advocate school reforms in order to address the failures in the delivery of education. It is important to note, however, that there are many variations in the manner in which governments control education in nations throughout the world, so the capacity of national and subnational politicians to implement educational reforms may vary depending on existing institutional arrangements (Davies et al., 2021). Having seen many countries achieve high enrolment rates, the focus shifted to the quality of education when developing countries failed to provide students with basic cognitive and behavioural skills that are crucial to employment (World Bank, 2010, 2017a,b). However, over the last 20 years, there has been a substantial improvement in access to education in many low- and middle-income countries thanks to educational reforms across countries, yet millions of children continue to attend school without gaining a fundamental understanding of literacy and numeracy (Education for All, 2014; UNESCO, 2022; World Bank, 2022). Globally, numerous policies and programmes have been implemented to address these issues, with particular emphasis on improving education quality. In other words, many reforms, policies and programmes have been put into place all over the world to enhance the quality of provision educational related resources with an emphasis on raising the standard of education offered, with no exception in Ethiopia (Hoddinott et al., 2023).
There is no doubt that an educational reform process is a complex process that requires a diverse group of partners and a governance structure that is based on trust. It requires a thorough and careful approach that considers a variety of elements, including cultural, social, economic, and political aspects (Niemi, 2021). In order for the reform process to be effective, it must consider the interests and needs of a wide array of stakeholders, including educators, students, parents, family members, members of the community, policymakers, and other decisionmakers. Furthermore, the process requires a comprehensive understanding of the current educational landscape, including its strengths and weaknesses, as well as an awareness of emerging trends and challenges (Sardoč et al., 2021). As a result, educational reform is a complex and challenging process that must be carefully planned, implemented, and evaluated to ensure its success.
In the case of educational reform, implementing its various components can be challenging, particularly when there is a structural challenge involved. The implementation of some aspects of the reform may be easy in some schools, but others may encounter significant challenges due to factors such as lack of resources, staff shortages, and outdated facilities. It is therefore possible that the components of the reform may end up being implemented differently across schools due to their unique circumstances and constraints. For instance, schools in rural areas may face challenges due to inadequate access to technology, while schools in urban areas may face challenges due to overcrowding or high teacher turnover. In order to address these structural challenges, individualized solutions must be developed that address the specific needs of each school while remaining true to the reform’s overarching goals. It may be necessary to provide additional support, resources, or training to schools that are having difficulty, and to leverage existing strengths and resources to promote success in schools with a better capacity for implementing the reforms.
The challenge is therefore that we are unable to capture such complex set of strategies in a single indicator. Here is where we need to rely on quantitative methods that enable us to reduce dimensionality and obtain an indicator for an effective reform implementation. This paper explores methodological issues relating to research on the level of GEQIP implementation by testing different methods to create and develop indicators at the school level. It focuses on the main issues and difficulties that researchers can encounter and offers helpful insights for generating indicators based on information about Ethiopian school quality after implementing GEQIP reform.
The purpose of this paper is to examine Ethiopia’s GEQIP education reform and practice in light of the quality and distribution of educational opportunities. Because according to Andrews et al. (2017) often, the fidelity of implementation is more important than policy or program design in explaining learning outcomes; for this reason, key aspects of the implementation must be explicitly captured to explain how much such reforms have performed in the schools. More specifically, this study aims to investigate different approaches for developing indicators and scales related to the Ethiopian GEQIP reform. The research employs three methods for constructing these indicators/scales, namely principal component analysis (PCA), confirmatory factor analysis (CFA), and hierarchical and K-means clustering analysis. Through these techniques, the study seeks to offer researchers empirical insights into the strengths and weaknesses of each method. Ultimately, this study aims to contribute to the development of reliable and valid measurement tools for assessing the effective GEQIP reform in Ethiopia.
2 Context of Ethiopia and GEQIP reform
Ethiopia has seen a tremendous rise in funding for the education sector despite being a developing nation (UNICEF, 2017; World Bank, 2018; Tiruneh et al., 2022). A thorough set of adjustments coordinated by the government and funded by donors, known as the General Education Quality Improvement Program, have been made in addition to this (GEQIP, 2008–2020) [GEQIP-I (2008–2012); GEQIP-II (2012–2018); and GEQIP-for Equity (GEQIP: 2018–2022)] (World Bank, 2008, 2013, 2017a,b).
In contrast to prior GEQIP phases, which placed more of an emphasis on curriculum reform, textbook supplies, teacher development, and effective school awards, the most recent phase of the reforms focused attention on equity issues. This places a focus on the underdeveloped areas as well as the challenges that girls, children with disabilities, and children from pastoralist communities. The education sector’s expansion has coincided with these increases in financing and changes (see Table 1 for more information). Table 1 above outlines the key components of the GEQIP-E reform.
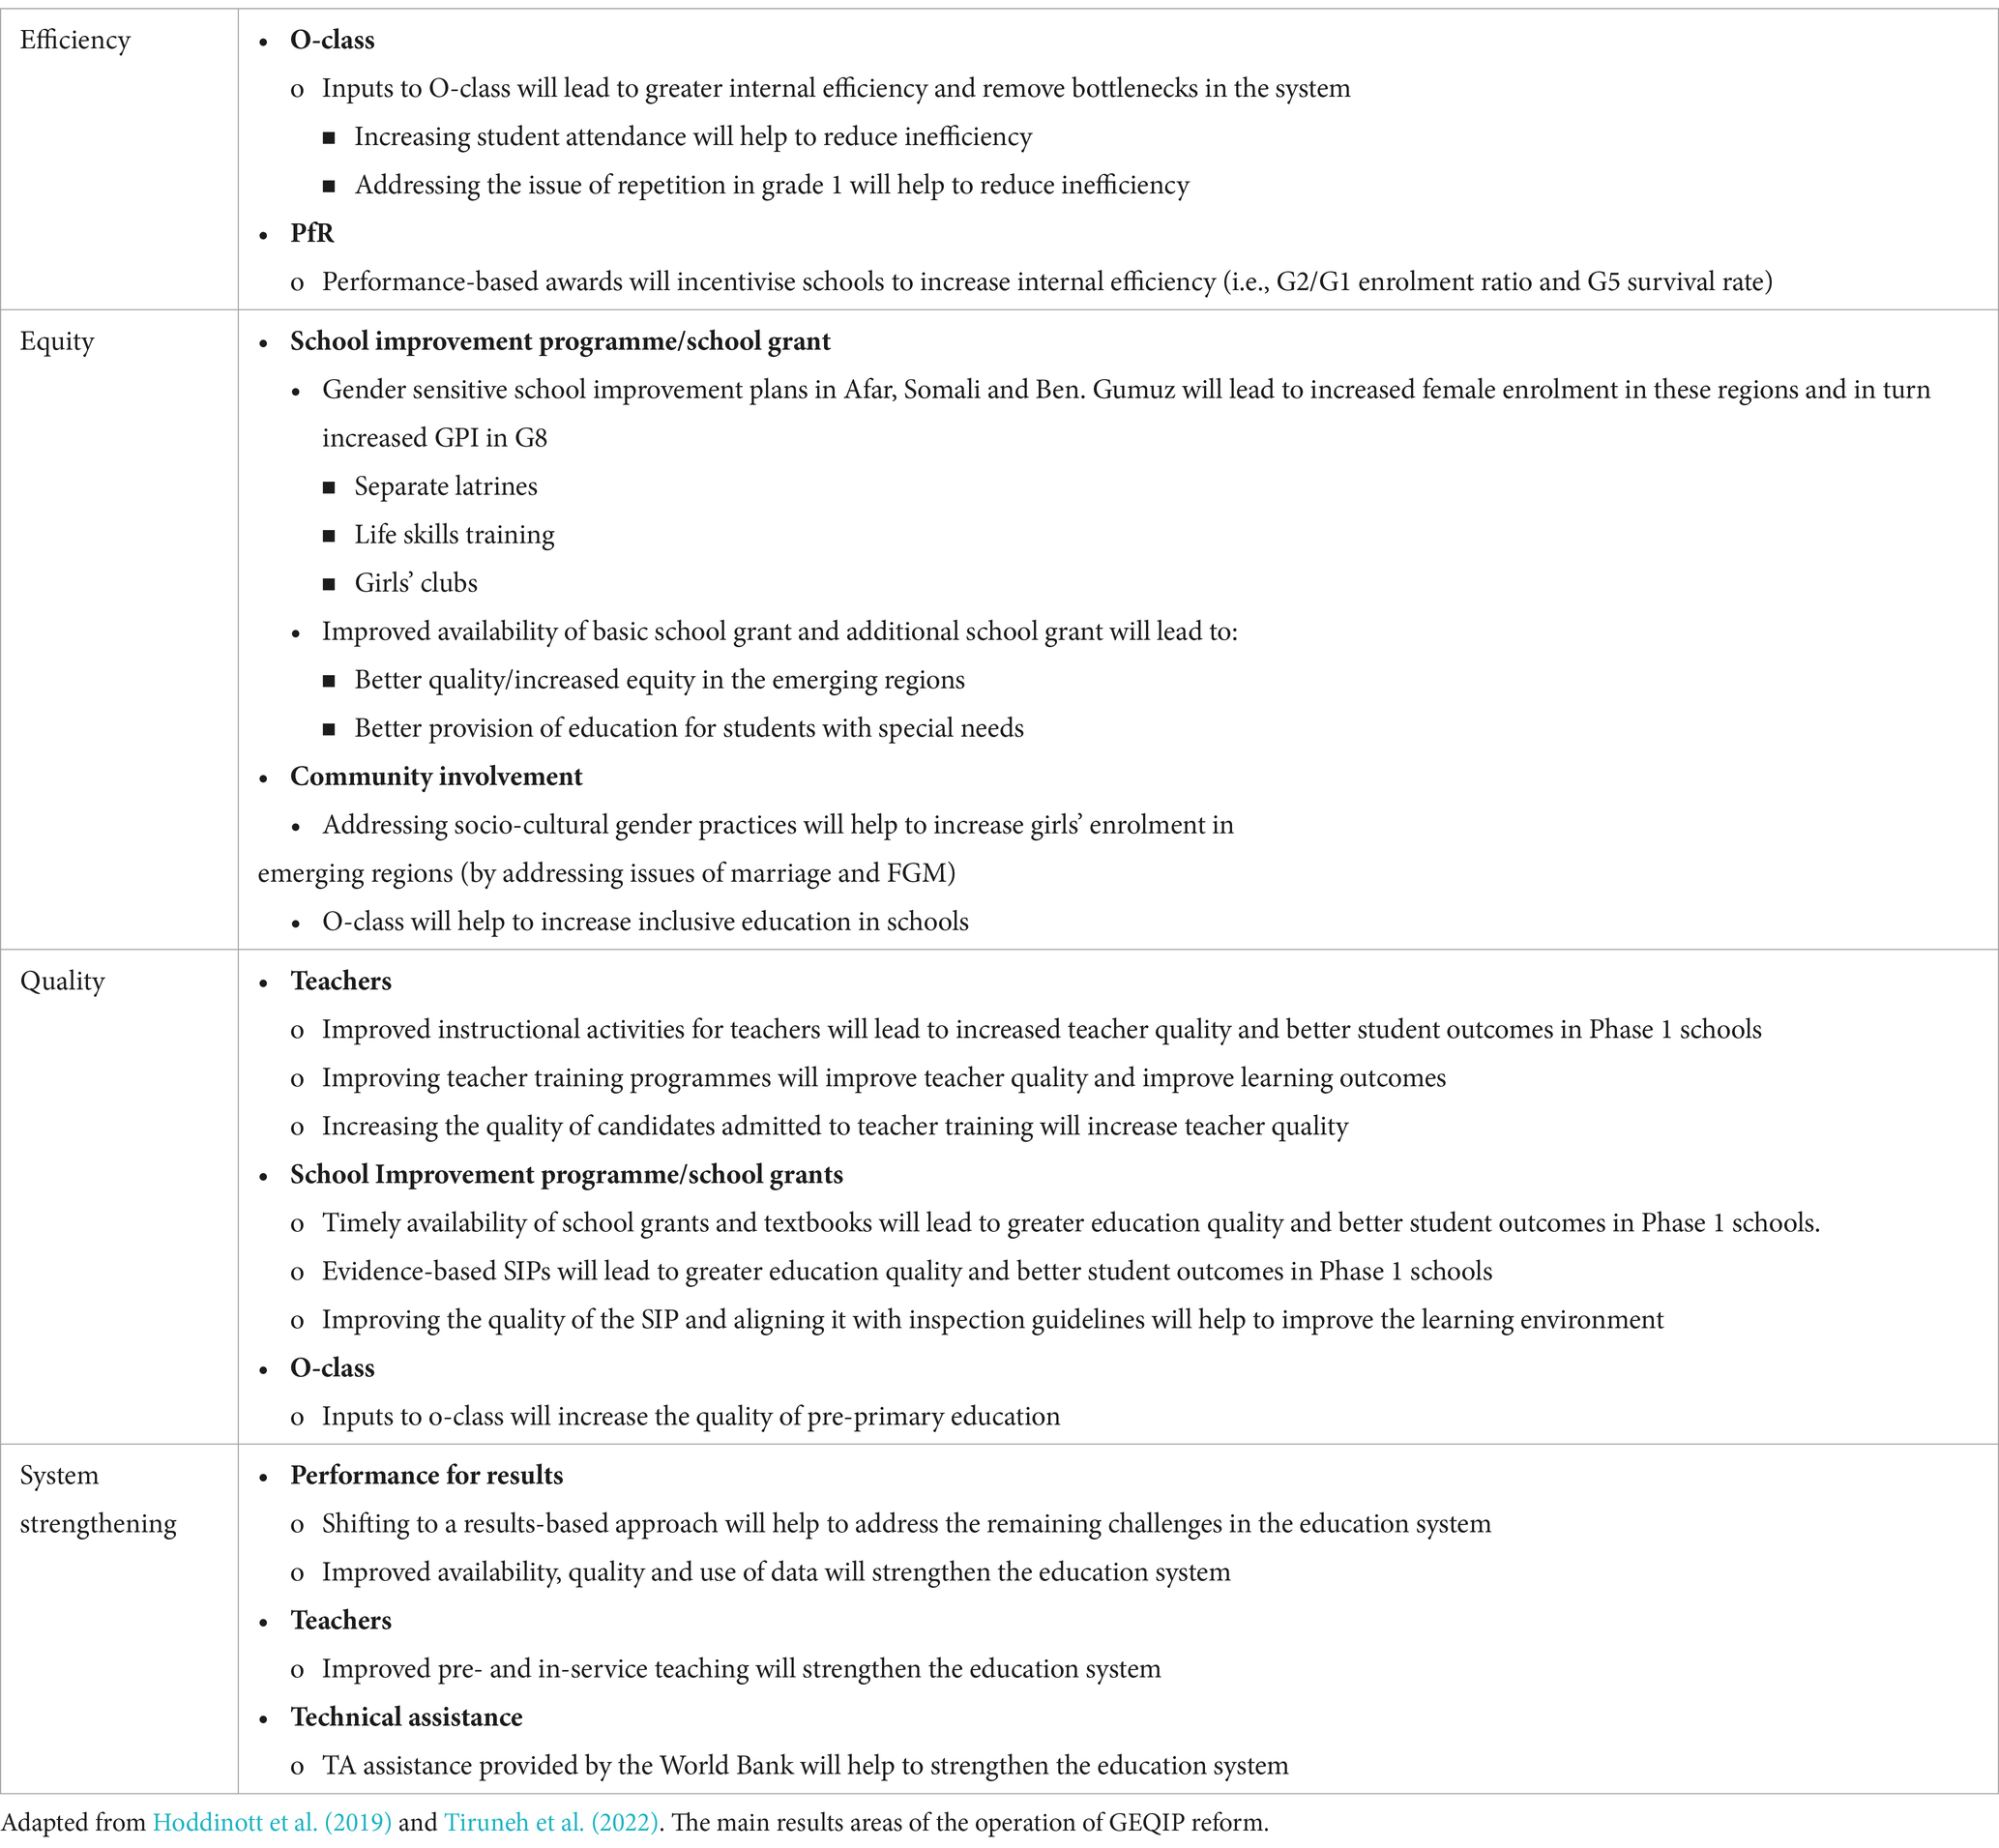
Table 1. Examples of assumptions of GEQIP-E.
Ethiopia’s primary education system now serves more than 20 million pupils, up from three million in the early 1990s Ministry of Education, 2019. However, despite strong levels of governmental support and donor funding, many children leave primary school lacking even the most fundamental literacy and numeracy skills, and it is uncertain if the GEQIP changes have yet had the desired impact on system efficiency and educational quality.
2.1 Improving internal efficiency
In order to increase the internal efficiency of the educational system, this results area will concentrate on tackling the persistent problem of over-enrolment in grade 1 and encouraging children’s advancement through the early grades. A determined effort will be made (i) to make grade I students more prepared for school so they can advance to the next grades, and (ii) ensure regular attendance for all students once they are enrolled to improve student development in the early grades (World Bank, 2017a,b).
2.2 Improving equitable access
This results area focuses on promoting equitable access to general education in Ethiopia with the objectives of: (i) increasing gender parity at the grade 8 level emerging regions of Ethiopia: Afar, Ethiopia Somali, and Benishangul-Gumuz (KPI 3); (ii) increasing the gross enrollment ratio of grades 1–8 in those regions (KPI 4) to support pastoral students and students in emerging regions; and (iii) increasing the participation of children with special need (IRI 4.3). The Program will assist government activities that are directed at these three underprivileged groups and that are supported by solid efficacy data. It is also intended to help ongoing initiatives supported by the World Bank and other development partners (DPs) to reduce educational inequalities (World Bank, 2017a,b).
2.3 Improving quality
The goal of this results area, which focuses on general education quality, is to raise student learning outcomes in early grade reading (KPI 5), English, and mathematics (KPI 6). Because reading competency in the early grades and proficiency in English and mathematics at the conclusion of the primary cycle serve as important building blocks for subsequent learning across all subject areas, these indicators have been chosen. The proposed program will support efforts to enhance O-class (pre-primary) education quality (supported under RA1), enhance the capacity of primary school teachers to facilitate learning (effective teaching practises and increased instructional time in the classroom), and enhance the learning environment in schools (World Bank, 2017a,b).
2.4 System strengthening for planning, policy formulation and reform
A competent education system that provides high-quality inputs to its schools makes decisions based on evidence and innovates regularly to improve its performance would be necessary for sustained increases in the learning outcomes of Ethiopian children. To help students reach greater levels of learning, the program concentrates on enhancing the fundamental components of the overall educational system, including enhanced data gathering and analysis and teacher preparation. In order to attain the overall development goals of increased internal efficiency, equitable access, and quality of education in general education, this cross-cutting area will complement the other results areas (World Bank, 2017a,b).
This study is guided by the following research question:
1. What are the most effective techniques for determining schools with high and low levels of policy implementation regarding educational reform in Ethiopia?
In the following section, we first provide some information about our theoretical framework which is guided by Patrinos’s et al. (2013) framework for the reform of education systems and planning for quality as in their report, they suggested that an international quality benchmarking system should be developed in the future, based on a broader body of evidence and a greater emphasis should be placed on obtaining empirical evidence based on impact evaluations and what the school quality means in general and what it means in this research area. Secondly, we provide information about principal component analysis (PCA), confirmatory factor analysis (CFA), hierarchical and K-means cluster analysis. We then discuss our data, our samples, variables, and analytical strategy and present our findings. Lastly, we discuss the implications, limitations, and future directions of the research.
3 Literature review
3.1 Conceptual framework
In terms of the theoretical foundation for the Reform of education systems and Planning for Quality, we follow the Framework of Patrinos et al. (2013) who designed a framework for educational reform that focuses on planning for quality. According to the this framework, there are six factors that are considered important for reforming education systems in the framework:
1. Assessment: The development of comprehensive and effective assessment systems that support student learning and provide information to support educational decisions is an essential part of this factor. The assessment process includes both formative assessment, which is used to help teachers understand student learning and adjust their teaching, as well as summative assessment, which is used to evaluate the progress of students at the end of the course or unit. In order for an assessment system to be effective, it must be aligned with learning objectives, valid and reliable, and provide students and teachers with timely and useful feedback.
2. Autonomy: The purpose of this factor is to promote greater autonomy and flexibility in the education system, particularly at the school level, to ensure that innovation is supported and that educational outcomes are improved. In this regard, decentralizing decision-making, providing greater discretion in budgeting and resource allocation, and allowing for more flexibility in the approach to teaching and learning can all contribute to the enhancement of the educational process. Schools with greater autonomy are able to respond more effectively to the specific needs of their students and communities and may be able to implement more innovative and effective educational methods.
3. Accountability: An important aspect of this factor involves establishing clear accountability mechanisms to ensure that all stakeholders are accountable for the quality of education and that failure to meet expectations has consequences. As a part of this process, it is necessary to establish clear standards and expectations for student achievement, to monitor and report on progress toward those standards, and to hold individuals and institutions accountable for meeting those standards. There are several characteristics of effective accountability systems, including transparency, fairness, and a focus on continuous improvement rather than punishment.
4. Attention to teachers: As part of this factor, teachers must have opportunities for professional development, work conditions that are conducive to teaching, and a greater level of recognition and status of their profession. As part of this process, it is necessary to provide ongoing training and support for teachers, create opportunities for collaboration and peer learning, as well as offer competitive salaries and benefits to attract and retain high-quality teachers. It is imperative to provide attention to teachers in order to establish a culture of continuous improvement and to ensure that teaching and learning are of high quality.
5. Attention to early childhood development: A crucial component of this factor is the focus on the education and development of the child in the early years, with an emphasis on improving the availability of quality early childhood education. Education during the early years of life has been shown to have a significant impact on academic and social outcomes later in life and can serve as a tool for reducing educational inequalities. It may be necessary to increase access to preschool programs, provide targeted support to at-risk children, and improve the quality of early childhood education in order to enhance early childhood development.
6. Attention to culture: An important part of this factor is recognizing and valuing the cultural diversity of students and fostering cultural sensitivity and understanding within the educational system. As part of this process, it is important to recognize and accommodate students’ unique cultural backgrounds and experiences, as well as providing a welcoming and inclusive environment. Culture can play an important role in promoting social cohesion as well as reducing prejudice and discrimination as well as encouraging students to develop global competencies.
In the literature, this framework has been cited 28 times in different studies so far. Among them, only three of them implemented this framework in their studies as a framework. In Thailand context, again Patrinos et al. (2015) implemented the autonomy, accountability and student assessment part of this framework. In this study, by analyzing data from 226 schools in Thailand who took part in the 2009 PISA survey, the author examines the implementation of school autonomy and accountability policies. This study estimates a linear regression as a means of understanding how autonomy and accountability are related to student achievement, using PISA reading achievement as the dependent variable and indicators of autonomy and accountability (and control variables) as independent variables. It has been found that students at schools operating with a degree of operational autonomy greater than that ascribed by regulation tend to have PISA reading scores that are 6.0–8.6 points higher than those at schools that operate with a low degree of autonomy. In Tanzania context, Ochieng and Yeonsung (2021) implemented this framework in their study qualitatively. On the basis of this framework, this paper examines the level of education quality and attainment in Tanzania and discusses how Korea, which has partnered with Tanzania, might be able to assist in mitigating the challenges in the sector, which has been identified as a priority sector for development partnerships between the two countries. This study is a qualitative analysis based on secondary data. It is concluded from the study that Tanzania has made significant progress in accordance with the vision of education for all, as evidenced by the high enrolment rates, which are above the average in sub-Saharan Africa. In Iraq context, Sadik (2018) implemented this framework in his study. This background provided the basis for studying in depth the frameworks that have evolved and been implemented across countries. To illustrate the importance of education planning in improving the quality of education in the Kurdistan region, a study conducted a field study in the Kurdistan region based on these learnings. Throughout the study, it was highlighted that governance and educational planning are prerequisites not only at the national level, but also at the institutional level.
Patrinos et al. (2013) highlighted that it is essential to develop a system of international quality benchmarks based on a larger body of evidence. Developing indicators and constructing a database are essential components of this process. For the development of educational benchmarks at the national level, such a framework could serve as a useful reference, and it is necessary to conduct more comprehensive empirical studies on the evaluation of related policy interventions in order to complement the implementation of the 6As or a more systematic quality framework. International organizations and countries must work together in concert to achieve these goals. Therefore, in this study, we aim to bring this framework to the Ethiopian context at the school level.
Moreover, there is a close relationship between the quality of an educational system and the quality of an individual school, but the two are not the same. In a given country or region, the education system is defined as the overall structure and organization of education, including policies, laws, regulations, funding, and governance. There is no doubt that the quality of the education system can have a significant impact on the quality of schools within that system, but it is not the only factor that determines the quality of a school.
A school’s quality is determined by the extent to which it provides a high-quality educational experience for its students. School quality can be determined by a variety of factors, including the qualifications and experience of teachers, the resources at the school (such as technology, textbooks, and facilities), the curriculum and instructional methods employed by the school, as well as the level of community and parental involvement.
It is true that the quality of the education system can have an impact on the quality of individual schools, but there are many other factors that can also greatly affect the quality of a school. The quality of education may vary significantly within a high-quality education system depending on factors such as funding levels, teacher turnover, or student demographics.
As a result, while there is a connection between the quality of the education system and the quality of individual schools, it is important to recognize that school quality is also impacted by a variety of other factors specific to each school.
3.2 What is school quality?
Effective schools are promoted in large part by the quality of the schools (Scheerens and Bosker, 1997). Despite diverse terms being used in the literature, numerous models have determined that the following four elements are crucial for high-quality schools (Stringfield, 1994; Scheerens and Bosker, 1997; Ditton, 2000). First component of school quality is school culture. School culture consists of collective goals and a shared vision for the school (Ditton, 2000). The second component of school quality is school management. The concepts organisational and pedagogical leadership, shared accountability, and controlled duties are all used to describe school management (Stringfield, 1994). The third component of school quality is cooperation and coordination. It refers to collaboration and coordination within a school, between principals and teachers, teachers and students, and external partners, such as parents, administrators, and consultants. The last component of school quality is human resources. The resource component encompasses policies about opportunities for school/human resource development, such as training programmes, as well as the recruitment and socialisation of new teachers (Ditton, 2000). Administrative staff who possess the necessary skills are essential for successfully managing the school’s infrastructure and facilities. A decent and engaging library might be one example of the supportive facilities that should be in place to ensure the success of administration of the school’s facilities and infrastructure. Teachers should also receive training in these areas. In this study, the conceptualisation of school quality is based on facilities and infrastructure of education management (see a variable section for more information).
In the next section, we provide a brief information about the techniques used in this study to classify schools as high/low policy implemented schools and the advantages and disadvantages of each technique.
3.2.1 Principal component analysis
Many scientific disciplines use principal component analysis (PCA), which is the most popular multivariate statistical technique. As well as being the oldest multivariate technique, it is probably the most widely used (Abdi and Williams, 2010). Jolliffe and Cadima (2016), p. 1 defined the principal component analysis (PCA) as “a technique for reducing the dimensionality of such datasets, increasing interpretability but at the same time minimizing information loss.” Using complex mathematical principles, principal component analysis (PCA) reduces a large number of variables that may be connected into a smaller set of variables known as main components (Jolliffe, 2005). The key data will be extracted from the table, represented as a collection of new orthogonal variables called principal components, and displayed as points on maps to show the pattern of similarity between the observations and the variables (Richardson, 2009).
When PCA is used, it provides valuable insight into which variables are presumably reliant on one another, not just in the linear sense but also in terms of their overall influences. Additionally, PCA shows which variables are most likely to make a meaningful difference. When the data set is devoid of variables with linear dependence, PCA may produce models that are less well-suited (Nguyen, 2020).
In order to choose the number of components, the screen or elbow test is the first method. Plotting all eigenvalues in descending order of size is the goal. The “elbow” is designated as a point in the resulting scree-plot. The slope between the eigenvalues should be sharp prior to the elbow, and flat following the elbow. We only consider the major components with eigenvalues upstream of the elbow. This method is not objective since different people do not always designate the same place as the elbow.
Choosing the components with eigenvalues higher than the average eigenvalue is the second option. When doing correlation PCA, only the components with an eigenvalue larger than 1 will survive because the trace of a matrix is equal to the sum of its eigenvalues (Jolliffe, 2022).
3.2.2 Confirmatory factor analysis
Recently, confirmatory factor analysis (CFA) has generally been employed to investigate the latent structure of a test instrument during the scale development process. The pattern of item-factor correlations as well as the number of the instrument’s underlying dimensions (factors), are verified using CFA (factor loadings) (Harrington, 2009). Confirmatory factor analysis (CFA) is a subset of structural equation modelling that focuses exclusively on measurement models. It examines the connections between observed measurements or indicators (such as test items, test results, and behavioural observation ratings) and latent variables or factors (Brown and Moore, 2012). Establishing the number and kind of factors that explain the variation and covariation among a group of indicators is the aim of latent variable measurement models (i.e., factor analysis) (Brown, 2015). An unobservable factor designated a factor influences many observed measurements and explains correlations between these observed measures (Hoyle, 2000). In other words, if the latent construct were partially excluded, there would be no intercorrelation between the observed measures because they are all influenced by the same underlying construct and so share a common cause (Hoyle, 2000). Because there are fewer factors than measured variables, a measurement model like CFA offers a more condensed knowledge of the covariation among a collection of indicators (Brown, 2015).
In order to assess the model based on confirmatory factor analysis (CFA), the comparative fit index (CFI), the Tucker–Lewis index (TLI), and the root-mean-squared error of approximation (RMSEA) and standardised root mean-squared residual (SRMR) statistics are used to examine the goodness of fit and residual fit, respectively, of the model. It is critical to emphasise that the better the model fit, the closer the CFI, and TLI values are to 1, and the lower RMSEA and SRMR values are to 0. Hu and Bentler (1999) and Rutkowski and Svetina (2014) proposed that CFI >0.90, TLI >0.90, RMSEA <0.10, and SRMR <0.08 were indicators of an acceptable model fit.
3.2.3 Cluster analysis
One form of data reduction method is cluster analysis. Data is essentially reduced using data reduction analyses, which also include factor analysis and discriminant analysis. They do not examine how independent and dependent variables affect group differences. Examples include factor analysis, which lowers the number of variables or factors in a model, and discriminant analysis, which divides new instances into categories that have already been recognised based on particular standards. The purpose of cluster analysis, which stands out among these methods since it identifies groups without knowing their makeup or the number of potential groups, is to minimise the number of instances or observations by grouping them into homogenous clusters. The algorithm for merging groups can be used in a variety of ways when using cluster analysis, and each option produces a unique grouping structure. As a result, cluster analysis can be a useful statistical method for discovering hidden structures in diverse dataset types (Yim and Ramdeen, 2015).
3.2.4 Hierarchical cluster analysis
Researchers might not completely comprehend the benefits of cluster analysis and how to apply the clustering technique to their data due to the dearth of psychological research that uses the general cluster analysis technique. Cluster analysis can be done using either a hierarchical or non-hierarchical structure. By merging examples one at a time in a series of sequential phases, hierarchical clustering groups cases together into homogeneous clusters (Blei and Lafferty, 2009). In other words, hierarchical cluster analysis provides the researchers with a good estimate of how many clusters their data has. It is possible that all of those are exactly the same for everybody but more likely that there are groups of people who tend to respond differently on these dimensions, and we might be able to group those types of people.
In hierarchical cluster analysis, a sequence of partitions for a given object set is constructed hierarchically (Köhn and Hubert, 2014). In most cases, the methods produce a hierarchy of objects based on some form of proximity measure (Bridges, 1966).
In this study, we used the Wards’ method approach since it helps create equal size clusters, which means it attempts to create clusters that are more evenly sized.
3.2.5 K-means cluster analysis
K-means is one of the most popular clustering methods (Lloyd, 1957; MacQueen, 1967). The fundamental concept is to update the clustering centres by finding the mean of the member points, move each point to its new nearest centre, and repeat this process until convergence criteria (such as a predetermined number of iterations, a difference in the value of the distortion function) are satisfied (Jin and Han, 2011). With K-means cluster analysis, we may execute the clustering by assigning individuals to specific groups based on an algorithm and more specifically, we can specify the clusters on the dimensions we are really doing the grouping on.
K-means finds the mutually exclusive cluster of spherical form based on distance by allocating records to each cluster using a pre-specified number of clusters. K-means clustering requires prior knowledge of K, or the number of clusters into which you wish to partition your data (Santini, 2016).
3.2.6 Synthesising the techniques
It is important to determine the type of method you will use in accordance with your data, research question, and the type of indicator you will be creating. You should carefully consider which method is most appropriate for your specific situation since each method has its own advantages and disadvantages.
When you want to combine multiple variables into one indicator or index, principal component analysis (PCA) can be a useful technique. This method can be used to identify the underlying structure of data and to generate a weighted composite score that captures the most important aspects of that data. The principal component analysis (PCA) is a data-driven method that can be applied to any type of data, and the results of the analysis are relatively easy to interpret.
It is recommended that you utilize a confirmatory factor analysis (CFA) when you have a prespecified theoretical model that you would like to examine. Using this method, you can confirm the number of latent factors in your data, the factor loadings for the observed variables on each factor, and the correlations between the factors. A CFA provides a better fit to the data and can help you test your hypotheses, but it is more rigorous than PCA and requires a larger sample size.
The hierarchical cluster analysis (HCA) and the K-means cluster analysis are both effective methods for grouping your cases or variables on the basis of their similarities or differences. While HCA produces a dendrogram that illustrates the hierarchical relationships between clusters, K-means assigns cases to non-overlapping clusters according to their distance from each other. While HCA is an exploratory method, it can help you identify the optimal number of clusters as well as the variables that contribute to each cluster. K-means is a more deterministic method, which requires you to set the number of clusters in advance. Both methods require that you select a distance metric and a linkage method, which can have an effect on the results.
In the end, the method we choose will depend on our research question, the nature of our data, and the type of indicator we wish to develop. The CFA may be the best choice for you if you have a predetermined theoretical model in mind. You may find PCA to be more appropriate if you wish to create a composite score that incorporates multiple variables. Using HCA or K-means may be useful if you want to group your cases according to their similarity or dissimilarity.
4 Present study
The goal of this study is to develop indicators that can be used to identify schools in Ethiopia that have either implemented low or high levels of the GEQIP reform. Four techniques will be compared to achieve this objective, namely principal component analysis (PCA), confirmatory factor analysis (CFA), hierarchical cluster analysis, and K-means cluster analysis. By creating scales using these techniques, we can establish a better understanding of the extent to which the GEQIP reform has been implemented in schools and help policymakers make informed decisions about future education policies.
5 Data and methods
5.1 Data and sample
The 2018–19 RISE Ethiopia school surveys’ target participants were grade 1 and grade 4 students from 168 schools, as well as their parents or primary caregivers, school administrators, and grade 4 mathematics and reading teachers dispersed across Addis Ababa, Amhara, Benishangul Gumuz (Be-Gu), Oromia, SNNP, Somali, and Tigray regions. The surveys were carried out in two phases: Phase 1 at the beginning of the school year in November and Phase 2 near the end of June. Phase 1 of the study includes both household and school surveys, a survey and an evaluation of their understanding of the maths subject. In Phase 2, students took a second set of math and reading comprehension learning evaluations (for more information, see Hoddinott et al., 2019).
5.2 Variables
Surveys of the schools’ principals and teachers were given out in the academic years of 2018–19. The purpose of the principal questionnaires in both rounds was to collect data on the education and experience levels of the school administrators as well as on indicators of school quality, such as students’ access to learning resources (such as the school library, computers, radios, and textbooks) and the availability of opportunities for teachers to engage in continuous professional development (CPD). The indicator variables for GEQIP are by no means an exhaustive list, but for the purpose of this study, we will focus on a few selected variables based on the availability of data from our school surveys. The variables that we include in this study are provided below:
5.3 Analytical strategy
In this study, we first provide information about descriptive statistics for each variable. Based on the descriptive statistics, we choose the variables for further analysis. Second, we conducted the Principal Component Analysis to reduce the dimension and create the score. Third, we implemented the confirmatory factor analysis (CFA) to fit a measurement model and create a scale. Fourth, we conducted hierarchical cluster analysis to reduce the dimensions and create an indicator. Lastly, we applied K-means cluster analysis to reduce the dimensions and create an indicator.
All analyses were conducted in IBM SPSS (IBM Corp., 2015) and in the R statistical software (R Core Team, 2019), using lavaan (Rosseel, 2012) package.
6 Results
6.1 Descriptive statistics
We first provided descriptive information statistics for each variable (Valid, Missing, Maximum, Minimum, Mean and Standard Deviation) (see Appendix Table S1). In this study, we used the variables as dummy variables. However, some variables are not dummy variables in the dataset. Therefore, we created those variables as dummy variables. Here, we will now explain how we executed this process for those variables. For example, the variable SSPRAMTSG has normally four response categories. These categories are 0 = No funds received from this source, 1 = No, received less than expected 2 = No, received more than expected 3 = Yes, received full amount expected. We created a dummy variable for this variable as response categories 0, 1 and 2 = 0 and response categories 3 = 1.
For the variable SSPRTSPOPD, if they do not engage in the activity, we consider it as 0, the rest (less than 1 day per week, 1–2 days per week, 3–4 days per week, 5 days per week) is 1.
For the variable SSPRINDPINSPCT, if the response categories are grade level 3 and level 4, we consider them as 1, the other categories (grade level 1 and level 2) are 0. For the variable SSPRRATOTXTBKG4, if each student has their own textbook, we consider it as 1, the rest (two students share one textbook, three students share one textbook, four or more student share…) are 0. For the variable SSPRWPRFMAS, if it is less than 50%, we consider it as 0. If it is more than %50, we consider as 1.
6.2 Estimations of alternative approaches
6.2.1 Principal component analysis
Principal component analysis (PCA) is a dimensionality reduction technique used to transform high-dimensional data into a smaller set of uncorrelated variables, called principal components while retaining as much of the original variance as possible.
PCA is based on several assumptions, which include:
1. Linearity: PCA assumes that the relationship between variables is linear. This means that the variables are assumed to be related to each other through a straight line or a linear equation.
2. Normality: PCA assumes that the variables are normally distributed. This means that the data should have a bell-shaped distribution, with most of the data falling around the mean.
3. Homoscedasticity: PCA assumes that the variance of each variable is equal across all levels of the other variables. This means that the variability of the data should be the same at all levels of the other variables.
4. Independence: PCA assumes that the variables are independent of each other. This means that there should be no correlation between the variables.
5. Large sample size: PCA assumes that the sample size is large enough to ensure that the estimates of the principal components are reliable.
These assumptions are important to ensure that the results of PCA are valid and reliable. If any of these assumptions are violated, the results of PCA may be biased or inaccurate. Therefore, it is important to check these assumptions before conducting PCA on a dataset. Therefore, we also first tested the assumptions of PCA with our data. However, unfortunately, we could not to manage to create an indicator to cluster the schools based on this method.
However, we continued to use this method as if assumptions were met to provide insights to readers who would be interested in this. All information is provided here.
In order to reduce dimension, we used PCA (principal component analysis), when we added the following two items (aware of the new “performance for results” financing modality and received and specific information or training related GEQIP), we could not converge PCA. Therefore, those two items were removed the following analysis. For principal component analysis (PCA), these findings show that the eigenvalues of the first seven main components are greater than 1. These seven elements account for 67.45% of the data’s volatility. The scree plot demonstrates that after the seventh principal component, the eigenvalues begin to form a straight line. We should use the first five main components if the data’s variation is sufficiently explained by 67.45% (Figure 1 and Table 2). To determine the clusters based on the GEQIP policy reform variables, we benefitted from the first component as it has the highest eigenvalues among the others. In other words, we created the scale based on this technique using GEQIP educational policy variables using first component (see Figures 2, 3 and Table 3).
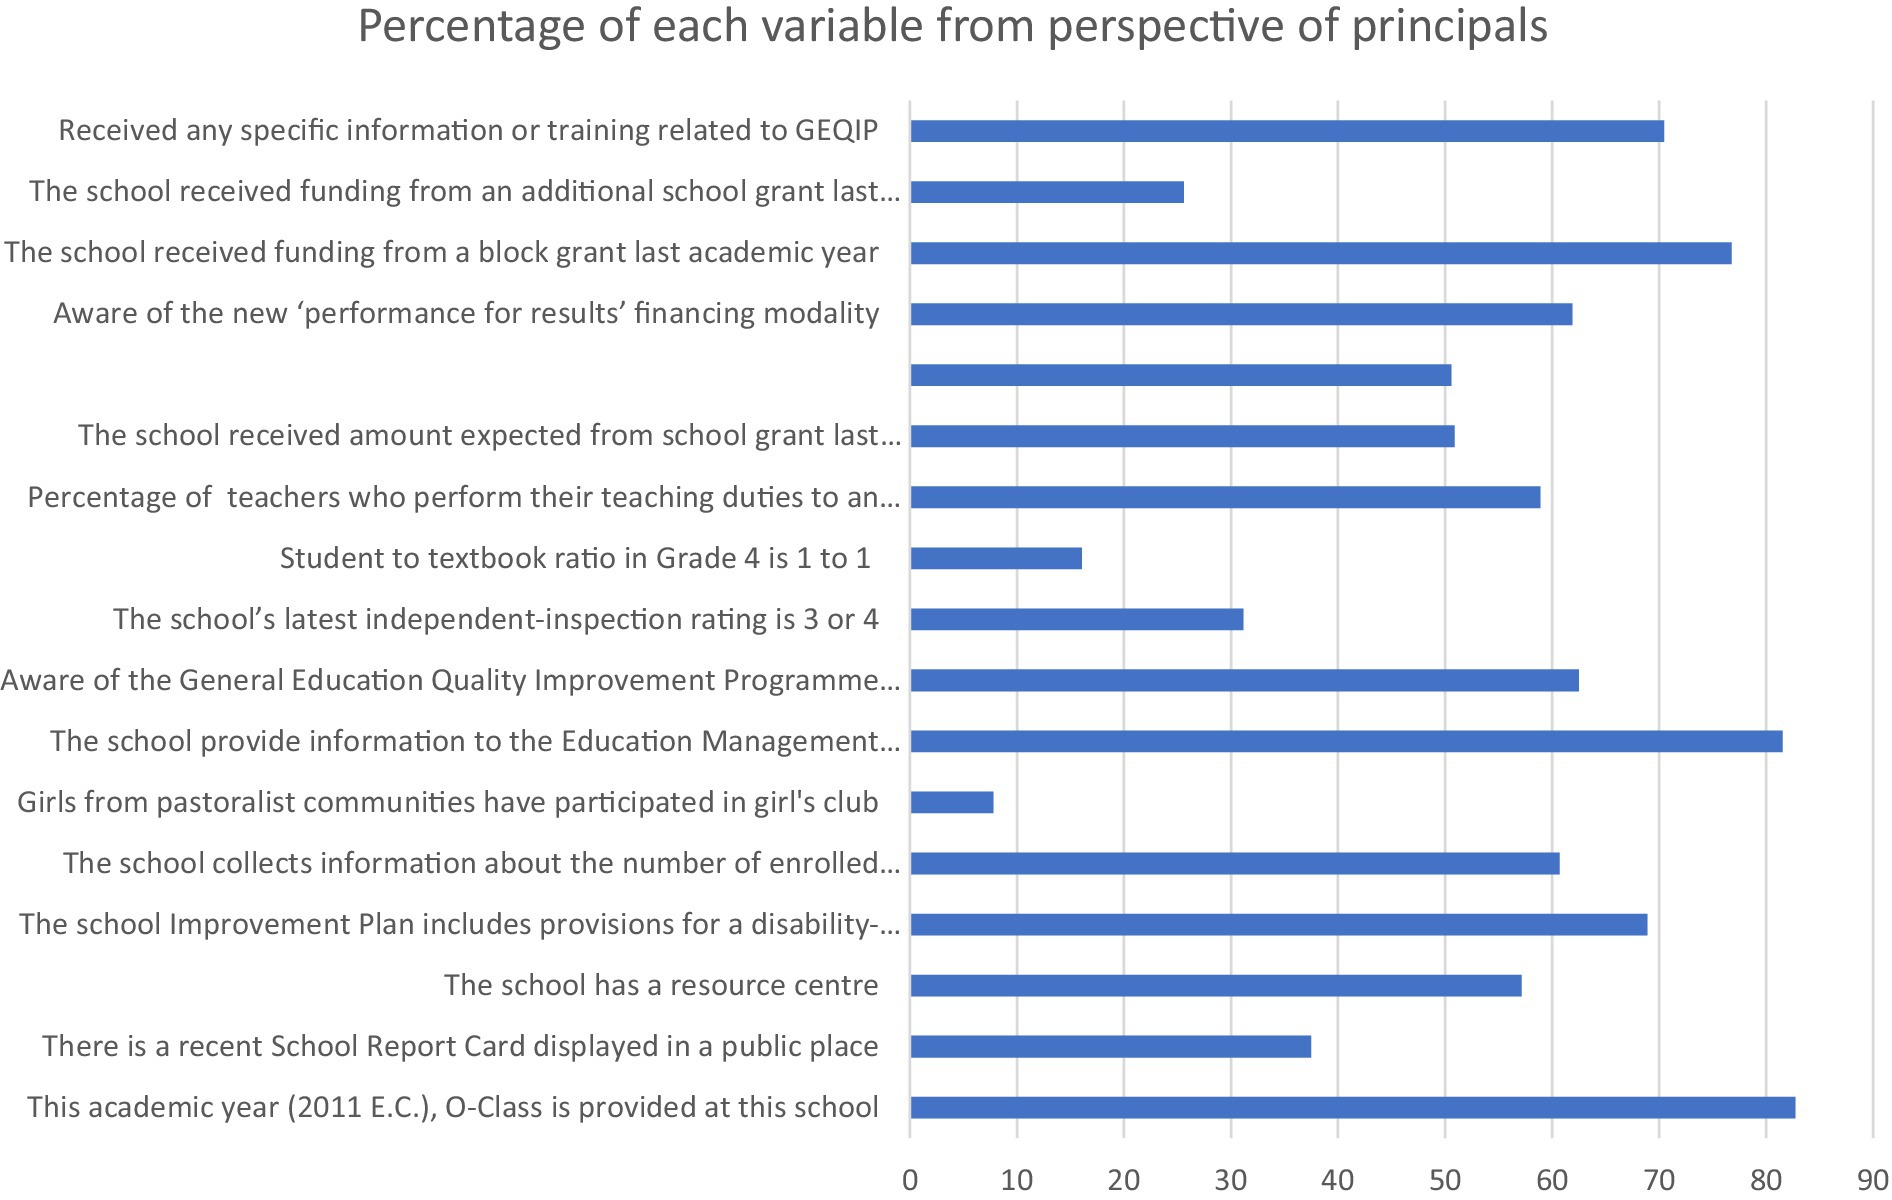
Figure 1. Percentage of each variable from the respective of principal.
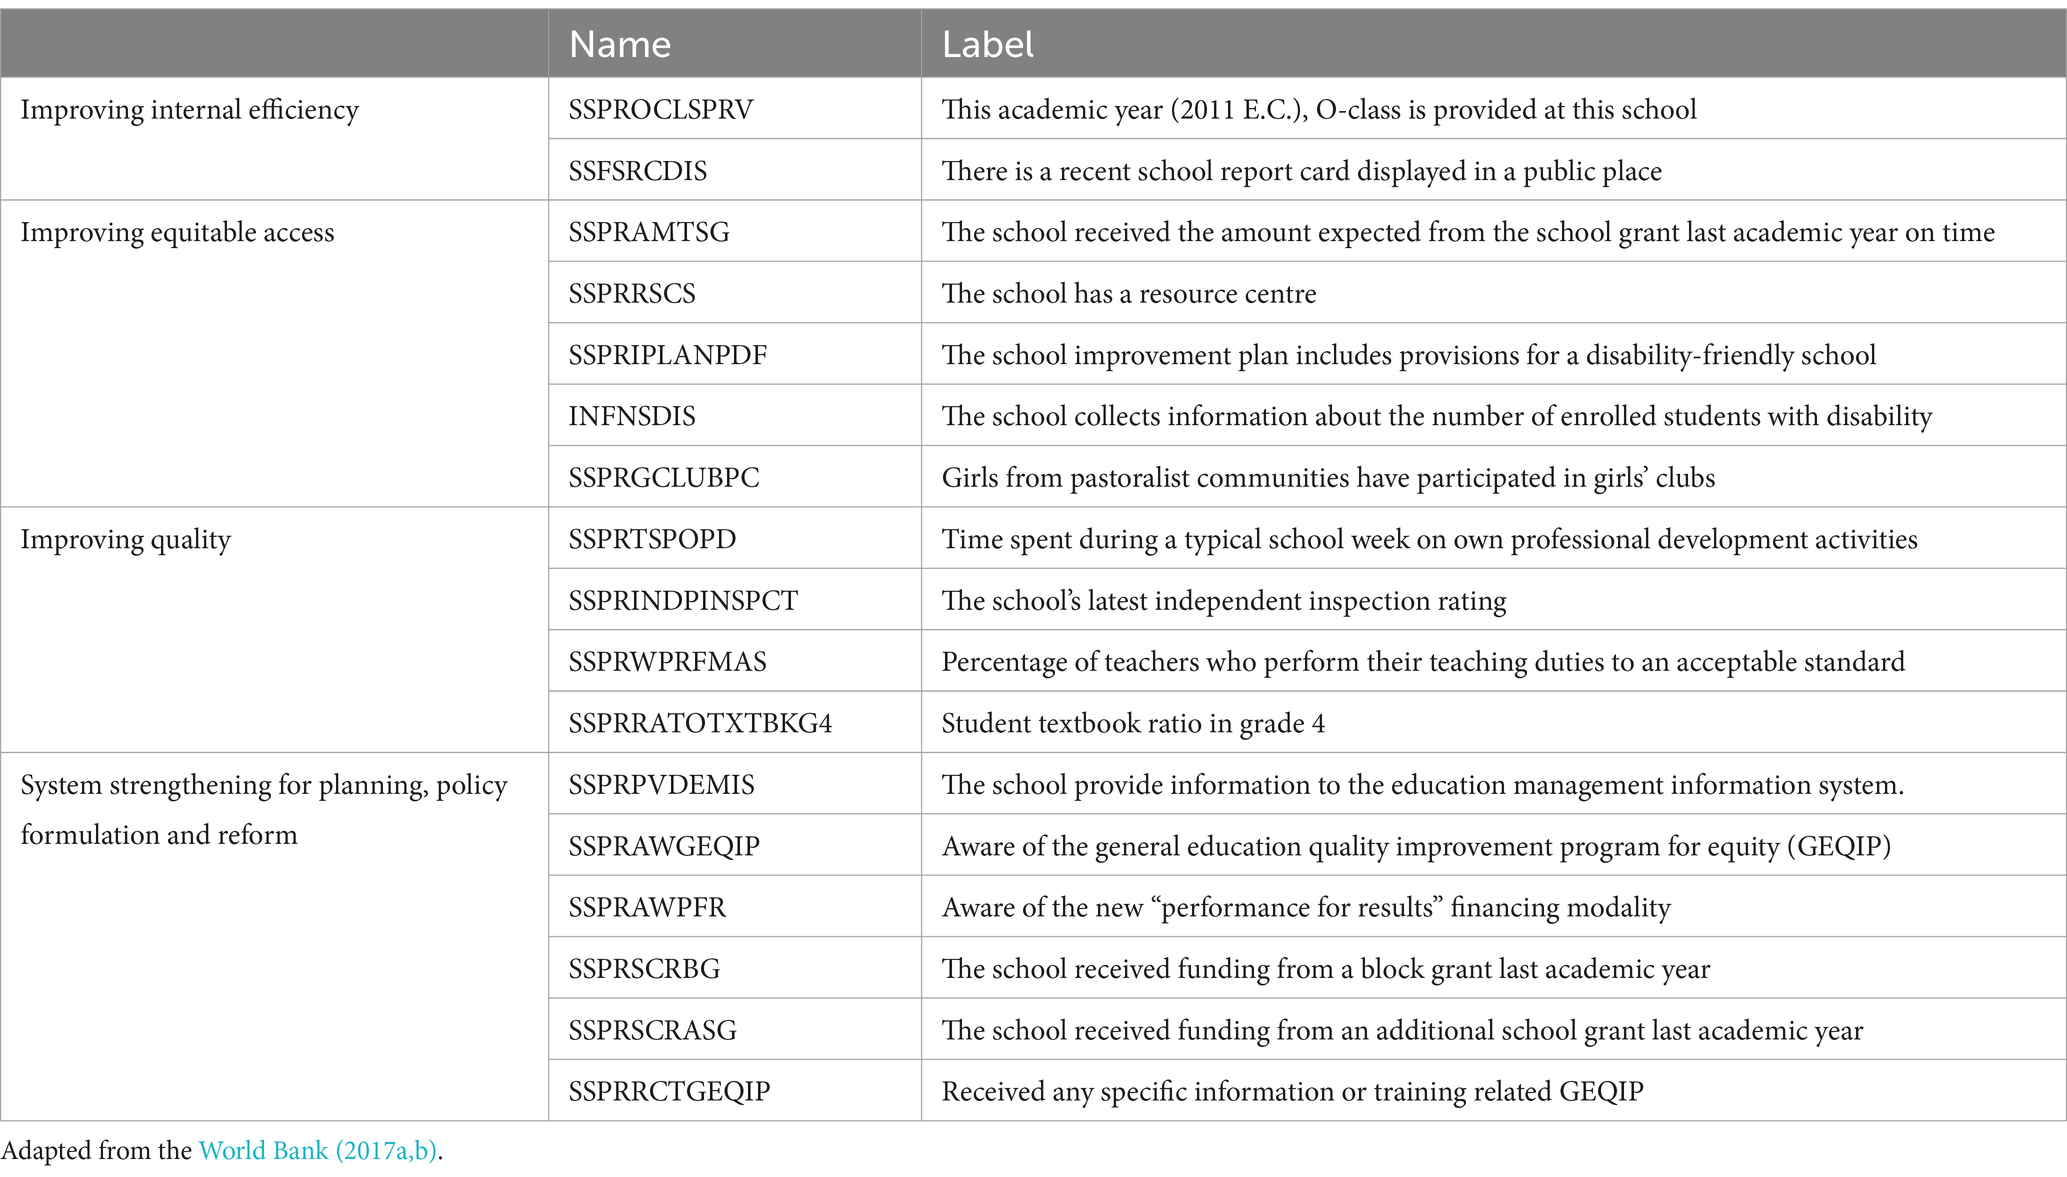
Table 2. Variables used in this study.
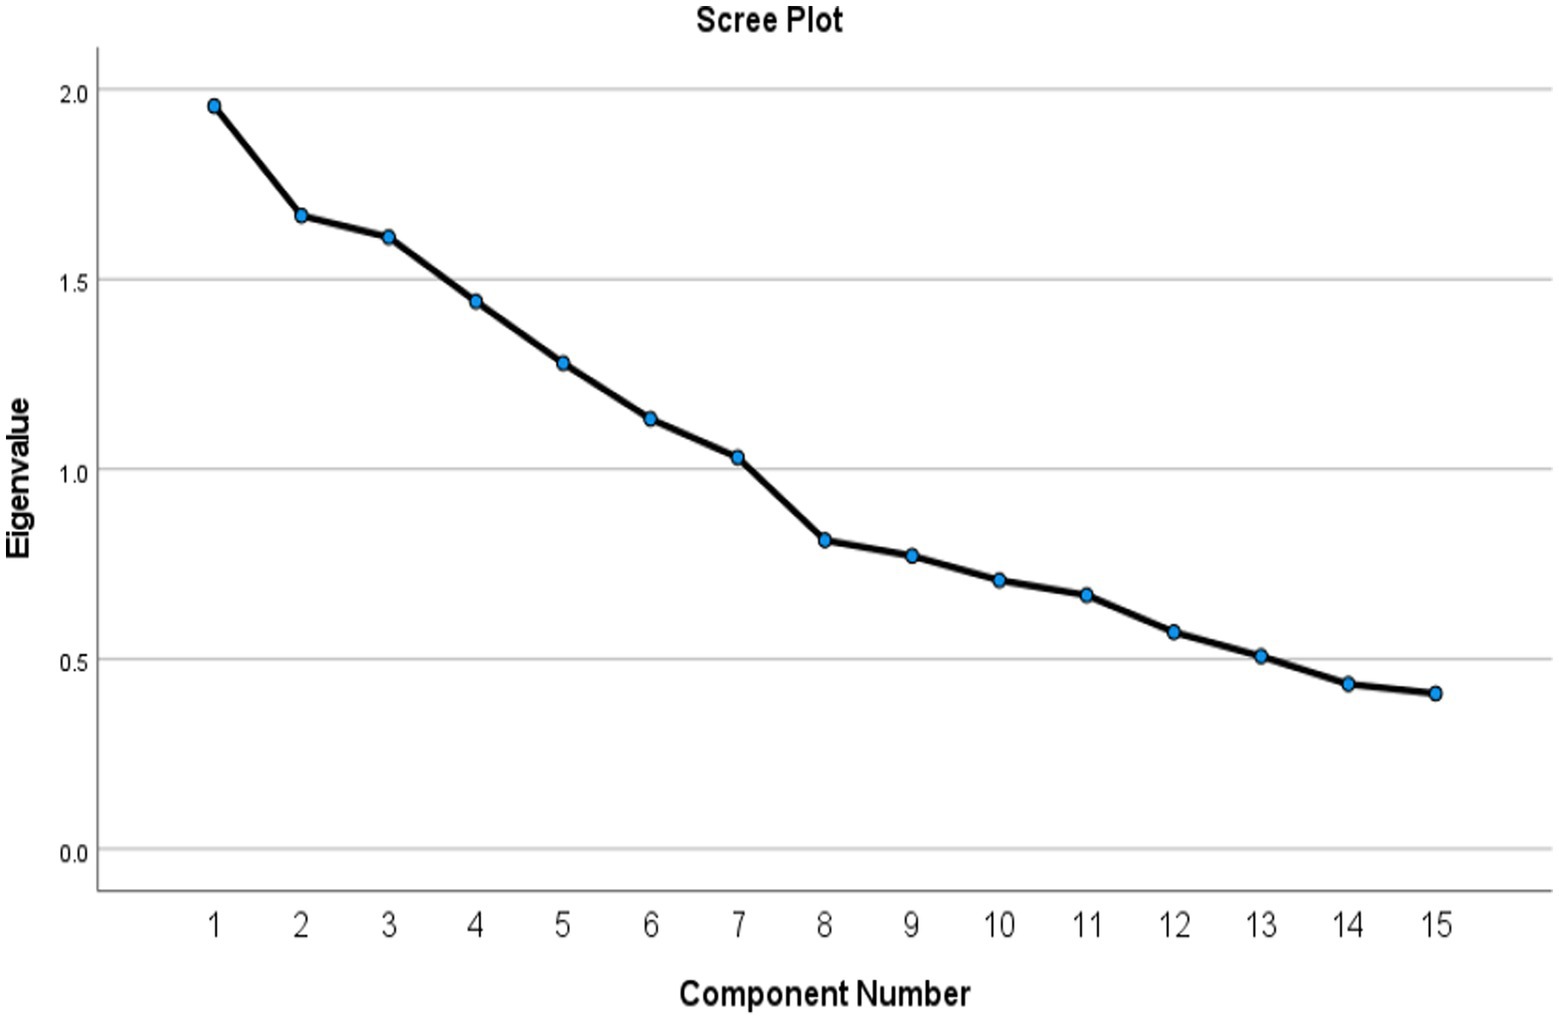
Figure 2. Scree plot.
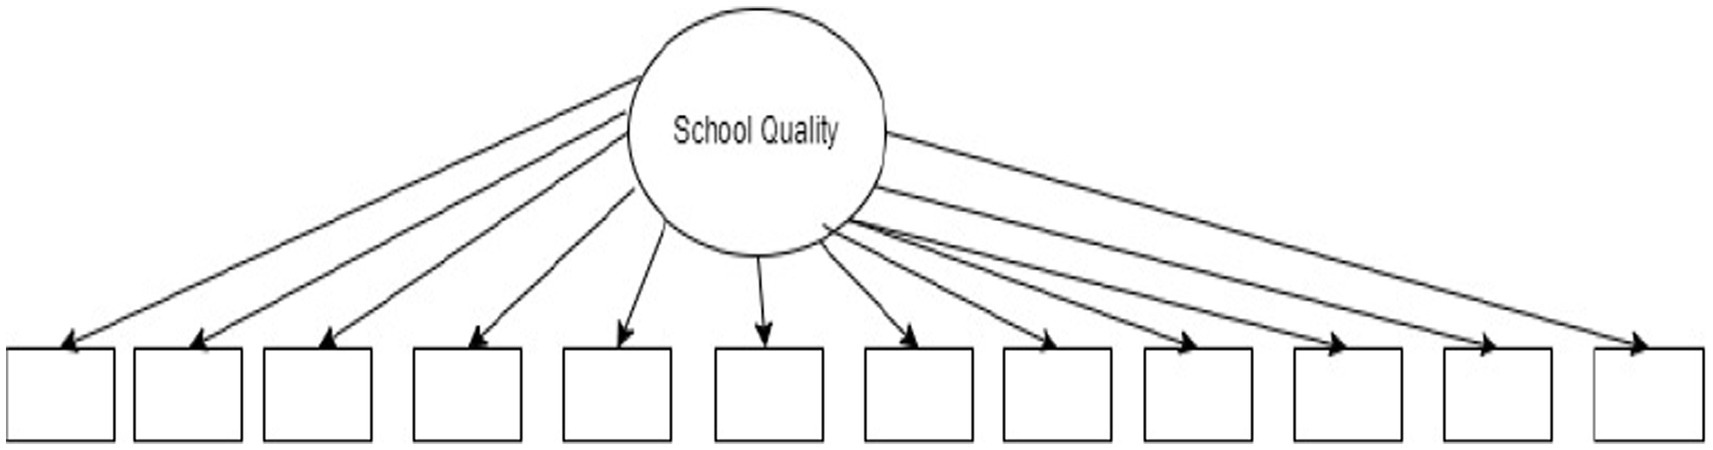
Figure 3. Measurement model of the “school quality scale.”
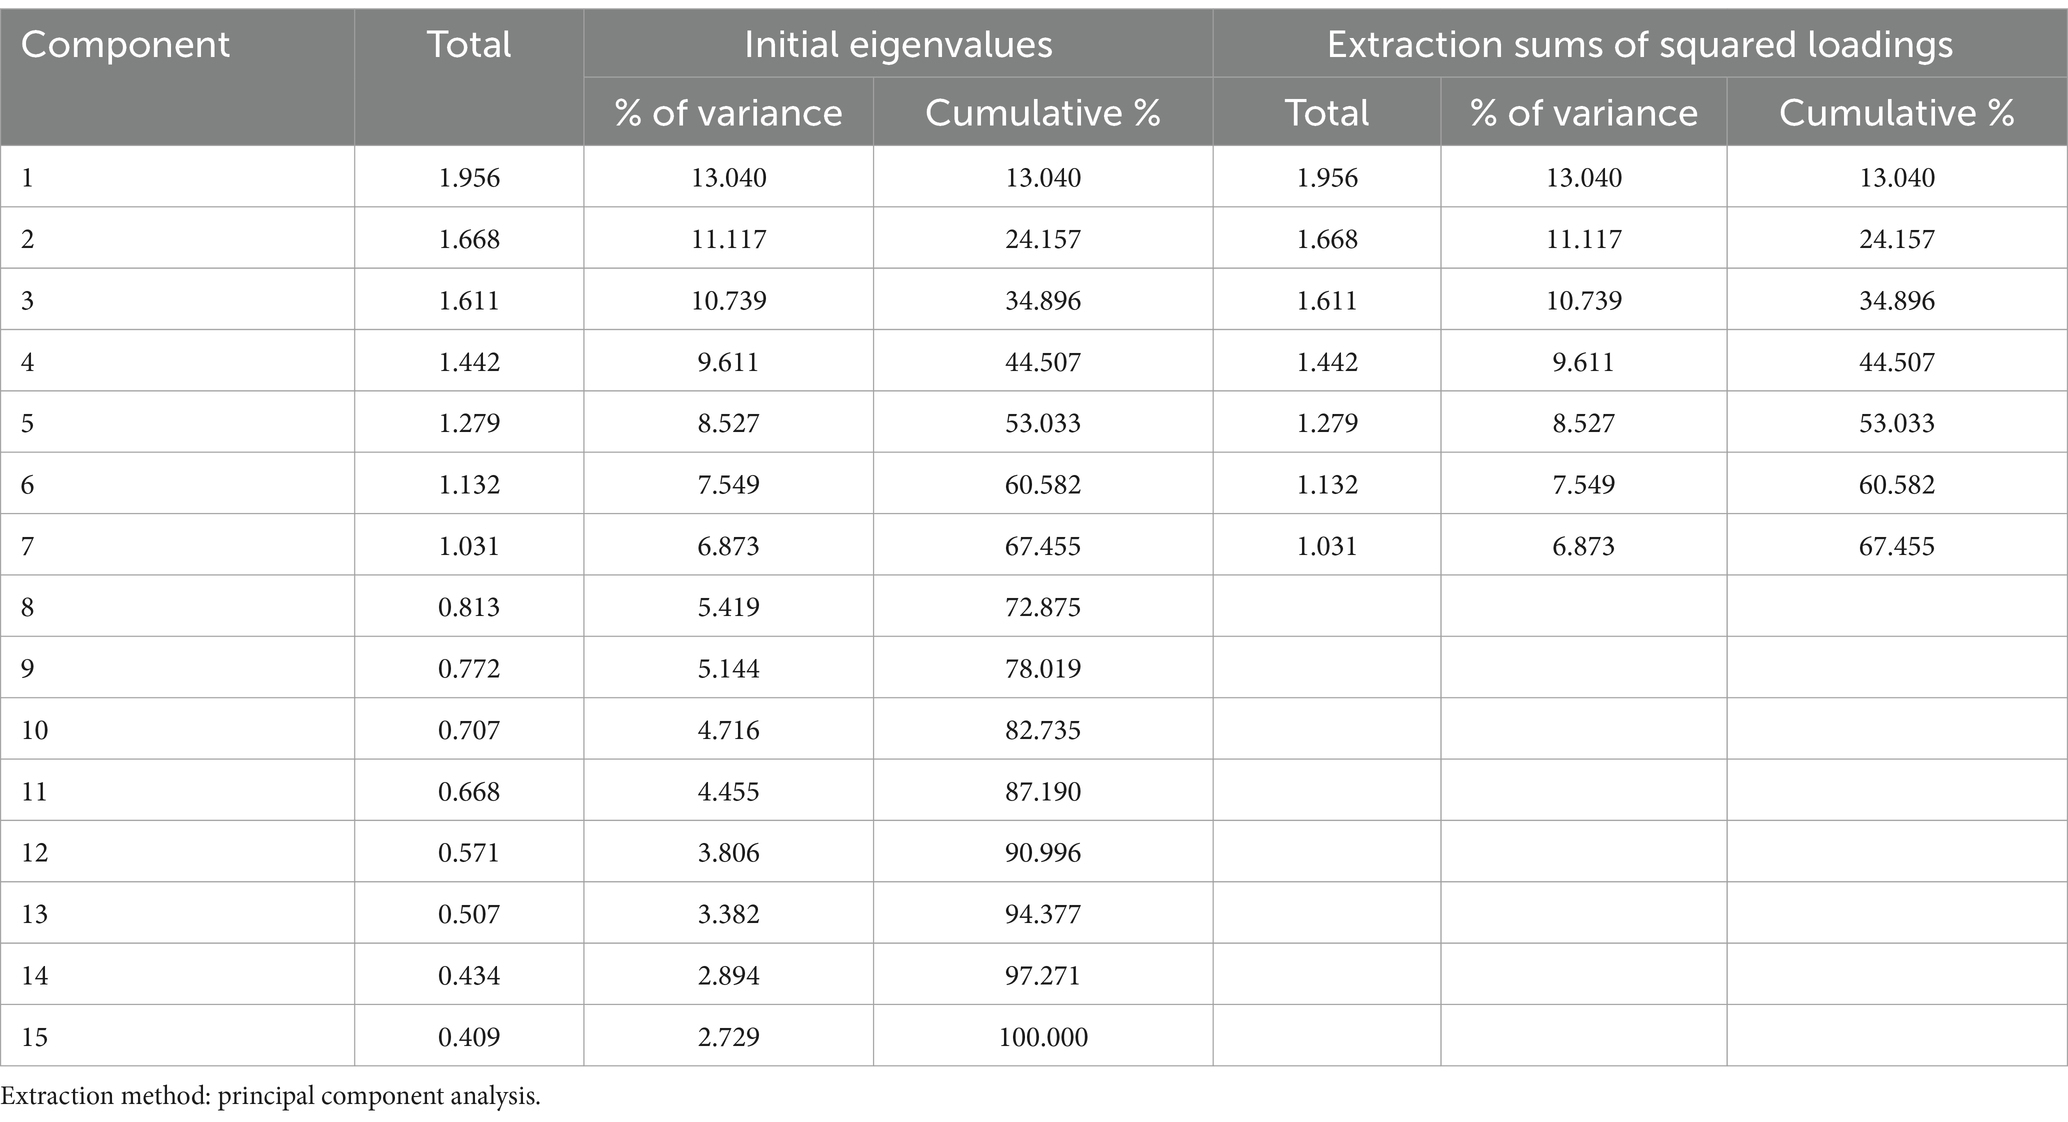
Table 3. Total variance explained.
6.2.2 Confirmatory factor analysis
For the confirmatory factor analysis, we used the following syntax to estimate our model in R Studio.
• model <- "#measurement model
• school_quality =~ SSPROCLSPRV + SSFSRCDIS + SSPRAMTSG_R + SSPRRSCS + SSPRIPLANPDF + INFNSDIS + SSPRGCLUBPC + SSPRTSPOPD_R + SSPRINDPINSPCT_R + SSPRWPRFMAS_R + SSPRRATOTXTBKG4_R + SSPRPVDEMIS + SSPRAWGEQIP + SSPRSCRBG + SSPRSCRASG"
• fit = cfa(model = model, data = principalvarnew1, meanstructure = TRUE, check.gradient = FALSE)
• fitmeasures(fit, c("npar", "chisq", "df", "cfi", "rmsea", "srmr", "tli"))
• summary(fit, standardized = TRUE, fit.measures = TRUE)
A confirmatory factor analysis was executed to investigate the factor structure of the “school quality” scale in this sample. In Table 4, the CFA results indicated that the one-factor structure was not confirmed with this sample as the CFI and TLI were not within an acceptable range, lower than 0.90. The RMSEA and SRMR were more than the 0.80 cut-off suggested by Hu and Bentler (1999) and Rutkowski and Svetina (2014). Overall, the results of the confirmatory factor analysis indicated that the fit indexes were not within an acceptable range. Therefore, we cannot create the scales based on this technique using GEQIP educational policy variables.

Table 4. Confirmatory factor analysis model fit.
6.2.3 Hierarchical cluster analysis
A dendrogram, which is a graphic representation of the clustering process in Appendix Figure A1, is the greatest tool for demonstrating a hierarchical cluster analysis. It can be found right towards the conclusion of the SPSS output. Clusters that are closer in similarity to one another are grouped together early when examining the dendrogram from left to right. Since hierarchical cluster analysis does not have a formal stopping criterion, a cut-off value must be extracted from the dendrogram to indicate when the clustering process should be terminated (Bratchell, 1989). Incorporating data from the dendrogram and agglomeration schedule together is the best method for calculating the number of clusters in the data. Therefore, we can confirm that we have two clusters as one group appeared at the bottom of dendrogram, the other group appeared at top of dendrogram.
In Table 5, the participants number are provided for each cluster membership.
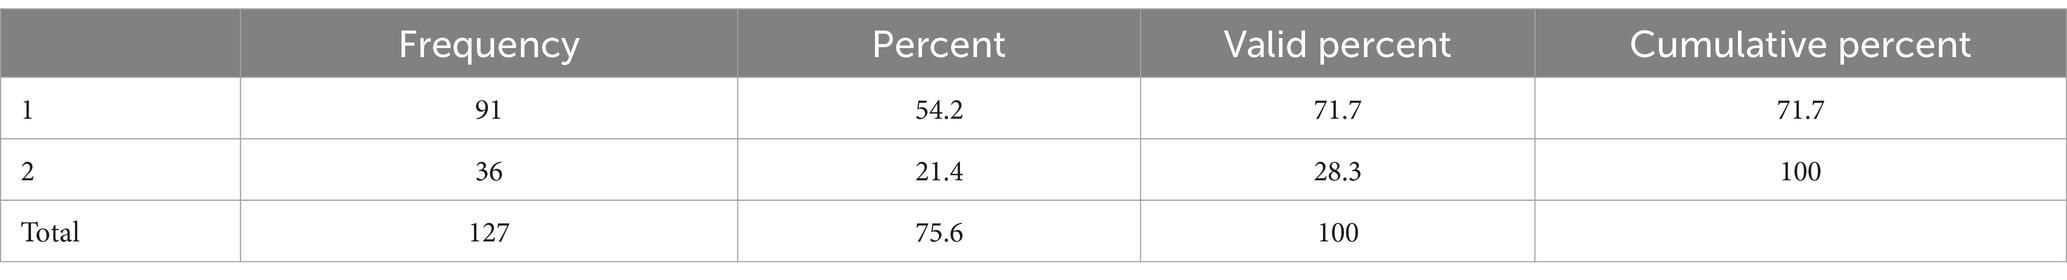
Table 5. The results of hierarchical cluster analysis.
6.2.4 K-means cluster analysis
In Table 6, we provide ANOVA results. In this table, we can see each variables’ significant differences in each cluster. In other words, we see as to whether variables make significant difference to determine each cluster. As seen in Table 6, the following items: “Girls from pastoralist communities have participated in girl’s club,” “The school provide information to the Education Management Information System (EMIS),” “The school receive funding from block grant last academic year,” and “The school receive funding from additional school grant last academic year” and do not make any significant difference (p > 0.05). However, when we look at each item more closely in Table 7, we can see that each items’ contribution to each cluster. Overall, the second cluster group variables’ scores are higher than the first cluster group variables. Therefore, we can say that the second group has more policy implemented schools.
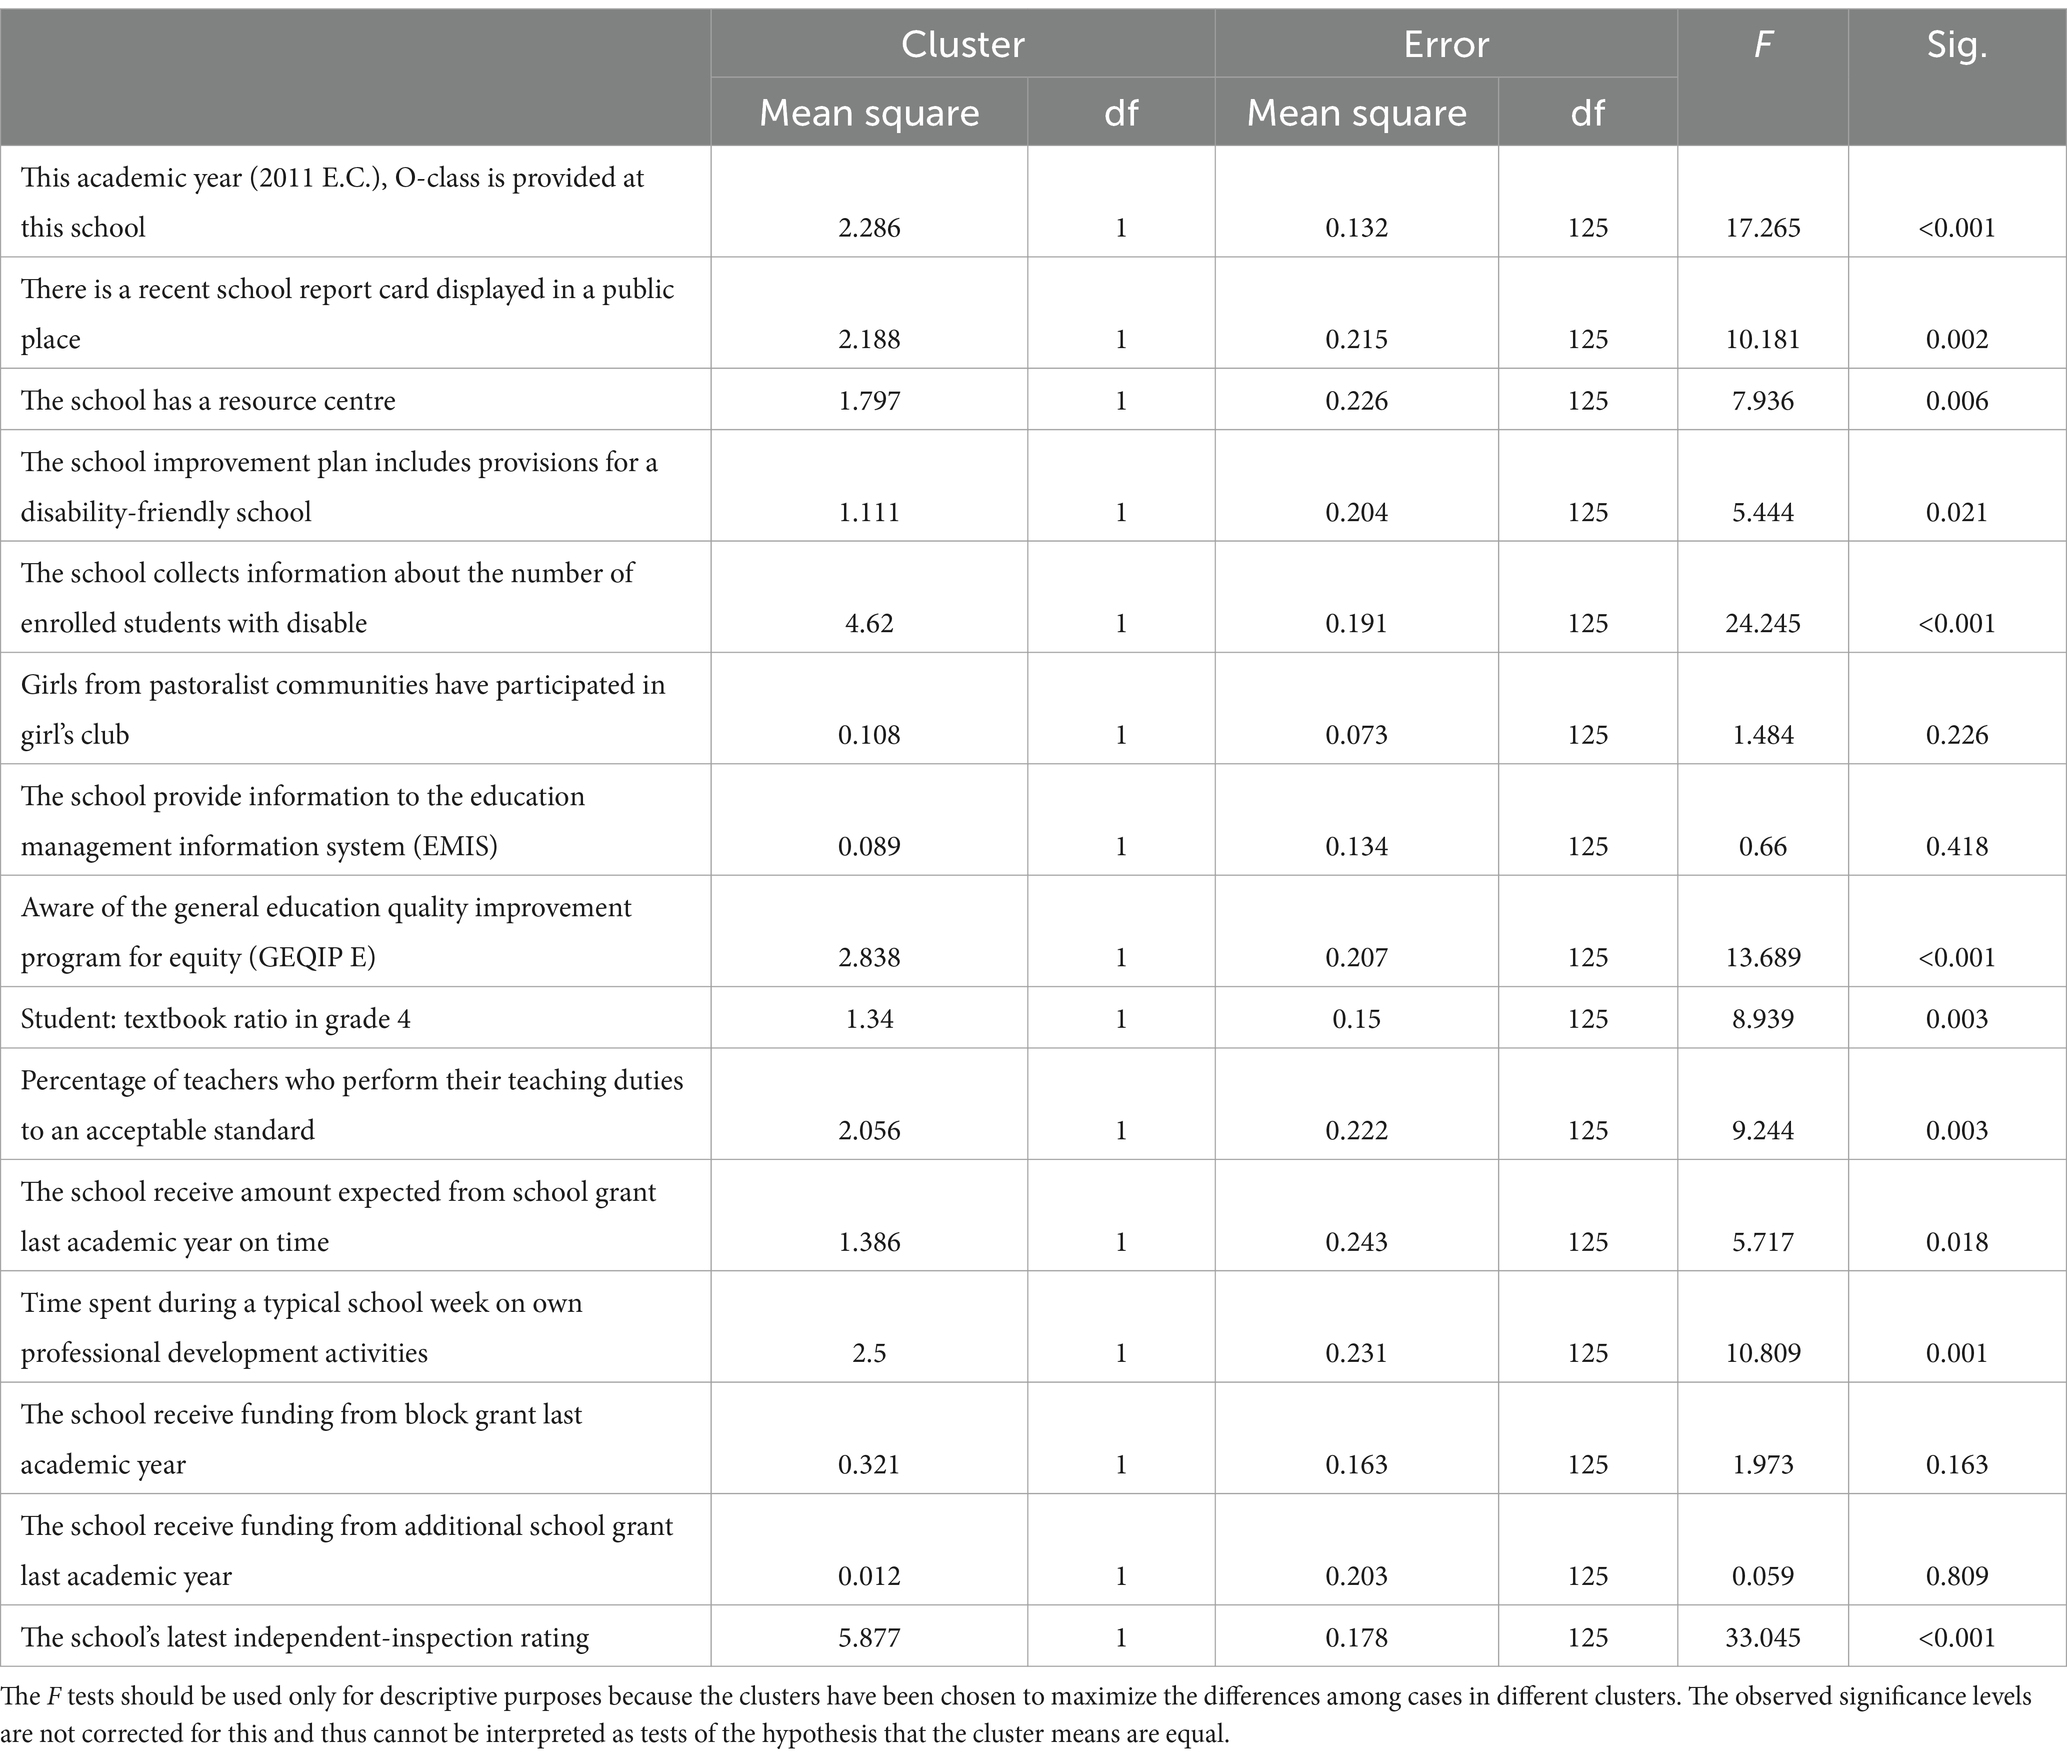
Table 6. ANOVA result.
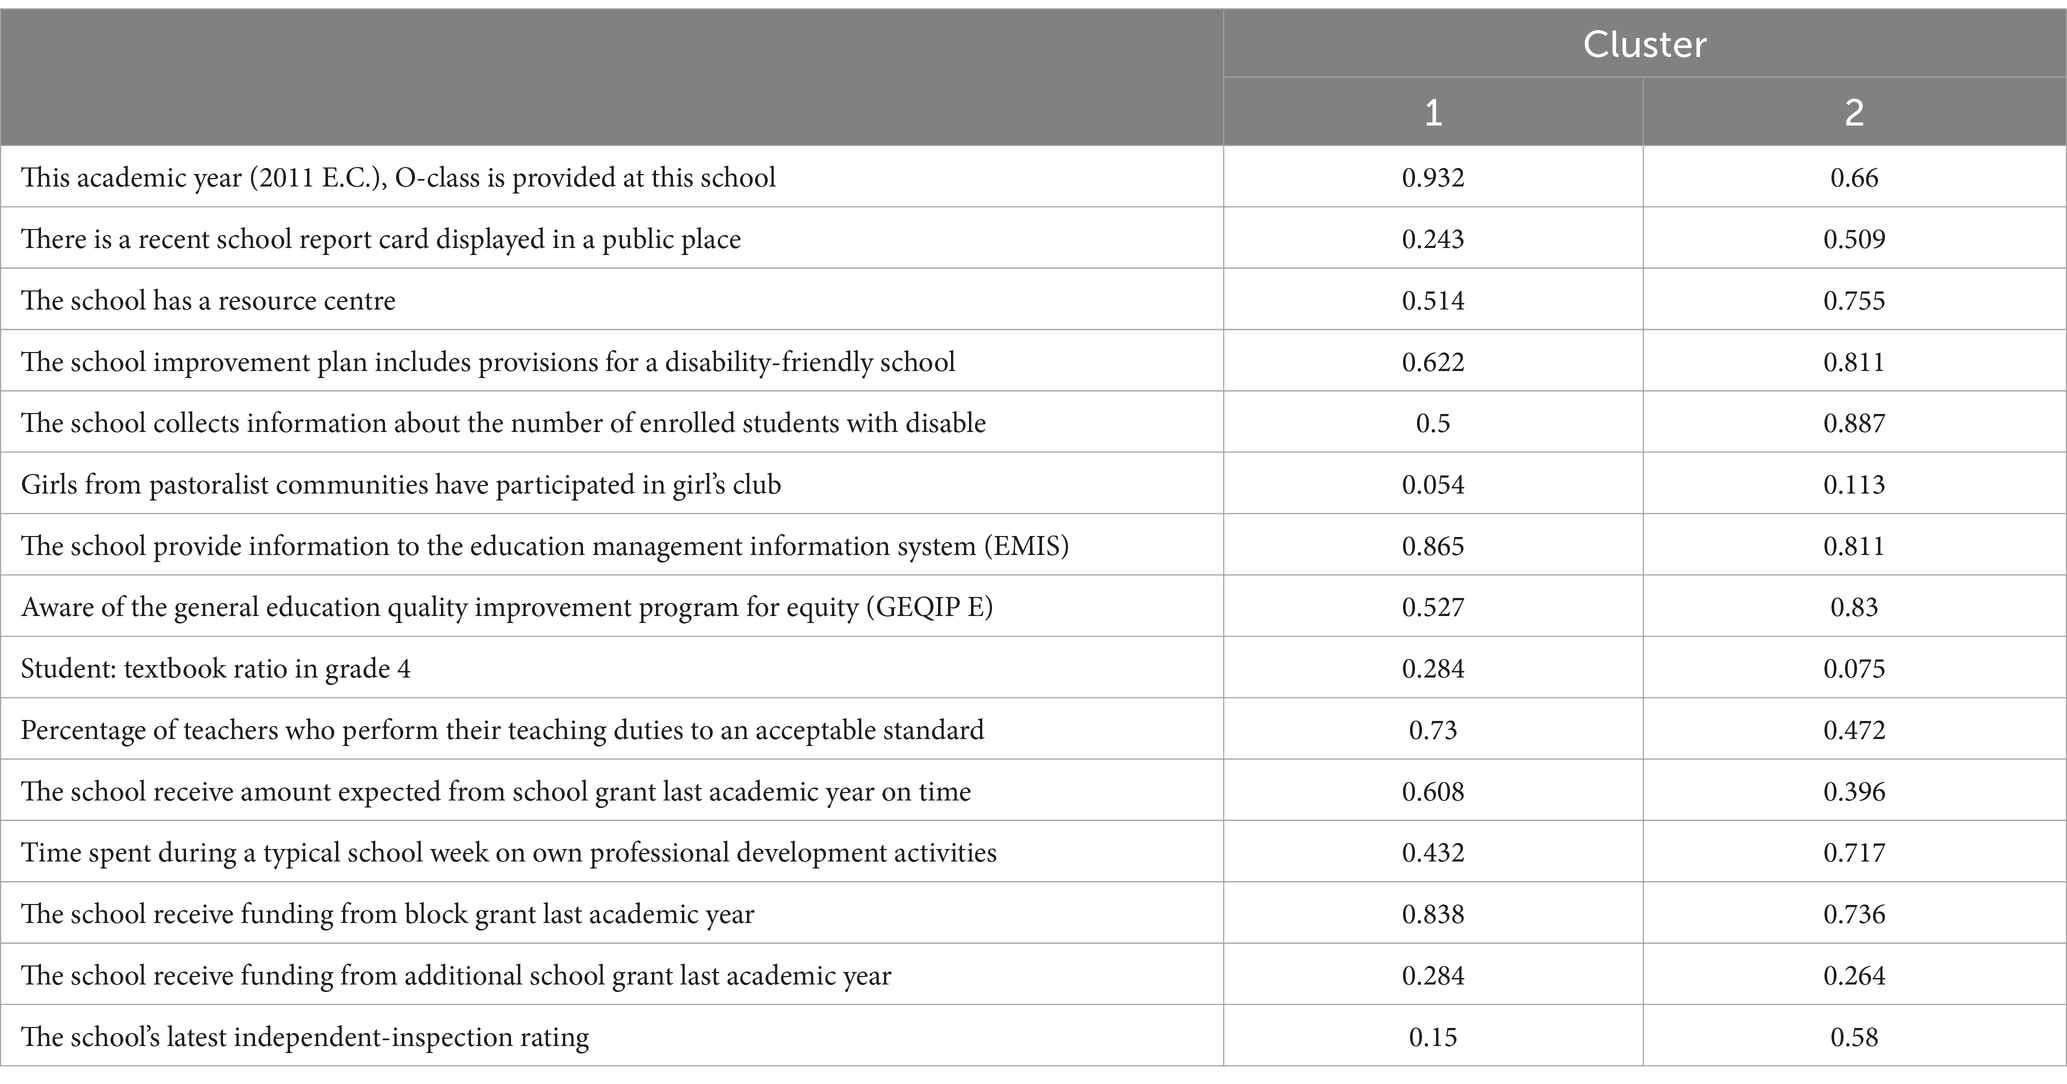
Table 7. Final cluster centres.
In Table 8, we identify schools based on high and low GEQIP-implemented schools using K-means cluster analysis. Based on our analysis, we found that, out of 127 schools, 74 schools were deemed to be less policy-implemented schools, while 53 schools were found to be highly policy-implemented schools.
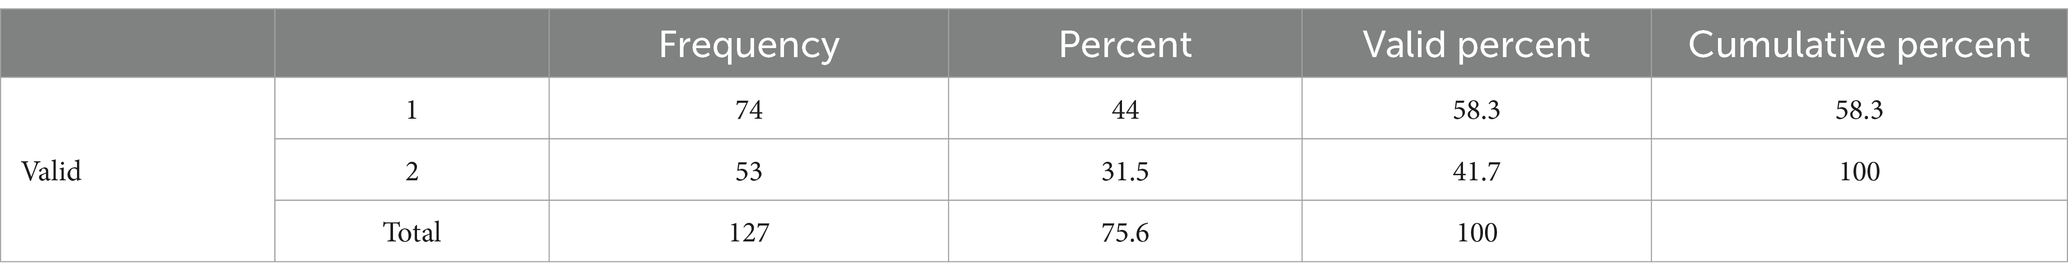
Table 8. Cluster number of case.
7 Concluding remarks
In this methodological paper, we presented the different techniques (confirmatory factor analysis, principal component analysis, hierarchical cluster analysis and K-means cluster analysis) to identify and cluster schools using the GEQIP reform implemented in Ethiopia. In doing so, as stated in the introduction and following sections, the current GEQIP educational reform includes a variety of initiatives to ensure that disadvantaged children and schools have equitable access to primary education. We anticipate that the data and the results from this study will be helpful to all parties involved in the GEQIP reform in determining whether certain sets of interventions are effective in assisting underprivileged schools and children in achieving the reform’s equity-related objectives and how much principals implemented this reform in their schools. More precisely, it is anticipated that these methodological findings will be used for a number of purposes related to understanding how much the GEQIP reform effectively implemented to each school in Ethiopia. Moreover, the understanding of this each cluster (high and low policy-implemented schools) will allow us to see whether the students who come from high policy-implemented schools have a high achievement or not.
In terms of confirmatory factor analysis, we tried to create a single model which consists of 12 variables and could not create a scale since model fit index are not fit the data. Therefore, this method did not allow us to make a comparison of its results with other techniques used in this study. One reason might be that we have 12 variables used for confirmatory factor analysis, so the data did not fit data well.
In terms of principal component analysis, based on the results of principal component analysis, there are 59 less policy-implemented schools and 66 highly policy-implemented schools. However, we must highlight that the result of principal component analysis is not reliable due to not meeting the assumptions. For this reason, we did not use the result of this method for our decision-making process.
Hierarchical cluster analysis vs. K-means cluster analysis results, based on the hierarchical cluster analysis result, there are 36 schools highly policy-implemented schools and 91 less policy-implemented schools. Based on the K-means cluster analysis result, there are 53 highly policy-implemented schools and 74 less policy-implemented schools. If we look at the schools closer based on principal component analysis and K-means cluster analysis, both groups’ schools are not consistent. We consider here hierarchical cluster analysis as an exploratory method to inform us how many possible clusters we can achieve.
In terms of methodological implication of this study; K-means clustering, hierarchical clustering, principal component analysis (PCA), and confirmatory factor analysis (CFA) are all useful techniques for clustering and classification. Each of these methods has its own advantages and limitations.
Here are some advantages of K-means clustering over hierarchical clustering, PCA, and CFA for the specific task of classifying schools as high or low policy implemented:
1. Simplicity: K-means clustering is a simple and easy-to-understand method that requires relatively little statistical knowledge to implement. It is also computationally efficient, making it a good choice for large datasets.
2. Flexibility: K-means clustering allows you to specify the number of clusters you want to create, which gives you more control over the resulting clusters. Hierarchical clustering, on the other hand, creates a fixed hierarchy of clusters regardless of the number of clusters you want to create.
3. Interpretability: K-means clustering produces clusters that are easy to interpret and understand, since each cluster is represented by its centroid (the average of all points in the cluster). This makes it easier to identify which schools fall into the high or low policy implemented clusters.
4. No assumptions about data structure: K-means clustering does not make any assumptions about the structure of the data, unlike PCA and CFA which assume that the data is linearly related or that it follows a particular factor structure.
Overall, K-means clustering may be a good choice for classifying schools as high or low policy implemented due to its simplicity, flexibility, interpretability, and lack of assumptions about the data structure. However, the choice of clustering method ultimately depends on the specific characteristics of the dataset and the research question being addressed.
To the best of our knowledge, no comprehensive prior attempts have been made in Ethiopia to determine the schools based on a substantial educational reform on equity with a detailed data set similar to the work of RISE Ethiopia, with the intention to identify the schools and the students during the reform implementation period.
Overall, we consider this study important in two senses. One point is that this study allows us to test different methodologies to identify and cluster schools based on GEQIP reform implemented in Ethiopia to compare those methodologies to find the best suitable strategy for this purpose. This will allow the policymakers in Ethiopia to see how students achieve those high policy-implemented and low or less policy-implemented schools.
In this study, we only focused on the data from principals from GEQIP reform, and we only had 127 complete principals for those variables in the dataset. This number of participants might affect the results. Therefore, future studies might focus on larger number size of participant groups, for example, student data. Those kinds of practices should be carried out with researchers to define schools or groups based on policy reforms implemented in any country’s context.
In conclusion, the successful implementation of educational reforms, such as GEQIP, requires a comprehensive approach that addresses the complex challenges faced by schools. This study contributes to the understanding of the factors that facilitate or hinder the implementation of educational reforms in Ethiopia and provides valuable insights for policymakers and practitioners in improving the quality of education in the country.
Data availability statement
The data analyzed in this study is subject to the following licenses/restrictions: data set is not available publicly. Requests to access these datasets should be directed to bmUzMzFAYmF0aC5hYy51aw==.
Ethics statement
The studies involving humans were approved by REAL Centre at Cambridge University. The studies were conducted in accordance with the local legislation and institutional requirements. The ethics committee/institutional review board waived the requirement of written informed consent for participation from the participants or the participants’ legal guardians/next of kin because the requirement for written informed consent was waived due to anonymized data analysis. Written informed consent was obtained from the minor(s)’ legal guardian/next of kin for the publication of any potentially identifiable images or data included in this article.
Author contributions
NE: Conceptualization, Data curation, Formal analysis, Investigation, Methodology, Software, Validation, Visualization, Writing – original draft, Writing – review & editing.
Funding
The author(s) declare that financial support was received for the research, authorship, and/or publication of this article. I would like to extend my sincere gratitude to the REAL Centre at Cambridge University for their generous support and for providing me with the opportunity to conduct this research as a research assistant. Their commitment to fostering academic excellence and facilitating impactful research has been invaluable to my work. The experience and insights gained during my tenure at the REAL Centre have significantly contributed to the development of this paper. I am deeply thankful for the guidance, resources, and academic environment the REAL Centre has offered, which have been instrumental in the completion of this research.
Conflict of interest
The author declares that the research was conducted in the absence of any commercial or financial relationships that could be construed as a potential conflict of interest.
Publisher’s note
All claims expressed in this article are solely those of the authors and do not necessarily represent those of their affiliated organizations, or those of the publisher, the editors and the reviewers. Any product that may be evaluated in this article, or claim that may be made by its manufacturer, is not guaranteed or endorsed by the publisher.
References
Abdi, H., and Williams, L. J. (2010). Principal component analysis. Wiley Interdiscip. Rev. Comput. Stat. 2, 433–459. doi: 10.1002/wics.101
Andrews, M., Pritchett, L., and Woolcock, M. (2017) Building state capability: evidence, analysis, action. Oxford, UK: Oxford University Press
Blei, D., and Lafferty, J. (2009). “Topic models” in Text mining: classification, clustering, and applications. eds. A. Srivastava and M. Sahami (Boca Raton, FL: Taylor & Francis Group), 71–94.
Bratchell, N. (1989). Cluster analysis. Chemom. Intell. Lab. Syst. 6, 105–125. doi: 10.1016/0169-7439(87)80054-0
Bridges, C. C. Jr. (1966). Hierarchical cluster analysis. Psychol. Rep. 18, 851–854. doi: 10.2466/pr0.1966.18.3.851
Brown, T. A. (2015). Confirmatory factor analysis for applied research. New York: Guilford Publications.
Brown, T. A., and Moore, M. T. (2012). “Confirmatory factor analysis” in Handbook of structural equation modeling, Ed. R. H. Hoyle (New York, NY: The Guilford Press). 361–379.
Davies, E., Gift, T., and Lastra-Anadón, C. X. (2021). How global performance assessments shape attitudes toward government decision-making: survey experimental evidence. Governance 34, 413–433. doi: 10.1111/gove.12504
Ditton, H. (2000). “Qualitätskontrolle und Qualitätssicherung in Schule und Unterricht. Ein Überblick zum stand der empirischen Forschung [Quality control and quality assurance in schools and teaching. An overview of the state of empirical research]” in Qualität und Qualitätssicherung im Bildungsbereich: Schule, Sozialpädagogik, Hochschule. Eds. A. Helmke, W. Hornstein, and E. Terhart (Weinheim, Germany: Beltz).
Hoddinott, J., Araya, M., Woldehanna, T., Sabates, R., Tiruneh, D. T., and Eryilmaz, N. (2023). “Which aspects of educational reforms in Ethiopia have promoted equitable achievements in mathematics?” in RISE working paper series. 23/138.
Hoddinott, J., Iyer, P., Sabates, R., and Woldehanna, T. (2019). “Evaluating large-scale education reforms in Ethiopia” in RISE working paper (19/034).
Hoyle, R. H. (2000). “Confirmatory factor analysis” in Handbook of applied multivariate statistics and mathematical modeling (Burlington, MA: Academic Press), 465–497.
Hu, L. T., and Bentler, P. M. (1999). Cutoff criteria for fit indexes in covariance structure analysis: conventional criteria versus new alternatives. Struct. Equ. Model. Multidiscip. J. 6, 1–55. doi: 10.1080/10705519909540118
Jin, X., and Han, J. (2011). “K-means clustering” in Encyclopedia of machine learning. eds. C. Sammut and G. I. Webb (Boston, MA: Springer).
Jolliffe, I. (2005). “Principal component analysis” in Encyclopedia of statistics in behavioral science.
Jolliffe, I. (2022). A 50-year personal journey through time with principal component analysis. J. Multivar. Anal. 188:104820. doi: 10.1016/j.jmva.2021.104820
Jolliffe, I. T., and Cadima, J. (2016). Principal component analysis: a review and recent developments. Philos. Trans. R. Soc. A 374:20150202. doi: 10.1098/rsta.2015.0202
Köhn, H. F., and Hubert, L. J. (2014). “Hierarchical cluster analysis” in Wiley StatsRef: statistics reference online, 1–13.
Lloyd, S. P. (1957). “Least squares quantization in PCM” in Technical report RR-5497 (Murray Hill, NJ: Bell Laboratories).
MacQueen, J. B. (1967). Some methods for classification and analysis of multivariate observations. In L. M. CamLe and J. Neyman (Eds.), Proceedings of the fifth Berkeley symposium on mathematical statistics and probability 281–297). California, CA: University of California Press.
Nguyen, T. P. K. (2020). Principal component analysis of education-related data sets. Delft University of Technology Repository. Retrieved from https://repository.tudelft.nl/islandora/object/uuid:11a166e3-cd94-45e8-91ed-660a0cfe8b9e?collection=education
Niemi, H. (2021). Education reforms for equity and quality: an analysis from an educational ecosystem perspective with reference to Finnish educational transformations. Center Educ. Policy Stud. J. 11, 13–35. doi: 10.26529/cepsj.1100
Ochieng, H. K., and Yeonsung, C. (2021). Political economy of education: assessing institutional and structural constraints to quality and access to education opportunities in Tanzania. SAGE Open 11:215824402110472. doi: 10.1177/21582440211047204
Patrinos, H. A., Arcia, G., and Macdonald, K. (2015). School autonomy and accountability in Thailand: does the gap between policy intent and implementation matter? Prospects 45, 429–445. doi: 10.1007/s11125-015-9368-8
Patrinos, H. A., Velez, E., and Wang, C. Y. (2013). “Framework for the reform of education systems and planning for quality” in Policy research working paper series 6701 (Washington, D.C.: The World Bank).
R Core Team (2019). R: A language and environment for statistical computing. R Foundation for Statistical Computing, Vienna, Austria. Available at: https://www.R-project.org/
Richardson, M. (2009). Principal component analysis. Available at: http://people.maths.ox.ac.uk/richardsonm/SignalProcPCA.pdf
Rosseel, Y. (2012). Lavaan: an R package for structural equation modeling and more. Version 0.5–12 (BETA). J. Stat. Softw. 48, 1–36. doi: 10.18637/jss.v048.i02
Rutkowski, L., and Svetina, D. (2014). Assessing the hypothesis of measurement invariance in the context of large-scale international surveys. Educ. Psychol. Meas. 74, 31–57. doi: 10.1177/0013164413498257
Sadik, M. (2018). Educational planning: approaches, trends, and learnings a case study of the Kurdistan region of Iraq (KRI). SSRG Int. J. Econ. Manag. Stud. 5, 1–9.
Santini, M. (2016). Advantages & disadvantages of K-means and hierarchical clustering (unsupervised learning), ML4LT. Uppsala, Sweden: Department of Linguistics and Philology, Uppsala University, 3.
Sardoč, M., Tašner, V., and Gaber, S. (2021). Education reforms and social change. Center Educ. Policy. Stud. J. 11, 7–12. doi: 10.26529/cepsj.1219
Scheerens, J., and Bosker, R. J. (1997). The foundations of educational effectiveness. Oxford, United Kingdom: Pergamon.
Stringfield, S. (1994). “A model of elementary school effects” in Advances in school effectiveness research and practice. Eds. D. Reynolds, B. P. M. Creemers, P. S. Nesselrodt, E. C. Schaffer, S. Stringfield, and C. Teddlie (Oxford, United Kingdom: Pergamon), 153–187.
Tiruneh, D. T., Sabates, R., Rolleston, C., and Hoddinott, J. (2022). Trends in mathematics learning in Ethiopia: 2012–2019. Bahir Dar J. Educ. 21, 26–45. Available at: https://journals.bdu.edu.et/index.php/bje/article/view/669
UNESCO. (2022). The turning point: why we must transform education now. Available at: https://www.unesco.org/en/articles/turning-point-why-we-must-transform-education-now
UNICEF. (2017). Education sector budget brief—2016/17. UNICEF for every child Ethiopia. Available at: https://www.unicef.org/ethiopia/sites/unicef.org.ethiopia/files/2020-01/National_Education_Budget_Brief_2016_17update.pdf
World Bank. (2008). General education quality improvement project (GEQIP-I). Project appraisal document. Report No.: 45140-ET. Washington, D.C.: The World Bank.
World Bank (2010). Stepping up skills: For more jobs and higher productivity. Washington, D.C: World Bank.
World Bank. (2013). General education quality improvement project II (GEQIP-II). Project appraisal document. Report No.: PAD476. Washington, D.C.: The World Bank.
World Bank. (2017a). General education quality improvement program for equity (GEQIP). Project appraisal document. Report No.: 121294-ET. Washington, D.C: The World Bank.
World Bank (2017b). World development report 2018: learning to realize education’s promise. Washington, DC: World Bank.
World Bank (2018). World development report 2018: learning to realise education’s promise. Washington, D.C: World Bank.
World Bank. (2022). The state of global learning poverty: 2022 update. Washington, DC: The World Bank.
Yim, O., and Ramdeen, K. T. (2015). Hierarchical cluster analysis: comparison of three linkage measures and application to psychological data. Quant. Meth. Psychol. 11, 8–21. doi: 10.20982/tqmp.11.1.p008
Appendix
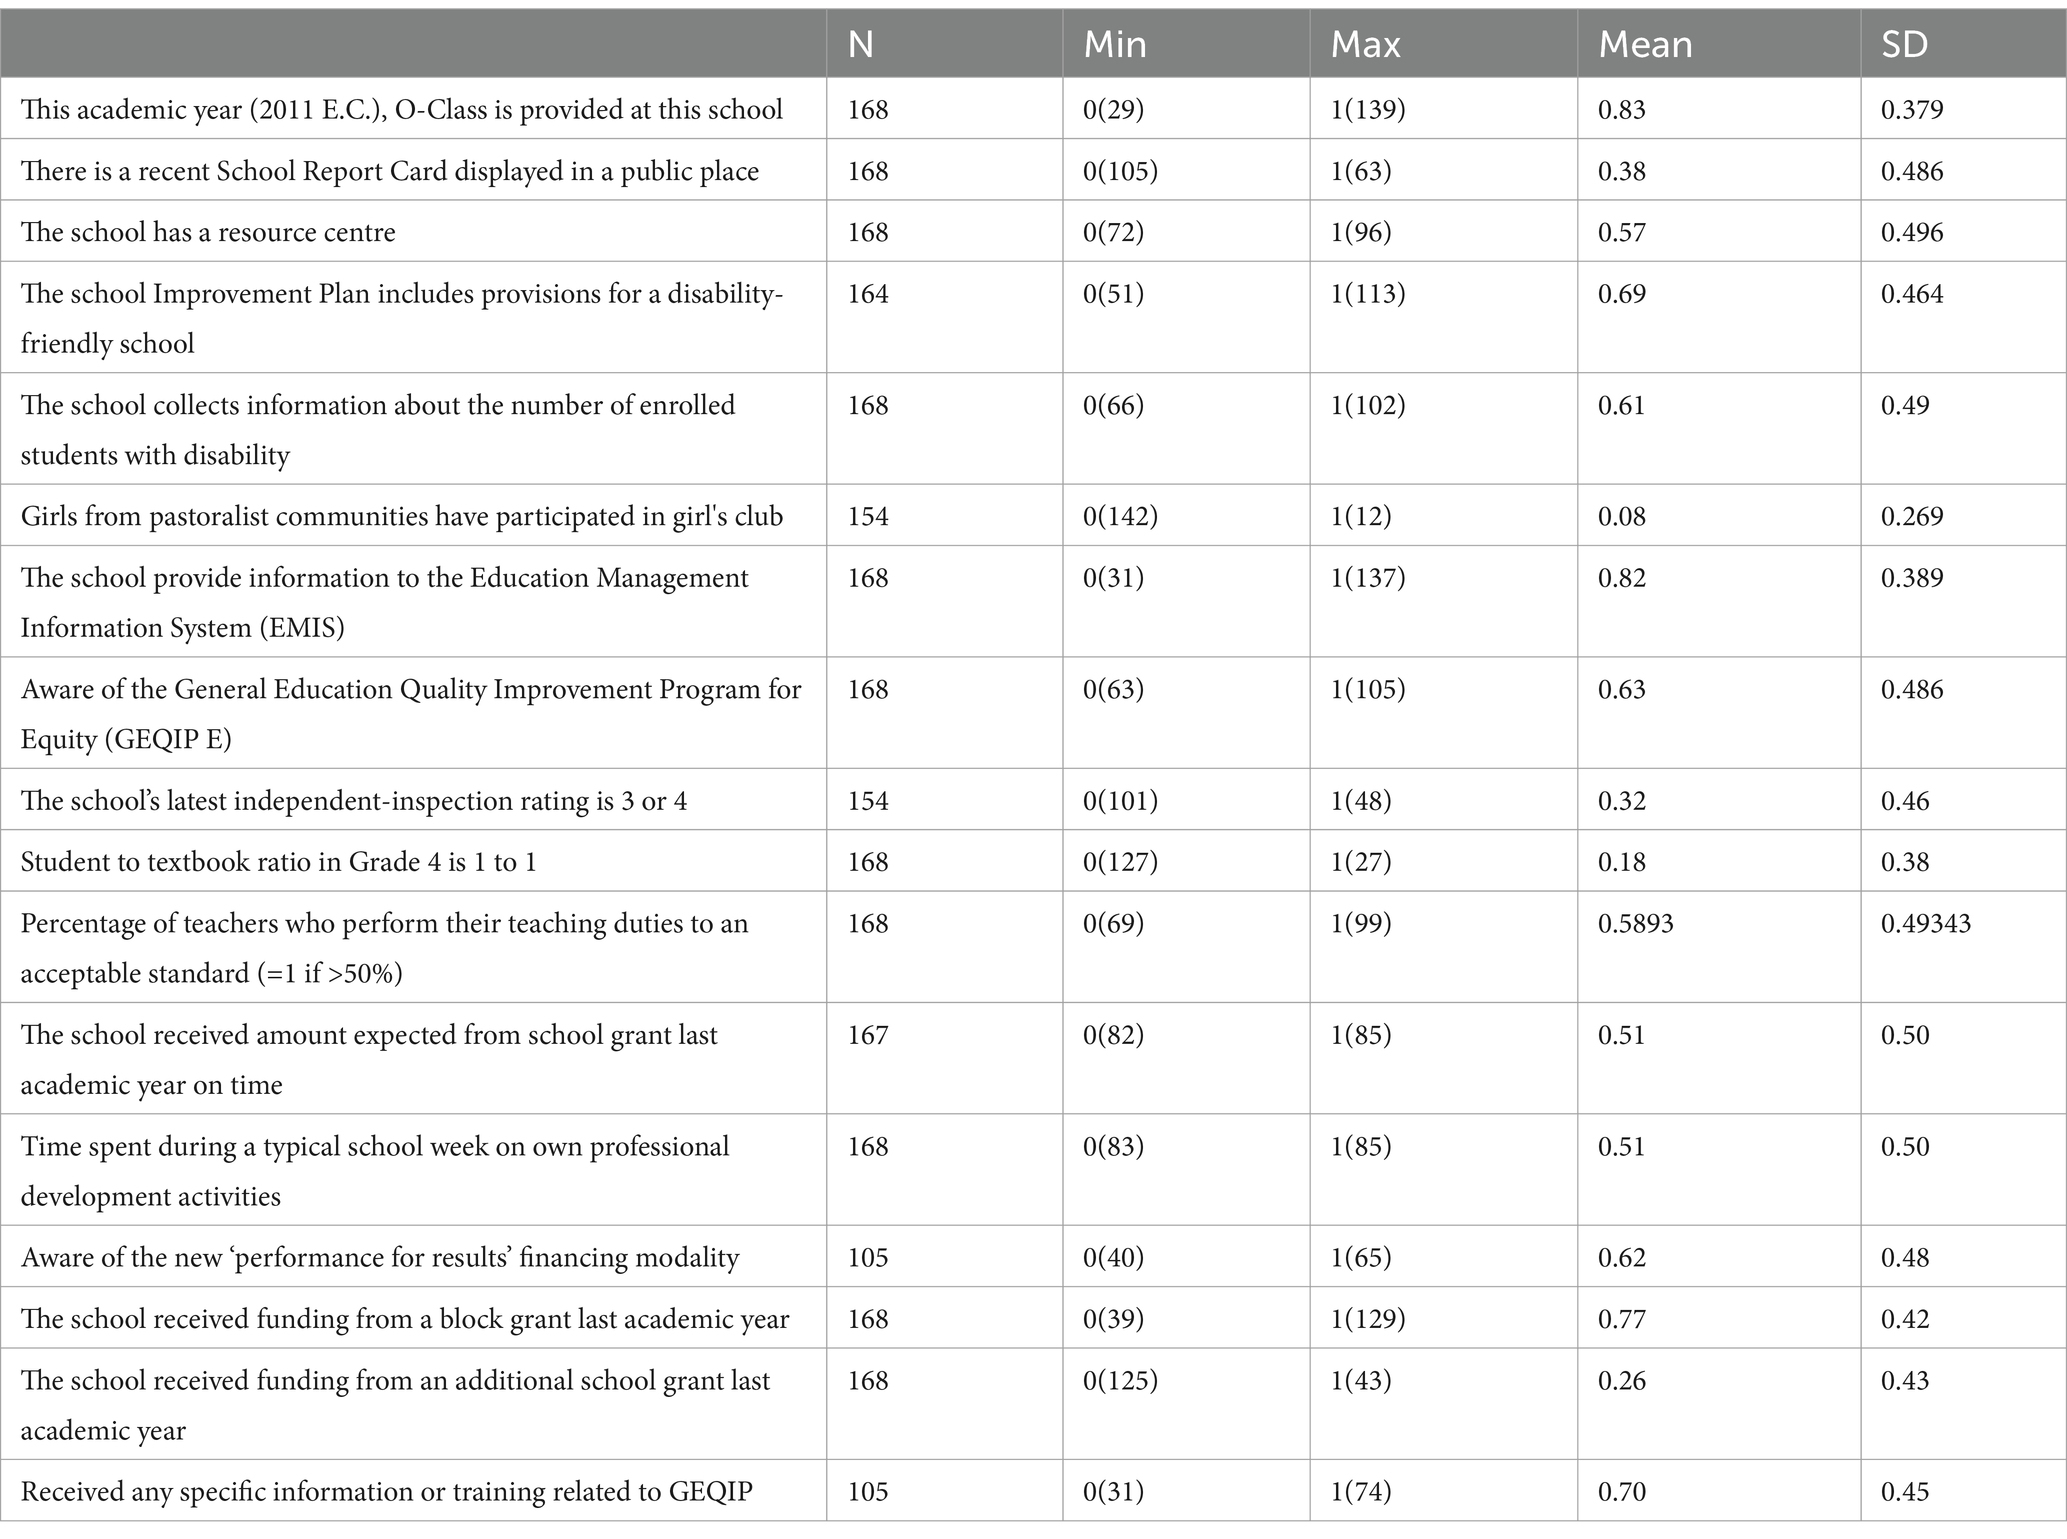
Table A1. Descriptive statistics of each variable.
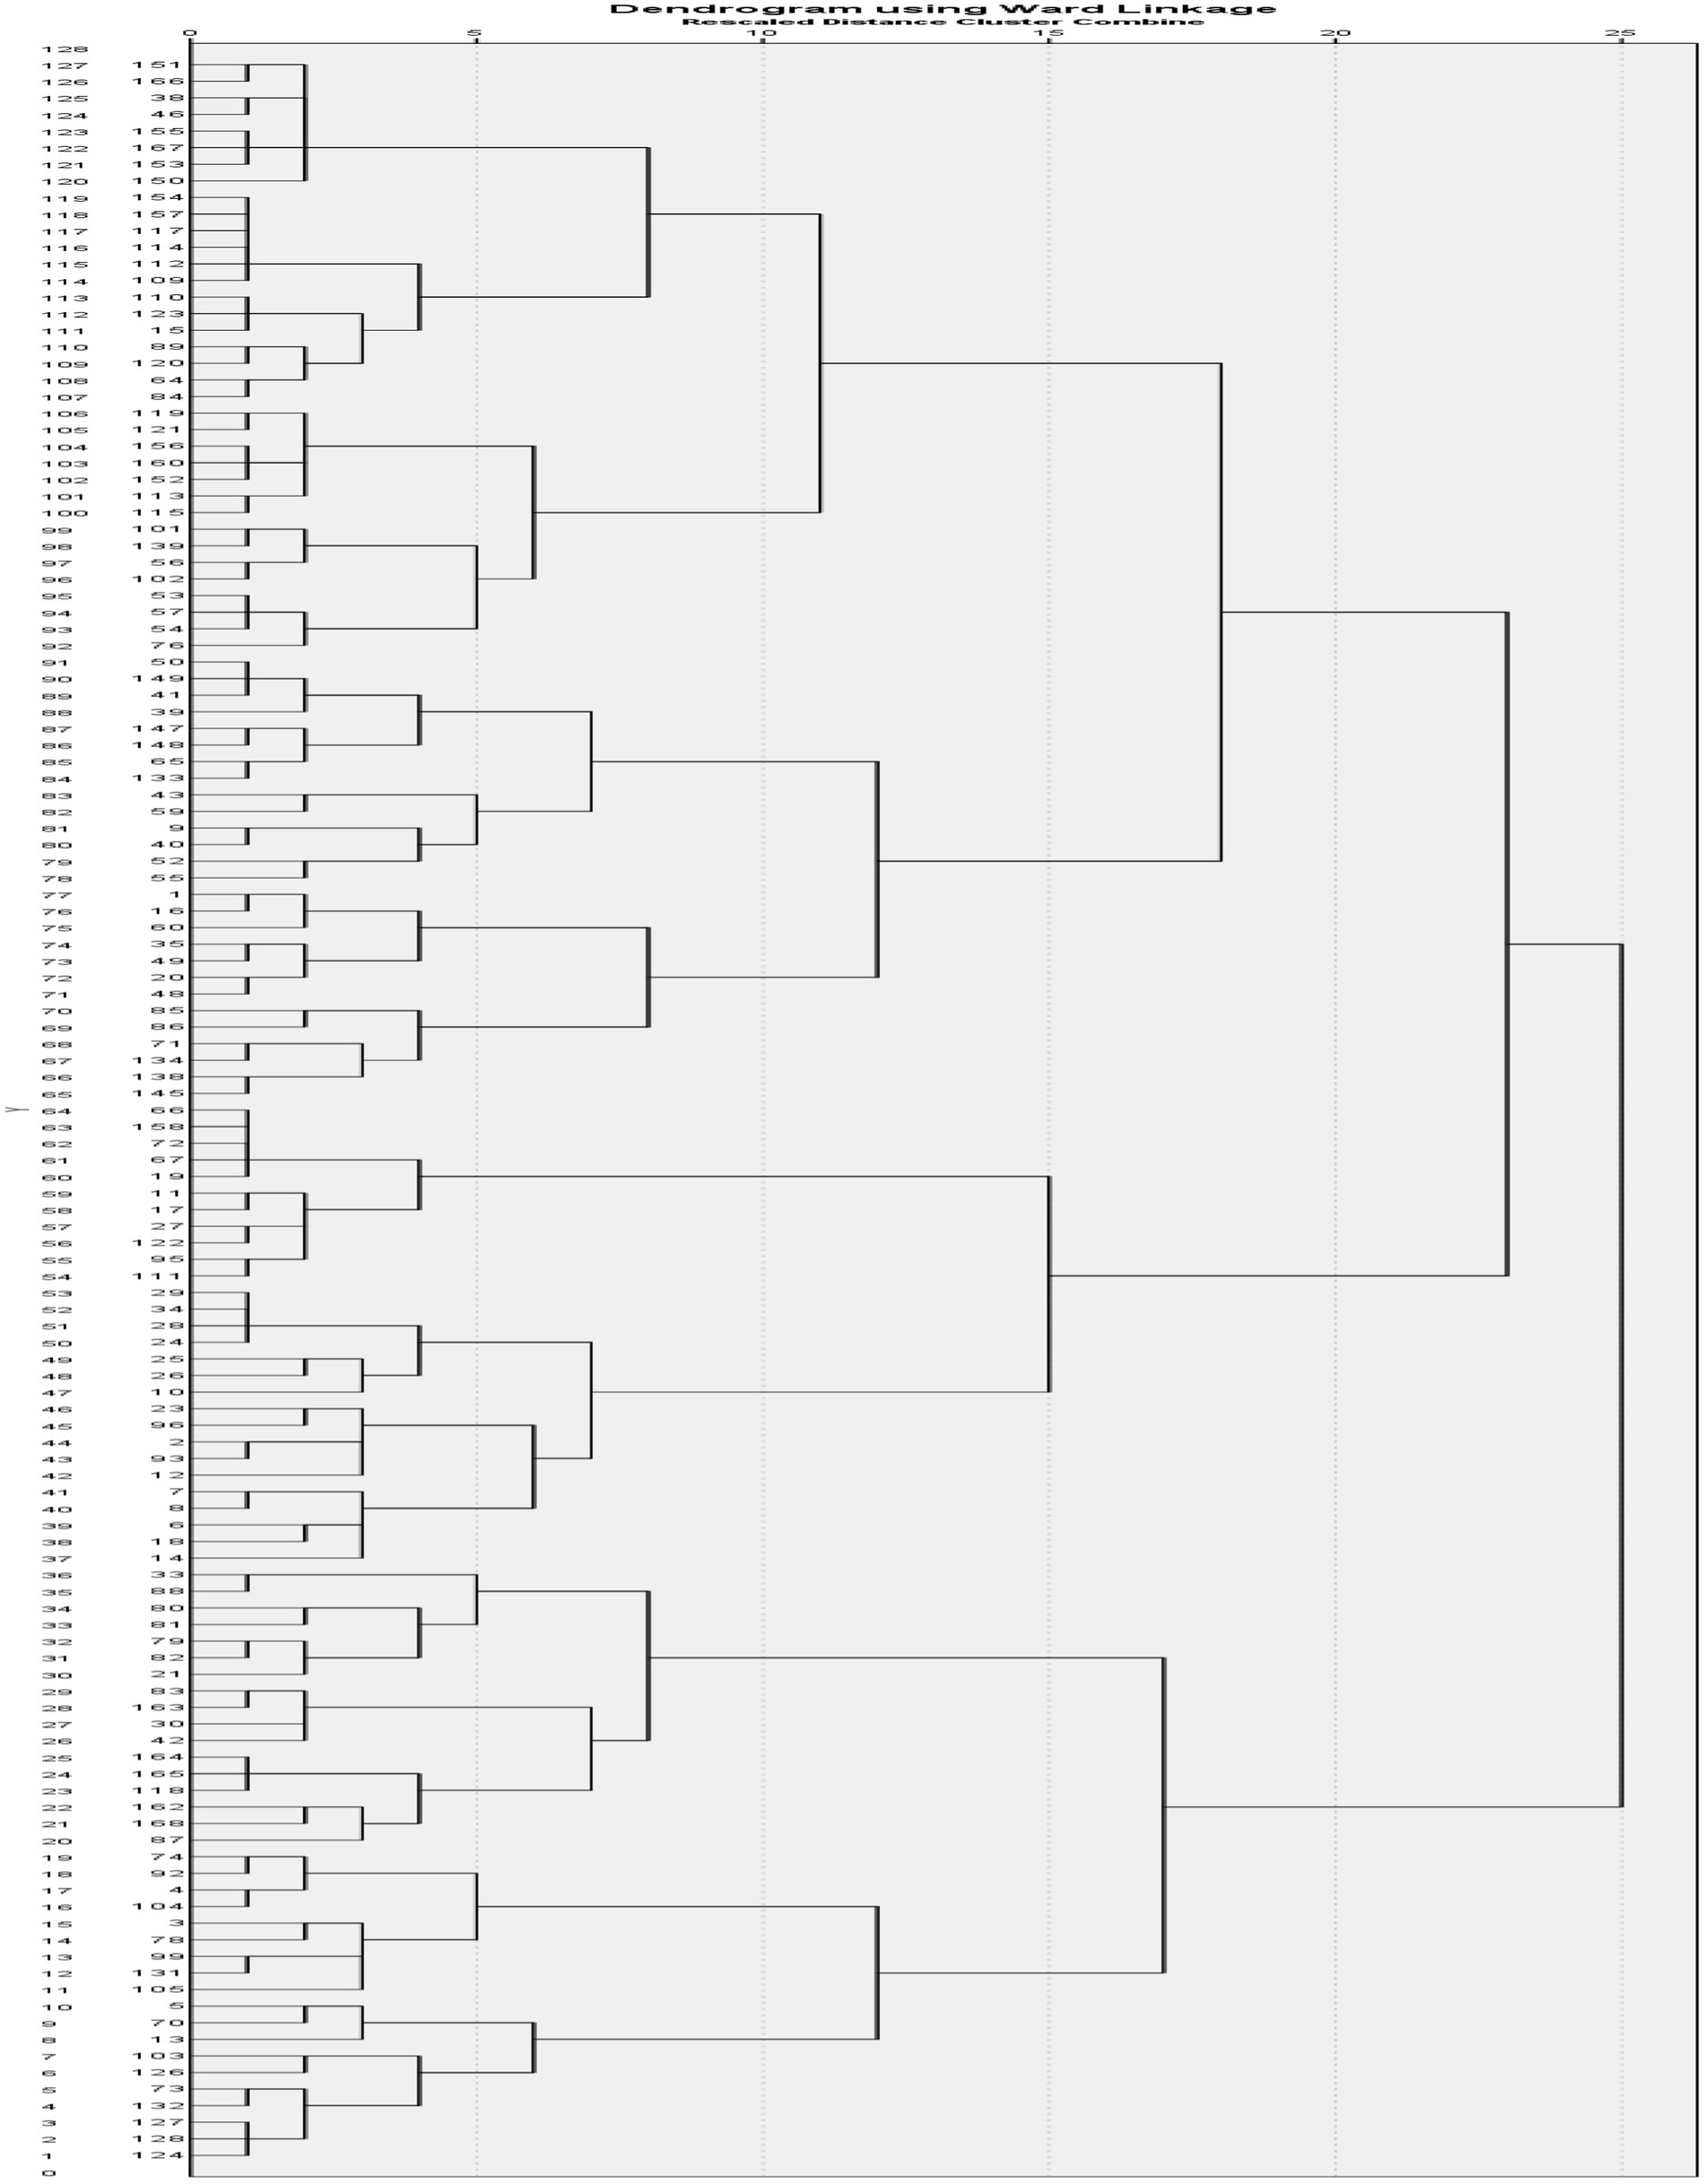
Figure A1. Dendrogram.
Keywords: principal component analysis (PCA), confirmatory factor analysis (CFA), hierarchical cluster analysis, K-means cluster analysis, school quality (input), GEQIP, Ethiopia
Citation: Eryilmaz N (2024) Measuring the effective implementation of the GEQIP reform at school level in Ethiopia. Front. Educ. 9:1353554. doi: 10.3389/feduc.2024.1353554
Edited by:
Mehmet Ali Kandemir, Balıkesir University, TürkiyeReviewed by:
Mehmet Akif Erdener, Balıkesir University, TürkiyeIlyas Karadeniz, Siirt University, Türkiye
Copyright © 2024 Eryilmaz. This is an open-access article distributed under the terms of the Creative Commons Attribution License (CC BY). The use, distribution or reproduction in other forums is permitted, provided the original author(s) and the copyright owner(s) are credited and that the original publication in this journal is cited, in accordance with accepted academic practice. No use, distribution or reproduction is permitted which does not comply with these terms.
*Correspondence: Nurullah Eryilmaz, bmUzMzFAYmF0aC5hYy51aw==