 Qiong Wu1,2*
 Mohamad Termizi Borhan1,3
- 1Department of Education, Faculty of Social Science and Liberal Arts, UCSI University, Kuala Lumpur, Malaysia
- 2Department of Education, Faculty of Marxism, Henan Polytechnic Institute, Nanyang City, Henan, China
- 3Department of Biology, Faculty of Science and Mathematics, Sultan Idris Education University, Tanjong Malim, Perak, Malaysia
The purpose of this study is to undertake a comparative study of higher education indices in China and between the 31 administrative divisions of China with the international evaluation system. The analysis includes a comparison of higher education indices between China and six continents and several key countries in the world, as well as a comparison between internal regions in China and Malaysia, both of which are in Asia. The numbers and rankings of higher education institutes (HEIs) of various countries and regions listed in the QS World University Rankings (QS) over 13 years from 2010 to 2023 form the basis of corresponding higher education indices obtained through several calculation formulas. These indices are the QS Higher Education Density Index (QSHEDI), QS Higher Education Quality Index (QSHEQI), QS Higher Education Composite Index (QSHEI), and Relative QS Higher Education Composite Index (RQSHEI), and they reflect the index calculation results of the density, quality, and composite of higher education relative to the regional population. Based on the comparative analysis of the indices from multiple perspectives, this study found that there is a large gap between higher education in China and other countries, and there is also a significant imbalance in the geographical distribution of higher education resources among Chinese provinces based on the population proportion and economic impact. These disparities will hurt the sustainable development of higher education in China. Therefore, paying more attention to the international evaluation system and recognition standards like the QS Rankings becomes necessary to guide the balanced development of higher education among provinces according to the population proportion. It is also vital to improve the international influence of HEIs in China according to internationally recognized requirements so that China's higher education can develop sustainably in the process of global internationalization.
1 Introduction
Due to the current trend of internationalization and digitalization, higher education institutions (HEIs) in various countries are paying more attention to their international rankings, as these offer international recognition and attract international students. Based on the research environment and research materials and data obtained, this study makes a detailed regional comparative analysis of the 16 states in Malaysia and 31 provinces in China with regard to the status of higher education resources in the two countries in the international evaluation system. The purpose was to accurately locate the development level of higher education in different regions in China and the world to tackle the problem of sustainable development in Chinese higher education in the process of internationalization.
The number of Chinese students studying in Malaysia has increased in recent years especially in 2020–2022 during the COVID-19 period. According to the Q2 study abroad data released by EMGS Malaysia in 2022 [Education Malaysia Global Services (EMGS), 2022], 3,949 Chinese students traveled to Malaysia to study—with 1,298 more students than in 2021; the data revealed an increase of 49%. The Chinese students traveled and applied to study in Malaysia during Q2 as the report shows accounted for more than half (57.78%) of the total number of 6,835 students in the same period who traveled to study there in the several months the key to Malaysia attracting Chinese students is that many Malaysian HEIs have high QS rankings, and the overall quality of teaching is more recognized by the international community. QS rankings sometimes even exceed other factors, such as the cost of study, distance, and culture. Consequently, they have become the most important indicator for Chinese students to select HEIs due to the Chinese policy of settling highly qualified returnees in places such as Shanghai (Shanghai Municipal Human Resources and Social Security Bureau, 2020). The QS rankings have a high degree of recognition, and the rankings for China, Malaysia, and the world are publicly accessible. The QS World University Ranking is an annual ranking of world HEIs published by Quacquarelli Symonds (QS), a company that has been independently publishing the university rankings since 2010. The rankings are updated by the QS Global Education Group every summer. The QS World University Rankings are based on the criteria of academic reputation, employer reputation, faculty-student ratio, research citations, and internationalization. Known for its open and transparent questionnaire format, the QS World University Rankings are among the most highly regarded university rankings in the world (China People's Daily Online, 2022). In addition to the different percentages of each indicator in different years, the QS World University Rankings are categorized by continent, country or region, and subject. The QS rankings provided a critical research basis and source for indicators for this study.
In the QS rankings published in June 2023 (Quacquarelli Symonds, 2023), there were 71 and 28 HEIs from China and Malaysia, respectively; China and Malaysia are roughly estimated to have 1,412 million and 33.4 million inhabitants in 2023. The published 2022 GDP per capita for both countries is approximately USD 10,000, according to UN reports (United Nations, 2022) and China Economic Information Data (CEIdata, 2023). Compared to the USD 30,000 GDP per capita of Japan and South Korea, the development of higher education (HE) in China and Malaysia is outstanding, and both are located in Asia. Therefore, a further comparison of the differences in higher education indices between China and Malaysia is more persuasive and informative because of the similar GDP per capita. Furthermore, China has 0.05 QS-listed HEIs per million population, while Malaysia has about 0.84—a difference of nearly 16 times. As a result, we were interested in the changes in the number of HEIs listed and ranked over the past decade. To provide a more detailed and precise understanding of the changes in the number and quality of HEIs between China and Malaysia and within the two countries' internal regions between 2010 and 2023 based on the QS rankings, we employed the currently more widely recognized density index and quality index, along with certain extensions and innovations, to ensure a more relevant study for the future.
Specifically, all institutions included in the QS World University Rankings were aggregated according to the 31 provinces of China and the 16 states of Malaysia and weighted accordingly. The resulting Higher Education Density Index based on QS rankings (QSHEDI) can be interpreted as an indicator of the density calculated from HEI numbers on the QS list per million population in each province. The Higher Education Quality Index (QSHEQI) can be construed as an indicator of the quality calculated from HEIs rankings on the QS list per million population in each province. Similarly, the Composite Index of QSHEDI and QSHEQI (QSHEI) and the Relative Composite Index (RQSHEI) were taken for Beijing. This approach follows a large body of literature suggesting that higher education should be analyzed in terms of quantity and quality (Zhong, 2011; Benos and Zotou, 2014).
In this study, we collected numbers and rankings from the QS World University Rankings. We used several formulas to get the indices of HEIs by QSHEDI, QSHEQI, QSHEI, and RQSHEI based on the population in each continent and key countries and regions in the world. We specifically examined the change in the number and rankings of HEIs in QS rankings in each administrative division in China and Malaysia between 2010 and 2023. Based on the changes in density indexes (DI) and the Quality Index (QI) from QS-listed HEIs worldwide, we analyzed how Chinese HEIs are positioned in the world compared to Malaysia and other countries and how vast the gap was between them. The comparison aimed to provide insights into the international recognition of Chinese HEIs and the possible future path for Chinese HEIs toward sustainable development in the internationalization process (Kuzmina and Lofthouse, 2023). Based on the importance of these indices, the research question was: what is the current internationally recognized development level of Chinese HEIs in the world and among the 31 provinces in China? The research objective was to compare the internationally recognized development level of HEIs between China and other countries, especially Malaysia. The comparison was made by analyzing the QSHEDI, QSHEQI, and the development level difference of HEIs among the 31 provinces in China during the period 2010–2023. The indices used for comparison were QSHEDI, QSHEQI, QSHEI, and RQSHEI. Consequently, the differences in internationally recognized development levels between Chinese HEIs and other countries and the differences among provinces in China were obtained. This provided a way to identify the challenges in the sustainable development of Chinese higher education during the internationalization process.
2 Literature review
The significant proliferation of HEIs in China commenced in 1999, resulting in a surge from 1,034 to 2,740 HEIs by 2020. This remarkable growth rate presents a formidable challenge in terms of enrollment (Knight et al., 2017). However, despite this rapid expansion, the acceptance rate for the college entrance examination in 2020 stood at 90.33%, which is still insufficient to meet the current demand. Furthermore, supply and demand differ significantly across regions and provinces, resulting in significant disparity. The coastal areas of China have made substantial investments in HEIs, giving these regions an advantage in the distribution of higher education resources. In contrast, higher education access and enrollment rates are lower in inland regions as a result of the skewed allocation of resources. The central government of China, acknowledging the drawbacks of decentralization, has prioritized the establishment of policies that promote educational equality. This is particularly crucial in economically disadvantaged regions where access to education is a priority (Xiang et al., 2020).
Admission to HEIs is through the National Higher Education Entrance Examination, commonly known as Gaokao. The acceptance rate of Gaokao is very high, indicating a shortage of higher education opportunities (Wu et al., 2020). The dramatic increase in the acceptance rate of Gaokao has been attributed to the expansion of higher education in China. In 1990, the acceptance rate was just 21.55%, but by 2020, it had increased to 90.33% and continues to rise. China's large population and uneven growth across regions have resulted in a severe deficit of higher education relative to the demand. Not all provinces have benefited equally from the educational development initiatives. The initial reform of the education system, which involved transferring fiscal and administrative control to local authorities, resulted in an uneven distribution of educational resources (Zhang et al., 2020), leading to regional disparities in education and unequal access to educational opportunities (Li et al., 2014; Wu and Zhu, 2020; Xiang et al., 2020). As evidenced by the 2020–2021 reports published by the Ministry of Education of the People's Republic of China (Ministry of Education, 2020a,b, 2021a,b)the remarkable expansion of Chinese higher education from 1034 HEIs in 1999 to 2740 HEIs with a 1.65 times increase and a 90.33% insufficient Gaokao acceptance rates in 2020 (Mendoza et al., 2021), which is primarily driven by the central and provincial governments of China, who have played a crucial role in accomplishing this result.
In the years following 1978, China experienced significant economic growth, leading to a successful transition from a middle-income country to a high-income country. The “Modernization Plan 2035” aims to raise China's human capital level to that of industrialized nations. As a result of technological advancement and innovation, financial liberalization, educational development, income inequality, and political and structural adjustment, some factors have been extensively studied (Fu et al., 2016; Liu et al., 2017; Chen et al., 2020), and China needs to avoid the middle-income trap during this critical period to achieve sustainable development (for additional information on the particular factors, please see Zeng and Fang, 2014; Li et al., 2017; Liu et al., 2017; McKinney, 2018; Shambaugh, 2018; Wang et al., 2018). These studies have demonstrated the importance of educational progress both for economic growth and social sustainability. A lack of access to quality education is associated with sluggish economic growth (Kosack and Tobin, 2015). Unfortunately, China's impressive progress has led to increasing disparities in higher education resources and international recognition of HEIs across provinces compared to Malaysia and other countries (Valerio Mendoza, 2018). Domestically and internationally, questions have been raised on whether China, a highly populated nation, can achieve sufficient levels of education and human capital across the country to meet its increasing demand for skills (Khor et al., 2016; Fraumeni et al., 2019; Zhang et al., 2019; Valerio Mendoza et al., 2022). According to the international community and authoritative rankings, the process of internationalization, ChatGPT (artificial intelligence), and the rankings of global universities have brought challenges as well as opportunities to European countries, the United States, Turkey, and other developed and developing countries in the world (de Wit and Deca, 2020; George Mwangi and Yao, 2020; Xie et al., 2021; Bulut-Sahin and Kondakci, 2023). China's allocation of higher education resources, both balanced developments overall and internally, is a significant factor that constrains its future growth. Many scholars have used higher education indices to compare the differences between different regions to find answers for some of the emerging challenges (Mendoza et al., 2021; Sharma, 2023). Applying the higher education index innovatively to analyze the mean, SD, and correlation with the economy, population, and other indices, in addition to comparing China with other countries and regions based on other similar research, can offer opportunities to serve as important references for formulating higher education policies (Sekhri, 2020; Wu and Li, 2021). It would also be helpful for establishing strategic goals for better sustainable educational concepts and culture, better higher education leadership, and management in the internationalization process of HEIs in China (Hamidifar et al., 2023; de Wit, 2024). Chinese HEIs should pay more attention to their world rankings and do the right things to get more international students and better international influence. This will help them to adapt better to environmental changes, such as the continuous population change, the development of cutting-edge technology, and the restructuring of the economy (Wei and Johnstone, 2020; Chyrva et al., 2023). These issues form a part of this study's research topic.
To give a clear idea of this research, it is important to establish a research framework. China has the second-largest population in the world. The sustainable development of Chinese HEIs requires both quantity and quality, with a focus on human-balanced development on a population basis. The internationally recognized indices of quantity and quality of HEIs can be obtained through several formulas, including the numbers and rankings of HEIs from China and other countries available in QS rankings. Using the different population figures of countries such as China, Malaysia, and others as the basis of calculation, all the indices can be obtained according to world population distribution. Similarly, according to the population distribution in 16 Malaysian states and 31 Chinese provinces, the index for China and Malaysia and for the 31 Chinese provinces can also be obtained.
Firstly, the internationally recognized development level of Chinese HEIs based on world population distribution can be obtained by comparing the indices between different countries from six continents. Secondly, because both China and Malaysia are located on the same continent and share a certain degree of similarity, by comparing the indices between the 16 Malaysian states and 31 Chinese provinces for the period 2010–2023, the changes in Malaysian and Chinese HEIs in the internationally recognized development level based on their respective domestic regional population distribution can be established. This gives an object of reference to determine significant differences and similarities in the internationally recognized development level of Chinese HEIs in different provinces compared with Malaysian states. Thirdly, by comparing the indices of the 31 provinces in China during 2010–2023, the changes in the Chinese HEIs in the internationally recognized development level over the past decade based on provincial population distribution can be obtained. This is not only the focus of this study but also the focus of the analysis of the indices. It gives an object of reference to find whether there is a significant difference in the internationally recognized development level of HEIs among different provinces in China based on not only the provincial population distribution but also the geographical distribution and economic impact. This also helps establish whether there is a significant difference in the internationally recognized development level of HEIs in each province over the past decade and if there is a significant difference compared to Beijing, the capital of China, which has the highest internationally recognized development level of HEIs among 31 provinces in China.
This framework can give a clear idea about how to find the answers to determine whether there is a significant difference in the internationally recognized development level of Chinese HEIs globally and among the 31 provinces in China. This provides a comprehensive understanding of the issues involved in solving the problems of China's sustainable and balanced development of higher education in the process of internationalization.
3 Materials and methods
3.1 Data sources
By calculating the HEI density index in terms of the ratio per million population, the relative density of HEIs provided a meaningful measure (Borsi et al., 2022). In this study, we innovatively calculated the number and rankings of HEIs listed in the QS World University Rankings to intuitively reflect and compare the distribution of density and quality levels of HEIs between countries, even between continents, and within the country. Using the density distribution and quality level within the country, the changes and differences in density indexes and quality indexes can be compared horizontally and vertically. In addition, China and other countries such as Malaysia, the United Kingdom, the United States, Australia, Japan, and South Korea can be compared more comprehensively using the different country data in the QS list to understand the position of China in the global higher education field. Based on the World University Rankings, it is easier to understand the differences between Chinese provinces and other countries regarding the density distribution of Chinese HEIs and their quality development.
It is also possible to assess the international position of the distribution density of HEIs relative to population size and the quality of HEIs between China and Malaysia by comparing the density and quality indices of HEIs according to the QS rankings. The Department of Statistics Malaysia provides information on the Malaysian population by state (Department Of Statistics Malaysia (DOSM), 2023), and the Chinese population by province can be obtained from the China National Bureau of Statistics (CNBS, 2023). These statistics can help establish whether there are significant differences between the states and provinces and whether such differences are also reflected in the distribution of HEIS in internal regions, offering insights into the sustainable development of higher education in China.
3.2 Research methods
The corresponding index can be obtained from each country and continent by counting the number and rankings of HEIs in the QS World University Rankings (QS) from 2010 to 2023, using the higher education density index QSHEDI, quality index QSHEQI as well as the composite index QSHEI and relative composite index RQSHEI, calculated based on the QS rankings with a population of per million people, and applying the formula to produce the numerical value. Through comparative analysis, it is possible to determine the differences between China and Malaysia, as well as between other key countries and continents. It is easier to compare the differences between the provinces in China and the states in Malaysia using index statistics and the imbalances and differences among the provinces in China.
Since the QS list is the most exhaustive ranking order, it ranked all HEIs every year but only scored part of these HEIs. For example, in the QS rankings for 2023–2024 published in June 2023, no specific scores were given to any of the HEIs on the list beyond the 600th place, which means that more than half of the 1,498 HEIs on the list cannot be measured in terms of their scores. Nevertheless, all HEIs on the list are ranked. Therefore, for the characteristics of the QS example, it is better to use the rankings for the direct quality indicator calculation to ensure that enough listed HEIs can be included in the data analysis work of the study. On the one hand, the intuitive method of calculation and comparison based on rankings is easier to use. On the other hand, it is more understandable and easier to accept. Where the ranking is a closed interval, the median is uniformly adopted as the calculation standard. For example, for the HEIs listed in the 701–750 range of the QS ranking in 2019, 725 was adopted uniformly as their rank in the calculation. For open intervals, such as those in the 701+ range of the QS rankings in 2015, 701 was used uniformly as the rankings in the calculation. For any province i and period t, the value of above 1 indicates a high proportion of HEIs in terms of density, whereas the value below 1 indicates a low ratio of HEIs relative to the proportion of the population in the province.
Based on the QS World University Rankings, the concept of higher education density index (QSHEDI) means QS Higher Education Density Index, which is calculated by the formula:
QSHEDI formula: This formula compares the number of district HEIs between China and Malaysia or other countries based on population distribution from QS rankings.
When calculating the details for the same year in China and Malaysia within the region, n represents the number of regional HEIs on the QS list, N represents the number of national HEIs on the QS list, p represents the regional population, and P represents the total population. For example, suppose QSHEDI is calculated for the Beijing region. In that case, n represents the number of HEIs listed in the QS of Beijing, N represents the total number of HEIs listed in the QS of China in the same period, p represents the population of the Beijing region, and P represents the total population of China. If the QSHEDI is calculated for a country or continent, such as for China, Malaysia, or other countries or continents, n represents the total number of listed HEIs in QS of the country or continent, and N represents the total number of HEIs listed in QS of the world; p represents the number of people in the country or continent, and P represents the total population of the world for the same period. Similar to the density index, for any province i and period t, the value of above 1 indicates an overall high level of quality of HEIs, while below 1 shows an overall low level of quality relative to the proportion of the population.
Based on QS rankings, the concept of higher education quality indicator (QSHEQI) means QS Higher Education Quality Index, which is calculated as:
To calculate the country's quality, especially of the rankings of HEIs for China, Malaysia, and other countries as QSHEQI, the following formula is used:
Similarly, when using the QSHEQI to calculate the EQI of a region within a country in the same year, r1 represents the specific rank of each university in the region, r2 represents the rank of each university within the country, R represents the total rank of the HEIs in the QS list in the world, p represents the population of the region, and P represents the total population of the country. For example, when calculating the EQI of HEIs in Beijing, r1 represents the rankings of HEIs in Beijing, r2 represents the rankings of HEIs in China in the same year, and R represents the total ranking of HEIs in the same year; p represents the population of Beijing, and P represents the population of China in the same period. When calculating for countries such as China, Malaysia, or continents, r2 represents the ranking of each listed university in the country such as China, Malaysia, or all the countries in the continent counted. Likewise, R represents the total rankings of listed HEIs of the world in the same period, p represents the population of the country or continent, and P represents the population of the whole world in the same period.
There are subtle differences in the rankings of HEIs depending on the QS in different years, such as using 1,001 instead of 1,001 + and 900 instead of 800–1,000 for the calculation. In using the two formulas, attention must be paid to this kind of ranking.
Through this final simplified formula, the Higher Education Composite Index can be obtained. Based on the QS ranking of the concept of higher education composite index (QSHEI), the calculation formula is:
The Relative QS Higher Education Composite Index (RQSHEI) is compiled using the Beijing-based Relative Concept of Higher Education Composite Indicator (QSHEI), which ranges from 0 to 1 and is calculated using the following formula:
4 Experiments and results
4.1 Comparison of indices for China and six continents and major countries
Comparing the QSHEDI and QSHEQI of six continents and seven key countries, as shown in Figure 1, can help better understand China's position in the world's higher education.
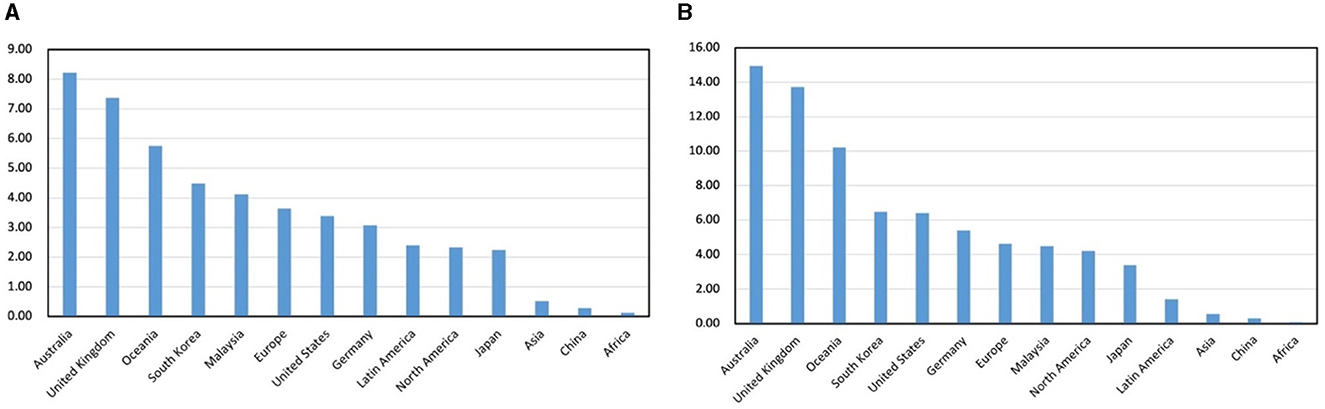
Figure 1. Line chart of 2010–2023 QSHEDI and QSHEQI among 6 continents and 7 key countries. (A) 2022–2023 QSHEDI; (B) 2022–2023 QSHEQI.
Because comparing the density and quality of HEIs in China and Malaysia does not fully reflect the strength of these two countries in the world and overall level, according to the classification of continents for the world in 2022, the formula mentioned above is used. To obtain the calculation of the QSHEDI and QSHEQI of higher education for each continent and select countries (Figure 1), the data can be sourced from the HEIs in the QS. It is evident that despite China and Malaysia belonging to the same continent, their levels of higher education resources are quite different. Malaysia's scores are higher than Japan's but lower than South Korea's and much higher than Asia's; China's is even lower than Asia's.
The world has rich tertiary education resources, as reflected in the number and quality of QS-ranked tertiary institutions per million population, with the United Kingdom, the United States, and Australia, as well as Japan and South Korea in Asia, leading the way. The calculation for obtaining density and quality indexes of higher education in each continent and select countries uses the formula mentioned earlier for the 2022 world classification by continent. The QS ranking can be used to evaluate China's higher education position by comparing it with the rest of the world.
According to the United Nations 2022 World Population Prospects Report (United Nations, 2022), World Development Indicators 2022 (World Bank, 2023), and CEIdata (CEIdata, 2023), the Asian population is 4.743 billion, accounting for ~59.25% of the world's total population. Comparatively, Africa has a population of 1.464 billion (18.29% of the world's population), Europe 746 million (9.32%), North America 560 million (7%), South America 446 million (5.57%), and Oceania 45 million (0.56%). Antarctica is not counted as it has no settled inhabitants and no HEIs.
The 2022–2023 QS World University Rankings released in 2022 (QS, 2022) included 32 HEIs from Africa, 439 from Asia, 483 from Europe, 190 from South America, 232 from North America, and 46 from Oceania. Through the density index and quality index statistics of each continent, it can be seen that Asia and Africa occupy the majority of the world's population, i.e., 77.55%; however, only 439 HEIs are listed from Asia, and 32 from Africa, accounting for 30.87 and 2.25%, respectively, of the total number of HEIs listed in the world. On the other hand, Europe and North America together account for just 16.32% of the world's population, yet their HEIs account for 33.97 and 16.32%, respectively, of the total HEIs listed. A comparison of the development of higher education in Europe and North America with Asia and Africa forms a sharp contrast. It can be seen that China and Malaysia, despite being located on the same continent, still have a significant gap in the development of higher education and the distribution of higher education resources according to the population compared to developed countries such as the US and the UK.
When combined with the annual report of National GDP per capita in 2022 published by the United Nations, World Bank, and CEIdata, there is a significant economic gap between China and Malaysia compared to Australia's USD 65,000, Germany's USD 48,000, the United States' USD 76,000, and South Korea's USD 32,000. Despite China and Malaysia having a per capita GDP of USD 12,000, their tertiary education density and quality indices are far apart, not to mention the cultural and historical differences. Globally, higher HE resources, such as those in the US in North America, the UK and Germany in Europe, Australia in Oceania, as well as Japan and South Korea in Asia, reflect the number and quality of HEIs based on the QS rankings per million population. The gap in the comparison between China and Malaysia is quite considerable. The more representative of these are Australia, the UK, and the US, with higher values of 8.2288, 7.3809, and 3.3928, respectively, for QSHEDI and 14.9449, 13.7256, 6.4053 for QSHEQI. Leaving aside the cultural and historical factors, from the data, it is evident that Malaysia, with a quality index of 4.4853, is much higher than the Asian quality index of 0.554, while China is 0.3131, even lower than Asia, with a huge gap. In comparison, Asia accounts for about 60% of the world's total population. Even so, it only has a million people with a 0.5210 density index of HEIs, whereas Malaysia has a 4.1291 density index for the same period, and China has a 0.2829 density index, which is also lower than Asia. This shows that there is a greater difference between the two countries. Therefore, even from an economic point of view, justifying the difference in the development of higher education does not seem very convincing.
4.2 Comparison of China and Malaysia country indices
To better analyze the reality of the development of higher education in various regions within China and the current gap with other countries, it is more persuasive to examine the density index and quality index of higher education based on the administrative divisions of China and Malaysia. The QS World University Rankings data, based on the population of China and Malaysia, can be used to calculate the density index and quality index of higher education development for the two countries between 2010 and 2023, as shown in Figure 2.
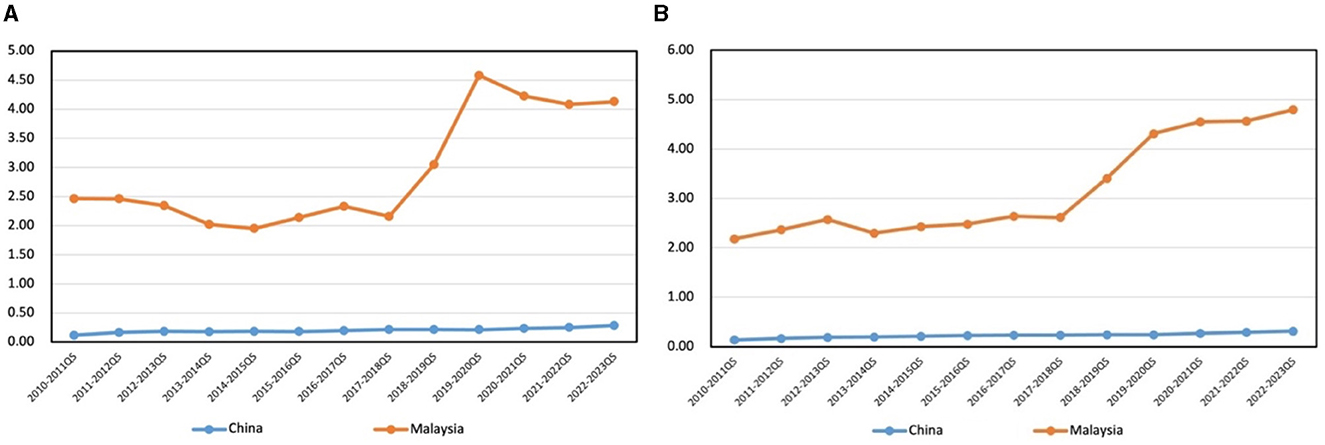
Figure 2. Line chart of 2010–2023 QSHEDI and QSHEQI between China and Malaysia. (A) 2010–2023 QSHEDI; (B) 2010–2023 QSHEQI.
Using the linear charts in Figure 2, it is more easily apparent to see the differences and changes in the higher education density index and quality index between China and Malaysia over the past 13 years.
As shown by the chart and the index statistical database, China's number of HEIs on the QS list increased by 6.1 times from 10 to 71 in the 2010–2023 period. During the same period, the population increased by 17.1%, and the QSHEDI soared from 0.0157 to 0.2831, an increase of 144.7% points, or more than 13 years above the average density index of 0.2011. In Malaysia, the number of QS World University Rankings on the list rose from 5 to 24, up 3.8 times. During the same period, the population grew 15.5% points, and the QSHEDI rose from 2.4629 to 4.1291, up 67.65%. For more than 13 years, the average density index of 2.9179, compared to China's average density index, is 13.51 times higher. This figure shows that over the past 13 years, the number of HEIs listed on the list has increased significantly in China and Malaysia, and the Malaysian QSHEDI decreased during 2017–2018, then rapidly and significantly increased to a maximum value of 4.5823 during 2019–2020, then declined gently and slightly increased in 2022–2023. During the same period, the Chinese QSHEDI has consistently increased between 0.1 and 0.3 compared to Malaysia. According to the country's population enhancement rate, density index, and number of HEIs on the list, China's HEIs improve faster. However, the gap between Chinese and Malaysian QSHEDI is considerable and tends to get wider.
During 2010–2022, the rankings of Chinese and Malaysian HEIs on the QS list rose faster, especially in Malaysia. There was rapid growth in the quality index of higher education between 2017 and 2020, but the trend has since slowed down. During 2010–2023, the QSHEQI of Malaysia rose from 2.0490 to 4.4853; the average for this period is 2.9466, an increase of 118.9%. In China, the QSHEQI rose from 0.1323 to 0.3133, with an average of 0.2237, an increase of 136.8% points. It can be seen that the overall indicators of the quality of HEIs in China and Malaysia based on changes in population size have shown an upward trend. Figure 2 shows that Malaysia's QSHEQI has risen more rapidly than China's during the same period and that the gap between Chinese and Malaysian HEIs has also increased.
Therefore, upon examining the QS ranking of HEIs based on the population and quality of the population base, it can be observed that higher education in these two countries has a significant gap based on the population size, density, and distribution of HEIs in the two countries. This gap is currently widening in the development process of the two countries' HEIs—this gap not only exists between the two countries but may also be more evident in the regional development process within each country.
4.3 Comparison of country sub-regional indices for China and Malaysia
By comparing and analyzing the density index and quality index of the internal regions according to the administrative divisions of the two countries, the QSHEDI of China and Malaysia for 2010–2023 is shown in Table 1 and QSHEQI in Table 2, with the differences in the development of higher education between the two countries in a more detailed and intuitive manner, and thus can be more targeted to carry out the work of construction of the sustainability of higher education development in China.
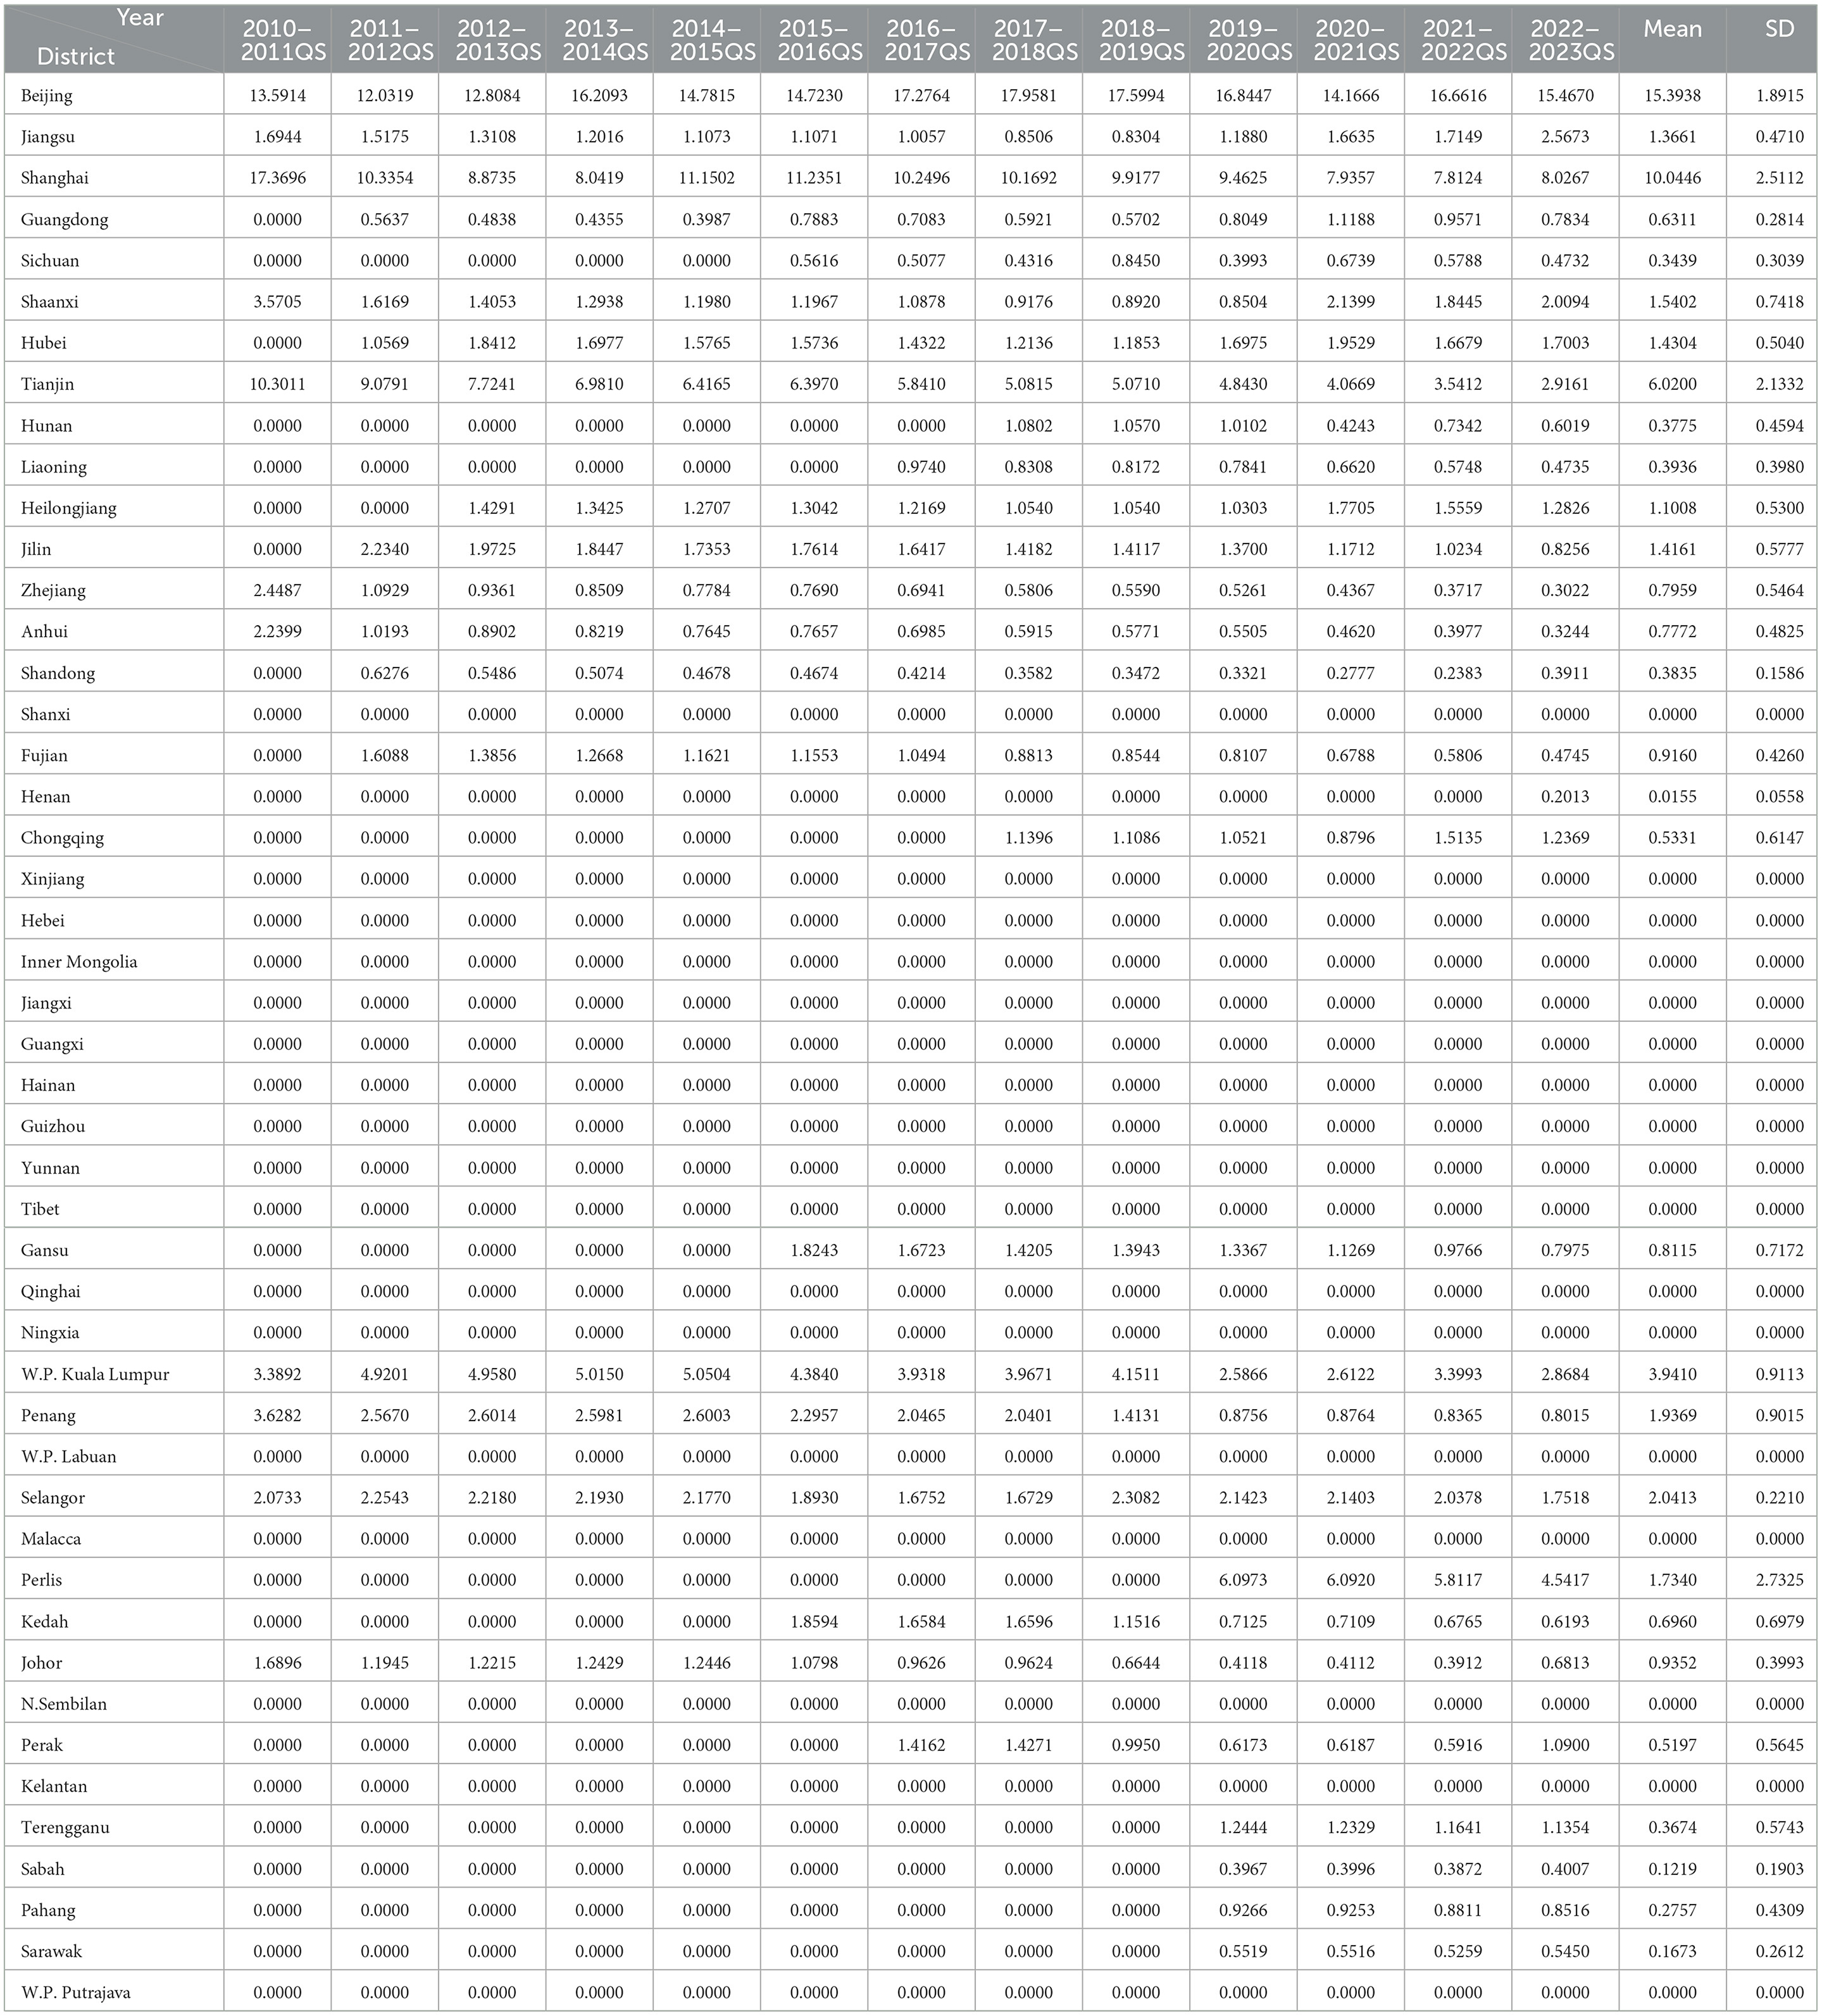
Table 1. Mean and SD of QSHEDI per province or state in 2010–2023.
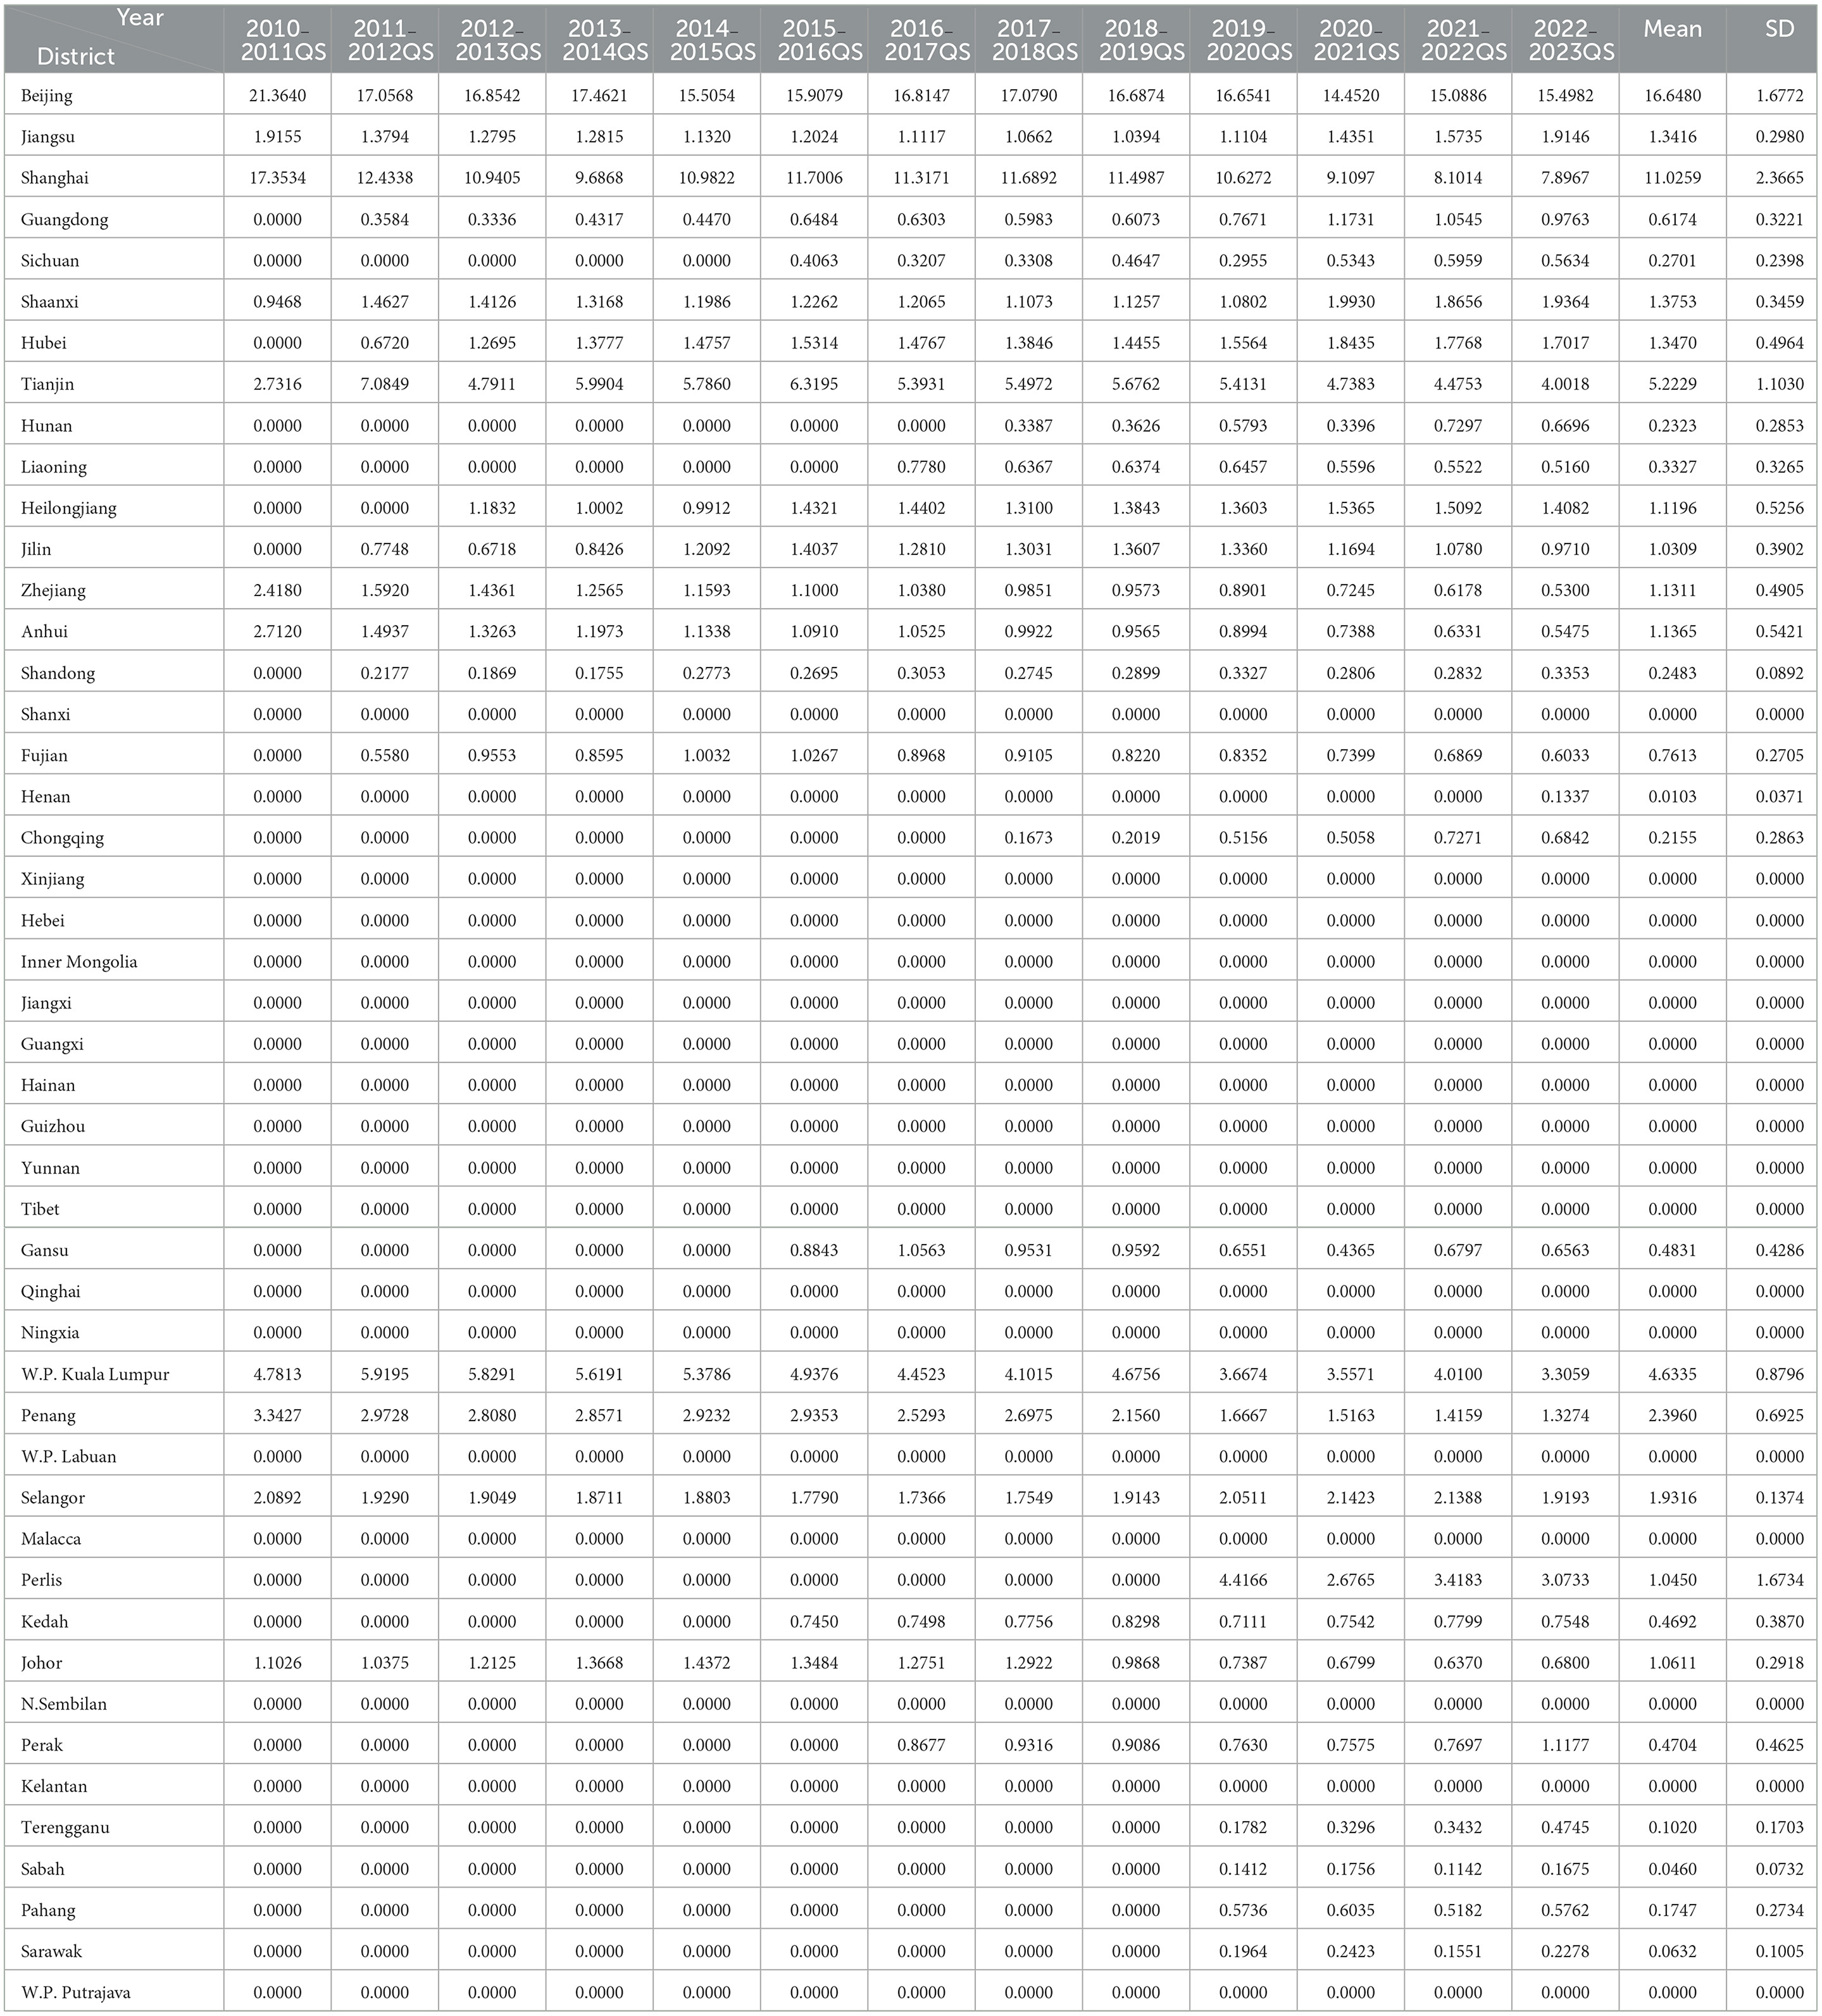
Table 2. Mean and SD of QSHEQI per province or state in 2010–2023.
Tables 1, 2 show how the density of each administrative division in China and Malaysia changes within the index value changes. The most prominent finding is that 12 out of 31 provinces in China did not have even one of their HEIs included in QS between 2010 and 2023, representing 38.71% with a QSHEDI of 0. In Malaysia, on the other hand, five out of 16 states had a QSHEDI of 0, accounting for 31.25% of the total. This finding indicates that the two countries are similar in terms of the overall proportion of administrative divisions with no HEIs listed in the QS. It is also worth noting that both Gansu and Sichuan provinces in China saw their first QS-listed HEI in 2015, Liaoning in 2016, Hunan and Chongqing in 2017 to achieve a breakthrough of 0 in the QSHEDI, and Henan in 2022. In contrast, in Malaysia, Kedah saw its first QS-listed HEI in 2015 and Perak in 2016, and Terengganu, Sabah, Pahang, Sarawak, and Perlis in 2019 to achieve a breakthrough in their QSHEDI of 0. As can be observed, higher education development in the two countries has been both faster and more evident in recent years, which also coincides with the highest value for Malaysia's national QSHEDI in 2019.
According to Table 1, in the density index of 31 provinces in China from 2010 to 2023, Beijing has the highest mean value of QSHEDI at 15.3938 and an SD of 1.8915. The rest of the provinces are all higher than Shanghai except for 2010. Therefore, Beijing, as the capital city, has the most prominent advantage in the distribution of higher education resources, followed by an average value higher than 10 in Shanghai and an average value of 6.0200 in Tianjin. The rest of the provinces have an average value between 0 and 1.6, with 5 being higher than 1 and 11 being higher than 0 but <1. It is evident that the gap is enormous. During the same period, Malaysia's highest average value was also in the capital city, Kuala Lumpur, with 3.9410, followed by Selangor at 2.0413, Penang at 1.9369, and Perlis at 1.7340. The remaining seven states have an average value of QSHEDI between 0 and 1. It can be seen that there is a certain degree of variability. Compared to China, QSHEDI has less variability among the Malaysian states.
Based on a comparison of the SDs of the Malaysian states, the SD QSHEDI of Perlis is 2.7325, and that of other states ranges from 0 to 1, indicating that the overall change in QSHEDI is not significant; however, most of them have a declining density index. A more prominent trend is that Kuala Lumpur's density index decreased from 3.3892 in 2010–2011 and from 5.0504 in 2014–2015, and then continued to decline to 2.8684 in 2022–2023. That means the QSHEDI of Kuala Lumper which is the capital of Malaysia peaked in 2014–2015 with a 5.0504 and bottomed out in 2019–2020 with a 2.5866 and finally went to 2.8684, a decrease of 15.36% in 2010–2023, and a max decrease of 48.78% from 2014 to 2020. Similarly, Penang decreased from a QSHEDI of 3.6282 in 2010–2011 to 0.8015 in 2022–2023, a decrease of 77.91%. Similarly, Johor and Selangor decreased by 58.68 and 15.51%; the two states had their first HEI on the QS list only in 2016 and 2019, respectively, showing a downward trend. In 11 of the 16 states in Malaysia, the QDHEDI is not 0.
Nevertheless, compared 8 of 16 states experienced a final downtrend in Malaysia, at the same period, in the 31 provinces in China, Beijing had an SD QDHEDI of 1.8915, Shanghai 2.5112, and Tianjin 2.1332. The rest had SDs between 0 and 1, which indicates relative stability in the number of HEIs in these provinces. The QSHEDI of 19 provinces is not 0, but 12 of them show a downward trend in recent years. This declining trend indicates that compared with other administrative divisions, the development of higher education has slowed down relative to the population growth of these places in recent years. It can be seen that both China and Malaysia have a few administrative divisions with high-speed growth compared to the others. However, although there are obvious fluctuations in the growth of the density index in Malaysia, the overall national QSHEDI of both China and Malaysia still shows an upward trend for the period 2010–2023.
Table 2 shows the changes in QSHEQI value for China and Malaysia within each administrative division. When comparing the QSHEDI, it is evident that 12 provinces in China and five states in Malaysia did not have any HEI listed in the 2010–2023 period; therefore, both QSHEQI and QSHEDI failed to achieve a 0 breakthrough. In addition, the calculation of QSHEQI based on the QS ranking and population distribution of each administrative division in China and Malaysia for 2010–2023 revealed a similar pattern as that of the QSHEDI—Beijing, Shanghai, and Tianjin in China and Kuala Lumpur, Penang, and Selangor in Malaysia lead in both QSHEDI and QSHEQI of HEIs during 2010–2023. This also reflects the geographically concentrated distribution of high-quality higher education resources.
For the period 2010–2023, the mean QSHEQI of Beijing and Shanghai is 16.6480 and 11.0259, respectively, and the SD is 1.6772 and 2.3665, respectively. The QSHEQI of Beijing decreased by 27.46%, while that of Shanghai decreased by as much as 54.49% during the same period. In Malaysia, Perlis had the highest SD at 1.6734, and a QSHEQI of 30.41% during 2019–2023, and Kuala Lumpur had the highest mean value of 4.6335 and SD of 0.8796, with a QSHEQI of 30.86% from 2010 to 2023. Penang followed with a mean value of 2.3960 and SD at 0.6925. Its QSHEQI decreased by as much as 60.29% during the same period. Several administrative regions in China and Malaysia began with high QSHEQI values, but over time, they showed a decreasing trend compared to others, indicating that the quality of higher education development in these areas decreased.
Meanwhile, comparing the SD of the mean of QSHEQI between 2010 and 2023 for each administrative division in China (3.5304) and Malaysia (1.2662) revealed that even though both countries showed a pattern of decreasing SD QSHEQI, the degree of variability between them is decreasing. Regardless, compared to Malaysia, the variability of the development of HEIs in China and between the two countries is still relatively large.
The SD of QSHEDI and QSHEQI for the period 2010–2023 for each administrative region in China and Malaysia better reflects the difference in the trend and magnitude of changes in the index value between the administrative regions over time, as shown in Figure 3.
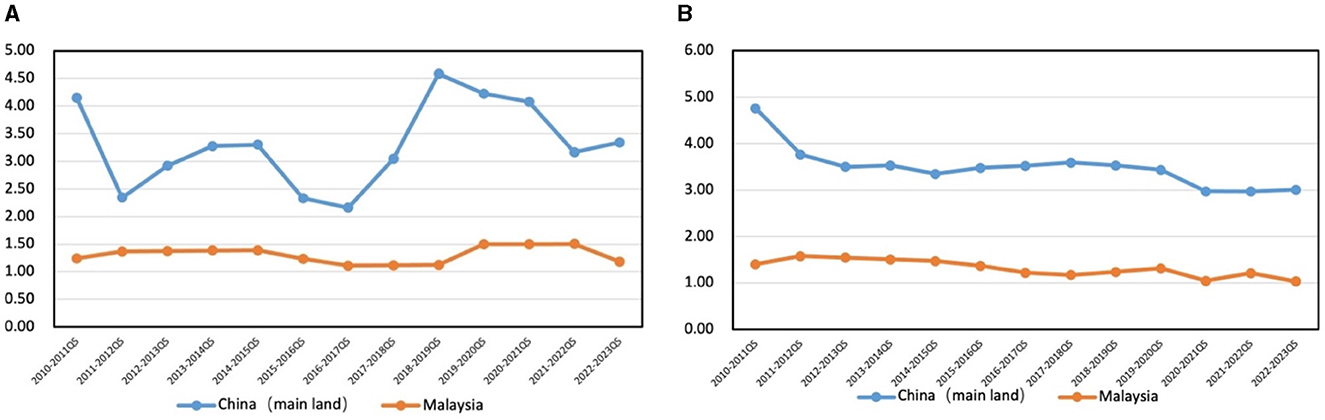
Figure 3. Line chart of 2010–2023 SD of QSHEDI between China and Malaysia. (A) 2010–2023 SD of QSHEDI; (B) 2010–2023 SD of QSHEQI.
A comparison of the QSHEDI values of different regions within the two countries reveals that China experienced greater fluctuations from 2010 to 2023 than Malaysia. In 2010–2011, the SD increased from 4.1542 to 2.1597 in 2015–2016, then from 4.5823 to 4.3437 between 2018 and 2019, and finally to 3.3437 in 2022–2023. This shows a large fluctuation, and the average SD for 2010–2023 is 3.3. Comparatively, there was less fluctuation in Malaysia during the same period—the SD of QSHEDI was 1.2410 in 2010–2011 and 1.1851 in 2022–2023, and the mean SD of QSHEDI for Malaysian states was 1.3107 for 2010–2023. It is evident that the QSHEDI of Chinese provinces, compared to Malaysian states, changed significantly in more than 10 years. The difference in the development of each province is also more prominent and faster, which has an essential relationship with the expansive growth of higher education in China in recent decades and the rapid development of HEIs in each of its provinces. Taking Beijing as an example, in 2010–2011, the QSHEDI was 13.5914, with only two HEIs on the QS list. In 2022–2023, this value increased to 15.4670, with as many as 17 HEIs on the QS list. At the same time, in Kuala Lumpur, the QSHEDI was 3.3892 in 2010–2011, with only one HEI on the list; in 2022–2023, the value was 2.8684, with 4 HEIs on the list. As can be seen, the development of higher education in China has been rapid in the past decade, and it has significantly increased the international recognition of Chinese HEIs. However, compared to Malaysia, the differences in the provincial distribution of HEIs with international influence and recognition are still more obvious and greater. For example, during the period 2010–2023, the number of QS-listed HEIs in Beijing increased from 2 to 17, while 12 provinces still failed to have even one HEI listed at the same time.
A comparison of the SD of QSHEQI for each administrative division within China and Malaysia shows a steady closing of the gap in QSHEQI between both countries. This suggests that the quality of higher education is becoming increasingly convergent across administrative divisions, with a tendency for differences to decrease. However, comparatively, it is still obvious that the SD of QSHEQI in China is significantly higher than that in Malaysia during the same period; yet, the downward trend is more evident in China, from 4.7664 in 2010–2011 to 3.0064 in 2022–2023, a decrease of 36.92% points. The SD of QSHEQI in Malaysia, on the other hand, declined by 26.42% from 1.4074 in 2010–2011 to 1.0355 in 2022–2023. While the SD of QSHEQI in China averaged 3.4955 between 2010 and 2023, that of Malaysia was 1.3184, showing a more pronounced difference. This indicates that the gap in HEI quality among provinces in China is decreasing. However, it should be noted that the gap still exists, and the relative difference is still apparent. For example, while Beijing's mean QSHEQI was 16.6480 for the period 2010–2023, Shanghai's was 11.0259, and Tianjin's was 5.2229—the rest of the provinces, meanwhile, were all below 1.5 with 12 provinces at 0 for more than 10 years. There is still a significant gap in Chinese higher education across provinces, which indicates that if China wishes to solve the problem of sustainable development in the future, that disparity must be addressed urgently.
4.4 Comparison of QSHEI distribution and its Correlation with GDP per capita in China
Analyzing the QSHEIs of various administrative divisions in China for 2010–2011 and 2022–2023 can help to better understand whether the regional distribution is more evident as a result of the concentrated geographical distribution of quality higher education resources and the change in comparative development during the period 2010–2023.
In Figure 4, only seven administrative divisions had a QSHEI greater than 0 in 2010–2011. As indicated by the comparison of QSHEI in 2010–2011 and 2022–2023, Beijing and Shanghai (in 2010–2011) are far ahead with their QSHEIs greater than 17, followed by Tianjin at 6.5163; the remaining four provinces range between 1 and 3. Then, in 2022–2023, there is a significant noticeable improvement in the distribution. Nineteen provinces have a QSHEI >1, compared to 7 in 2010—a 1.7-fold increase. The SD of QSHEI of 31 administrative divisions in China decreased from 4.4274 to 3.0479 in 2022–2023, suggesting that the difference in the comprehensive development of higher education resources among provinces is reducing after more than 10 years of development. However, when the two distribution maps are compared, it is clearly evident that even after more than a decade of development, the distribution of China's higher education resources is still concentrated in the coastal and eastern regions as a whole, especially in the regions represented by Beijing, Tianjin, and Shanghai, where the distribution of high-quality higher education resources is centralized relative to the population. Such a distribution trend is a challenge for a balanced and sustainable development of education equity and higher education resources in China relative to the population.
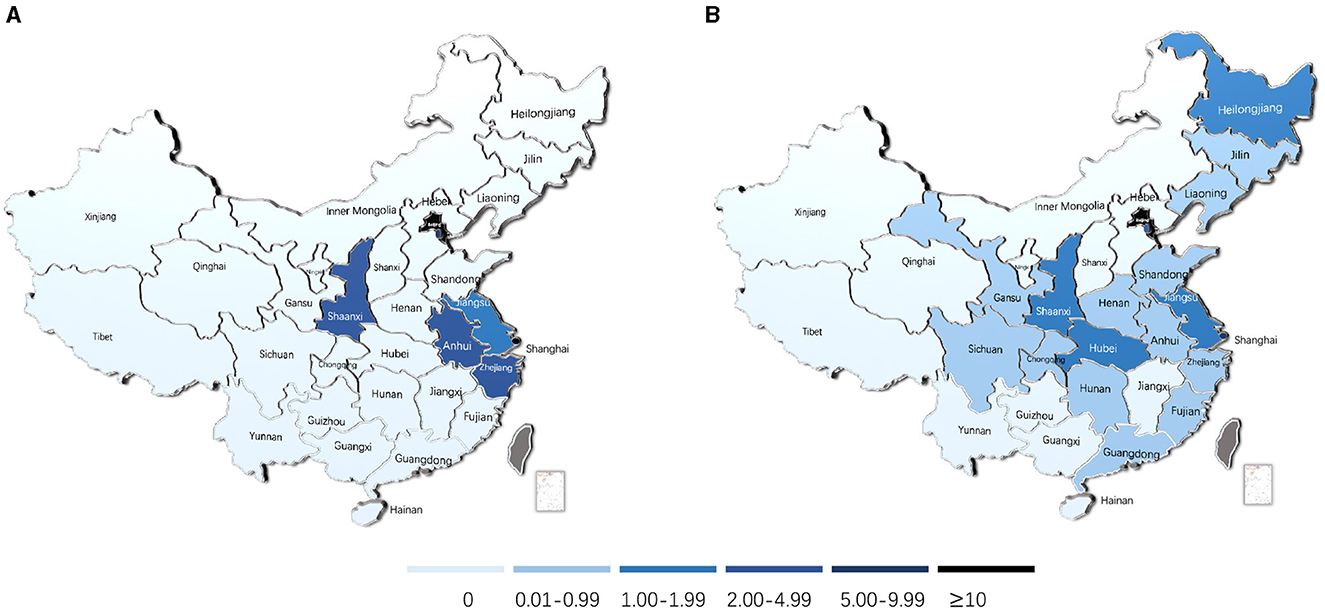
Figure 4. QSHEI geographical distribution in Mainland China. (A) 2010–2011 QSHEI; (B) 2022–2023 QSHEI.
Using the QSHEI formula, the annual values of 31 provinces in China can be obtained and averaged from 2010 to 2023. Viewing China from east to west, from the coast to the inland areas, it can be divided into North China, East China, Northeastern China, Central China, Southern China, Southwest China, and the Northwestern District. This helps to geographically categorize the provinces into zones. Zoning of provinces facilitates the easy identification of the regional differences in the development process of higher education at the national, regional, and provincial levels, in addition to linking the respective per capita GDP of each province for the period 2010–2023. To better understand the existence of regional differences in higher education development in China and to analyze the correlation between QSHEI during 2010–2023, the mean QSHEI for 2010–2023 was used for comparison, combined with the per capita GDP of each province for 2022–2023. This was undertaken to examine the correlation and difference between regions and provinces as well as the composite index of higher education in China, as shown in Table 3.
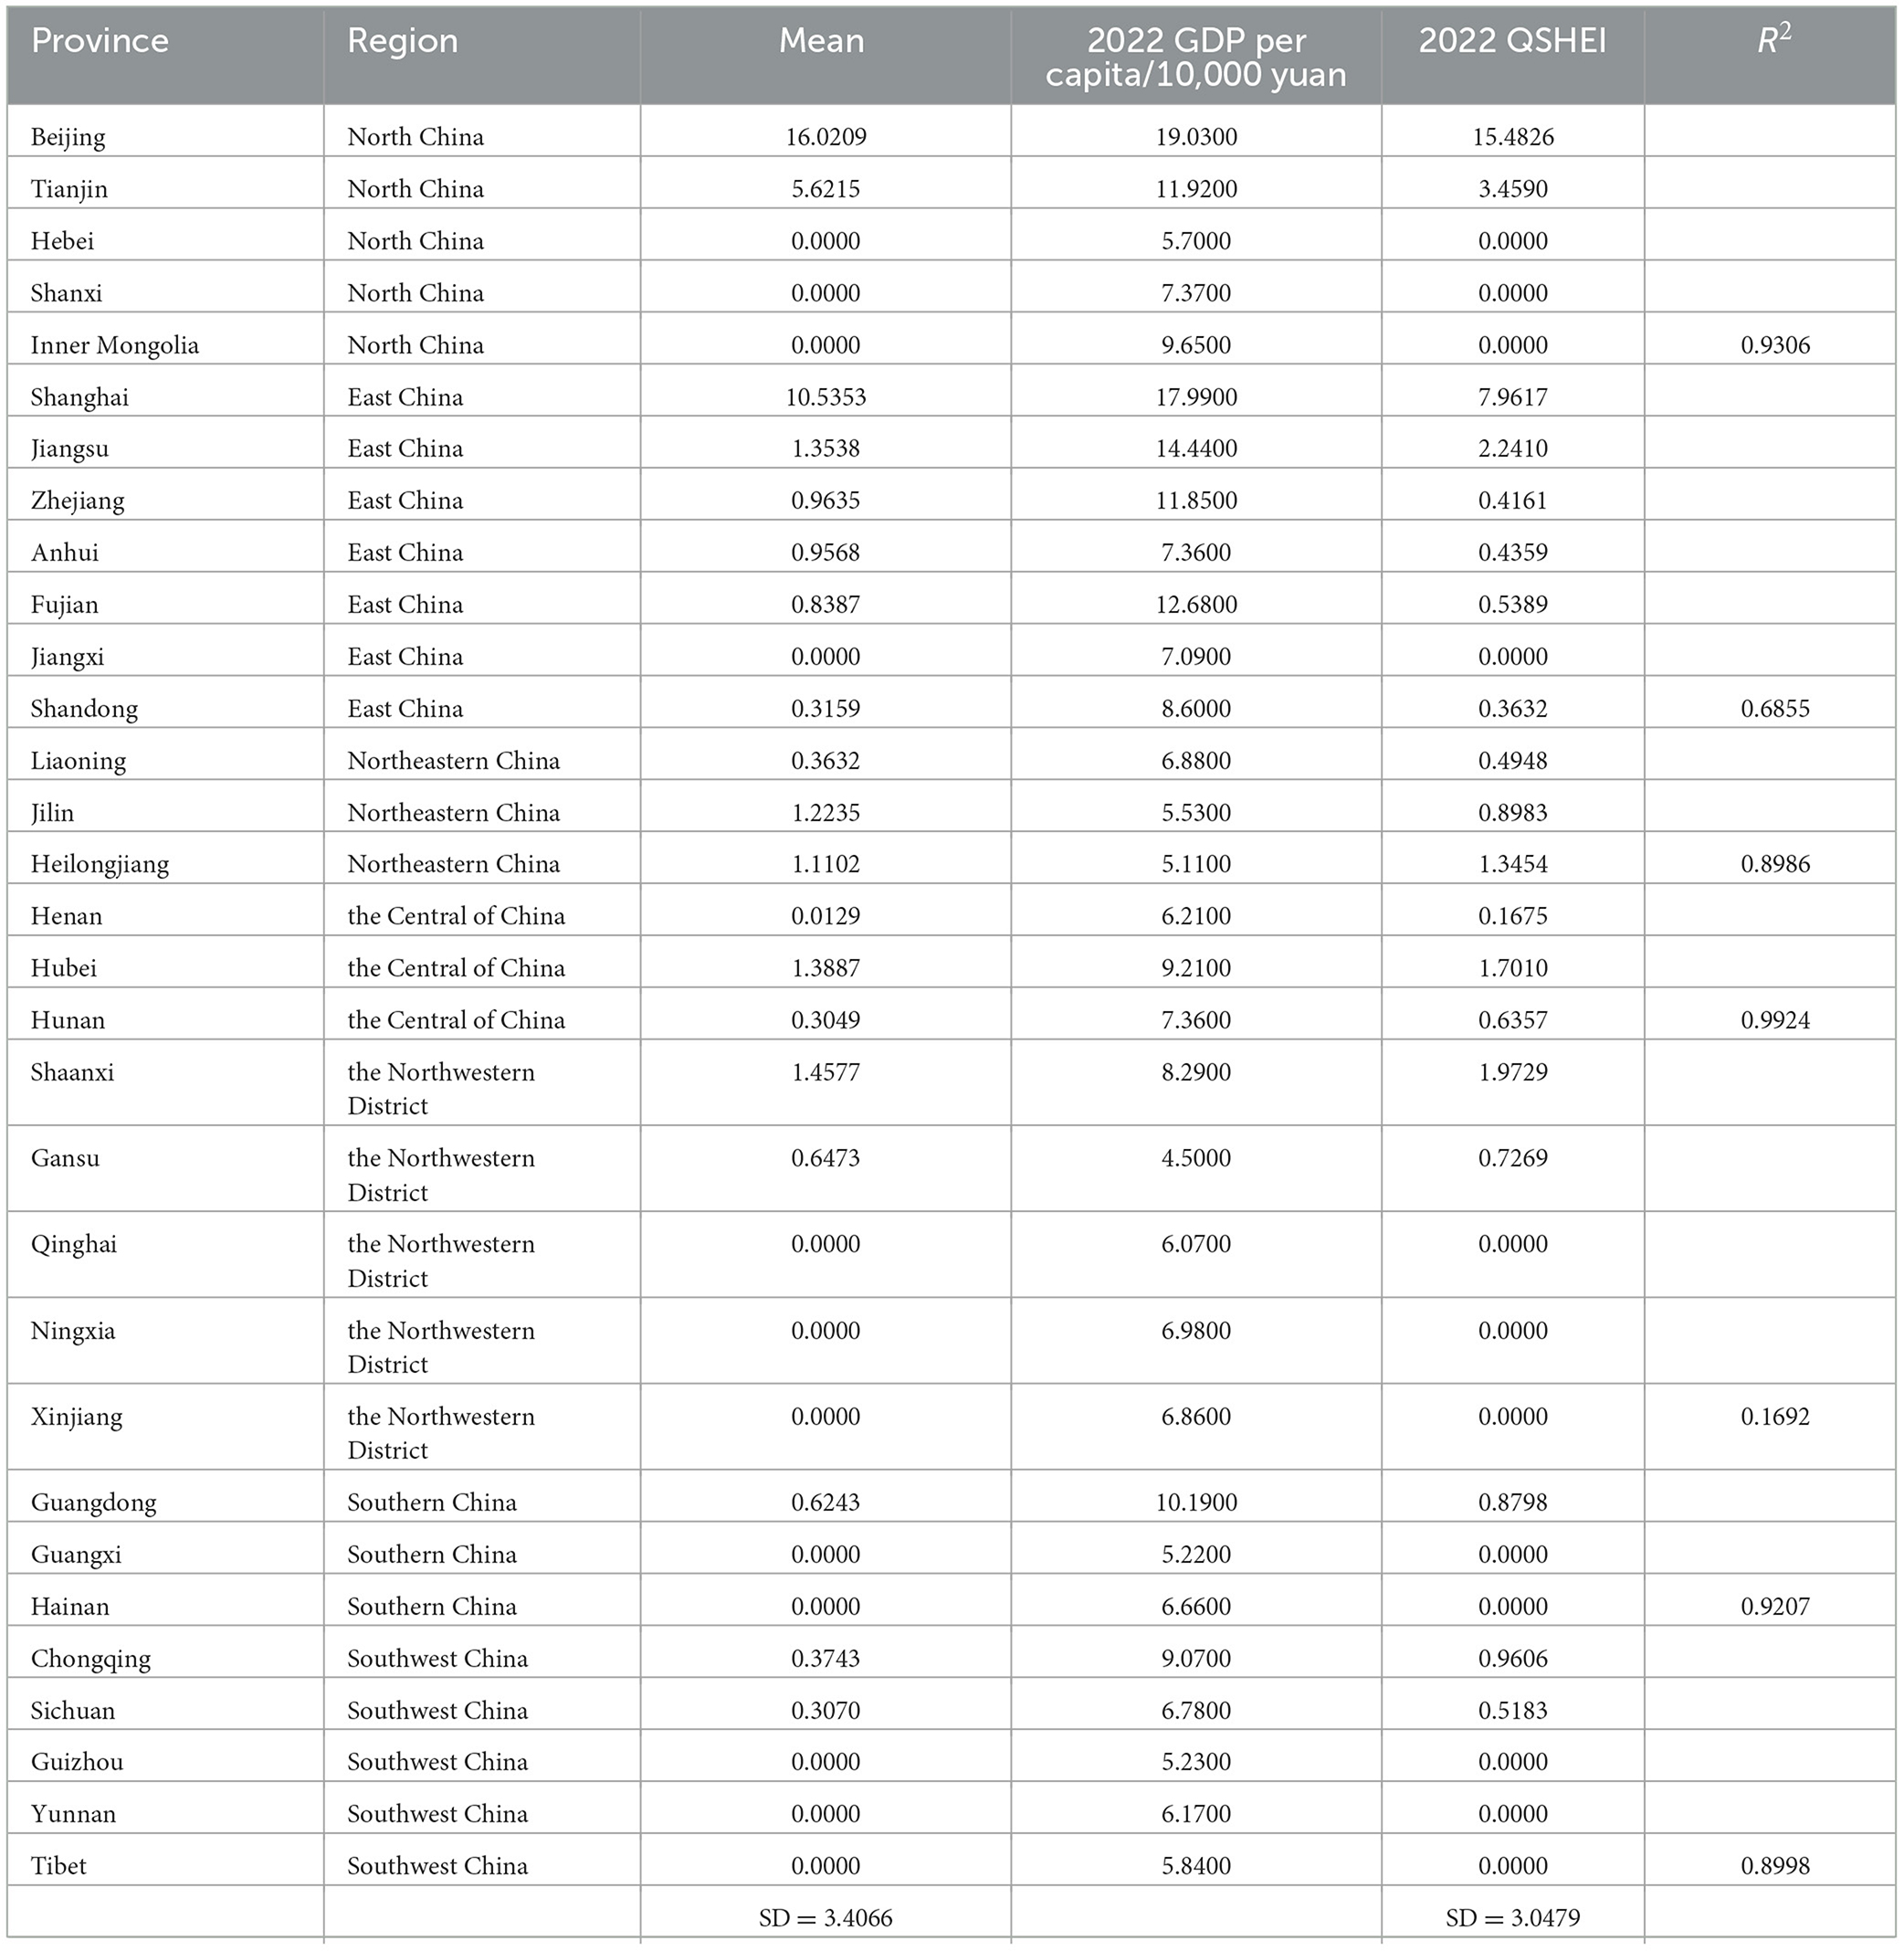
Table 3. Mean of QSHEI and Correlation between QSHEI and GDP per capita by region in 2022.
The mean of QSHEI for each administrative division in China for the period 2010–2023 is shown in Table 3. It is evident that the regional distribution is characterized by a more pronounced regional concentration, especially in the north, represented by Beijing and Tianjin, and in the east, represented by Shanghai, Jiangsu, and Zhejiang. The average values of QSHEI for 2010–2023 and 2022–2023 show that there is still a great deal of variability among provinces, especially relative to Beijing, the province with the richest and highest quality of higher education and the highest QSHEDI and QSHEQI. The differences among provinces are more pronounced in comparison.
The SD of the 2010–2023 mean of the composite index is 3.4066, reflecting a greater degree of variability among provinces and cities than the mean of QSHEI averaged across all provinces (1.4329). The SD in 2022 is 3.0479, representing a drop of 10.53% points from the SD of 3.4066 of the mean of QSHEI during 2010–2023. Compared with the SD of QSHEI in 2010–2011 (4.4274; Figure 4), the SD of QSHEI in 2022–2023 (3.0479) is lower by 31.16 percent points, indicating that there is a good trend of narrowing the gap between different administrative regions.
It is evident that in the sub-region, except for the Northwestern District, R2 is only 0.1692, and in East China, it is 0.6855. This can be established through the linear expression in Table 3 and Figure 5, which illustrates the linear correlation analysis of 2022 GDP per capita and QSHEI for the period 2022–2023. The QSHEI for the rest of the region is ~0.9, and it can be seen that GDP per capita, the economic factor relative to the population for higher education resource allocation and development, has an important influence. However, in the Northwestern District, R2 is only 0.1692, which shows that the correlation between the economy and higher education development significantly differs between different regions. According to the scatter distribution diagram of linear regression of correlation coefficient in 2022, Beijing obviously has the highest correlation coefficient, consistent with the regional correlation analysis.
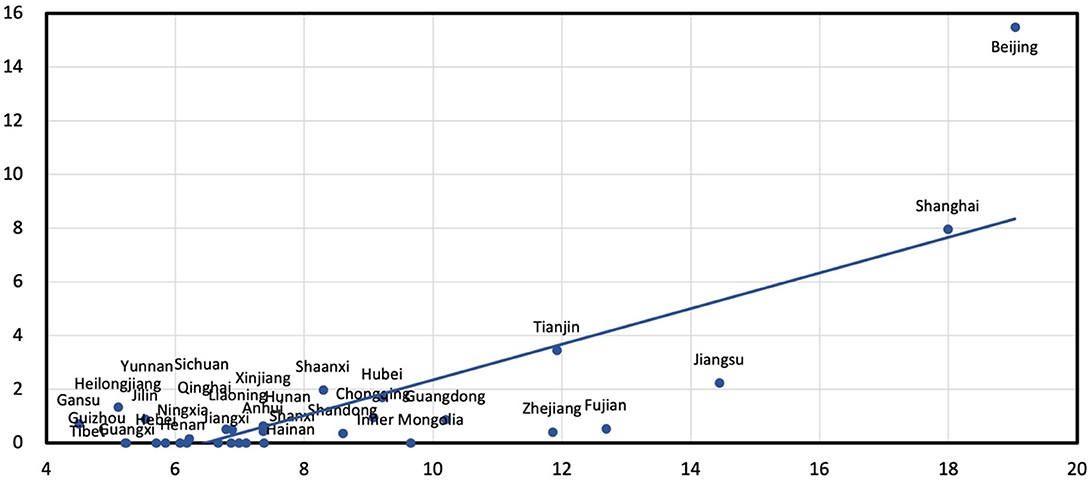
Figure 5. Scatterplot of linear correlation between QSHEI and GDP per capita of 31 provinces in Mainland China 2022.
The comprehensive national correlation coefficient R2 is 0.6162 in Figure 5, excluding the effects of extreme values and 12 QSHEI values of 0. The correlation coefficient, combined with East China and the Northwestern District, indicates that the allocation of higher education resources is not entirely determined by the economy, as Gansu has the lowest GDP per capita of RMB 45,000 among 31 provinces in 2022, but with the value of QSHEI as 0.7269, ranked 11 out of 31. On the other hand, Zhejiang was 6th with a per capita GDP of RMB 118,500 but 17th with a QSHEI of 0.4161. Attracting excellent talents and higher education resources, especially the relocation and construction of high-quality HEIs in relatively backward regions, is particularly important in pursuing a balanced development of higher education in China.
4.5 Analysis of QSHEI in Chinese provinces by regional distribution
Provincial QSHEI can be obtained based on the average of QSHEDI and QSHEQI, as illustrated by the regional distribution characteristics in Figure 6, which maps the distribution of QSHEI in North China, East China, Northeastern China, Central China, Southern China, Southwest China, and the Northwestern District.
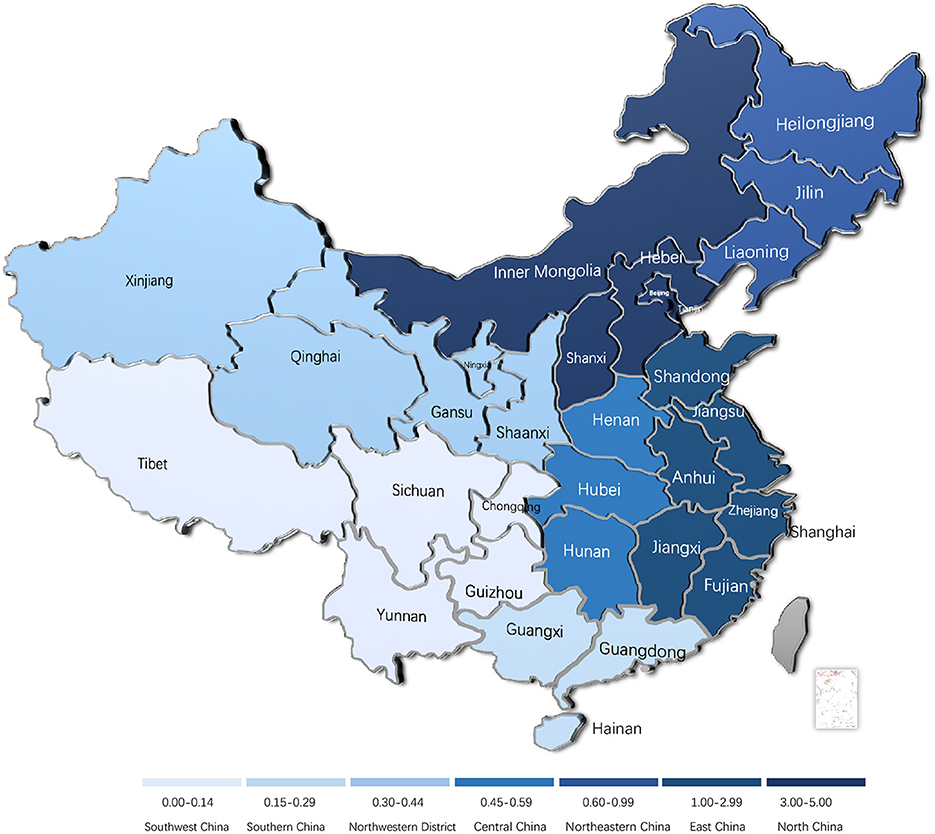
Figure 6. 2010–2023 Mean of QSHEI geographical distribution in Mainland China.
Figure 6 shows the distribution pattern of the average of the QSHEI obtained through the QSHEDI and QDHEQI for each province and city for 2010–2023. After sorting the averages, it is evident that the concentration of higher education resources in provinces and cities in China decreases from east to west, and the differences in the distribution are more evident. From the coast to the inland areas, especially in North China and East China, QSHEI leads the average of the whole country, indicating that the development of higher education in these two regions is far ahead of the rest of the provinces. It should be noted that Beijing and Tianjin are in North China, and Shanghai is in East China. The rest of the region's QSHEI is lower than 1, reflecting the radiation impact of higher education resources of some core cities on the neighboring regions. In 2022, the cumulative population of Central China, Southern China, and Southwest China was almost 45% or nearly half of the total population in China, with each of them having 15.82%, 13.30%, and 14.55% of the population, respectively (CNBS, 2023). However, the QSHEI of the three regions is not more than 0.6, which makes the matter worse; Southern China does not exceed 0.3, and Southwest China does not exceed 0.15. There is a large gap between the higher education resources in these two regions compared to the vast population base and the larger population share of China, as well as in the western and northern parts of the country, which is becoming an important factor restricting the distribution of higher education resources and the fairness and sustainability of higher education in China. As a result, the problem of learning from these gaps, compensating for the shortcomings, and enhancing the strengths in higher education in China is also viewed as one that needs to be addressed and solved.
4.6 Analysis of RQSHEI in Chinese Provinces
Beijing was set as 1 for a better internal comparative analysis of the higher education composite index in China. The other provinces were calculated based on Beijing's proportional calculation of the higher education composite index, as shown in Figure 7. These can be used to evaluate the differences between the various provinces in terms of higher education resource development from 2010 to 2023.
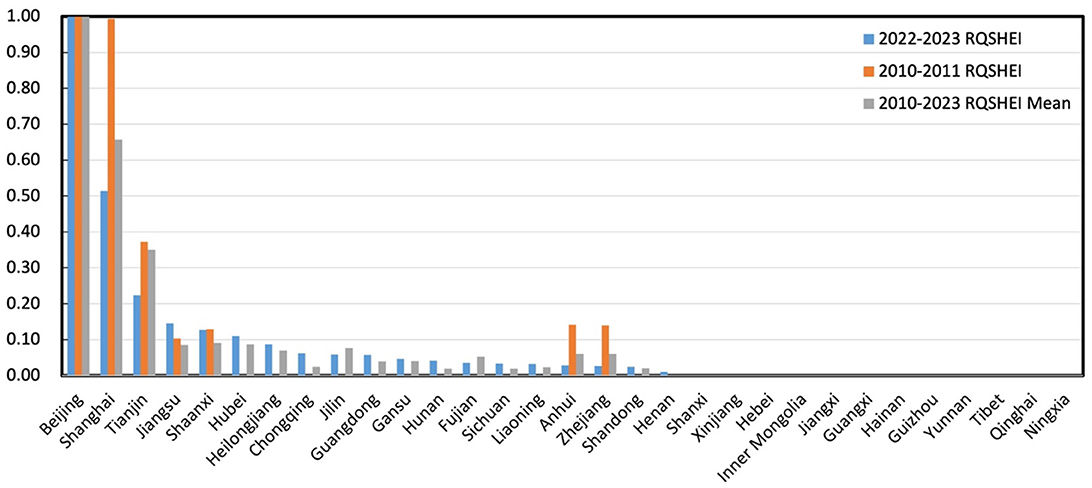
Figure 7. Column chart of 2010–2023 RQSHEI of 31 provinces in Mainland China.
As can be seen from Figure 7, based on the QS ranking, the RQSHEI for 2022–2023 is Beijing (1) and Shanghai (0.5142) as the first level, and the rest of the 0.1–0.5 in the second level, including Tianjin at 0.2234 and other four provinces. Compared to Shanghai, Beijing has a significant advantage—the remaining 13 provinces, which are below 0.1 but over 0, are at the third level. The fourth level of 0 is for the last 12 provinces. The gap is enormous. Compared to the average of RQSHEI between 2010 and 2023, in the first level, there are Beijing (1) and Shanghai (0.6576). In the second level, 0.1–0.5, there are Tianjin (0.3509) and three other provinces. There are 13 provinces at the third level with 0–0.1 and the last 12 provinces at the fourth level with an RQSHEI of 0.
There is a significant gap in the comprehensive development of the density and quality of higher education in the provinces of China from 2010 to 2023, as indicated by an SD of RQSHEI mean of 0.2126 from 2010 to 2023 and an SD of RQSHEI of 0.1969 in 2022–2023. The gap over time has narrowed, which is a good trend, but at the same time, the Chinese provinces with HEIs of international repute still have significant differences. Beijing has the highest level of higher education resources among Chinese administrative divisions. Shanghai was second only to Beijing in 2010–2011, with an RQSHEI of 0.9934 relative to Beijing and Tianjin, 0.3728. It is important to note, however, that for the same index in 2022–2023, Shanghai was 0.5142 and Tianjin, 0.2234; meanwhile 12 provinces were at 0, indicating that the gap between Beijing and other provinces is widening. These changes are also corroborated in the map illustrating the distribution of the composite index for the periods 2010–2011 and 2022–2023 (Figure 4).
5 Discussion and conclusion
Because the quantity and quality of HEIs are both important, this study used quantitative research methods and multiple calculation formulas to obtain the corresponding indices for the quantity and quality of higher education and made a more intuitive and detailed comparison between countries and between the different regions in China adopting indicators from multiple perspectives and regions over the years. Depending on future research conditions, a mix of quantitative and qualitative research methods could be attempted in a follow-up study to undertake innovative research in a small range of related fields. Comparing the QSHEDI and QSHEQI of the administrative divisions in China and Malaysia based on the QS World University Rankings revealed a significant difference in the development and distribution of higher education resources, especially based on the distribution of the population. It has become increasingly apparent that inequities get more pronounced when HEIs face the impact of ChatGPT and the corresponding availability of resources (Dempere et al., 2023). This suggests a significant disadvantage and constraint for the sustainable development of higher education in China compared to Malaysia. At the same time, within China, in North China, East China, Northeastern China, Central China, Southern China, Southwest China, and Northwestern District, the regional distribution of characteristics of significance shows a decreasing trend from the east to the west and from the coast to the inland. Yet, it also reveals that China's higher education opportunities reflect the geographic development imbalance and regional grouping characteristics. In particular, Beijing's political significance and exemplary role are indisputable. Nevertheless, Beijing, Shanghai, Tianjin, and other regions with high-quality higher education resources and continuous optimization, when compared to other populous provinces, reveal that the distribution of higher education resources in these populous provinces is relatively disadvantageous. This should not occur as it destroys educational fairness. The growing gap between the current skewed state of China's higher education resources distribution and the reasonable state of high-quality resource distribution should be considered in more detail.
For China to achieve greater fairness in the distribution of higher education resources and the allocation of quality resources, it is necessary to take into account the population distribution in each administrative region. For example, the representative population is more concentrated in Guangdong and Shandong provinces, as well as Henan Province; the population of these three provinces ranked in the top three provinces in China in 2022 (CNBS, 2023)—they have been the top three populous provinces over the years from 2010 to 2023. However, the value of RQSHEI in 2022–2023 of the three provinces is 0.0568, 0.0235, and 0.0108, respectively, even if not over 0.1. The average value of RQSHEI of these three provinces for the period 2010–2023 relative to Beijing is 0.0390, 0.0197, and 0.0008. Although the top three provinces have the largest populations in China, they ranked 13th, 16th, and 19th in the national average of higher education indexes. At the same time, Beijing, Shanghai, and Tianjin are ranked among the top three with the mean of RQSHEI for 2010–2023 at 1, 0.6576, and 0.3509, respectively; for 2022–2023, their RQSHEI was 1, 0.5142, and 0.2234 respectively. In contrast, they ranked 6th, 9th, and 5th from the bottom with regard to population size in China in 2022 (CNBS, 2023), which indicates a much smaller population. This shows that the distribution of higher education resources has a big gap relative to the population gap, and this gap persists. Therefore, for the sustainable development of higher education in China, the government should provide more energy, funds, and human resources to support the more populated areas, such as the western and central areas and the inland where higher education resources are relatively scarce, compared to the east and coastal regions. This will ensure a balanced distribution of educational resources among different regions as well as educational equity. Furthermore, as previously discussed, the government should formulate policies and hire talented individuals to encourage the relocation or construction of high-quality HEIs in areas with large populations but relatively limited higher education resources to ensure equitable distribution and balanced development of higher education resources within China (Lim et al., 2022).
During the same period of development as Malaysia (2010 to 2023), as a result of the visible disparity in the level of development of higher education resources between the two countries, the gap is widening. China's administrative divisions, as compared to Malaysia's, also present a more obvious imbalance. Compared to other continents and countries such as the UK, the US, Germany, Japan, South Korea, and Australia, China's higher education development level is weak (Pelzman, 2015). Therefore, China should address the domestic imbalance of HEI development and focus on shaping its influence in Asia and globally (Valero and Reenen, 2019). This is undoubtedly very important for the internationalization and sustainable development of Chinese higher education. As a result, the Chinese government and the education sector must recognize the importance of allocating higher education resources according to population density to address the issue of educational equity, regional labor supply, and high levels and quality of labor. Equally, the government must accelerate the development of higher education in China from an internal and external perspective to ensure the development of the domestic economy and society in a balanced and sustainable manner.
After analyzing the higher education density and quality index of China using the QS ranking and comparing it with Malaysia, other countries, and other regions during the same period, it is apparent that there are certain areas where Chinese higher education lags behind other countries (Caeiro et al., 2020). In this context, it is essential to emphasize the importance of reforming educational assessment methods (Fialho et al., 2023), as well as the reputation of HEIs and their significant impact on the promotion of high-quality higher education development (Amado Mateus and Juarez Acosta, 2022). Moreover, China should focus on the QS ranking scoring rules, in particular, emphasizing academic participation in international scientific research activities and publications of academic achievements with international influence to improve the number and ranking of Chinese HEIs in the QS ranking list. Ultimately, this can be used to bolster the global influence of Chinese higher education and attract international students from other countries to study in China, just as Malaysian HEIs attract many Chinese students because of their high QS rankings. Higher QS ranking, along with the publication of more influential scientific research results in international journals, can improve the international influence and rankings of HEIs, further attracting international students and forming a virtuous circle. Additionally, preparing for the sustainable development of higher education in China, providing an international perspective, accumulating strength, and offering intellectual and financial support are integral to developing higher education in China. Consequently, the international status of HEIs in China can be truly enhanced, leading to more frequent and favorable exchanges and the development of higher education along with other countries in the world. Such measures will lead to a more sustainable and benign development of higher education in China.
Data availability statement
The original contributions presented in the study are included in the article/Supplementary material, further inquiries can be directed to the corresponding author.
Author contributions
QW: Writing—original draft. MB: Writing—review & editing.
Funding
The author(s) declare that no financial support was received for the research, authorship, and/or publication of this article.
Conflict of interest
The authors declare that the research was conducted in the absence of any commercial or financial relationships that could be construed as a potential conflict of interest.
Publisher's note
All claims expressed in this article are solely those of the authors and do not necessarily represent those of their affiliated organizations, or those of the publisher, the editors and the reviewers. Any product that may be evaluated in this article, or claim that may be made by its manufacturer, is not guaranteed or endorsed by the publisher.
Supplementary material
The Supplementary Material for this article can be found online at: https://www.frontiersin.org/articles/10.3389/feduc.2024.1340637/full#supplementary-material
References
Amado Mateus, M., and Juarez Acosta, F. (2022). Reputation in higher education: a systematic review. Front. Educ. 7:925117. doi: 10.3389/feduc.2022.925117
Benos, N., and Zotou, S. (2014). Education and economic growth: a meta-regression analysis. World Dev. 64(C), 669–689. doi: 10.1016/j.worlddev.2014.06.034
Borsi, M. T., Mendoza, O. M. V., and Comim, F. (2022). Measuring the provincial supply of higher education institutions in China. China Econ. Rev. 71:101724. doi: 10.1016/j.chieco.2021.101724
Bulut-Sahin, B., and Kondakci, Y. (2023). Conflicting perspectives on the internationalization of higher education: evidence from the Turkish case. J. Stud. Int. Educ. 27, 834–852. doi: 10.1177/10283153221126245
Caeiro, S., Sandoval Hamón, L. A., Martins, R., and Bayas Aldaz, C. E. (2020). Sustainability assessment and benchmarking in higher education institutions—a critical reflection. Sustainability 12:543. doi: 10.3390/su12020543
CEIdata (2023). GDP per capita in the world and by province in mainland China in 2022. Available online at: https://wap.ceidata.cei.cn (accessed May 12, 2023).
Chen, A. W., Chen, J., and Dondeti, V. R. (2020). The US-China trade war: Dominance of trade or technology? Appl. Econ. Lett. 27, 904–909. doi: 10.1080/13504851.2019.1646860
China People's Daily Online (2022). QS World University Rankings Released. Available online at: https://weibo.com/2286908003/Lnlphrshd (accessed April 7, 2022).
Chyrva, A., Krekoten, O., and Bilokopytov, V. (2023). Higher education internationalization. development of the concept responding to requirements of the time. Rev. Romaneasca Pentru Educ. Multidimensionala 15, 176–190. doi: 10.18662/rrem/15.1/692
CNBS (2023). Population by province in mainland China 2010–2022. Available online at: http://www.stats.gov.cn (accessed February 22, 2023).
de Wit, H. (2024). “Internationalization in and of higher education: critical reflections on its conceptual evolution,” in Internationalization in Higher Education and Research: Perspectives, Obstacles, Alternatives, ed. L. Engwall (Cham: Springer International Publishing), 17–31. doi: 10.1007/978-3-031-47335-7_2
de Wit, H., and Deca, L. (2020). “Internationalization of higher education, challenges and opportunities for the next decade,” in European Higher Education Area: Challenges for a New Decade, eds A. Curaj, L. Deca, and R. Pricopie (Cham: Springer), 3–11. doi: 10.1007/978-3-030-56316-5_1
Dempere, J., Modugu, K. P., Hesham, A., and Ramasamy, L. (2023). The impact of ChatGPT on higher education. Front. Educ. 8:1206936. doi: 10.3389/feduc.2023.1206936 Department of Statistics Malaysia (DOSM) (2023). Population by State in Malaysia 2010–2022. Available online at: http://www.statistics.gov.my (accessed April 24, 2023).
Education Malaysia Global Services (EMGS) (2022). Application Received from 1st April–30th June 2022. Available online at: https://educationmalaysia.gov.my/statisticsapplications-received-from-1st-april-2022-30th-june-2022-quarter-2 (Accessed July 25, 2022).
Fialho, I., Cid, M., and Coppi, M. (2023). Grounding and improving assessment in higher education: a way of promoting quality education. Front. Educ. 8:1143356. doi: 10.3389/feduc.2023.1143356
Fraumeni, B. M., He, J., Li, H., and Liu, Q. (2019). Regional distribution and dynamics of human capital in China 1985-2014. J. Comp. Econ. 47, 853–866. doi: 10.1016/j.jce.2019.06.003
Fu, X., Woo, W. T., and Hou, J. (2016). Technological innovation policy in China: the lessons, and the necessary changes ahead. Econ. Change Restructuring 49, 139–157. doi: 10.1007/s10644-016-9186-x
George Mwangi, C. A., and Yao, C. W. (2020). “US higher education internationalization through an equity-driven lens: an analysis of concepts, history, and research,” in Higher Education: Handbook of Theory and Research: Volume 36, ed. L. W. Perna v(Cham: Springer), 1–62. doi: 10.1007/978-3-030-43030-6_11-1
Hamidifar, F., Yusoff, K., and Ebrahimi, M. (2023). Leadership and management in the internationalization of higher education. Q. J. Res. Plan. Higher. Educ. 23, 49–71.
Khor, N., Pang, L., Liu, C., Chang, F., Mo, D., Loyalka, P., et al. (2016). China's looming human capital crisis: upper secondary educational attainment rates and the middle-income trap. China Q. 228, 905–926. doi: 10.1017/S0305741016001119
Knight, J., Deng, Q., and Li, S. (2017). China's expansion of higher education: the labour market consequences of a supply shock. China Econ. Rev. 43(C), 127–141. doi: 10.1016/j.chieco.2017.01.008
Kosack, S., and Tobin, J. L. (2015). Which countries' citizens are better off with trade? World Dev. 76, 95–113. doi: 10.1016/j.worlddev.2015.05.021
Kuzmina, K., and Lofthouse, V. (2023). Sustainable design education in higher education and implementation. Sustainability 15:5002. doi: 10.3390/su15065002
Li, H., Loyalka, P., Rozelle, S., and Wu, B. (2017). Human capital and China's future growth. J. Econ. Perspect. 31, 25–48. doi: 10.1257/jep.31.1.25
Li, S., Whalley, J., and Xing, C. (2014). China's higher education expansion and unemployment of college graduates. China Econ. Rev. 30(C), 567–582. doi: 10.1016/j.chieco.2013.08.002
Lim, C. K., Haufiku, M. S., Tan, K. L., Farid Ahmed, M., and Ng, T. F. (2022). Systematic review of education sustainable development in higher education institutions. Sustainability 14:13241. doi: 10.3390/su142013241
Liu, X., Serger, S. S., Tagscherer, U., and Chang, A. Y. (2017). Beyond catch-up–can a new innovation policy help China overcome the middle income trap? Sci. Public Policy 44, 656–669. doi: 10.1093/scipol/scw092
McKinney, J. (2018). How stalled global reform is fueling regionalism: China's engagement with the G20. Third World Q. 39, 709–726. doi: 10.1080/01436597.2017.1374838
Mendoza, V., Miguel, O., Borsi, M. T., and Comim, F. (2021). Indices of the supply of Chinese Higher Education [Dataset]. Zenodo. doi: 10.5281/zenodo.5753099
Ministry of Education (2020a). 2000–2020 List of National Colleges and Universities. Technical report. Beijing: Ministry of Education of the People's Republic of China.
Ministry of Education (2020b). Chronicle of Education Reform to Celebrate the 40th Anniversary of Reform and Opening-up. Technical report. Beijing: Ministry of Education of the People's Republic of China.
Ministry of Education (2021a). Explanation of Issues Related to the Transfer of Independent Colleges. Technical report. Beijing: Ministry of Education of the People's Republic of China.
Ministry of Education (2021b). Number of Students of Formal Education by Type and Level. Technical report. Beijing: Ministry of Education of the People's Republic of China.
Pelzman, J. (2015). PRC outward investment in the USA and Europe: a model of R&D acquisition. Rev. Dev. Econ. 19, 1–14. doi: 10.1111/rode.12129
Quacquarelli Symonds (2023). QS World University Rankings 2010–2023. Available online at: https://www.topuniversities.com/university-rankings/world-university-rankings (accessed June 27, 2023).
Sekhri, S. (2020). Prestige matters: wage premium and value addition in elite colleges. Am. Econ. J. Appl. Econ. 12, 207–225. doi: 10.1257/app.20140105
Shambaugh, D. (2018). Contemplating China's future. J. Chin. Polit. Sci. 23, 1–7. doi: 10.1007/s11366-017-9491-x
Shanghai Municipal Human Resources and Social Security Bureau (2020). Notice on the Issuance of the Detailed Rules for the Implementation of Shanghai Permanent Residents for Returnees. Available online at: https://rsj.sh.gov.cn/trsrc_17730/20201130/t0035_1396472.html (accessed November 13, 2020).
Sharma, K. A. (2023). “Quality, global ranking, and the rise of China,” in India and China: Expansion, Equity and Excellenc, ed. K. A. Sharma (Singapore: Springer Nature Singapore), 189–208. doi: 10.1007/978-981-99-5628-9_8
United Nations (2022). World Population Prospects 2022. Available online at: https://www.un.org/development/desa/pd/ content/World-Population-Prospects-2022 (accessed November 15, 2022).
Valerio Mendoza, O. M. V. (2018). Heterogeneous determinants of educational achievement and inequality across urban China. China Econ. Rev. 51, 129–148. doi: 10.1016/j.chieco.2017.11.006
Valerio Mendoza, O. M. V., Borsi, M. T., and Comim, F. (2022). Human capital dynamics in China: evidence from a club convergence approach. J. Asian Econ. 79:101441. doi: 10.1016/j.asieco.2022.101441
Valero, A., and Reenen, J. V. (2019). The economic impact of universities: evidence from across the globe. Econ. Educ. Rev. 68, 53–67. doi: 10.1016/j.econedurev.2018.09.001
Wang, L., Li, M., Abbey, C., and Rozelle, S. (2018). Human capital and the middle income trap: how many of China's youth are going to high school? Dev. Econ. 56, 82–103. doi: 10.1111/deve.12165
Wei, Y., and Johnstone, C. (2020). Examining the race for world-class universities in China: a culture script analysis. Higher Educ. 79, 553–567. doi: 10.1007/s10734-019-00423-2
World Bank (2023). World Development Indicators 2022. The World Bank. Available online at: https://databank.worldbank.org/source/world-development-indicators (accessed June 30, 2023).
Wu, H., and Li, M. (2021). Three phases of de facto quasi-decentralization of higher education in China since 1949. Higher Educ. Policy 34, 685–705. doi: 10.1057/s41307-019-00159-9
Wu, L., Yan, K., and Zhang, Y. (2020). Higher education expansion and inequality in educational opportunities in China. Higher Educ. 80, 549–570. doi: 10.1007/s10734-020-00498-2
Wu, W., and Zhu, J. (2020). Are there demonstration effects of fiscal expenditures on higher education in China? An empirical investigation. Int. J. Educ. Dev. 81(C):102345. doi: 10.1016/j.ijedudev.2020.102345
Xiang, L., Stillwell, J., Burns, L., and Heppenstall, A. (2020). Measuring and assessing regional education inequalities in China under changing policy regimes. Appl. Spat. Anal. Policy 13, 91–112. doi: 10.1007/s12061-019-09293-8
Xie, M., Ding, L., Xia, Y., Guo, J., Pan, J., Wang, H., et al. (2021). Does artificial intelligence affect the pattern of skill demand? Evidence from Chinese manufacturing firms. Econ. Model. 96, 295–309. doi: 10.1016/j.econmod.2021.01.009
Zeng, J., and Fang, Y. (2014). Between poverty and prosperity: China's dependent development and the ‘middle-income trap'. Third World Q. 35, 1014–1031. doi: 10.1080/01436597.2014.907725
Zhang, G., Wu, J., and Zhu, Q. (2020). Performance evaluation and enrollment quota allocation for higher education institutions in China. Eval. Program Plann. 81(C):101821. doi: 10.1016/j.evalprogplan.2020.101821
Zhang, X., Li, H., Wang, X., and Fleisher, B. M. (2019). Human capital and the economic convergence mechanism: Evidence from China. Available at SSRN 3349842. doi: 10.2139/ssrn.3349842
Keywords: higher education, sustainable development, indices, rankings, China, Malaysia
Citation: Wu Q and Borhan MT (2024) Sustainable development of Chinese higher education through comparison of higher education indices. Front. Educ. 9:1340637. doi: 10.3389/feduc.2024.1340637
Received: 06 December 2023; Accepted: 04 April 2024;
Published: 30 April 2024.
Edited by:
Airil Haimi Mohd Adnan, MARA University of Technology, MalaysiaReviewed by:
Dianna Suzieanna Mohamad Shah, MARA University of Technology, MalaysiaAmeiruel Azwan Ab Aziz, Universiti Teknologi MARA Cawangan Melaka, Malaysia
Copyright © 2024 Wu and Borhan. This is an open-access article distributed under the terms of the Creative Commons Attribution License (CC BY). The use, distribution or reproduction in other forums is permitted, provided the original author(s) and the copyright owner(s) are credited and that the original publication in this journal is cited, in accordance with accepted academic practice. No use, distribution or reproduction is permitted which does not comply with these terms.
*Correspondence: Qiong Wu, MTAwMjE2NDI4OEB1Y3NpdW5pdmVyc2l0eS5lZHUubXk=